Embed Size (px)
Citation preview
29
Agrosearch (2015) 15 No. 1 29 - 45
GROWTH ANALYSIS OF WHEAT (TriticumaestivumL.) AS INFLUENCED BY WATER STRESS AND VARIETY IN SOKOTO, SUDAN SAVANNAH, NIGERIA.
1 2 Sokoto M.B. and Abubakar I. U. 1Department of Crop Science, Faculty of Agriculture, UsmanuDanfodiyo University, Sokoto.
2 Department of Plant Science, Irrigation Research Programme, IAR/ABU, Zaria.Corresponding author: [email protected]
ABSTRACT The study was carried out to determine the effect of water stress and variety on growth of wheat (TriticumaestivumL.), during2009/10and 2010/11dry seasons. The treatments consisted of factorial combination of water stress at three critical growth stage which was imposed by withholding water at tillering, flowering, grain filling and control (no control) and two varieties (Star 11 TR 77173/SLM and Kauze/Weaver) laid out in a split plot design with three replications. Water stress was assigned to the main-plot, while variety was assigned to the sub-plots. Result revealed significant (P<0.05) effect of water stress, attilleringreduced plant height, LAI, CGR, and NAR. Variety had significant (P<0.05) effect on plant height, LAI, CGR and NAR. Water stress at tillering was observed to be most critical growth stage in wheat, and water stress at this period should be avoided because it results to decrease in growth components in wheat. Wheat should be sown in November or at least first week of December in this area and other area with similar climatic conditions. Star II TR 77173/ LM is recommended variety for the area.
Key words: Wheat, growth, Water stress, Variety, Sudan savannah
INTRODUCTION
Wheat (TriticumaestivumL.) is one of the important cereal staple food crops of the world (Akbaret al.,
2001). Wheat ranks first in area and production and contributes more calories and proteins to the
world's human diet than any other cereal(Bilgi, 2006).Water constitutes over 90% of plants total
mass and has important function inphotosynthesis, transpiration and turgor pressure.Water stress
in plants results in reduced growth, vigor, nutrient deficiencies, it also affect health of roots, cooling
of canopy and early fall color (Colorado Master Gardener (CMG, 2010).Lihenget al.(2009), reported
drought can inhibit plant growth and development, Drought stress limits crop production worldwide
and causes important agricultural losses particularly in arid and semi-arid areas (Boyer,
1982).Water availability mostly affects growth of leaves and roots, photosynthesis and dry mater
accumulation (Blum, 1996). In Sorghum Fagbemi (1996) reported that end of tillering is the most
http://dx.doi.org/10.4314/agrosh.v15i1.2
30
Agrosearch (2015) 15 No. 1
critical stage affected by water stress in Sorghum, the author further observed that changes that
occur at different stages of Sorghum determine the quality and quantity of final yield.Siddiqeet al.
(2000)Reported that developing of drought tolerant varieties is the best option for crop production.
Wheat production has been shown to be limited by a number of factors such as moisture
stress (Wajid, 2004) and variety (Sellaries, 1975).Muhammad and Eltayeb (1991) observed that
higher productivity of wheat in United State was due to favorable environmental conditions which
include temperature and moisture. The objective of the research was todetermine the effect of
water stress on growth of twowheat varieties.
MATERIALS AND METHODS
Location
The researchwas conducted during 2009/10 and 2010/11 dry seasons at the Fadama 0
Teaching and Research Farm, UsmanuDanfodiyo University, Sokoto, (Latitude 13 01'N. longitude 0
15 13E). The farm is located within the Sudan Savanna Zone of Nigeria (Kowal and Knabe, 1972).
The relative humidity is between 14-28% and 70-75% during dry and rainy seasons, respectively.
The area has a long dry season that is characterized by cool dry air during harmattan from
November to February and hot dry air during hot season from March to May. Relative humidity 0
ranges from 26-39 % in the dry season. Maximumtemperature ranges from 30 to 40 C and 0
Minimum temperature of 18 to 29 C, wind speed ranges between 1.9 to 5M/S [(Sokoto Energy
Resource Center) (SERC, 2011).The area was previously used for the cultivation of onions,
peppers, tomatoes, corn and sweet potato.
Prior to planting, soil samples werecollectedsoil samples (0 - 15cm) were collected from the
site for physic-chemical analysis (Ogunwaleet al., 2006). The treatments consisted of factorial
combinations of water stress which was imposed by withholding water at (tillering, flowering, grain
filling) and control (no control) and two varieties (Star 11 TR 77173/SLM and Kauz/Weaver). The
experiment was laid out in a split plot design with three replications. Water stress was allocated the
main plot, while variety was assigned to the sub plots. 2
The land was cleared, ploughed, harrowed, leveled, Gross plot size was 3m x 3m (9m ) 2
while the net plot was (4.5m ). The seeds were sown with Apron star 42 WS (20% w/w thiamethoxam,
20% w/w metalaxyl-M and 2 % w/w difenoconazole) at the rate of 10 g/ 4 kg of seed before sowing.
The seeds were sown by drilling at 20 cm intra row spacing at 2-3 cm depth and at the rate of
120 kg/ha.After sowing, the field was irrigated four times for proper establishment of the seedlings.
The first was given immediately after sowing, while subsequent irrigation was given at 5 days interval
(Lado, 2004). Weeds were controlled by hand weeding at 3 and 6 WAS to ensure weed free plots. -1
Fertilizer was broadcast at the recommended rate of 120, 60 and 60 kg N, P O and K O per ha 2 5 2
respectively. Half of nitrogen and full dose of phosphorous and potassium was worked in to the soil -1
during seedbed preparation using NPK 15: 15: 15: while, the second dose of 60 kg N ha was applied
prior to tillering using Urea (46% N) as source of nitrogen. Birds were controlled by scaring while
rodents were controlled by using baits and traps. No Diseases out break was recorded.
Data was collected in respect of plant height, leaf area index (Arunah and Ibrahim 2004), net
assimilation rate and crop growth rate.
Plant height
A random sample of 10 plants was and tagged from the 30cm tagged area and average
recorded. The length of each of the sampled plant was measured form the ground level to the top of
the panicle, using a meter rule.
Leaf area index (LAI)
Leaf area index (LAI) is the ratio of total leaf area to land area. The mean leaf area of ten
tagged plants was measured by multiplying the mean leaf size (L*W) by a reduction coefficient of
0.87 for wheat (Owen, 1968 and Ledent, 1976). The LAI was determined by dividing the mean leaf
area by land area occupied by the plants. LAI measurement was taken at 3, 6, 9 and 12 WAS.
area
area
Land
LeafLAI ?
Crop growth rate (CGR)
This is the measure of the rate of dry matter production per unit time per unit area. Samples
were taken in the gross plots to determine the CGR. The sampled plant material was oven- dried at o
70 C to a constant weight. CGR was calculated using the following formula as adopted by Watson
(1952).
31
Sokoto & Abubakar
CGR =
)( 12
12
TTSA
WW
-
--2 -1
g m Week
W = weight at first sampling, W = weight at second sampling, T time of first sampling in weeks1 2 1 =
T time of second sampling in weeks, SA = soil area occupied by the plants at each sampling2=
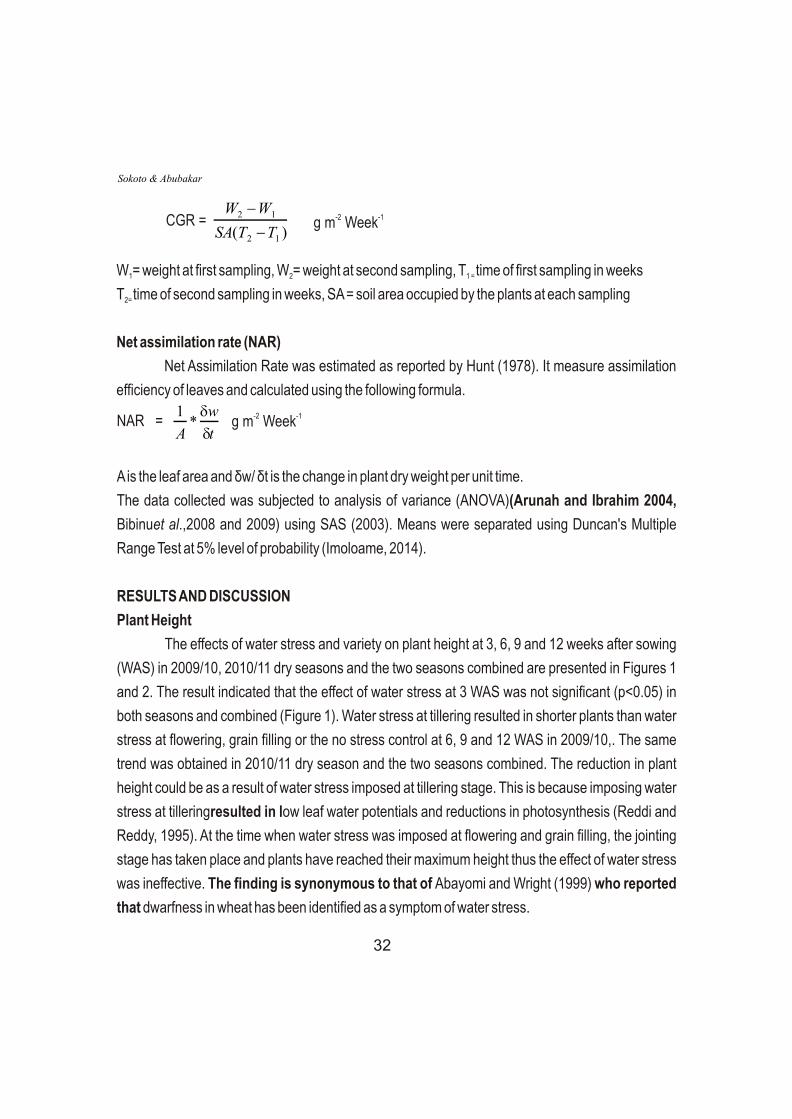
Net assimilation rate (NAR)
Net Assimilation Rate was estimated as reported by Hunt (1978). It measure assimilation
efficiency of leaves and calculated using the following formula.
NAR =
t
w
A d
d*
1 -2 -1g m Week
A is the leaf area and äw/ ät is the change in plant dry weight per unit time.
The data collected was subjected to analysis of variance (ANOVA)(Arunah and Ibrahim 2004,
Bibinuet al.,2008 and 2009) using SAS (2003). Means were separated using Duncan's Multiple
Range Test at 5% level of probability (Imoloame, 2014).
RESULTS AND DISCUSSION
Plant Height
The effects of water stress and variety on plant height at 3, 6, 9 and 12 weeks after sowing
(WAS) in 2009/10, 2010/11 dry seasons and the two seasons combined are presented in Figures 1
and 2. The result indicated that the effect of water stress at 3 WAS was not significant (p<0.05) in
both seasons and combined (Figure 1). Water stress at tillering resulted in shorter plants than water
stress at flowering, grain filling or the no stress control at 6, 9 and 12 WAS in 2009/10,. The same
trend was obtained in 2010/11 dry season and the two seasons combined. The reduction in plant
height could be as a result of water stress imposed at tillering stage. This is because imposing water
stress at tilleringresulted in low leaf water potentials and reductions in photosynthesis (Reddi and
Reddy, 1995). At the time when water stress was imposed at flowering and grain filling, the jointing
stage has taken place and plants have reached their maximum height thus the effect of water stress
was ineffective. The finding is synonymous to that of Abayomi and Wright (1999) who reported
that dwarfness in wheat has been identified as a symptom of water stress.
32
Sokoto & Abubakar
The result on the varietal differences at 3 WAS in 2009/10, 2010/11 dry seasons and the two
seasons combined and at 6 WAS in both seasons the two varieties did not differ in height. In the two
seasons combined at 6, 9 and 12 WAS, Star II TR 77173/SLM was taller than Kauz/Weaver (Figure
2). The significant differences among genotypes for plant height (Figure2) indicate appreciable
amount of variability among the genotypes, this is similar to the finding of Lad et al. (2002) who
reported significant effect of variety on wheat growth. Bibinuet al.(2008 and 2009) reported
significant variation among Sorghum genotype.
Leaf Area Index (LAI)
The effects of water stress and variety on LAI at 3, 6, 9 and 12 WAS in 2009/10, 2010/11 dry
seasons and two seasons combinedis presented in Figures 3 and 4. The result indicated that the
effect of water stress at 3 WAS was not significant in both seasons and combined (Figure 3). At 6
WAS in both seasons and 9 and 12 WAS in 2009/10 dry season, water stress imposed at tillering
resulted in lower LAI than water stress imposed at flowering, grain filling or the no stress control
which had statistically (p<0.05) similar LAI. At 9 and 12 WAS in 2010/11 dry season and the
combined water stress had no effect on LAI but control differed significantly (p<0.05) with higher
CGR. Leaf Area Index increased progressively until 9 WAS and thereafter decreased at 12 WAS in
wheat cultivars. Abubakar (1999)had earlier observed similar decrease of LAI among wheat
cultivars after anthesisthis is an indication cessation of growth. On varietal differences the result
indicated that the two varieties had statistically (p<0.05) similar LAI at 3 WAS in 2009/10, 2010/11
dry seasons and the two seasons combined. At 6, 9 and 12 WAS in thetwo dry seasons and the two
seasons combined, Star II TR 77173/SLM differed significantly (p<0.05)with higher LAI than
Kauz/Weaver (Figure 4). The difference in terms of LAI between the two varieties could be as a
result genotype.
33
Sokoto & Abubakar
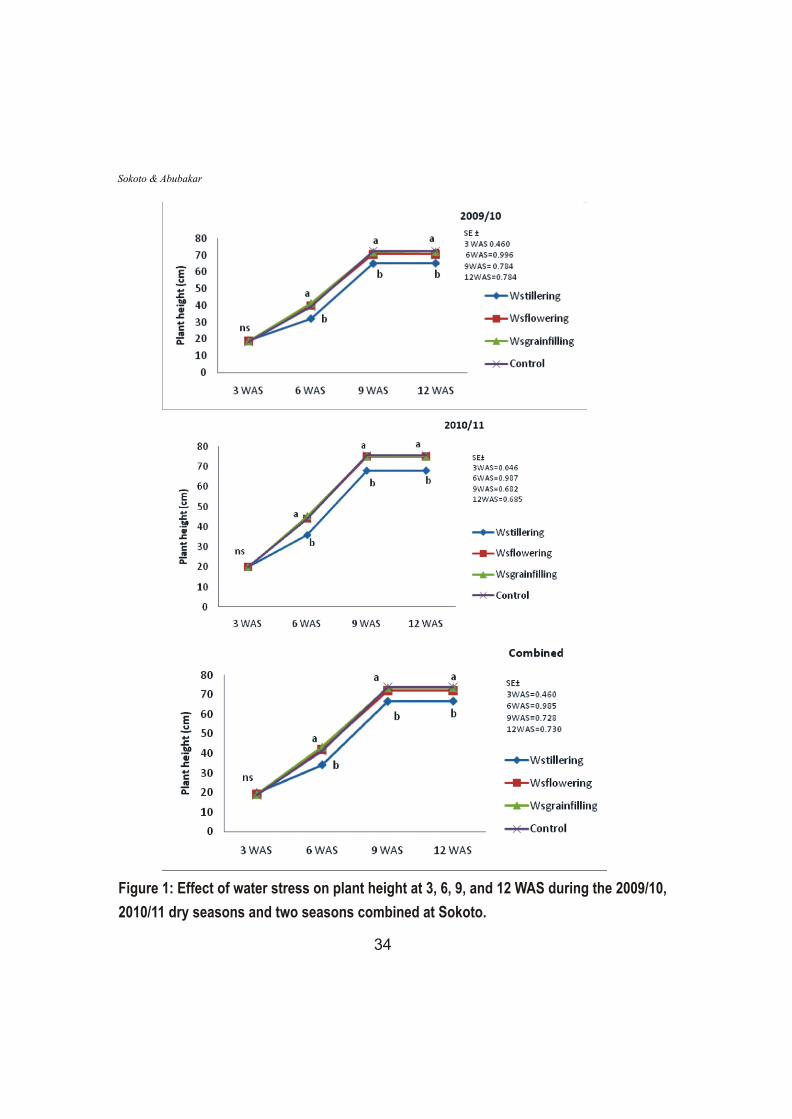
Figure 1: Effect of water stress on plant height at 3, 6, 9, and 12 WAS during the 2009/10,
2010/11 dry seasons and two seasons combined at Sokoto.
34
Sokoto & Abubakar
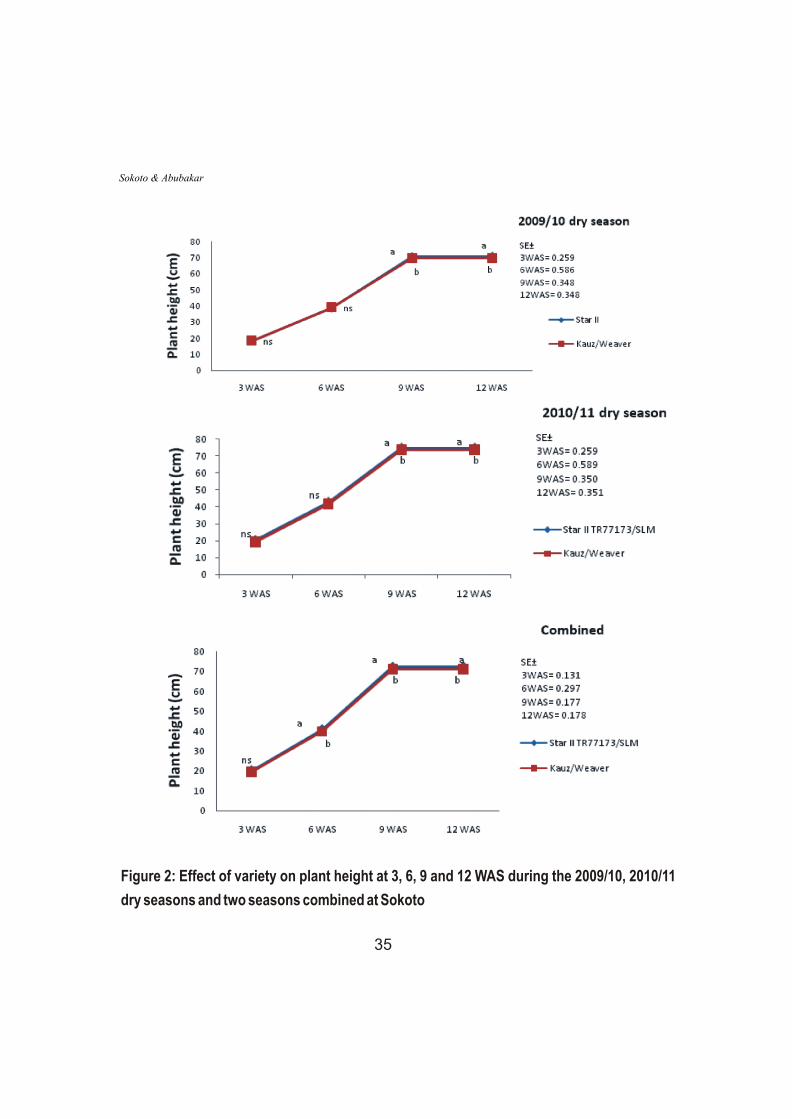
Figure 2: Effect of variety on plant height at 3, 6, 9 and 12 WAS during the 2009/10, 2010/11
dry seasons and two seasons combined at Sokoto
35
Sokoto & Abubakar
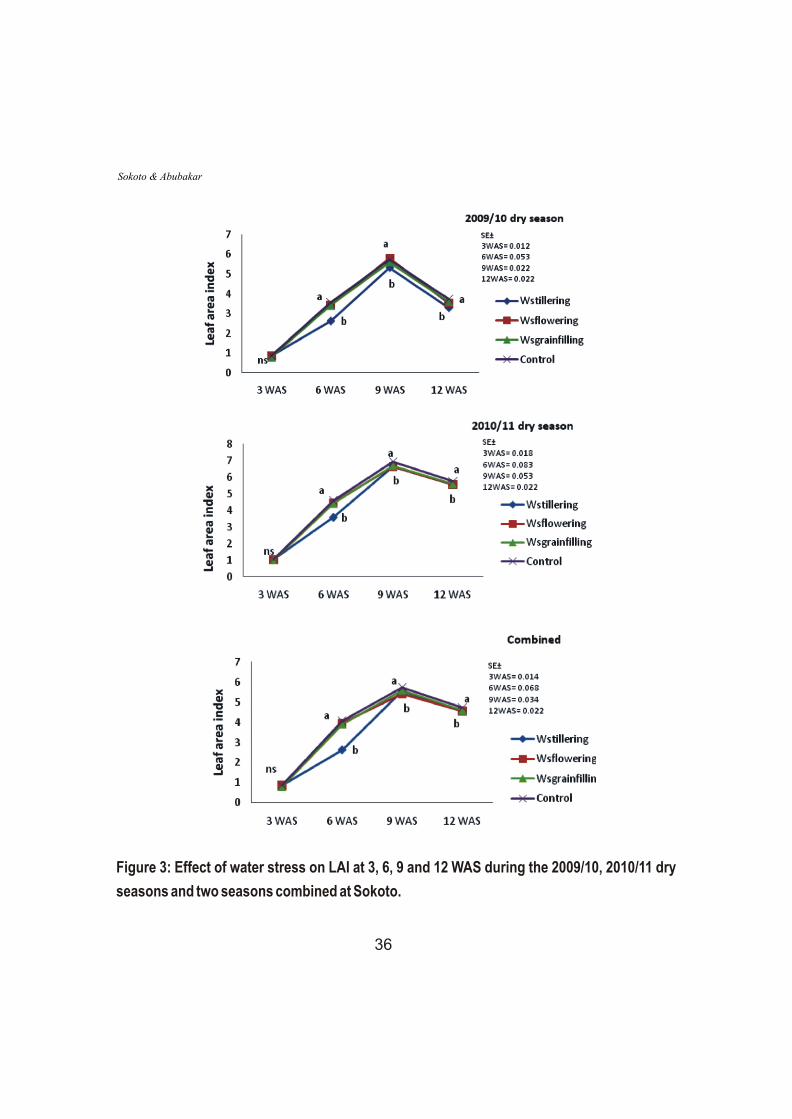
Figure 3: Effect of water stress on LAI at 3, 6, 9 and 12 WAS during the 2009/10, 2010/11 dry
seasons and two seasons combined at Sokoto.
36
Sokoto & Abubakar
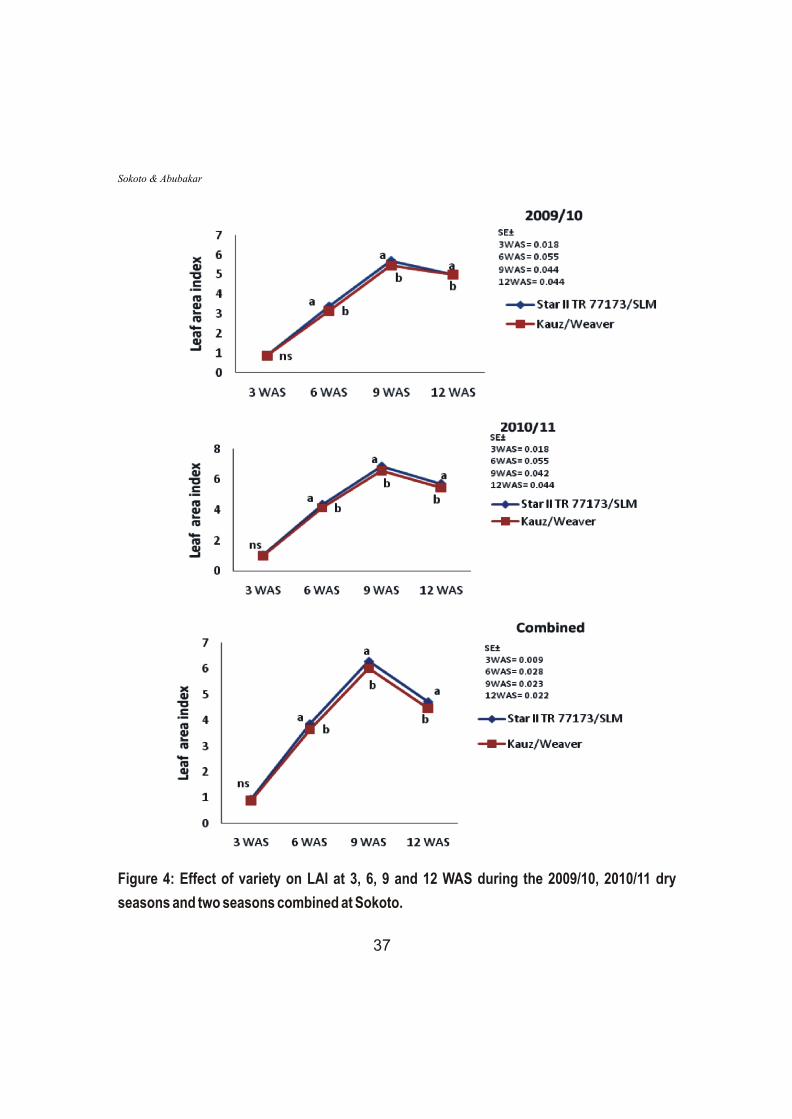
Figure 4: Effect of variety on LAI at 3, 6, 9 and 12 WAS during the 2009/10, 2010/11 dry
seasons and two seasons combined at Sokoto.
37
Sokoto & Abubakar
Net Assimilation Rate (NAR)
The effects of water stress and variety on NAR at 3, 6, 9 and 12 WAS in 2009/10, 2010/11
dry seasons and combined are presented in Figures 5 and 6. The results (Figure 5) indicated that
water stress at 3 WAS had no significantly (p<0.05) effect in 2009/10, 2010/11 dry seasons and two
seasons combined. At 6 WAS in 2009/10 and 2010/11 dry seasons, water stress at tillering resulted
in lower NAR, while water stress imposed at flowering, grain filling and the no stress control had
statistically higher and similar NAR. This lower NAR at water stress at tillering could be as a result of
reduced leaf area and LAI due to water stress imposed at tillering In the combined analysis, the
control (no control) differed significantly (p<0.05) with higher NAR, followed by water stress at
flowering and grain filling which were statistically similar and the lowest NAR was from water
stress at tillering. At 9 WAS in 2009/10 dry season and two seasons combined, the control differed
significantly (p<0.05) with higher NAR, while water stress resulted in lower NAR, but in 2010/11 dry
season, water stress had no effect on NAR but control differed significantly with higher NAR. At 12
WAS in 2009/10 dry season and the two seasons combined, water stress at tillering resulted in lower
NAR and the control differed from the other treatments with a higher NAR. Water stresshad no
effect on NAR in 2010/11 dry season at 12 WAS the control differed significantly with higher NAR. As
plants grow, there is an increase in the LAI and sometimes there is mutual leaves shading with
increase in the age of plants resulting in lower photosynthetic efficiency. The Lower NAR observed
at 6 WAS could be as a result of water stress imposed at tillering,this is similar to the findings
of Sharif (1999) who reported significant reduction of NAR due towater stress. Reddi and
Reddy (1995) reported that water stress resulted in low leaf water potentials and reductions in
photosynthesis.
The effect of variety on NAR is presented on Figure 6, the result indicated that there was no
significant (p>0.05) effect of variety on NAR at 3 WAS in 2009/10 and 2010/11 and combined, but
Star II TR 77173/ SLM differ significantly (p <0.05) from Kauz/Weaver with highest NAR at 6, 9 and
12 WAS in both seasons and combined and at 12 WAS in 2009/10 dry season, however the two
varieties had similar NAR at 12 WAS in 2010/11 dry season (Figure 6). Hussain (2007) also
observed that cultivars of wheat exhibited different net assimilation rates.
38
Sokoto & Abubakar
Crop Growth Rate (CGR)
The effects of water stress and variety on CGR at 3, 6, 9 and 12 WAS in 2009/10, 2010/11
dry seasons and combined are presented in Figures 7 and 8. The result indicated that the effect of
water stress on CGR at 3 WAS was not significant in both seasons and the two seasons combined
(Figure 8). At 6 WAS in 2009/10, 2010 dry seasons and two seasons combined water stress at
tillering resulted in lower CGR than water stress at flowering, grain filling and the control which are
statistically similar. At 9 and 12 WAS in both seasons and combined, control differed significantly
(p<0.05) with higher CGR but water stress had no effect on CGR. The reduction of CGR at tillering
may be adduced to water stress imposed at that stage which resulted to fewer tillers, lower LAI, NAR
and shorter plants. CGR increased progressively until 9 WAS and thereafter decreased at 12 WAS,
maximum CGR was observed at 9 WAS and decreased at 12 WAS due to plant maturity, cessation
of vegetative growth, loss of leaves and senescence. The finding is similar to that of Mirbaharet
al. (2009) who reported significant effect of water stress on CGR and decline in CGR at 12 WAS. On
varietal differences, the result indicated that at 3 WAS in both seasons and the two seasons
combined the two varieties did not differ in CGR. At 6, 9 and 12 WAS in both seasons and the two
seasons combined Star II TR 77173/SLM has higher CGR than Kauz/Weaver (Figure 8). The
difference in terms of CGR between the two varieties could be as a result genotype, which is similar
to the finding of Lad et al. (2002) and Bilgi (2006) who observed significant effect of variety on CGR.
CONCLUSION
Crops were associated with large values of LAI and CGR under better management of
irrigation. Water stress results to reduction in photosynthesis and wheat growth. Water
stress at tillering resulted to significant reduction in wheat growth; Star II TR 77173/ LM had better st th
growth than Kauz/Weaver when sown on 21 November and 5 December.
39
Sokoto & Abubakar
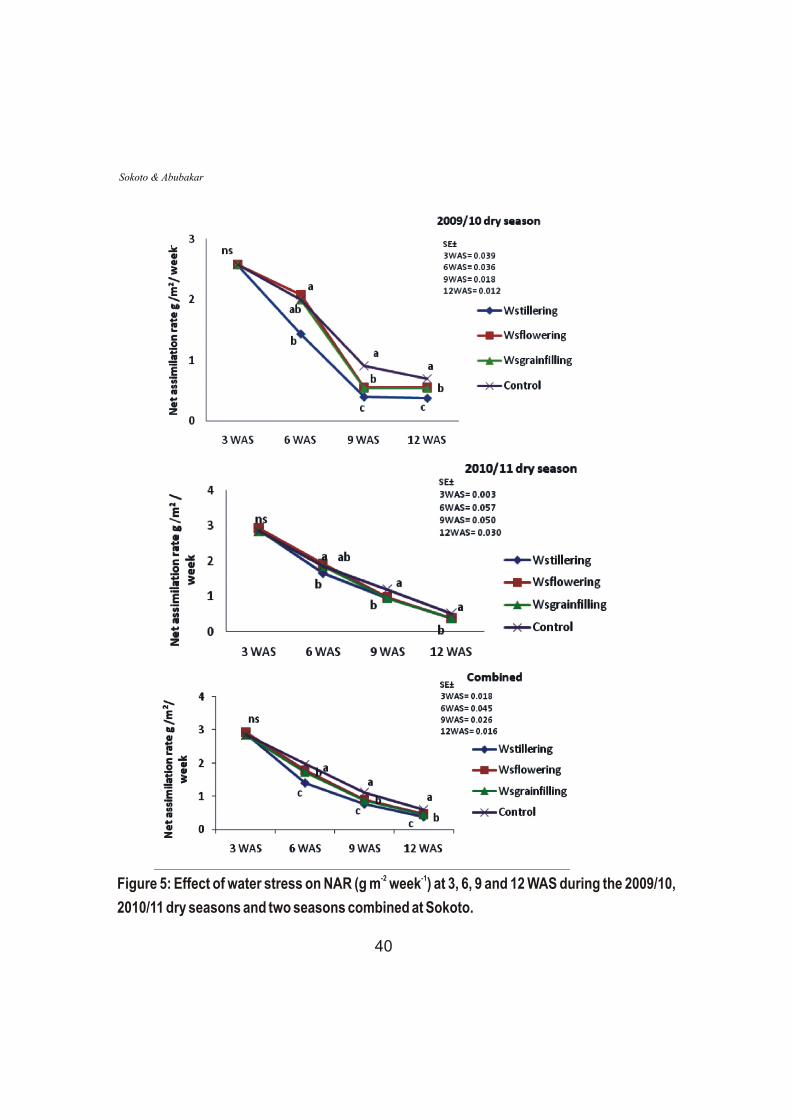
-2 -1Figure 5: Effect of water stress on NAR (g m week ) at 3, 6, 9 and 12 WAS during the 2009/10,
2010/11 dry seasons and two seasons combined at Sokoto.
40
Sokoto & Abubakar
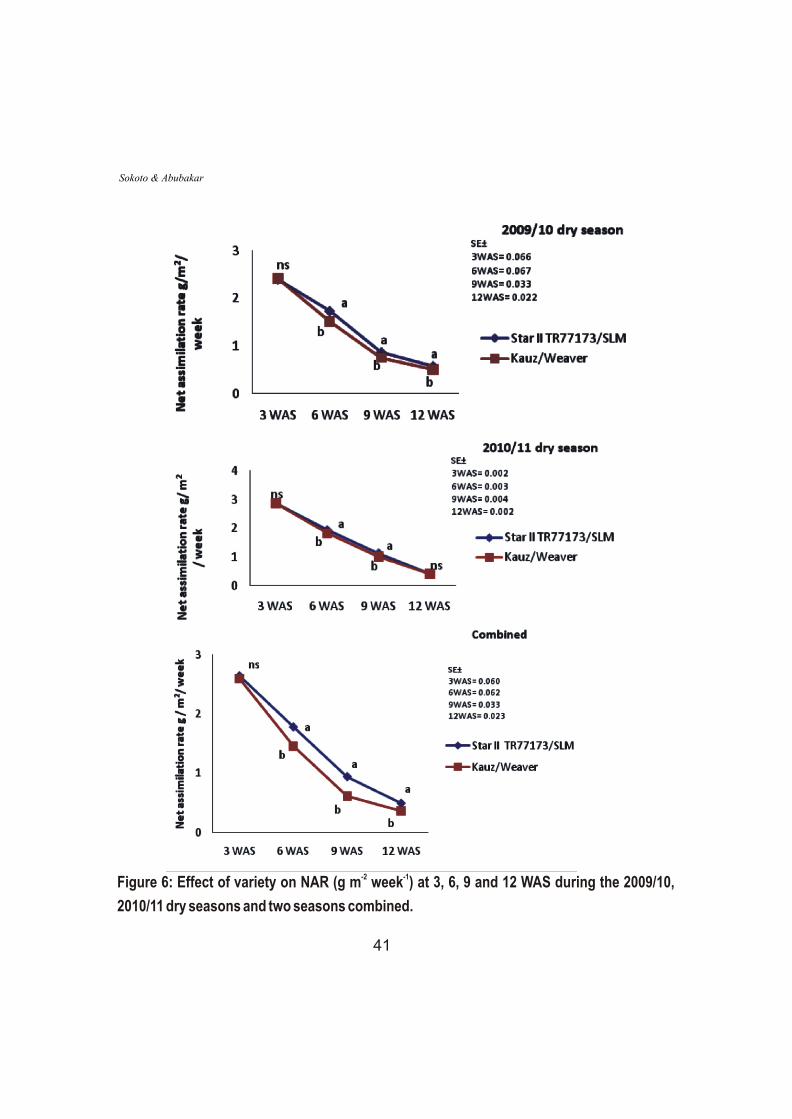
-2 -1Figure 6: Effect of variety on NAR (g m week ) at 3, 6, 9 and 12 WAS during the 2009/10,
2010/11 dry seasons and two seasons combined.
41
Sokoto & Abubakar
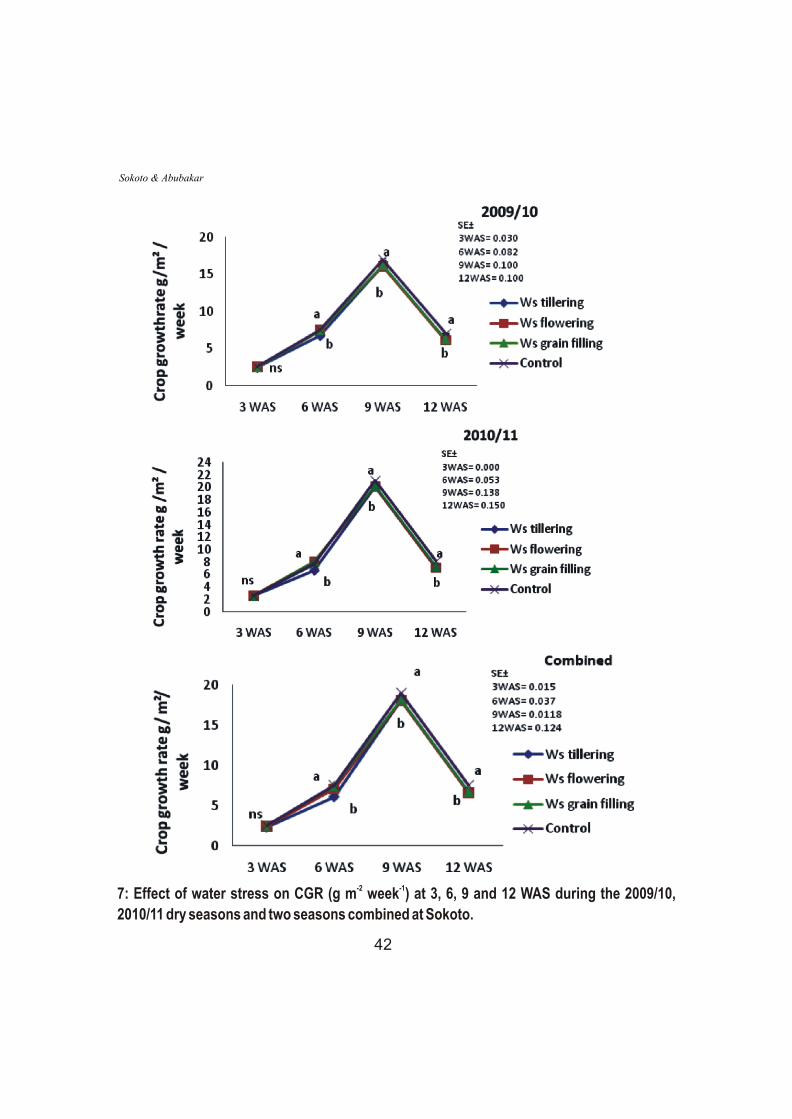
-2 -17: Effect of water stress on CGR (g m week ) at 3, 6, 9 and 12 WAS during the 2009/10,
2010/11 dry seasons and two seasons combined at Sokoto.
42
Sokoto & Abubakar
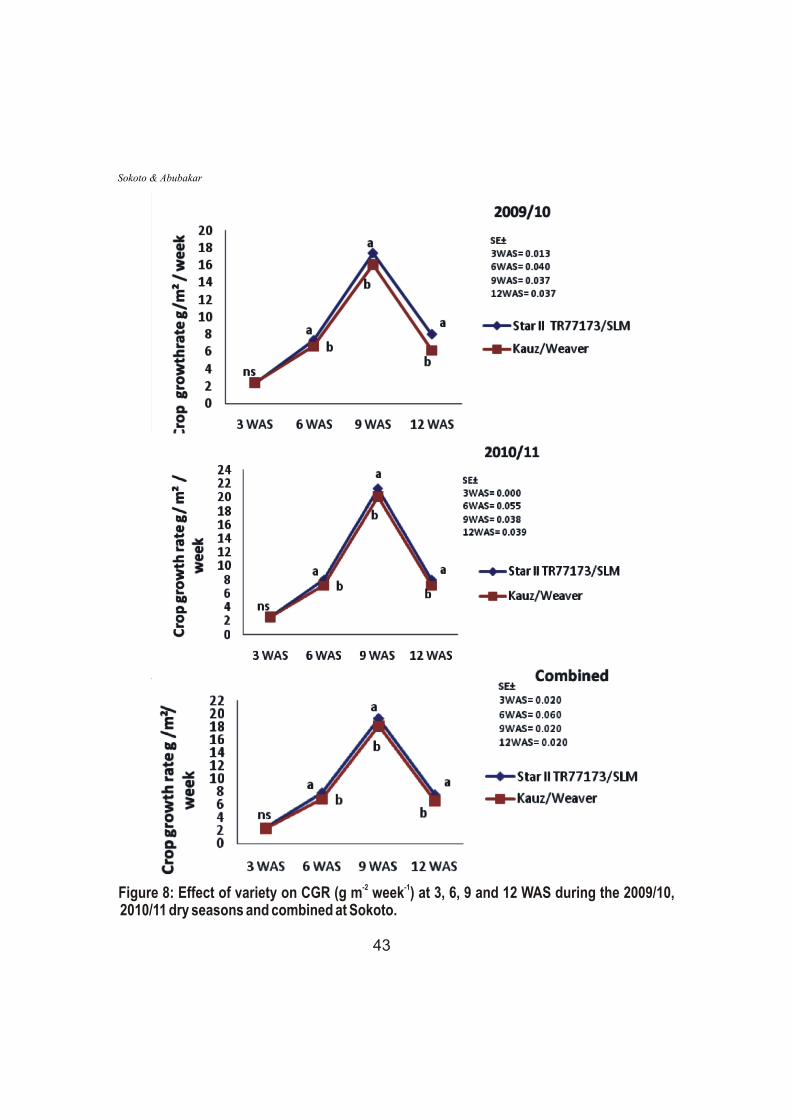
-2 -1Figure 8: Effect of variety on CGR (g m week ) at 3, 6, 9 and 12 WAS during the 2009/10, 2010/11 dry seasons and combined at Sokoto.
43
Sokoto & Abubakar
REFERENCESAbayomi, Y. A and Wright, D.(1999) “Effects of Water Stress on Growth and Yield of Spring
Wheat(TriticumaestivumL.) Cultivars''. Tropical Agriculture.(Trinidad). 76 (2): 216-230.Abubakar, I. U. (1999) “Effect of Basin and Inter-row Spacing on Growth, Yield and Yield
Components of Four Wheat (TriticumaestivumL.) varieties”.Ph.D. thesis; Ahmadu Bello University; Zaria, Nigeria; 210pp.
Akbar, M.Muhammad, T.,Tayyab, J.,Muhammad, A. (2001)“Evaluation of Exotic Wheat Germplasmfor Seed Yield and its Components under Rain Fed Conditions”. Sarhad Journal of Agriculture. 17(4): 511-513.
ArunahUthman Lucky and Ibrahim Hussaini (2004) “Effect of in Organic Manure and Poultry Manure on Sorghum Yeld at Samaru in the Northern Guinea Savannah of Nigeria”.Agrosearch6 (1): 49-54.
Bibinu A. T. S., Isa, A. and BwatanglangN.K . (2008 and 2009) “Sorghum/Millet Mixture as Affected by Crop Proportion and Sorghum Cultivar in a Semi-arid Environment”.Agrosearch10 (1&2): 89 – 97.
Bilgi, S. A. (2006) “Physiological Investigations in Dicoccum Wheat Genotypes”.M.Sc. Thesis submitted to the University of Agricultural Sciences Dharwad. July, 2006. 76 pp.
Blum, A. (1996) “Crop Responses to Drought and the Interpretation of Adaptation”. Plant Growth Regul. 20: 135-148.
Boyer J.S. (1982).“Plant Productivity and Environment”.Science, 218(4571): 443-448.Colorado Master Gardener (CMG, 2010)“Plant Growth Factors: Water”. CMG Garden Notes 144.
Colorado Master Gardener S M. Programme. Colorado Gardener Certificate training.Colorado State University Extension.4 pp.
Fagbemi, Tai (1996) “Hight Growth and Moisture Distribution in Sorghum Inter Crop with Gmelinaleucenaand Parkia in the Southern Guinea Savannah Zone of Nigeria”.Agrosearch. 2 (1and 2):1-13.
Hunt, R. (1978) “Plant Growth Analysis. Edward Arnold”, URC. 38 pp.Hussain, N. (2007) “Response of Wheat to Phosphorus in Calcareous Soils”. A Ph.D thesis
submitted to University College of Agriculture BahauddinZakariya University, Multan, Pakistan 1-249.
ImoloameE.O. (2014). “The Effect(s) of Different Weed Control Methods on Weed Infestation, Growth and Yield of Soybeans (glycine max (l) Merril) in the Southern Guinea Savanna of Nigeria”.Agrosearch 14(2):129-143
Kowal.J. and Knabe, M. (1972)“Agro Climatological Atlas of Northern States of Nigeria”.Ahmadu Bello University Press, Zaria. 36 pp.
Lad, D.B., T. Bhor, J.,Bangar, N. D., Khade, P. D., and Biradar, A. B. (2002) “Genetic Diversity in Wheat”. Journal of Maharashtra Agricultural Universities.27(2): 134-137.
44
Sokoto & Abubakar
Lado, A. (2004) “Effect of Irrigation Regimes and Period of Weed Interference on Growth and Yield of Two Spring Wheat (TriticumaestivumL.)”. A Dissertation submitted to the Postgraduate School, UsmanuDanfodiyo University Sokoto, in partial fulfillment of the requirement for the award of the Degree of Master of Science (Crop Science).180 pp.
Ledent, J. F. (1976)“Beam Light Interception by Twisted Leaf Surface”. Agricultural Meteorology. 17: 271-280.
Liheng He, ZhiqiangGao and Runzhi Li (2009) “Pretreatment of Seed with H2O2 Enhances Drought Tolerance of Wheat (TriticumaestivumL.) seedlings”.African Journal of Biotechnology 8(22): 6151-6157.
Mirbahar, A. A. G .S.Markhand, A. R. Mahar,S. A. A. and Kanhar,N.A. (2009) “Effect of Waterstress on Yield and YieldComponents of Wheat (TriticumaestivumL.) Varieties”.Pakistan Journal of Botany.41(3): 1303-1310
Muhammad, H.A. and Eltayeb, F. I. (1991) “Effect of Sowing Date and Irrigation Interval on Growth and Yield of Wheat and its Thermal Time Requirements under New Halfa Environment”.Journal of Agricultural Research.46 (2):135-140.
Ogunwale, J.A. Olarinde, B.D. and Aduloju, M.O (2006)“Effects of Organic Matter Removaland Adsorbate Solution Composition on Phosphate Sorption by Selected Soils of kwara, state, Nigeria”.Agrosearch 8 (1): 1 – 12.
Owen, P. C. (1968)“A Measuring Scale for Areas of Cereals Leaves”.Experimental Agriculture. 4:275-278.
Reddi, G. H. S. and Reddi, T. Y. (1995) “Irrigation of Principal Crops”. In: Efficient Use of Irrigation ndWater, 2 ed., Kalyani pub., New Delhi: 259 pp.
SAS (2003) “Statistical Analysis System”. SAS Release 9.1 for windows, SAS Institute Inc. Cary, N. C. USA.
Sellaries, A. (1975) “Weed Control Research and Demonstration”: inDadari, S.A. H. Mani, H.Z. Omenesa and J.A.Y. Shebayan (EDS). Third regional wheat workshop Tunis – Tunisia.203 pp.
SERC. (2011) Sokoto Energy Research Centre. “Weather records for 2010 and 2011”.Sharif, M. (1999) “Effect of Irrigation at Different Growth Stages on Growth and Yield Performance of
Wheat Cultivars”. M. Sc. Agri. Thesis, Univ. Agri., Faisalabad.208 pp.Siddique, M. R. B., Hamid, A., Islam, M. S. (2000)“Drought Stress Effects on Water Relations of
Wheat”. Bot. Bull. Acad. Sin. 41(1): 35-39.Wajid, S. A. (2004) “Modeling Growth and Yield of Wheat under Different Sowing Dates, Plant
Populations and Irrigation Levels”. Ph.D.Thesis, University of Arid Agriculture, Pakistan.305 pp.
Watson, D.J. (1952) “The Physiological Basis of Variation in Yield”.Annals of Botany,4: 101-145.
45
Sokoto & Abubakar


![Gibberellic Acid Promotes Early Growth of Winter Wheat and RyeRecently, GA 3 bioassays for stem growth were reported on common bean [8] and winter wheat [9] demonstrating differential](https://img.pdfslide.us/doc/110x75/6030bffc4fe2f451933d854d/gibberellic-acid-promotes-early-growth-of-winter-wheat-and-rye-recently-ga-3-bioassays.jpg)