Embed Size (px)
Citation preview
- -
City of Greensboro
CITY FACTS
POPULATION
COMPARISONS
GROWTH & DEVELOPMENT
WORKFORCE & WAGE RATES
TAX BASE & POPULATION DENSITY
Promoting Quality Growth Throughout Greensboro
Planning Department
300 West Washington Street
PO Box 3136
Greensboro, NC 27402-3136
www.greensboro-nc.gov
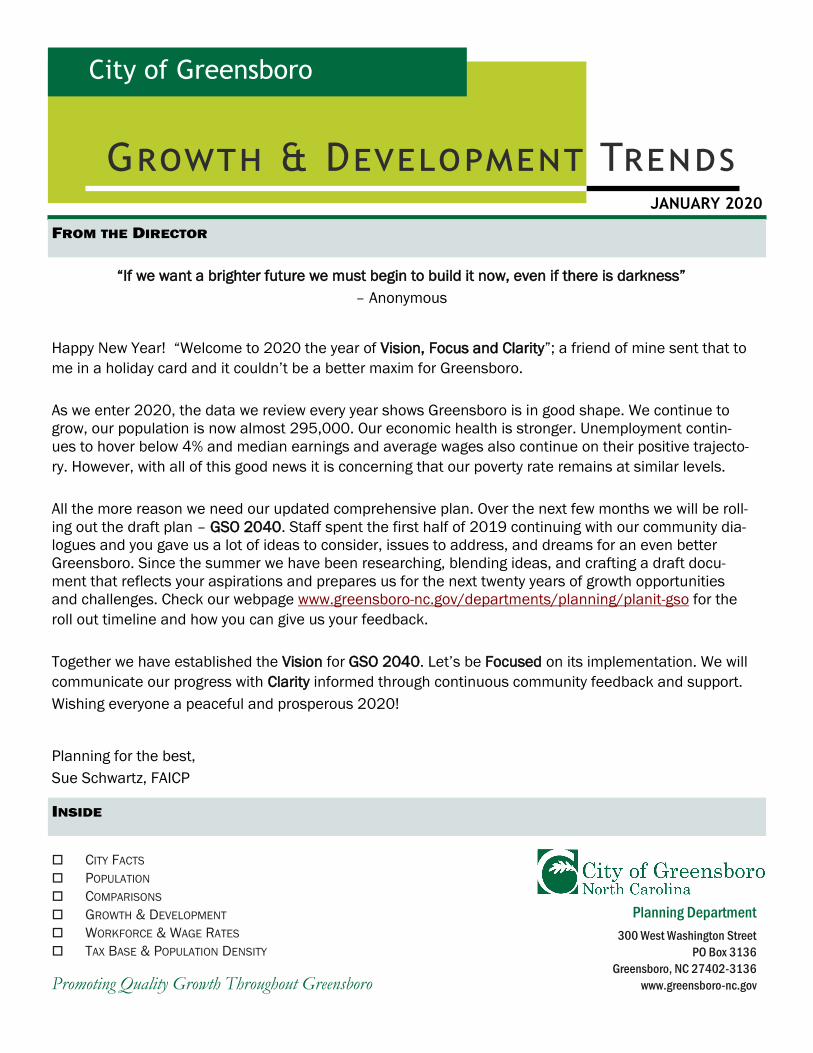
“If we want a brighter future we must begin to build it now, even if there is darkness”
– Anonymous
Happy New Year! “Welcome to 2020 the year of Vision, Focus and Clarity”; a friend of mine sent that to
me in a holiday card and it couldn’t be a better maxim for Greensboro.
As we enter 2020, the data we review every year shows Greensboro is in good shape. We continue to
grow, our population is now almost 295,000. Our economic health is stronger. Unemployment contin-
ues to hover below 4% and median earnings and average wages also continue on their positive trajecto-
ry. However, with all of this good news it is concerning that our poverty rate remains at similar levels.
All the more reason we need our updated comprehensive plan. Over the next few months we will be roll-
ing out the draft plan – GSO 2040. Staff spent the first half of 2019 continuing with our community dia-
logues and you gave us a lot of ideas to consider, issues to address, and dreams for an even better
Greensboro. Since the summer we have been researching, blending ideas, and crafting a draft docu-
ment that reflects your aspirations and prepares us for the next twenty years of growth opportunities
and challenges. Check our webpage www.greensboro-nc.gov/departments/planning/planit-gso for the
roll out timeline and how you can give us your feedback.
Together we have established the Vision for GSO 2040. Let’s be Focused on its implementation. We will
communicate our progress with Clarity informed through continuous community feedback and support.
Wishing everyone a peaceful and prosperous 2020!
Planning for the best,
Sue Schwartz, FAICP
Growth & Development Trends JANUARY 2020
-2-
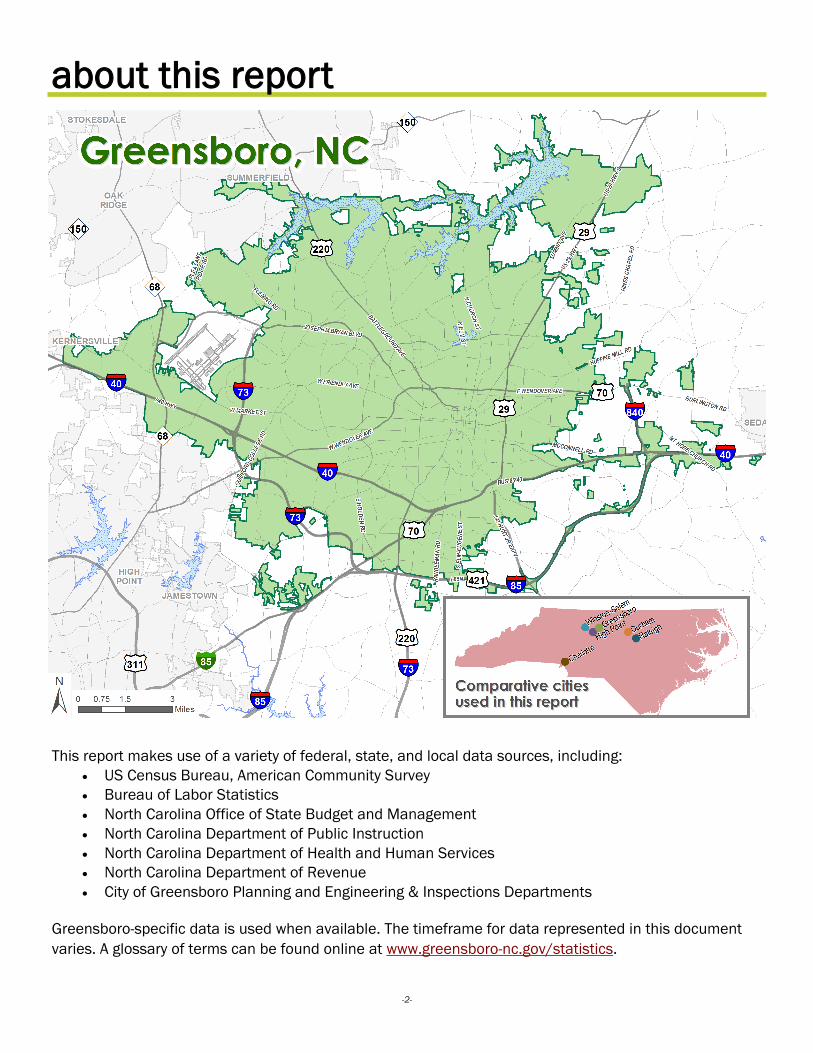
This report makes use of a variety of federal, state, and local data sources, including:
US Census Bureau, American Community Survey
Bureau of Labor Statistics
North Carolina Office of State Budget and Management
North Carolina Department of Public Instruction
North Carolina Department of Health and Human Services
North Carolina Department of Revenue
City of Greensboro Planning and Engineering & Inspections Departments
Greensboro-specific data is used when available. The timeframe for data represented in this document
varies. A glossary of terms can be found online at www.greensboro-nc.gov/statistics.
about this report
-3-
city facts
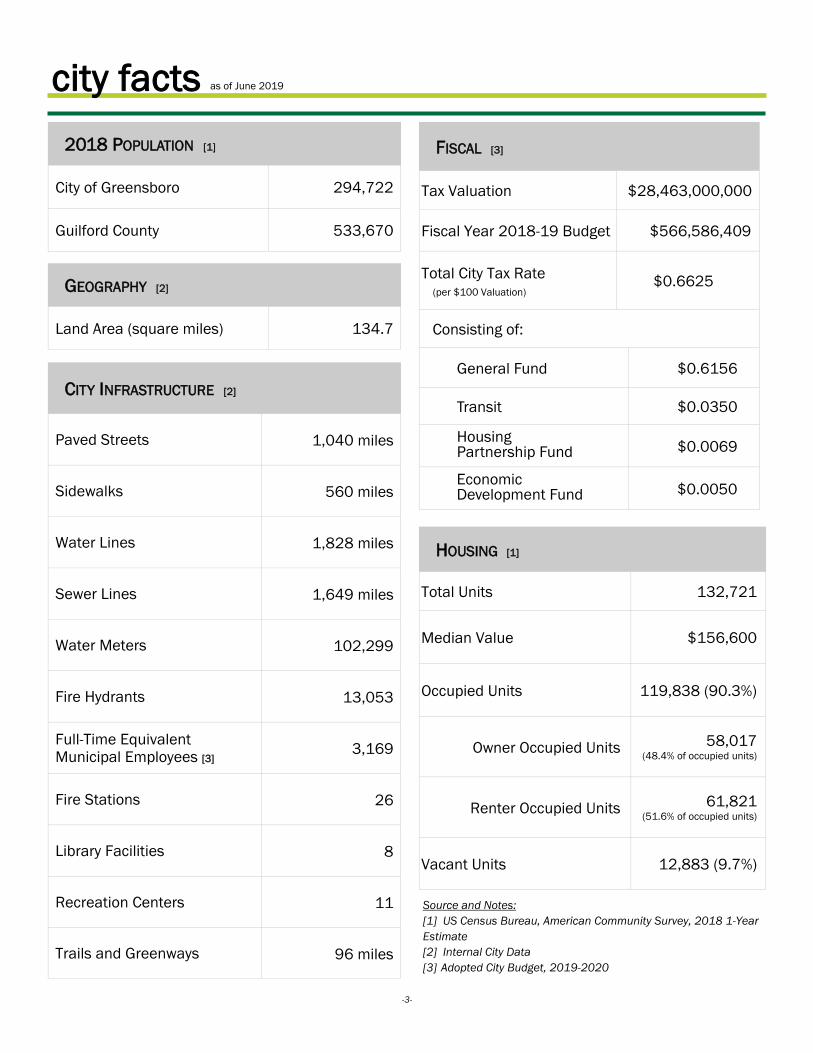
2018 POPULATION [1]
City of Greensboro 294,722
Guilford County 533,670
GEOGRAPHY [2]
Land Area (square miles) 134.7
CITY INFRASTRUCTURE [2]
Paved Streets 1,040 miles
Sidewalks 560 miles
Water Lines 1,828 miles
Sewer Lines 1,649 miles
Water Meters 102,299
Fire Hydrants 13,053
Full-Time Equivalent Municipal Employees [3]
3,169
Fire Stations 26
Library Facilities 8
Recreation Centers 11
Trails and Greenways 96 miles
FISCAL [3]
Tax Valuation $28,463,000,000
Fiscal Year 2018-19 Budget $566,586,409
Total City Tax Rate (per $100 Valuation)
$0.6625
Consisting of:
General Fund $0.6156
Transit $0.0350
Housing Partnership Fund $0.0069
Economic Development Fund $0.0050
HOUSING [1]
Total Units 132,721
Median Value $156,600
Occupied Units 119,838 (90.3%)
Owner Occupied Units 58,017 (48.4% of occupied units)
Renter Occupied Units 61,821 (51.6% of occupied units)
Vacant Units 12,883 (9.7%)
Source and Notes:
[1] US Census Bureau, American Community Survey, 2018 1-Year
Estimate
[2] Internal City Data
[3] Adopted City Budget, 2019-2020
as of June 2019
-4-
city trends
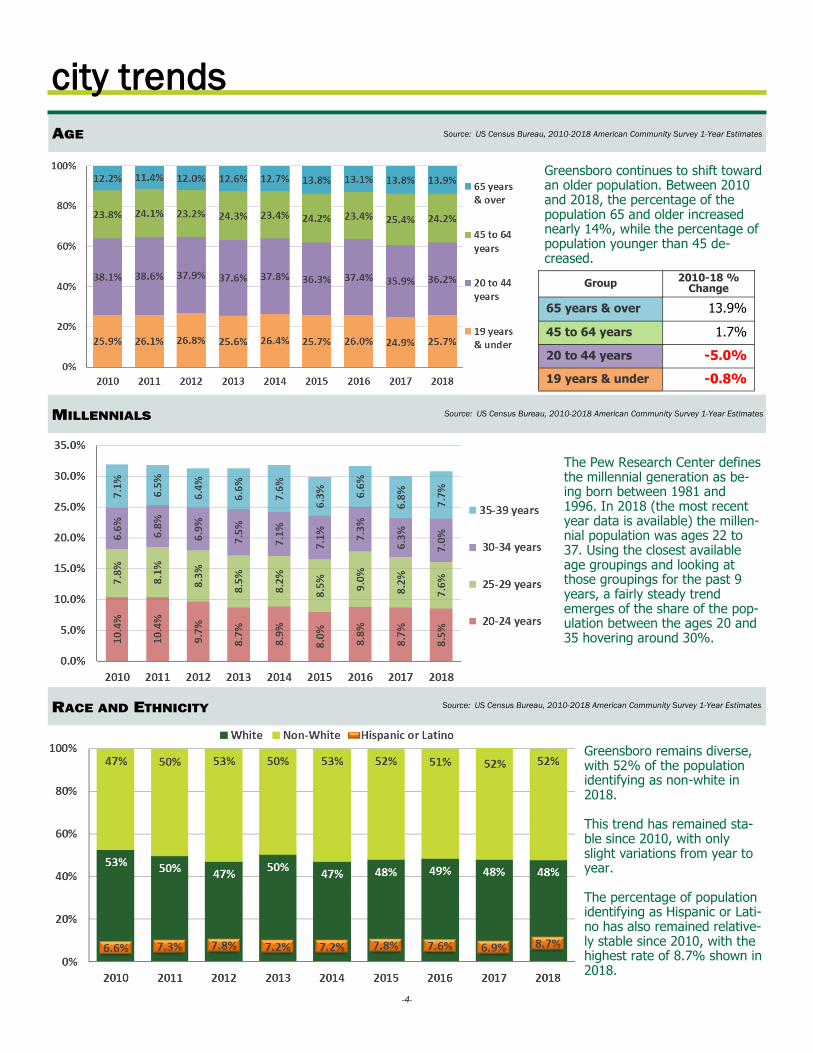
Greensboro remains diverse, with 52% of the population identifying as non-white in 2018. This trend has remained sta-ble since 2010, with only slight variations from year to year. The percentage of population identifying as Hispanic or Lati-no has also remained relative-ly stable since 2010, with the highest rate of 8.7% shown in 2018.
Greensboro continues to shift toward an older population. Between 2010 and 2018, the percentage of the population 65 and older increased nearly 14%, while the percentage of population younger than 45 de-creased.
Group 2010-18 %
Change
65 years & over 13.9%
45 to 64 years 1.7%
20 to 44 years -5.0%
19 years & under -0.8%
Source: US Census Bureau, 2010-2018 American Community Survey 1-Year Estimates
Source: US Census Bureau, 2010-2018 American Community Survey 1-Year Estimates
Source: US Census Bureau, 2010-2018 American Community Survey 1-Year Estimates
The Pew Research Center defines the millennial generation as be-ing born between 1981 and 1996. In 2018 (the most recent year data is available) the millen-nial population was ages 22 to 37. Using the closest available age groupings and looking at those groupings for the past 9 years, a fairly steady trend emerges of the share of the pop-ulation between the ages 20 and 35 hovering around 30%.
-5-
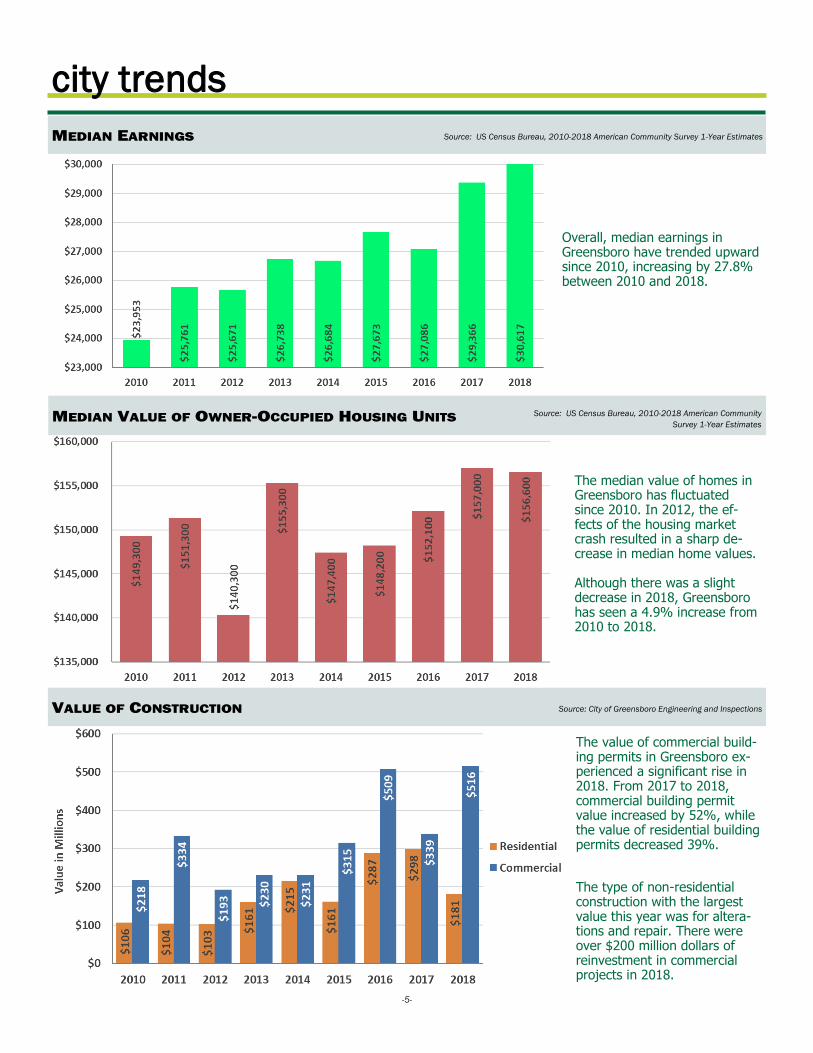
Overall, median earnings in Greensboro have trended upward since 2010, increasing by 27.8%between 2010 and 2018.
city trends
Source: US Census Bureau, 2010-2018 American Community
Survey 1-Year Estimates
Source: US Census Bureau, 2010-2018 American Community Survey 1-Year Estimates
The median value of homes in Greensboro has fluctuated since 2010. In 2012, the ef-fects of the housing market crash resulted in a sharp de-crease in median home values. Although there was a slight decrease in 2018, Greensboro has seen a 4.9% increase from 2010 to 2018.
The value of commercial build-ing permits in Greensboro ex-perienced a significant rise in 2018. From 2017 to 2018, commercial building permit value increased by 52%, while the value of residential building permits decreased 39%.
The type of non-residential construction with the largest value this year was for altera-tions and repair. There were over $200 million dollars of reinvestment in commercial projects in 2018.
Source: City of Greensboro Engineering and Inspections
-6-
comparisons
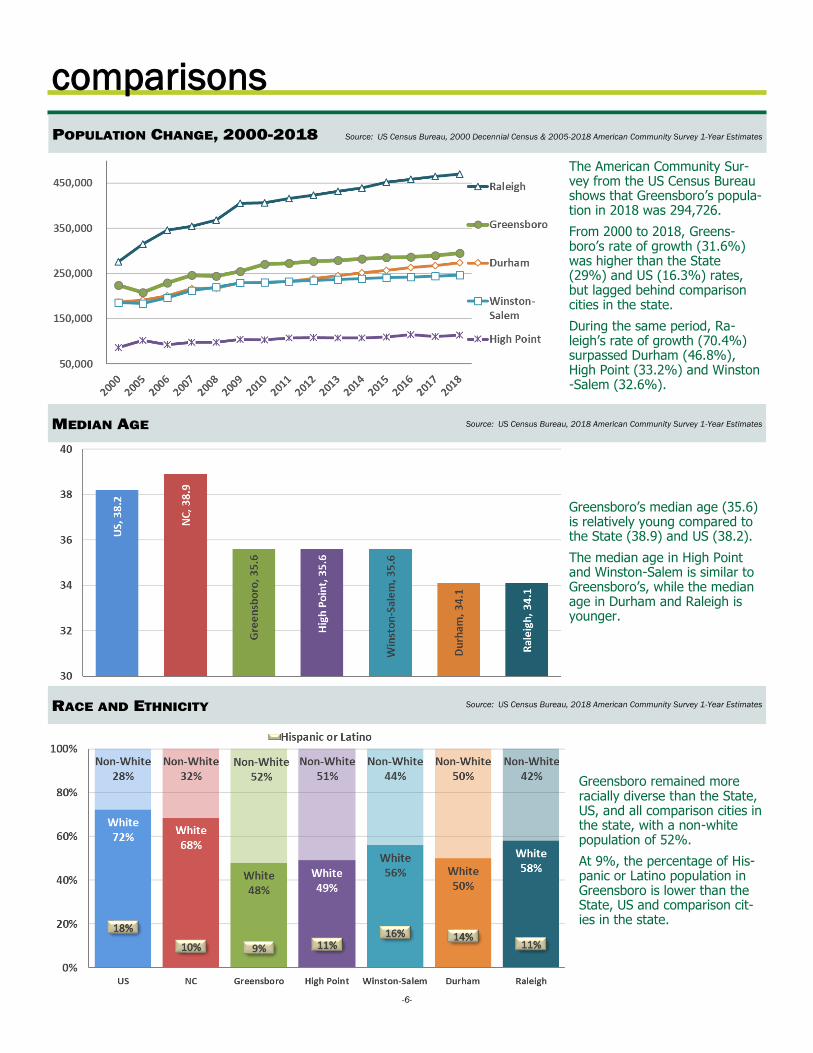
Greensboro’s median age (35.6) is relatively young compared to the State (38.9) and US (38.2).
The median age in High Point and Winston-Salem is similar to Greensboro’s, while the median age in Durham and Raleigh is younger.
Greensboro remained more racially diverse than the State, US, and all comparison cities in the state, with a non-white population of 52%.
At 9%, the percentage of His-panic or Latino population in Greensboro is lower than the State, US and comparison cit-ies in the state.
Source: US Census Bureau, 2000 Decennial Census & 2005-2018 American Community Survey 1-Year Estimates
Source: US Census Bureau, 2018 American Community Survey 1-Year Estimates
Source: US Census Bureau, 2018 American Community Survey 1-Year Estimates
The American Community Sur-vey from the US Census Bureau shows that Greensboro’s popula-tion in 2018 was 294,726.
From 2000 to 2018, Greens-boro’s rate of growth (31.6%) was higher than the State (29%) and US (16.3%) rates, but lagged behind comparison cities in the state.
During the same period, Ra-leigh’s rate of growth (70.4%) surpassed Durham (46.8%), High Point (33.2%) and Winston-Salem (32.6%).
-7-
comparisons
Source: Bureau of Labor Statistics
Source: US Census Bureau, 2018 American Community Survey 1-Year Estimates
Source: US Census Bureau, 2010-2018 American Community Survey 1-Year Estimates
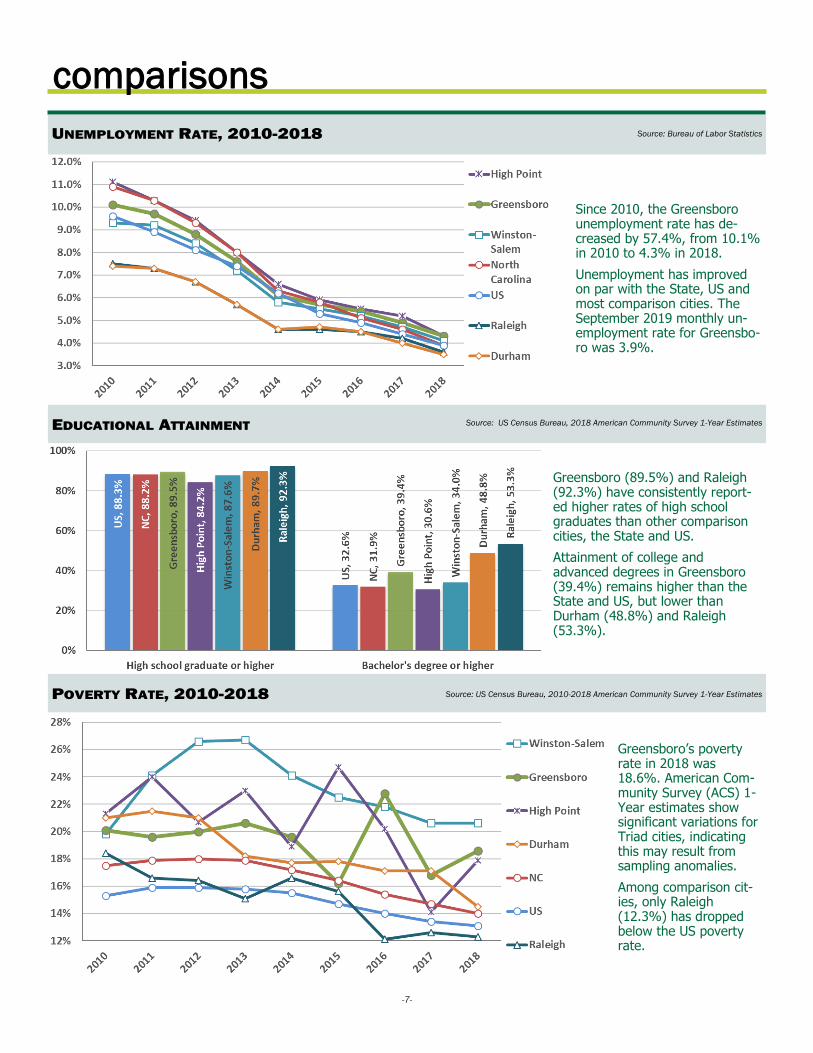
Greensboro’s poverty rate in 2018 was 18.6%. American Com-munity Survey (ACS) 1-Year estimates show significant variations for Triad cities, indicating this may result from sampling anomalies.
Among comparison cit-ies, only Raleigh (12.3%) has dropped below the US poverty rate.
Greensboro (89.5%) and Raleigh (92.3%) have consistently report-ed higher rates of high school graduates than other comparison cities, the State and US.
Attainment of college and advanced degrees in Greensboro (39.4%) remains higher than the State and US, but lower than Durham (48.8%) and Raleigh (53.3%).
Since 2010, the Greensboro unemployment rate has de-creased by 57.4%, from 10.1% in 2010 to 4.3% in 2018.
Unemployment has improved on par with the State, US and most comparison cities. The September 2019 monthly un-employment rate for Greensbo-ro was 3.9%.
-8-
comparisons
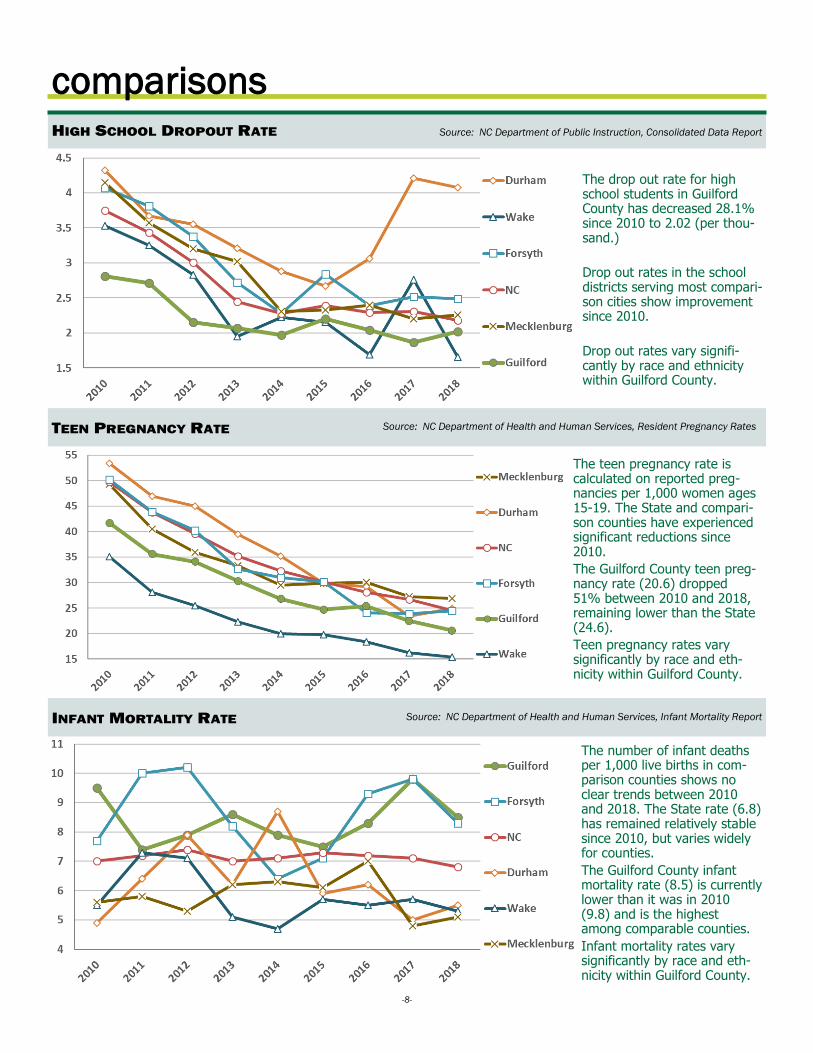
The number of infant deaths per 1,000 live births in com-parison counties shows no clear trends between 2010 and 2018. The State rate (6.8) has remained relatively stable since 2010, but varies widely for counties.
The Guilford County infant mortality rate (8.5) is currently lower than it was in 2010 (9.8) and is the highest among comparable counties.
Infant mortality rates vary significantly by race and eth-nicity within Guilford County.
Source: NC Department of Public Instruction, Consolidated Data Report
Source: NC Department of Health and Human Services, Infant Mortality Report
Source: NC Department of Health and Human Services, Resident Pregnancy Rates
The teen pregnancy rate is calculated on reported preg-nancies per 1,000 women ages 15-19. The State and compari-son counties have experienced significant reductions since 2010.
The Guilford County teen preg-nancy rate (20.6) dropped 51% between 2010 and 2018, remaining lower than the State (24.6).
Teen pregnancy rates vary significantly by race and eth-nicity within Guilford County.
The drop out rate for high school students in Guilford County has decreased 28.1% since 2010 to 2.02 (per thou-sand.)
Drop out rates in the school districts serving most compari-son cities show improvement since 2010.
Drop out rates vary signifi-cantly by race and ethnicity within Guilford County.
-9-
growth and development
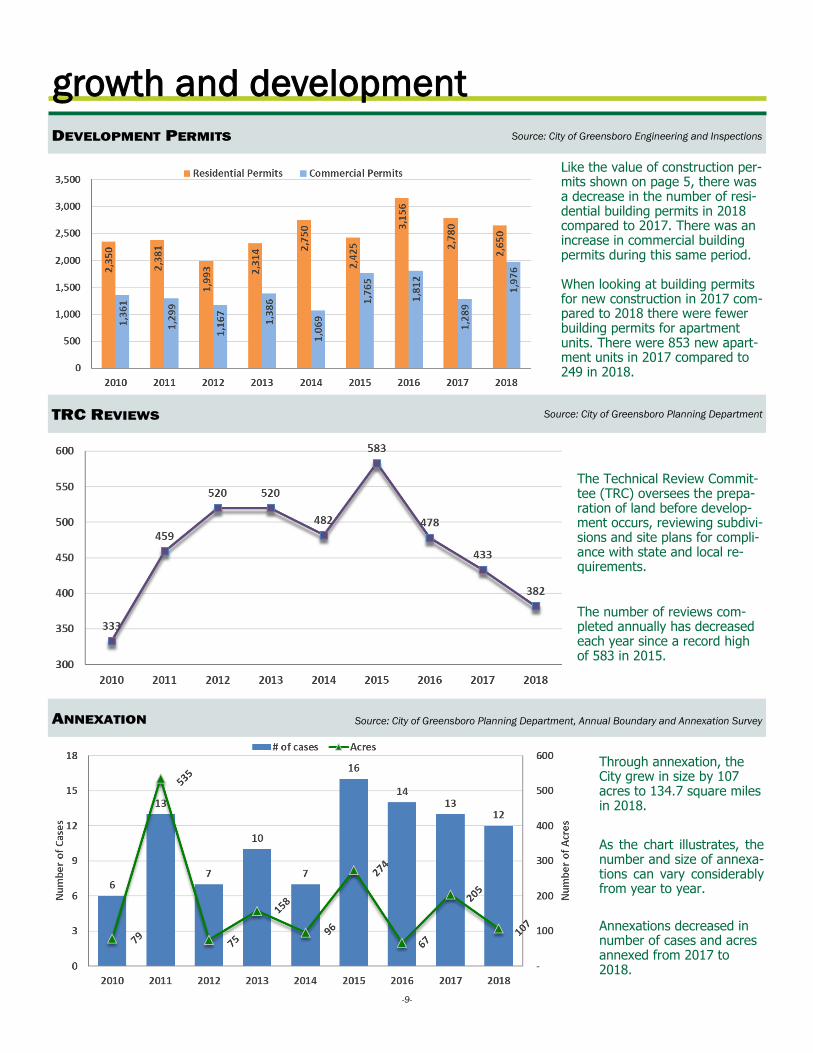
Through annexation, the City grew in size by 107 acres to 134.7 square miles in 2018.
As the chart illustrates, the number and size of annexa-tions can vary considerably from year to year.
Annexations decreased in number of cases and acres annexed from 2017 to 2018.
Like the value of construction per-mits shown on page 5, there was a decrease in the number of resi-dential building permits in 2018 compared to 2017. There was an increase in commercial building permits during this same period. When looking at building permits for new construction in 2017 com-pared to 2018 there were fewer building permits for apartment units. There were 853 new apart-ment units in 2017 compared to 249 in 2018.
Source: City of Greensboro Planning Department, Annual Boundary and Annexation Survey
The Technical Review Commit-tee (TRC) oversees the prepa-ration of land before develop-ment occurs, reviewing subdivi-sions and site plans for compli-ance with state and local re-quirements.
The number of reviews com-pleted annually has decreased each year since a record high of 583 in 2015.
Source: City of Greensboro Engineering and Inspections
Source: City of Greensboro Planning Department
-10-
workforce
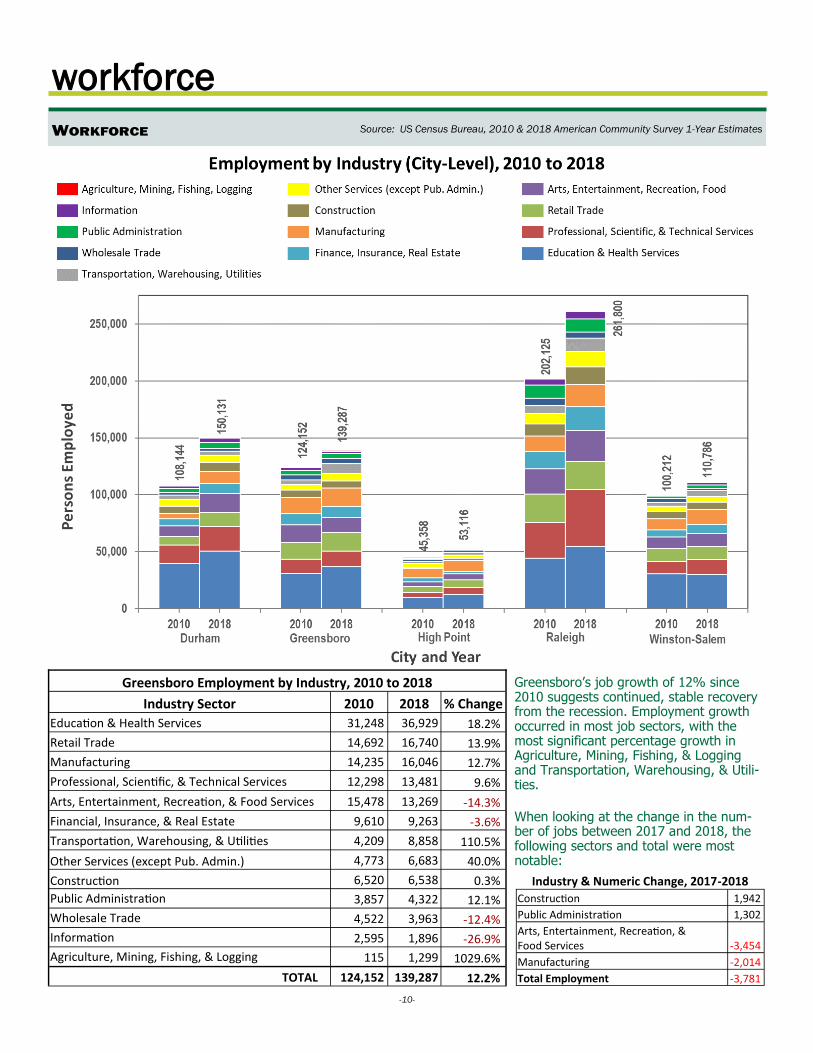
Greensboro’s job growth of 12% since 2010 suggests continued, stable recovery from the recession. Employment growth occurred in most job sectors, with the most significant percentage growth in Agriculture, Mining, Fishing, & Logging and Transportation, Warehousing, & Utili-ties. When looking at the change in the num-ber of jobs between 2017 and 2018, the following sectors and total were most notable:
Source: US Census Bureau, 2010 & 2018 American Community Survey 1-Year Estimates
Greensboro Employment by Industry, 2010 to 2018
Industry Sector 2010 2018 % Change
Education & Health Services 31,248 36,929 18.2%
Retail Trade 14,692 16,740 13.9%
Manufacturing 14,235 16,046 12.7%
Professional, Scientific, & Technical Services 12,298 13,481 9.6%
Arts, Entertainment, Recreation, & Food Services 15,478 13,269 -14.3%
Financial, Insurance, & Real Estate 9,610 9,263 -3.6%
Transportation, Warehousing, & Utilities 4,209 8,858 110.5%
Other Services (except Pub. Admin.) 4,773 6,683 40.0%
Construction 6,520 6,538 0.3%
Public Administration 3,857 4,322 12.1%
Wholesale Trade 4,522 3,963 -12.4%
Information 2,595 1,896 -26.9%
Agriculture, Mining, Fishing, & Logging 115 1,299 1029.6%
TOTAL 124,152 139,287 12.2%
Industry & Numeric Change, 2017-2018
Construction 1,942
Public Administration 1,302
Arts, Entertainment, Recreation, & Food Services -3,454
Manufacturing -2,014
Total Employment -3,781
-11-
wage rates
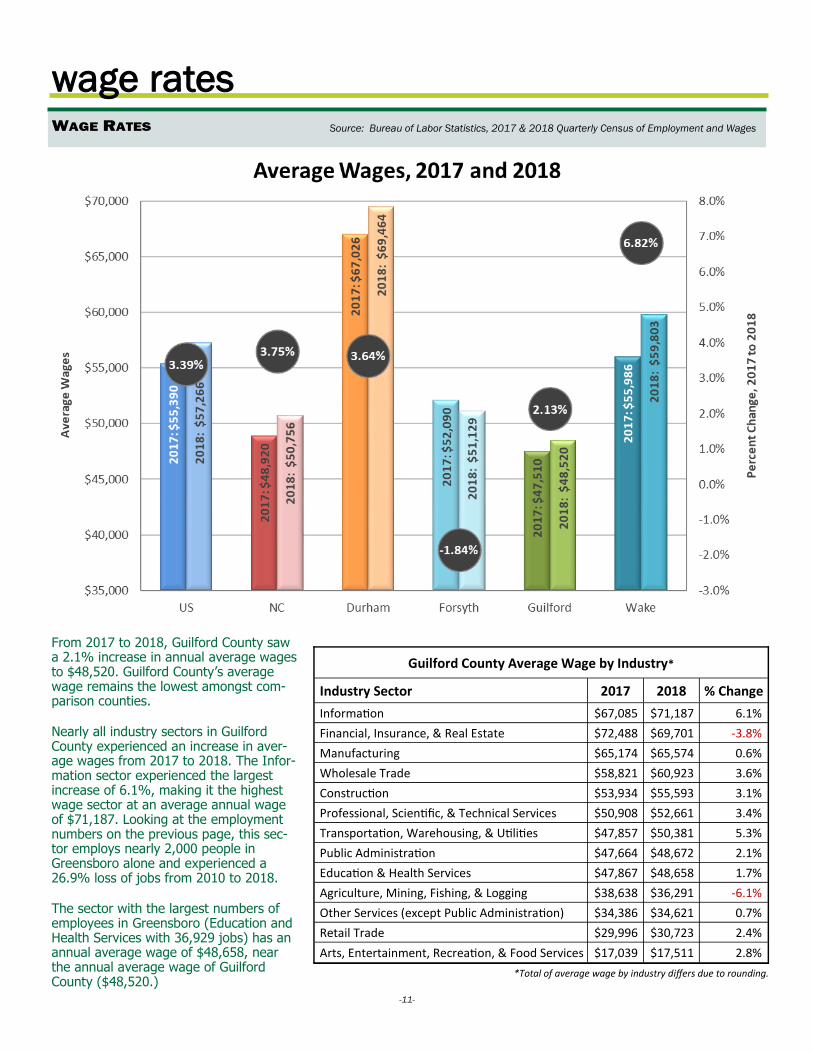
From 2017 to 2018, Guilford County saw a 2.1% increase in annual average wages to $48,520. Guilford County’s average wage remains the lowest amongst com-parison counties. Nearly all industry sectors in Guilford County experienced an increase in aver-age wages from 2017 to 2018. The Infor-mation sector experienced the largest increase of 6.1%, making it the highest wage sector at an average annual wage of $71,187. Looking at the employment numbers on the previous page, this sec-tor employs nearly 2,000 people in Greensboro alone and experienced a 26.9% loss of jobs from 2010 to 2018. The sector with the largest numbers of employees in Greensboro (Education and Health Services with 36,929 jobs) has an annual average wage of $48,658, near the annual average wage of Guilford County ($48,520.)
Source: Bureau of Labor Statistics, 2017 & 2018 Quarterly Census of Employment and Wages
Guilford County Average Wage by Industry*
Industry Sector 2017 2018 % Change
Information $67,085 $71,187 6.1%
Financial, Insurance, & Real Estate $72,488 $69,701 -3.8%
Manufacturing $65,174 $65,574 0.6%
Wholesale Trade $58,821 $60,923 3.6%
Construction $53,934 $55,593 3.1%
Professional, Scientific, & Technical Services $50,908 $52,661 3.4%
Transportation, Warehousing, & Utilities $47,857 $50,381 5.3%
Public Administration $47,664 $48,672 2.1%
Education & Health Services $47,867 $48,658 1.7%
Agriculture, Mining, Fishing, & Logging $38,638 $36,291 -6.1%
Other Services (except Public Administration) $34,386 $34,621 0.7%
Retail Trade $29,996 $30,723 2.4%
Arts, Entertainment, Recreation, & Food Services $17,039 $17,511 2.8%
*Total of average wage by industry differs due to rounding.
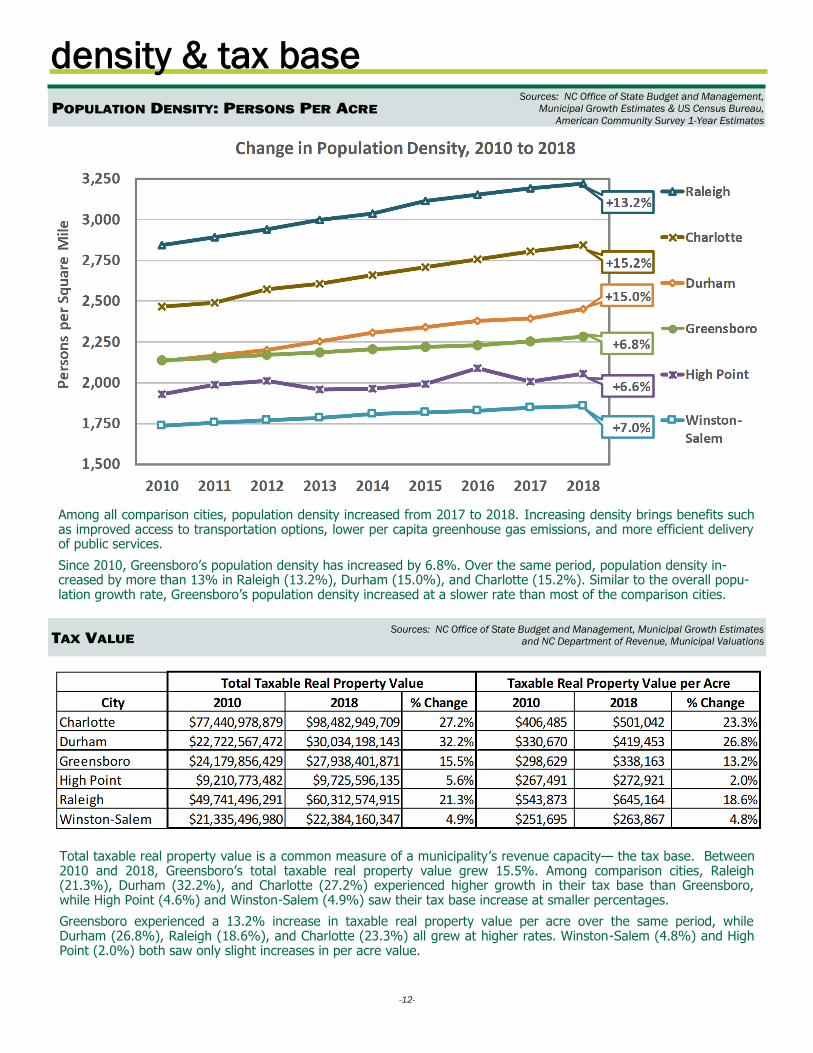
Total taxable real property value is a common measure of a municipality’s revenue capacity— the tax base. Between 2010 and 2018, Greensboro’s total taxable real property value grew 15.5%. Among comparison cities, Raleigh (21.3%), Durham (32.2%), and Charlotte (27.2%) experienced higher growth in their tax base than Greensboro, while High Point (4.6%) and Winston-Salem (4.9%) saw their tax base increase at smaller percentages.
Greensboro experienced a 13.2% increase in taxable real property value per acre over the same period, while Durham (26.8%), Raleigh (18.6%), and Charlotte (23.3%) all grew at higher rates. Winston-Salem (4.8%) and High Point (2.0%) both saw only slight increases in per acre value.
Sources: NC Office of State Budget and Management,
Municipal Growth Estimates & US Census Bureau,
American Community Survey 1-Year Estimates
Sources: NC Office of State Budget and Management, Municipal Growth Estimates
and NC Department of Revenue, Municipal Valuations
Among all comparison cities, population density increased from 2017 to 2018. Increasing density brings benefits such as improved access to transportation options, lower per capita greenhouse gas emissions, and more efficient delivery of public services.
Since 2010, Greensboro’s population density has increased by 6.8%. Over the same period, population density in-creased by more than 13% in Raleigh (13.2%), Durham (15.0%), and Charlotte (15.2%). Similar to the overall popu-lation growth rate, Greensboro’s population density increased at a slower rate than most of the comparison cities.
-12-
density & tax base