Embed Size (px)
Citation preview

growthacross diverse markets
curtiss-wright corporation
annual report 2005
GENERAL INDUSTRIAL
OIL AND GAS
FLO
W C
ONTROL
METAL T R E AT M E NT
LINES OF
BUSINESS
MARKETS MARKETS M
AR
KE
TS
MA
RKETS MARKETS MARKETS MARKETS
M
AR
KE
TS
M
AR
KETS MARKETS
MOTION CO
NTR
OL
DEFEN
SE
PO
WE
R G
EN
ER
ATION
CO
MM
ERCIA
L AEROSPACE
Curtiss-Wright is committed to providing highly engineered
solutions for demanding applications. In the defense market,
we have balanced exposure on naval, aerospace and ground
platforms, both on development programs and in support of
current forces in the field. In the commercial markets, our roots
remain firmly planted in the aerospace market. We have also
built significant footholds in power generation and oil and gas
markets through the application of complementary technologies
and our knowledge of critical performance requirements.
Our focus on technical innovation provides access to diverse
markets where customers demand innovative, reliable and
safe solutions.
growth across diverse markets
cu
rt
iss
-wr
igh
t c
or
po
ra
tio
n a
nn
ua
l r
ep
or
t 2005
curtiss-wright corporation4 Becker Farm RoadRoseland, New Jersey 07068
www.curtisswright.com

our disciplined approach is reflected in our operating results
flow control
Specialized severe service valves, pumps, controls and electronics for critical national defense programs and commercial markets such as nuclear power generation, oil and gas processing and general industry.
naval defense n nuclear propulsion system
componentsn Valves (butterfly, globe, gate,
control, safety, relief, solenoid)n Pumpsn Motors and generatorsn Instrumentation and controls
n non-nuclear productsn Smart leakless valvesn Ball valvesn Steam generator control
equipmentn Air-driven fluid pumpsn Engineering, inspection and
testing servicesn aircraft carrier launch and
retrieval equipmentn Advanced electromechanical
systemsn instrumentation and
control systems
ground defense n electromechanical gun
pulsed power supply system
oil and gas processingn valves
n DeltaGuard® coker valven Pressure relief valvesn Safety valves n Triple offset butterfly valven Boltless slide valven Fluid catalytic cracking devicesn Solenoid, gate and globe valves
n web-enabled process control software
commercial aerospacen commercial jets
n Secondary flight control actuation systems and electromechanical trim actuators
n Aircraft cargo door and utility actuation systems
n Fire detection and suppression control systems
n Automated passenger bridge systems
n Position sensorsn Business/regional jets
n Throttle quadrants n helicopters
n Rotor ice protection systemsn repair and overhaul services
n Component overhaul and logistics support services
military aerospacen transport and fighter aircraft
n Weapons bay door actuation systems
n Electromechanical actuatorsn helicopters
n Radar warning systemsn Acoustic processing systemsn Flight data recorders
n unmanned aerial vehiclesn Integrated mission management
and flight control computers
ground defensen tanks and light armored vehicles
n Digital electromechanical aiming and stabilization systems
n Fire control, sight head and environmental control processors
n Single board computers for target acquisition systems
n Hydropneumatic suspension systems
n Ammunition handling systems
motion control
Innovative, highly engineered flight controls, drive and sensor components and integrated subsystems for aerospace, defense and industrial applications worldwide.
metal treatment
Precision metal finishing services, including shot peening, shot peen forming, laser peening, heat treating and specialty coatings for critical components in commercial aerospace, automotive, energy and processing industries.
commercial aerospacen shot peen forming
n Wing skinsn shot peening
n Aircraft structural componentsn Landing gear componentsn Turbine engine rotating
componentsn laser peening
n Turbine engine rotating components
n coatingsn Fastenersn Sliding components
n heat treatingn Aluminum structural components
automotiven shot peening
n Engine and transmission components
n heat treatingn Miscellaneous engine, transmission and structural components
n coatingsn Fastenersn Sliding components
general industrialn shot peening
n Highly stressed metal components susceptible to fatigue
n Welded components subject to distortion
n Architectural structuresn heat treating
n Miscellaneous aluminum and steel components
n coatingsn Fastenersn Components subject to
sliding wear
$466 million
$465 million$199 million
consolidated historical performance
naval defensen shipboard helicopter
landing systemsn Aircraft ship integrated secure
and traverse (ASIST) systemsn Recover, assist, secure and
traverse (RAST) systemsn marine propulsion
n Marine engine diesel valve injection systems
other military & governmentn high performance data
communication productsn Power conversion products
n space programsn Control electronics
n security systemsn Perimeter intrusion detection
equipmentn faa
n Airport surface detection equipment radar video processng
general industrial markets n automated industrial equipment
n Air, sea and ground simulationn Fractional horse power (HP)
specialty motorsn Force transducersn Joystick controllersn Sensorsn Faders
n high speed trainsn Electromechanical tilting systems
for high-speed trains
nuclear power generationn reactor coolant pumpsn motorsn control rod drive mechanisms n valves
n Solenoid, gate and globe valvesn containment air lock doorsn fastenersn diamond wire cuttingn engineering inspection, testing
and qualificationn inventory management systems
general industrialn directional control valvesn pneumatic valves
200,000
400,000
600,000
800,000
1,000,000
$1,200,000
’01 ’02 ’03 ’04 ’05
Net Sales (000s)
’01 ’02 ’03 ’04 ’05
30,000
60,000
90,000
120,000
$150,000
Operating Income* (000s)
’01 ’02 ’03 ’04 ’05
10,000
20,000
30,000
40,000
50,000
60,000
70,000
$80,000
Net Earnings* (000s)
major marketsn category
n Products and services
keY to lines of Business listings
Des
ign:
Rus
sell
Des
ign,
NYC
* Normalized to exclude the effect of gains and losses on real estate sales and CW Pension Plan income/expense.

CURTISS-WRIGHT CORPORATION �
(In thousands, except per share data; unaudited) 2005 2004 2003
PERFORMANCE: Net sales $ �,�30,928 $ 955,039 $ 746,071 Earnings before interest, taxes, depreciation, amortization and pension �88,�32 152,026 119,435Net earnings 75,280 65,066 52,268Cash flow from operations �05,�78 105,347 83,524Diluted earnings per share(1) 3.44 3.02 2.50Return on sales 7% 7% 7%Return on capital 8% 8% 8%New orders �,26�,�93 998,936 743,115Backlog at year-end 805,63� 627,679 505,519 YEAR-ENDFINANCIALPOSITION Working capital $ 268,963 $ 212,159 $ 238,640 Current ratio 2.2to� 2.1 to 1 2.8 to 1Total assets �,400,285 1,278,440 973,665Stockholders’ equity 638,220 575,614 478,881Stockholders’ equity per share(1) 29.35 26.85 23.04 OTHERYEAR-ENDDATA Depreciation and amortization $ 47,85� $ 40,742 $ 31,327 Capital expenditures 42,444 32,452 33,329Shares of stock outstanding at December 31,(1) 2�,746,362 21,438,158 20,785,856Number of registered stockholders 7,069 7,460 7,768Number of employees 5,892 5,599 4,655 DIVIDENDSPERSHARE $ 0.39 $ 0.36 $ 0.32
HISTORICAl FINANCIAl PERFORmANCE
(1) Share and per share data for all years have been adjusted to reflect the 2-for-1 stock split on December 17, 2003.

2 CURTISS-WRIGHT CORPORATION
FlOW CONTROl: HIGHlY ENGINEERED SOlUTIONSFOR DEmANDING mARKETS
20%sales growth driven by both military and commercial markets
Our innovative, high-performance products can be found aboard every nuclear submarine and aircraft carrier commissioned by the U.S. Navy. Within the processing industry, Flow Control’s products help ensure worker safety by eliminating potentially deadly hazards, while greatly improving the operational efficiency of oil and gas refineries globally. For the commercial power industry, Flow Control’s products and advanced technologies assist in the safe, reliable and efficient operation of nuclear power plants throughout the world.
Curtiss-Wright’s Flow Control segment plays a critical role in the safe and reliable operation of our military, nuclear power plants, and oil and gas processing facilities around the world. We specialize in the design, manufacture and distribution of highly engineered valves, pumps, sophisticated electronics and related products that regulate the flow of liquid, gases and vapors in severe service environments.

CURTISS-WRIGHT CORPORATION 3
Flow Control supplies a diverse set of products and services to the oil and gas processing market, including safety relief valves, specialized pumps, process safety management software and accessory and field repair services. The level of maintenance capital spending is a key driver of this market, as well as the need
for technology improvements for plant flexibility, reliability, production and compliance with environmental regulations. In addition, global demand for fuel is requiring increased processing capacity.
DeltaValve’s revolutionary valve has achieved a 20% worldwide market share.
Smart, leakless valves designed for the processing industry provide a cost-effective solution for jet-fuel pumping on aircraft carriers.
50%balancebetweenmilitaryand
commercialmarkets

4 CURTISS-WRIGHT CORPORATION
many of our technologies ultimately have commercial market appeal. Bridging the chasm between stringent and unique government requirements and the cost limitations of the commercial market is no small task, but we have successfully paired our innovative technologies with competitive commercial marketing strategies to develop significant niche positions in the energy and industrial markets.
Nearly 50% of Flow Control’s business is defense, related to the U.S. Navy’s submarine and aircraft carrier programs. Our Electro-mechanical Systems division is a world leader in the design and manufacture of the most advanced critical function pumps, turbine motors and generators for nuclear propulsion systems. Our Control Systems division provides electronic instrumentation and control systems. And our Valve division provides critical function valves that are innovative, safe and absolutely reliable.
DElIVERING mISSION-CRITICAl SOlUTIONS
AdvancedArrestingGear technology uses a more efficient electromagnetic control system to capture an aircraft on the deck of an aircraft carrier.
17%growthinmilitarybusinessdrivenbysubmarineandaircraftcarrierprograms
FLOwCONTROL

CURTISS-WRIGHT CORPORATION 5
Flow Control has achieved significant growth in the commercial nuclear power market. As demand for energy continues to increase, more emphasis on advanced technologies will continue to fuel this market. In the United States, growth will come from plant life extensions and facility upgrades to the 103 nuclear power plants. longer term, the nuclear power market has significant growth potential due to the anticipated construction of new power plants both domestically and internationally.
In the commercial power market, our Electro-mechanical Systems and Valve divisions are able to provide critical function pumps, turbine motors, generators and valves. Additionally, we continually focus on new product innovations, such as the Technofast HydraNut,® which can improve operational integrity and reduce overall maintenance time, resulting in a considerable cost saving to the customer.
HydraNut® offers superior integrity and reduced maintenance time on all critical high-temperature bolting applications.
23%salesgrowthincommercialtechnologies

6 CURTISS-WRIGHT CORPORATION
mOTION CONTROl: ExPANDING INTO COmPlEmENTARY mARKETS
20%salesgrowthdrivenbybothmilitaryandcommercialmarkets
Through three divisions, Engineered Systems, Embedded Computing and Integrated Sensing, we provide motion control components and integrated subsystem solutions for aerospace, defense and industrial applications worldwide. Our products integrate complex elements for maximum performance and efficiency, setting industry standards in the areas of flight control, utility actuation, sensors and electronic computing systems. Technical innovation, superior product quality and customer satisfaction remain our core strengths as we meet the challenges of the future.
From an F-22 to a commercial jet, Curtiss-Wright’s motion Control segment provides technology solutions that enable the most advanced aircraft around the world today. On the ground, our electronic controls and actuation products increase the capabilities and extend the life of military armored vehicles. And on the high seas, our shipboard recovery systems assure safe and reliable helicopter landings and maneuvering under the most adverse weather conditions.

CURTISS-WRIGHT CORPORATION 7
EngineeredSystemsspecializes in high-end electromechanical and hydromechanical components and systems for the aerospace, defense and industrial markets. Our global capabilities in flight controls, utility actuation, repair and overhaul services, drive technology and naval aviation handling systems can be customized as individual components or fully integrated systems to meet high-volume demands or niche requirements.
In 2005, we expanded our market share on new platforms such as the Boeing 787, extended existing customer relationships, and penetrated new markets in regional/business jets, helicopters and ground defense. Additionally, our acquisition of Indal Technologies provides us with state-of-the-art shipboard helicopter landing systems. These technologies are highly complementary and provide strategic access to worldwide naval customers.
Our helicopter recovery systems are able to accommodate a wide range of helicopters and ships, even in the most demanding marine environments.
Navies around the world rely on our helicopter recovery systems that fully integrate all of the functions required to safely operate and stow large shipborne helicopters.
16%growthincommercialaerospacesales

8 CURTISS-WRIGHT CORPORATION
We are at the forefront of state- of-the-art platforms, such as unmanned aerial vehicles like the Global Hawk for which we provide the mission management computers. On current forces, modernization through integration of advanced electronics remains robust. Providing proprietary retrofit and upgrade embedded computing solutions, our products are enabling advanced electronics for communication, ordnance and munitions deployment.
EmbeddedComputingsupplies major systems integrators with open architecture, commercial and rugged grade computing solutions that span board level products to integrated subsystems. Advanced technologies include high-speed I/O, high density computing, specialized chassis design, custom and component engineering services, graphic solutions and full life-cycle support. With over 300 customers and more than 500 programs, we have a diversified market base in military aerospace, land and naval platforms.
SOPHISTICATED OPERATIONS: lAND, SEA AND AIR
45%salesareforfielded
platforms
As military programs require advanced, rugged electronics, customized solutions provide life-cycle extensions to existing platforms.
MOTIONCONTROL
Aiming and stabilization equipment is critical to the performance of ground vehicles like the Abrams, Bradley and Stryker.

CURTISS-WRIGHT CORPORATION 9
From tractors and forklifts to structural monitoring of buildings and bridges, joystick controllers and position sensors are used extensively in the industrial markets.
IntegratedSensingSystems integrators and platform manufacturers turn to us for solutions that are as cost effective as they are cutting edge. Today’s marketplace demands fewer suppliers and higher levels of integration. The ability to offer a “product suite” has uniquely positioned Curtiss-Wright to meet this challenge. Our products and subsystems are designed for unsurpassed functionality and reliability, and manufactured with precision.
Our advanced technologies are concentrated on flight controls in the military and commercial aerospace markets, and augmented by niche industrial markets. Rotary and linear position sensors support automotive assembly, vehicle performance and testing. Joysticks and position sensors control leisure rides and virtual reality simulators. Our faders and controllers are the premier choice for sound and vision console manufacturers. Where quality, precision and reliability are critical, Curtiss-Wright’s success is evident.
13%salesin
industrialequipment

mETAl TREATmENT: ENHANCING PERFORmANCE IN CRITICAl APPlICATIONS
�0 CURTISS-WRIGHT CORPORATION
11%organic
salesgrowth
Through a network of 58 facilities in North America and Europe, metal Treatment provides four primary technologies: shot peening, laser peening, specialty coatings and heat treating.
The advanced technologies of Curtiss-Wright’s metal Treatment segment enhance the performance and extend the life of critical components by helping to prevent fatigue and corrosion failures. This enables component designs to achieve their maximum potential. metal Treatment is a world leader in providing these precision metal surface treatments for aerospace, automotive, defense, energy and general industrial markets.

CURTISS-WRIGHT CORPORATION ��
laser peening is a state-of-the-art metal surface treatment developed internally and in conjunction with lawrence livermore National laboratory. During this process, a laser beam is fired to generate ultra-high pressure pulses on the surface of a metal part. These pulses create shock waves that travel into the metal and compress it at the molecular level. multiple strikes by the laser in a pattern
impart a layer of residual compressive stress on the surface of the part that is four times deeper than that attainable from conventional peening treatments. These deeper levels of compressive stress provide greater protection from fatigue and corrosion failures, extending the useful life of the component.
Primary shot peening of aerospace applications include turbine engines and highly stressed structural components for commercial and military aircraft.
38%salesin
commercialaerospacemarket
The new mobile laser enables field application of the laser peening technology.

�2 CURTISS-WRIGHT CORPORATION
is a precision thermal treatment process that can control the ultimate strength and hardness of a metal and also relieve any internal stresses in fabricated metal parts.
Shot peening and specialty coatings are utilized to protect highly stressed engine and transmission components in ground transportation applications, including passenger automotive vehicles as well as over-the-road trucks, construction and agriculture vehicles. Heat treating
ACHIEVING GROWTH IN COmmERCIAl mARKETS
30%salesinautomotive
market
Metal treatment processes protect critical components in aerospace and ground transportation markets.
METALTREATMENT

CURTISS-WRIGHT CORPORATION �3
We shot peen form the wing skins of all Airbus A320, A330, A340 and A380 aircraft. Small, round metal “shot” is selectively directed at appropriate areas of the aluminum wing skin to impart compressive stresses that bend, stretch and shape the wing skins. Besides having the proper shape to fit onto the wing assembly,
the finished wing skin will have beneficial compressive stresses over its entire surface that will inhibit fatigue and stress corrosion cracking of the wing.
21%growth in
commercial aerospace market
Precision-formed wing skins are critical to ensuring ease of wing assembly and achieving optimum aerodynamic performance.

�4 CURTISS-WRIGHT CORPORATION
For nearly a century, Curtiss-Wright has set the standard for disciplined corporate
management, even as we have made strategic investments to foster innovation and
support the company’s long-term growth and prosperity.
That tradition continued in 2005, as we reported another year of strong sales and
profitability. It was a landmark year for the company. We exceeded $1 billion in revenue
while maintaining our focus on achieving growth across diverse markets. This impressive
performance is due in large measure to the dedication and commitment of our 6,000
employees, as well as the solid relationships we have forged with our customers by
setting a benchmark for excellence unmatched within the industries we serve.
HEALTHYFINANCIALRESULTS
By every measure, we enjoyed excellent financial results in 2005, enabling us to strengthen
our balance sheet, return higher dividends to shareholders and still make the necessary
investments in our future to continue offering leading-edge products and services. In a
year with relatively few acquisitions, we achieved sales of $1.13 billion, an increase of
18% over 2004, as operating income increased 25% to $138 million. Our net earnings of
$75 million, or $3.44 per diluted share, rose 16% over 2004. We also received new orders
of $1.26 billion in 2005, an increase of 26% from the previous year, and our year-end
backlog increased 28% to a new record high of $806 million, providing solid momentum
going into 2006.
SHAREHOLDERLETTER
Martin R. BenanteChairman and Chief Executive Officer
• To remain at the forefront of highly engineered, technological innovations
• To continue to meet the demands of the defense, commercial aerospace and energy markets by delivering the highest quality products and most reliable solutions
• To provide the greatest possible value to our shareholders
• To attract the best and brightest employees and maintain a culture of excellence and growth
• To uphold the legacy of Curtiss-Wright and its founders by maintaining world-class performance across all business segments
THECURTISS-wRIGHTCOMMITMENT

CURTISS-WRIGHT CORPORATION �5
This performance reflects overall organic sales growth of 8%, supported by strong
showings from each of our segments, as well as the contribution from acquisitions made
in 2004 and 2005. Operating income was driven by overall organic growth of 21%, which
included double-digit organic growth in each segment. Continued strength in the U.S.
economy and the global commercial aerospace industry were key drivers of the positive
results demonstrated within our commercial businesses. In addition, U.S. military
spending remained steady as we successfully solidified our position on key programs.
SHAREHOLDERVALUE
Over the past year, we completed several initiatives designed to benefit our shareholders.
In may 2005, we recapitalized our dual-class stock structure into a single class of common
stock, providing a simplified capital structure and attracting new investors.
In November 2005, the quarterly dividend was increased by 33% to $0.12 per share. most
recently, in February 2006, the Board of Directors authorized a 2-for-1 stock split, doubling
the number of shares outstanding and encouraging increased trading activity. These
actions reflect our confidence in the company’s ability to deliver consistently positive growth
in revenue, profitability and cash flow in the years ahead.
OURDIVERSEMARKETPLACE
Our business is focused on providing advanced technological solutions across diverse
markets, and much of our success is influenced by broader economic issues including
demand within the commercial aerospace industry, defense spending and worldwide
energy consumption.
Growth in commercial aviation was driven by a surging demand in Asia and the middle
East and a rise in low-cost air carriers worldwide. Curtiss-Wright’s market position
strengthened in alignment with our role as a valued supplier to both Boeing and Airbus
and we believe production will continue to increase for both companies in 2006, even as
the spares, repair and overhaul markets remain extremely healthy.
In the defense sector, the growth in military spending is expected to slow somewhat in
the coming year. Fortunately, our portfolio spans a wide array of critical naval, aerospace
and ground defense programs, and our Flow Control and motion Control segments
remain extremely well-positioned across a range of platforms, including the CVN-21 next-
generation aircraft carrier, the Virginia Class submarine program, the DD(x) Destroyer,
the F-22, the V-22, the Black Hawk Helicopter program, the Bradley Fighting Vehicle, the
Abrams Tank and the Stryker mobile Gun System. We also continue to participate in
development projects such as the F-35 Joint Strike Fighter, the P-8A multi-mission
maritime Aircraft and Unmanned Aerial Vehicle programs.
�6 CURTISS-WRIGHT CORPORATION
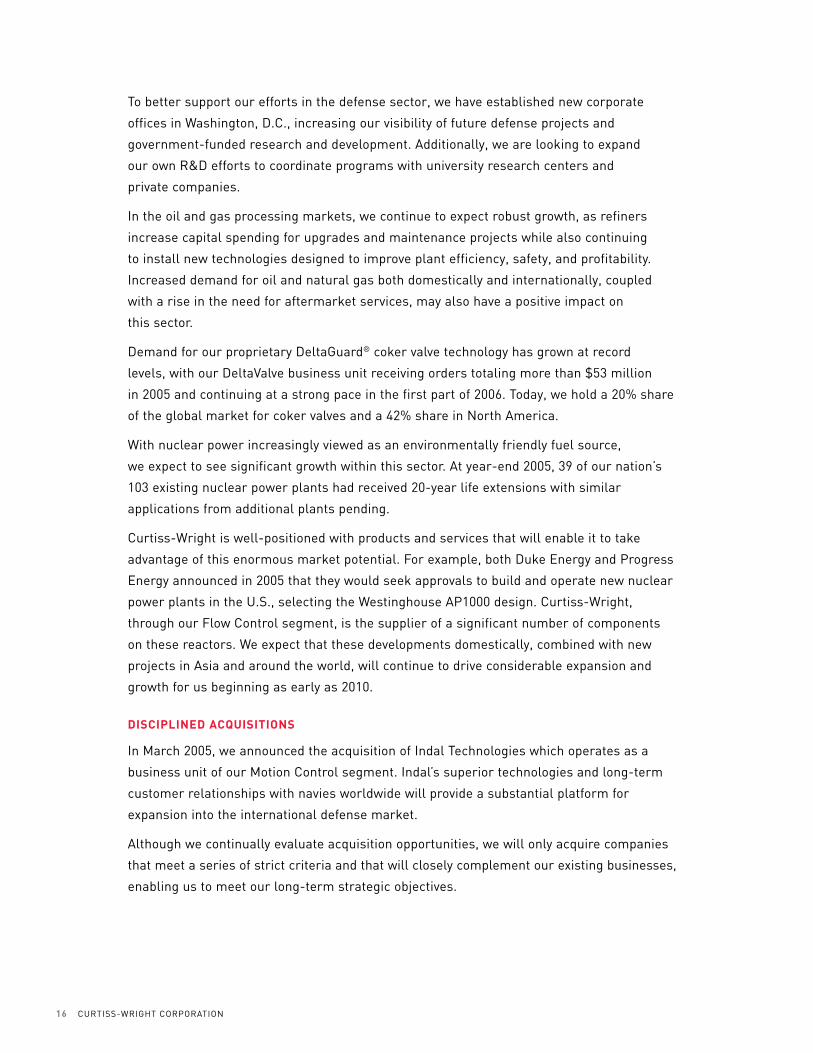
To better support our efforts in the defense sector, we have established new corporate
offices in Washington, D.C., increasing our visibility of future defense projects and
government-funded research and development. Additionally, we are looking to expand
our own R&D efforts to coordinate programs with university research centers and
private companies.
In the oil and gas processing markets, we continue to expect robust growth, as refiners
increase capital spending for upgrades and maintenance projects while also continuing
to install new technologies designed to improve plant efficiency, safety, and profitability.
Increased demand for oil and natural gas both domestically and internationally, coupled
with a rise in the need for aftermarket services, may also have a positive impact on
this sector.
Demand for our proprietary DeltaGuard® coker valve technology has grown at record
levels, with our DeltaValve business unit receiving orders totaling more than $53 million
in 2005 and continuing at a strong pace in the first part of 2006. Today, we hold a 20% share
of the global market for coker valves and a 42% share in North America.
With nuclear power increasingly viewed as an environmentally friendly fuel source,
we expect to see significant growth within this sector. At year-end 2005, 39 of our nation’s
103 existing nuclear power plants had received 20-year life extensions with similar
applications from additional plants pending.
Curtiss-Wright is well-positioned with products and services that will enable it to take
advantage of this enormous market potential. For example, both Duke Energy and Progress
Energy announced in 2005 that they would seek approvals to build and operate new nuclear
power plants in the U.S., selecting the Westinghouse AP1000 design. Curtiss-Wright,
through our Flow Control segment, is the supplier of a significant number of components
on these reactors. We expect that these developments domestically, combined with new
projects in Asia and around the world, will continue to drive considerable expansion and
growth for us beginning as early as 2010.
DISCIPLINEDACQUISITIONS
In march 2005, we announced the acquisition of Indal Technologies which operates as a
business unit of our motion Control segment. Indal’s superior technologies and long-term
customer relationships with navies worldwide will provide a substantial platform for
expansion into the international defense market.
Although we continually evaluate acquisition opportunities, we will only acquire companies
that meet a series of strict criteria and that will closely complement our existing businesses,
enabling us to meet our long-term strategic objectives.

CURTISS-WRIGHT CORPORATION �7
PASSINGTHETORCH
We announced in June the retirement of our long-time colleague and good friend,
George Yohrling, as president of our motion Control segment. During his tenure, George
transformed motion Control into a premier global supplier of electronics and engineering
systems, while continuously growing the company’s revenues and profits.
A long-time veteran of Curtiss-Wright, George began his career with the company as a
manufacturing manager in Fairfield, N.J., and after serving in a variety of management
positions was named general manager of our motion Control facility in Shelby, N.C., in
1985. Under his stewardship, the business grew to serve a wide range of markets within
commercial and military aerospace, ground defense and general industry. We will all
greatly miss George and wish him the best in his next endeavor. Curtiss-Wright will continue
to reap the benefits of his compassion, vision and leadership for many years to come.
STAYINGTHECOURSE
In December 2005, we successfully completed a $150 million follow-on Senior Note offering
that expands our long-term capital base, enabling us to continue pursuing our corporate
growth strategies. In 2005, free cash flow was $62 million, representing cash conversion of
83%. Our current liquidity provides us with the flexibility to continue our acquisition program
of strategic, niche businesses that broaden our technological capabilities, product offerings
and market penetration.
LOOKINGAHEAD
As I look ahead to 2006, I see a company strongly positioned across nearly every segment
of our business—in both defense and commercial markets. The key to our ongoing
success will be our ability to remain strongly focused on the fundamentals that have
brought us to where we are today—strategic growth, operational excellence and market
leadership—while we continue to invest in the people, the technologies and the innovations
that will successfully take us into the future.
On behalf of myself and our Board of Directors, I would like to express my appreciation
to our employees for their loyalty, dedication and hard work; to our customers for their trust
and commitment to being true business partners; and to our shareholders for their
continuing confidence in our business model and management team.
From where I sit, I see nothing but good things ahead for this organization, and I could not
ask for a better team to help bring us to the next level of greatness.
martin R. Benante
Chairman and Chief Executive Officer

�8 CURTISS-WRIGHT CORPORATION
DIRECTORSANDOFFICERS
DIRECTORS
Martin R. Benante Chairman of the Board of Directors James B. Busey IVAdmiral, U.S. Navy (Ret.)Director, Mitre CorporationDirector, Texas Instruments, Inc.Former President and Chief Executive Officer of AFCEAInternational Aviation Safety and Security Consultant
S. Marce FullerFormer President and Chief Executive Officer of Mirant Corporation, Inc. (formerly known as Southern Energy, Inc.)Director, Earthlink, Inc.
David LaskyFormer Chairman and Chief Executive Officer of Curtiss-Wright Corporation
Carl G. MillerFormer Chief Financial Officer of TRW, Inc.
William B. MitchellDirector, Mitre CorporationFormer Vice-Chairman of Texas Instruments Inc.
John R. MyersFormer Chairman and Chief Executive Officer of Tru-Circle CorporationManagement ConsultantFormer Chairman of the Board of Garrett Aviation Services
Dr. William W. SihlerRonald E. Trzcinski Professor of Business AdministrationDarden Graduate School of Business AdministrationUniversity of Virginia
J. McLain StewartDirector, McKinsey & Co. Management Consultants
OFFICERS
Martin R. Benante Chairman and Chief Executive Officer
David C. AdamsVice President
Edward BloomVice President
David J. LintonVice President
Glenn E. TynanVice President — Finance andChief Financial Officer
Michael J. DentonVice President — Corporate Secretary and General Counsel
Harry JakubowitzTreasurer
Kevin M. McClurgCorporate Controller

CURTISS-WRIGHT AND SUBSIDIARIES 19
FINANCIAL STATEMENTS
20 Quarterly Results of Operations
20 Consolidated Selected Financial Data
21 Management’s Discussion and Analysis of Financial Condition and Results of Operations
25 2005 Segment Performance
34 Quantitative and Qualitative Disclosures about Market Risk
35 Report of the Corporation
35 Management’s Annual Report on Internal Control Over Financial Reporting
36 Report of Independent Registered Public Accounting Firm
37 Report of Independent Registered Public Accounting Firm
38 Consolidated Financial Statements
42 Notes to Consolidated Financial Statements
66 Corporate Information
20 CURTISS-WRIGHT AND SUBSIDIARIES
FORWARD-LOOKING STATEMENTS
This Annual Report contains not only historical information but alsoforward-looking statements regarding expectations for future perfor-mance of the Corporation. Forward-looking statements involve riskand uncertainty. Please refer to the Corporation’s 2005 Annual Report
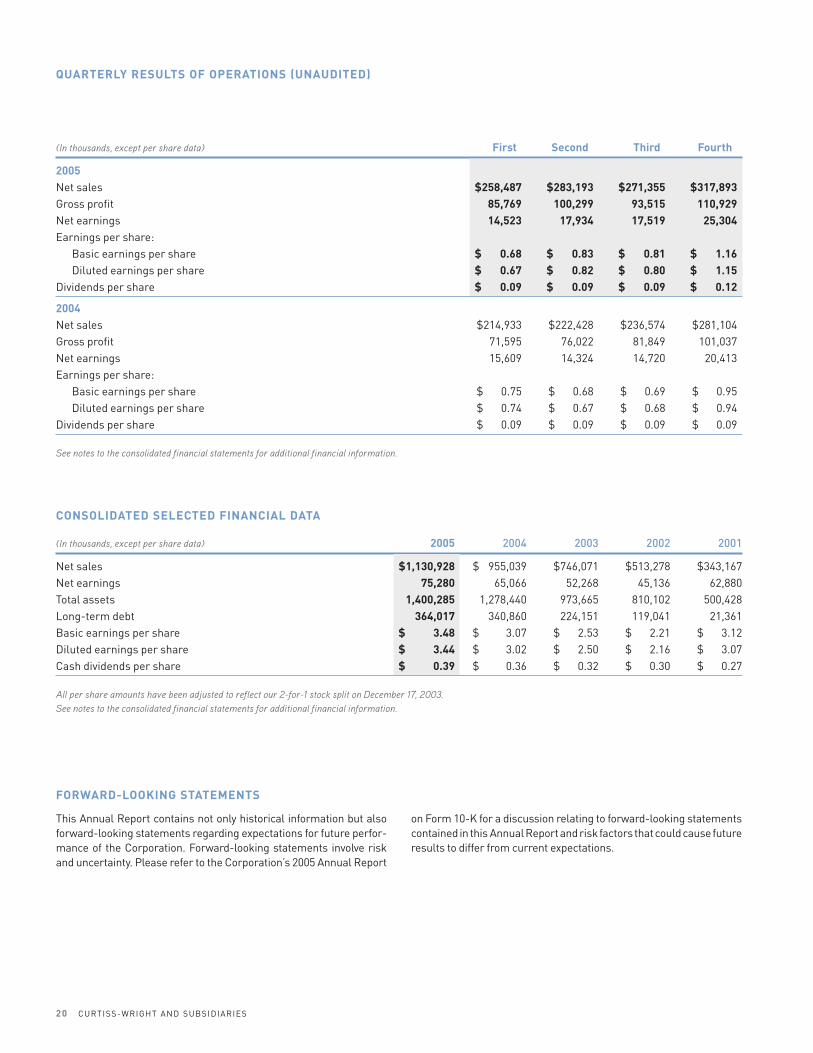
(In thousands, except per share data) First Second Third Fourth
2005Net sales $258,487 $283,193 $271,355 $317,893Gross profit 85,769 100,299 93,515 110,929Net earnings 14,523 17,934 17,519 25,304Earnings per share:
Basic earnings per share $ 0.68 $ 0.83 $ 0.81 $ 1.16Diluted earnings per share $ 0.67 $ 0.82 $ 0.80 $ 1.15
Dividends per share $ 0.09 $ 0.09 $ 0.09 $ 0.12
2004Net sales $214,933 $222,428 $236,574 $281,104Gross profit 71,595 76,022 81,849 101,037Net earnings 15,609 14,324 14,720 20,413Earnings per share:
Basic earnings per share $ 0.75 $ 0.68 $ 0.69 $ 0.95Diluted earnings per share $ 0.74 $ 0.67 $ 0.68 $ 0.94
Dividends per share $ 0.09 $ 0.09 $ 0.09 $ 0.09
See notes to the consolidated financial statements for additional financial information.
CONSOLIDATED SELECTED FINANCIAL DATA
(In thousands, except per share data) 2005 2004 2003 2002 2001
Net sales $1,130,928 $ 955,039 $746,071 $513,278 $343,167Net earnings 75,280 65,066 52,268 45,136 62,880Total assets 1,400,285 1,278,440 973,665 810,102 500,428Long-term debt 364,017 340,860 224,151 119,041 21,361Basic earnings per share $ 3.48 $ 3.07 $ 2.53 $ 2.21 $ 3.12Diluted earnings per share $ 3.44 $ 3.02 $ 2.50 $ 2.16 $ 3.07Cash dividends per share $ 0.39 $ 0.36 $ 0.32 $ 0.30 $ 0.27
All per share amounts have been adjusted to reflect our 2-for-1 stock split on December 17, 2003.See notes to the consolidated financial statements for additional financial information.
on Form 10-K for a discussion relating to forward-looking statementscontained in this Annual Report and risk factors that could cause futureresults to differ from current expectations.
QUARTERLY RESULTS OF OPERATIONS (UNAUDITED)

Company OrganizationOur Management’s Discussion and Analysis of Financial Condition andResults of Operations begins with an overview of our company, fol-lowed by economic and industry-wide factors impacting our companyand the markets we serve, a discussion of the overall results of oper-ations, and finally a more detailed discussion of those results withineach of our reportable operating segments.
Curtiss-Wright Corporation is a diversified, multinational provider ofhighly engineered, technologically advanced, value-added productsand services to a broad range of industries in the motion control, flowcontrol, and metal treatment markets. We are positioned as a marketleader across a diversified array of niche markets through engineer-ing and technological leadership, precision manufacturing, and strongrelationships with our customers. We provide products and services toa number of global markets, such as defense, commercial aerospace,commercial power, oil and gas, automotive, and general industrial. We
have achieved balanced growth through the successful application ofour core competencies in engineering and precision manufacturing,adapting these competencies to new markets through internal prod-uct development and a disciplined program of strategic acquisitions.Our overall strategy is to be a balanced and diversified company, lessvulnerable to cycles or downturns in any one business sector, and toestablish strong positions in profitable niche markets. Approximately50% of our revenues are generated from defense-related markets.
We manage and evaluate our operations based on the products andservices we offer and the different industries and markets we serve.Based on this approach, we have three reportable segments: FlowControl, Motion Control, and Metal Treatment. For further informationon our products and services and the major markets served by ourthree segments, please refer to the inside cover of this Annual Report.The following charts represent our sales by market for 2005 and 2004:
MANAGEMENT’S DISCUSSION AND ANALYSIS OF FINANCIAL CONDITION AND RESULTS OF OPERATIONS
CURTISS-WRIGHT AND SUBSIDIARIES 21
ECONOMIC AND INDUSTRY-WIDE FACTORS
Overall, 2005 was a good year for Curtiss-Wright. Many of the key dri-vers of our business, such as the U.S. economy and the globalcommercial aerospace industry, improved. In addition, U.S. militaryspending levels remained steady and our commercial marketsstrengthened. Looking forward, however, many factors could impactour future performance, including future defense spending in the U.S.,changes in global gross domestic product, volatility of the geopoliticallandscape, and the pace of global economic activity.
GENERAL ECONOMY
Many of our industrial businesses are driven in large part by growth ofthe U.S. Gross Domestic Product (“GDP”). Based upon certain eco-nomic reports, the U.S. economy’s output (real GDP) is expected togrow at a modest rate of approximately 3.3% in 2006, lower than the4% experienced in 2005. GDP is expected to grow at 3.5% in the firsthalf and 3.1% in the second half of 2006. This forecast is predicatedon the assumption that oil prices stabilize in 2006. On the positive side,inflation is expected to moderate in 2006. The consumer price index(a broad indicator of inflation) is expected to be approximately 2.3% in2006, down from 3.5% in 2005. If these conditions were to occur, it mayprompt the U.S. Federal Reserve to curtail its current program ofraising interest rates in 2006. According to some economic reports,
interest rates are expected to rise slightly in the beginning of 2006 andthen stabilize. Stabilized interest rates should lead to increased spend-ing and investment in the business sector. Unemployment is expectedto drop slightly and remain below 5% in 2006, as the business sectorexpands after a period of underinvestment in both human and indus-trial capital. Also, global GDP growth is expected to slow down in 2006,decreasing from 4.4% in 2005 to approximately 4% in 2006, primarilydue to higher energy prices and tighter monetary polices. Higherenergy costs in 2005 affected all of our operating segments, but theywere more significant within our Metal Treatment segment.
Approximately 25% of our business is outside the U.S. and subject tocurrency fluctuations in both transactions in foreign currencies as wellas translation from local country currencies to the U.S. dollar.Although we seek to mitigate these fluctuations through hedging pro-grams, there is no guarantee that our hedging efforts will offset thepossible adverse impacts of the currency fluctuations.
It appears that, at least in the U.S., 2006 is expected to mark the fifthconsecutive year of economic expansion, fueled primarily by strongspending in the business sector; however, we remain cautiously opti-mistic that this expansion will continue in the near term. To the extentthat it does, our businesses that are largely economic driven, and servethe commercial aerospace, oil and gas, and general industrial markets,
Defense Aerospace14%
Defense Aerospace15%
Power Generation11% Power Generation
11%Oil & Gas10%
Oil & Gas9%Defense Ground
8%Defense Ground9%
CommercialAerospace17%
CommercialAerospace17%
Other16%
Other17%
Defense Navy24% Defense Navy
22%
2005 Sales by Market 2004 Sales by Market2005 Sales by Market 2004 Sales by Market

particularly our Metal Treatment segment, are well positioned to ben-efit from increased economic strength.
DEFENSE
Approximately 50% of our business is in the military sector, predomi-nantly in the U.S., characterized by long-term programs and contractsdriven primarily by the U.S. Department of Defense (“DoD”) budget. Wealso participate in several non-U.S. military programs which, althoughnot as significant as our domestic military business, are subject to theuncertainty resulting from the changing geopolitical climate aroundthe world.
The DoD budget reflects growing cost pressure to support the globalwar on terrorism, including supporting the current military operationsin both Iraq and Afghanistan, and initiatives aimed at transforming andmodernizing its current military platforms and capabilities. The wareffort has benefited us again in 2005 with higher spares sales to theU.S. Army. The fiscal 2006 DoD procurement budget reflects a 4.8%overall increase over fiscal 2005. The 2006 budget includes continuedinvestment funding for key programs supportive of transformation ini-tiatives, but it is balanced with increased spending for modernizationand upgrading of existing equipment in support of current global oper-ations and requirements. We anticipate future DoD spending to pro-duce increased investment specifically for unmanned vehicles, toprovide stability to the shipbuilding industry while transforming theU.S. Navy fleet, and for electronics for military hardware necessary toupgrade existing platforms and facilitate “network centric warfare”systems, all as part of the military’s transformation plans. Militarytransformation initiatives are providing funding for advanced tech-nologies to support new and enhanced military platforms. We areinvolved in several major developmental contracts for our advancedtechnologies, which support potential future military programs.
Our Flow Control and Motion Control segments are well positioned onmany high performance defense platforms, including the CVN-21next-generation aircraft carrier, the Virginia Class nuclear submarineprogram, the DD(X) Destroyer, the F-22, the V-22, the JSF andUnmanned Aerial Vehicle programs, such as the Global Hawk. Basedon our reputation and past performance, we are involved in many of thefuture military systems that are currently in development. However,continued cost concerns could lead to extensive review of criticaldefense programs, which may have an impact on DoD budget levelsgoing forward, as could many other factors such as overall budgetdeficit levels and geopolitical uncertainty.
There is the possibility that defense spending may decrease in thefuture, which could adversely affect our operations and financial con-dition. While DoD funding fluctuates year-by-year and program-by-program, the primary risk facing us would be the termination of amajor program. Other than the possible reduction in the F-22 program,which is not considered material to us as a whole, we are not aware ofany potential material program termination for which we have content.If a material program were to be terminated, the termination processtakes several years to wind down, which may provide us ample time toreact before any potential impact occurs. Although we monitor thebudget process as it relates to programs in which we participate, wecan not predict the ultimate impact of future DoD budgets on us. Inaddition, there are other risks associated with our defense businesses,such as failure of a prime contractor customer to perform on acontract, pricing and/or design specifications that may not always be
finalized at the time the contract is bid, and the failure and/or inabilityof certain sole source suppliers to provide us product, any of whichcould have an adverse impact on our financial performance. Whilealternatives could be identified to replace a sole source supplier, atransition could result in increased costs and manufacturing delays.
Our outlook for our defense business remains positive for the near tointermediate term.
COMMERCIAL AEROSPACE
Approximately 17% of our business serves the global commercialaerospace industry. Global airline traffic is one of the primary driversfor long-term growth in the commercial aerospace industry, and eco-nomic growth is one of the primary drivers of global airline trafficdemand. Based on industry reports, global passenger traffic grewapproximately 7% in 2005 and is expected to grow less than 5% in 2006.High fuel costs, security concerns, and stiff competition, especiallyfrom low-cost airlines, have continued to place profitability pressureon airlines, which continues to slow procurement of new aircraft andextend maintenance schedules. Fuel prices are expected to stabilize in2006, which, combined with continued global economic growth, shouldstimulate procurement of new aircraft, a key driver of our commercialaerospace business. In fact, the two major global aircraft manufactur-ers experienced record order and backlog levels in 2005 and are pro-jecting a healthy 20% increase in deliveries in 2006. The impact to ourcommercial aerospace business is determined by production levelswhich, based upon the above and other market data, should be healthyin 2006. Our Motion Control segment is a provider of OEM aerospacecomponents and systems, and repair and overhaul services, while ourMetal Treatment segment provides services to aircraft manufacturers.Both segments experienced solid sales growth in 2005 to this market.While the emergence of low cost carriers and improved economic con-ditions have contributed to this industry’s recovery, concerns still existregarding the financial weakness of many airlines, continued high fuelprices, and the threat of another major terrorist attack, any of whichcould have an adverse impact on this industry and our operatingresults and financial position.
We anticipate continued improvement in the commercial aerospacemarket in 2006. We are well positioned on a number of commercialaerospace platforms and should benefit from improvement in thisindustry, which is expected to occur over the next couple of years.
POWER GENERATION
There are several factors that might precipitate an expansion in com-mercial nuclear power, including increasing attention to environmen-tal issues, a pro-nuclear U.S. political leadership, and continuedgrowth in global demand for power. Nuclear power has minimal impacton the environment, is one of the most economical forms of generat-ing electricity, and decreases dependence on oil and gas imports. TheU.S. depends on foreign sources for about half of its total energy needs.Because of increased demand for and limited supply of energy in theU.S., we anticipate that the nuclear power industry will continue toexpand in the coming years.
The U.S. nuclear power industry is expected to grow primarily becausemost of the 103 existing nuclear power plants have applied for or willbe applying for plant life extensions, as required by current regula-tions. As of December 31, 2005, approximately 39 plants have received20 year life extensions, applications from 10 additional plants have
22 CURTISS-WRIGHT AND SUBSIDIARIES
been submitted and are pending approval, and letters of intent to applyhave been received from 27 more plants. In addition, Duke Energy andProgress Energy each announced in 2005 that they intend to apply tothe Nuclear Regulatory Commission for a combined construction andoperating license (COL) for new nuclear power generation in the U.S.Both companies have selected the Westinghouse AP1000 reactordesign for their new power plant construction. Curtiss-Wright, throughits Flow Control segment, has significant content on the AP1000 reac-tor. If approved, construction could begin as early as 2010. Internation-ally, China intends to expand its nuclear power capabilities significantlythrough the construction of new nuclear power plants over the nextseveral years. It is currently in the process of selecting a reactor design,which has been narrowed down to the Westinghouse AP1000 and ArevaEPR designs. A decision is expected in 2006. These developments, com-bined with new plant construction in other parts of Asia and rest of theworld, are expected to drive expansion in this industry.
Our Flow Control segment is well positioned to take advantage of thisexpansion. The recent history of plant life extension approvals in theU.S. and continued strong build programs in Asia are encouraging.However, there is no guarantee that the nuclear alternative will con-tinue to be fully endorsed in the U.S. and other parts of the world, orthat the Nuclear Regulatory Commission will authorize the construc-tion of new facilities in the U.S. In addition, the geopolitical climate isvolatile and could impact future nuclear plant construction levelsaround the world.
OIL AND GAS
The most prevalent drivers that impact this market include capitalspending for new construction and upgrades to comply with environ-mental regulations and maintenance spending to retrofit existingfacilities with improved equipment and technologies to increaseplant flexibility, reliability, production, safety, and profitability. Addi-tionally, increased demand for oil and natural gas, both domesticallyand internationally from emerging economies, and increased demandfor aftermarket services may also positively impact this market goingforward. We experienced strong sales growth to this market, drivenmainly by record orders for our coker valve product.
The current outlook for the petroleum markets is tempered. Accord-ing to market data, the recent steady increase in crude oil and petro-leum product prices is expected to slow and possibly decline slightly.Many of the same factors that drove world oil markets in 2005, such aslow production capacity and rapid demand growth, are expected tocontinue to affect markets in 2006. Other factors, such as the frequencyand intensity of hurricanes, other extreme weather, and geopoliticalinstability may also continue to affect this market. Global demand isexpected to increase in 2006, primarily due to an increase in the U.S.from a net decline in 2005 as well as economic growth in developingAsian countries. Global production capacity is expected to increase in2006 and 2007, which should moderate the global oil price increasesexperienced over the past two years. U.S. production in 2005 was downdue to the impact of the severe hurricane season. Refining marginshave remained relatively high despite higher crude oil prices, whichcombined with increased global petrochemical production and contin-ued global economic growth, should lead to increased investment andcapital spending by the refineries in 2006 and beyond.
Based upon market data, capital expenditures in the processing indus-tries are expected to increase over the next few years. Long-term
global forecasts project a solid increase in sales of flow control prod-ucts (valves, pumps, motors) to the processing industries. As the worldcontinues to depend on natural resources, oil exploration deepens, andtransport requirements widen, we anticipate additional opportunitiesto provide our flow control products to meet these challenges. The pro-posed and enacted environmental regulations in the U.S. and otherdeveloped countries could drive increased demand for flow controlproducts by as much as 8 to 10% over the next few years. However, wecannot predict whether certain economic recoveries can be sustained,whether anticipated future environmental regulatory changes will beenacted, or how such regulatory changes may impact this industry.
Results of OperationsANALYTICAL DEFINITIONS
Throughout management’s discussion and analysis of financial condi-tion and results of operations, the terms “incremental” and “base” areused to explain changes from period to period. For full year reportingpurposes, acquisitions remain segregated for two calendar years. Theremaining businesses are referred to as the “base” businesses, andgrowth in these base businesses is referred to as “organic.” An acqui-sition is considered base when the reporting year includes fully com-parable current and prior-year data. Therefore, for the year endedDecember 31, 2005, our organic growth of the base businessesexcludes all acquisitions since January 1, 2004. The term “incremen-tal” is used to highlight the impact acquisitions had on the current yearresults, for which there was no comparable prior-year period.
YEAR ENDED DECEMBER 31, 2005 COMPARED WITH YEAR ENDED DECEMBER 31, 2004
For the year ended December 31, 2005, we recorded consolidated netsales of $1,130.9 million and net earnings of $75.3 million, or $3.44 perdiluted share. Sales for 2005 increased 18% over 2004 sales of $955.0million. Net earnings for 2005 increased 16% from 2004 net earningsof $65.1 million, or $3.02 per diluted share.
The increase in revenues was mainly driven by a complete year of rev-enues generated from our 2004 acquisitions, primarily Dy 4 Systems,Primagraphics, Nova Machine, Trentec, Groquip, Synergy, and EPD,and the 2005 acquisition of Indal. See Note 2 to the Consolidated Finan-cial Statements for further information regarding acquisitions. Theseacquisitions contributed $100.5 million in incremental sales in 2005(or 57% of the total sales increase from 2004). Our base businessesexperienced organic sales growth of 8% in 2005, led by the Metal Treat-ment segment, which grew organically by 11%. Our Flow Control andMotion Control segments experienced solid organic sales growth of8% and 7%, respectively.
In our base businesses, our coker valve products continue to gaincustomer acceptance, which has driven the Flow Control organic salesincrease of $22.6 million to the oil and gas market. The Motion Controlsegment experienced higher sales of our OEM and spares productsand repair and overhaul services to the commercial aerospace marketof $16.1 million, mainly due to the increased production requirementsand the continued improvement in the commercial aerospace market.Metal treatment sales of our global shot peening services increased$13.5 million, primarily in the commercial aerospace and automotivemarkets, due mainly to the continuing recovery of the global economyand customer production requirements. In addition, we experiencedorganic growth in our defense markets in both our Motion Control and
CURTISS-WRIGHT AND SUBSIDIARIES 23

Flow Control segments, which increased 2005 sales by $7.4 millionand $3.6 million, respectively, over 2004. Foreign currency translationhad a favorable impact on sales of $1.2 million in 2005 as comparedto 2004.
Operating income for 2005 totaled $138.0 million, an increase of 25%from operating income of $110.3 million in 2004. The increase is pri-marily attributed to higher sales volume, favorable mix, and previouslyimplemented cost reduction initiatives. Operating income in 2005experienced organic growth of 21% and was driven by our Metal Treat-ment and Motion Control segments, which experienced organic growthof 21% and 14%, respectively, from the prior year. Metal Treatment’sorganic operating income growth was mainly the result of higher vol-ume while Motion Control’s organic growth was due to higher volume,favorable sales mix from commercial aerospace spares and aftermar-ket services, and implemented cost control initiatives. Organic operat-ing income growth in our Flow Control segment was 10% in 2005, dueto higher volume. The contributions of the 2004 and 2005 acquisitionsamounted to $0.6 million in incremental operating income in 2005compared to 2004, keeping the overall operating segment margin flatin 2005 compared to 2004. The operating margin of our segments havebeen somewhat lower than historical levels in recent years, principallyrelated to the large number of acquisitions made since 2002. Althoughthe new acquisitions continue to have a positive effect on operatingincome, the operating margin of the overall Corporation is lower sincethe margin level of the newly acquired companies are below those ofour base businesses. We consider this to be a temporary issue thatshould be more than offset by the benefits of diversification, the imple-mentation of cost control measures, and increased future profitability.The integration of our acquisitions continues to progress as planned.In addition to having improved operating margins for almost all of ourrecent acquisitions, we have initiated programs to cross-market prod-ucts and share technologies across our businesses. Foreign currencytranslation had a favorable impact on operating income of $0.2 millionfor 2005 as compared to 2004.
In addition to the strong organic growth of the segments, we experi-enced favorable results in 2005 compared to 2004 from lower environ-mental remediation costs, which declined $4.5 million, a gain on thesale of property for $2.8 million, and lower costs associated withSarbanes-Oxley Section 404 compliance of $1.2 million. These favor-able impacts were offset by higher research and development, selling,general, and administrative expenses, mainly due to the 2004 and 2005acquisitions. In addition, we incurred additional infrastructure costs tosupport our business growth and higher pension expense.
Weincurred higher interestexpense due to higher interest rates, whichaccounted for approximately 54% of the increase, and higher debt lev-els associated with the funding of our acquisition program. Net earn-ings in 2004 included certain one-time tax benefits of $3.4 million,which primarily resulted from the change in legal structure of one ofour subsidiaries and a favorable IRS Appeals settlement.
Backlog at December 31, 2005 was $805.6 million compared with$627.7 million at December 31, 2004 and $505.5 million at December31, 2003. Acquisitions made during 2005 represented $51.9 million ofthe backlog at December 31, 2005. New orders received in 2005 totaled$1,261.2 million, which represents a 26% increase over 2004 neworders of $998.9 million and a 70% increase over new orders receivedin 2003. Acquisitions made during 2004 and 2005 contributed $115.0
million in incremental new orders received in 2005. Record orders forour flow control coker valve and strong orders for our motion controlelectronic and mechanical products drove the new order improve-ment. Our metal treatment services, repair and overhaul services, andafter-market sales, which represent approximately 25% of our totalsales for 2005, are sold with very modest lead times. Accordingly, thebacklog for these businesses is less of an indication of future sales thanthe backlog of the majority of the products and services of our MotionControl and Flow Control segments, in which a significant portion ofsales is derived from long-term contracts.
YEAR ENDED DECEMBER 31, 2004 COMPARED WITH YEAR ENDED DECEMBER 31, 2003
We recorded consolidated net sales of $955.0 million and net earningsof $65.1 million, or $3.02 per diluted share, for the year ended Decem-ber 31, 2004. Sales for 2004 increased 28% over 2003 sales of $746.1million. Net earnings for 2004 increased 24% from 2003 net earningsof $52.3 million, or $2.50 per diluted share.
The increase in revenues was mainly driven by a complete year of rev-enues generated from our 2003 acquisitions of Systran, Novatronics/Pickering, E/M Engineered Coatings Solutions, Advanced MaterialsProcess, and Collins Technology and contributions from our 2004acquisitions, primarily Dy 4 Systems, Primagraphics, Nova Machine,Trentec, Groquip, Synergy, and EPD. See Note 2 to the ConsolidatedFinancial Statements for further information regarding acquisitions.These acquisitions made in 2004 and 2003 contributed $154.2 millionin incremental sales in 2004 (or 74% of the total sales increase from2003). Our remaining base business units experienced organic salesgrowth of 7% in 2004, led by the Metal Treatment segment, whichgrew organically by 21%. The Flow Control and Motion Control seg-ments experienced solid organic sales growth of 5% and 4%, respec-tively. The organic growth in the Flow Control segment was achieved in2004 despite a decrease in overall revenue from the U.S. Navy ofapproximately $9 million.
In our base businesses, higher Metal Treatment sales of our globalshot peening, laser peening, and heat treating services of $21.8 mil-lion, higher sales of certain Flow Control products to the power gener-ation market of $15.0 million, the oil and gas industry of $6.4 million,and the defense electronics markets of $5.7 million, and higher salesof our Motion Control products to the military aerospace market of$14.7 million and commercial aerospace aftermarket services of $5.9million all contributed to the organic sales growth for 2004 comparedto 2003. These increases in our base businesses were partially offsetby lower sales of certain Flow Control products to the U.S. Navy due totiming of contractual revenues, a decrease of $14.5 million, and lowersales of motion control electronic products of $10.6 million for use inglobal ground defense markets because of the wind down on certainproduction projects. Favorable foreign currency translation had afavorable impact on sales of $15.8 million for 2004 compared to 2003.
Operating income for 2004 totaled $110.3 million, an increase of24% from operating income of $89.0 million in 2003. The increase isprimarily attributed to higher sales volume, favorable mix, andpreviously implemented cost reduction initiatives. The contributions ofour 2003 and 2004 acquisitions amounted to $11.0 million in incre-mental operating income in 2004 compared to 2003. In addition to thecontribution of these acquisitions, 2004 operating income benefitedfrom organic growth in our remaining base businesses, which
24 CURTISS-WRIGHT AND SUBSIDIARIES
CURTISS-WRIGHT AND SUBSIDIARIES 25
improved 13% overall and was driven by strong organic growth in ourMetal Treatment and Motion Control segments of 55% and 22%,respectively, from 2003. The improvement in Metal Treatment’s basebusinesses’ operating income was the result of higher volume andfavorable sales mix due to the higher laser peening sales. Theimprovement in Motion Control’s base businesses’ operating incomecame from higher volume, reductions in certain reserve requirements,favorable sales mix from commercial aerospace aftermarket servicesand spares, and implemented cost control initiatives. Operatingincome from the base businesses within our Flow Control segmentincreased 9% in 2004 over 2003, due to higher volume, contract costoverruns and inventory write-offs in 2003 that did not reoccur in 2004,and a stronger sales mix for our power generation products. Theincrease was partially offset by the lower overall volume to the U.S.Navy, driven by the profit impact related to the two large highermargin contracts in 2003 that did not reoccur in 2004. Additionally, weincreased our reserves for environmental remediation during 2004,resulting in a $3.9 million increase in environmental remediation andadministrative expenses over 2003. Foreign currency translation had afavorable impact on operating income of $2.9 million for 2004 ascompared to 2003.
Overall consolidated operating margins were down slightly in 2004compared to 2003. Strong margins within our business segments wereachieved despite the absorption of $5.3 million of environmental costs,
$2.5 million in costs associated with Sarbanes-Oxley Section 404compliance, and lower pension income of $2.1 million in 2004, due toadditional costs resulting from the acquisitions and slightly lowerinvestment returns.
The increase in net earnings for 2004 compared to 2003 is mainly dueto higher segment operating income. The improvement in operatingincome in 2004 was partially offset by higher interest expense causedbyhigher debt levels associated with the funding of our acquisition pro-gram, which accounted for approximately 60% of the increase, andhigher interest rates. Net earnings for 2004 included certain one-timetax benefits of $3.4 million. The tax benefits primarily resulted from thechange in legal structure of one of our subsidiaries and a favorable IRSappeals settlement relating to the 1993 tax year.
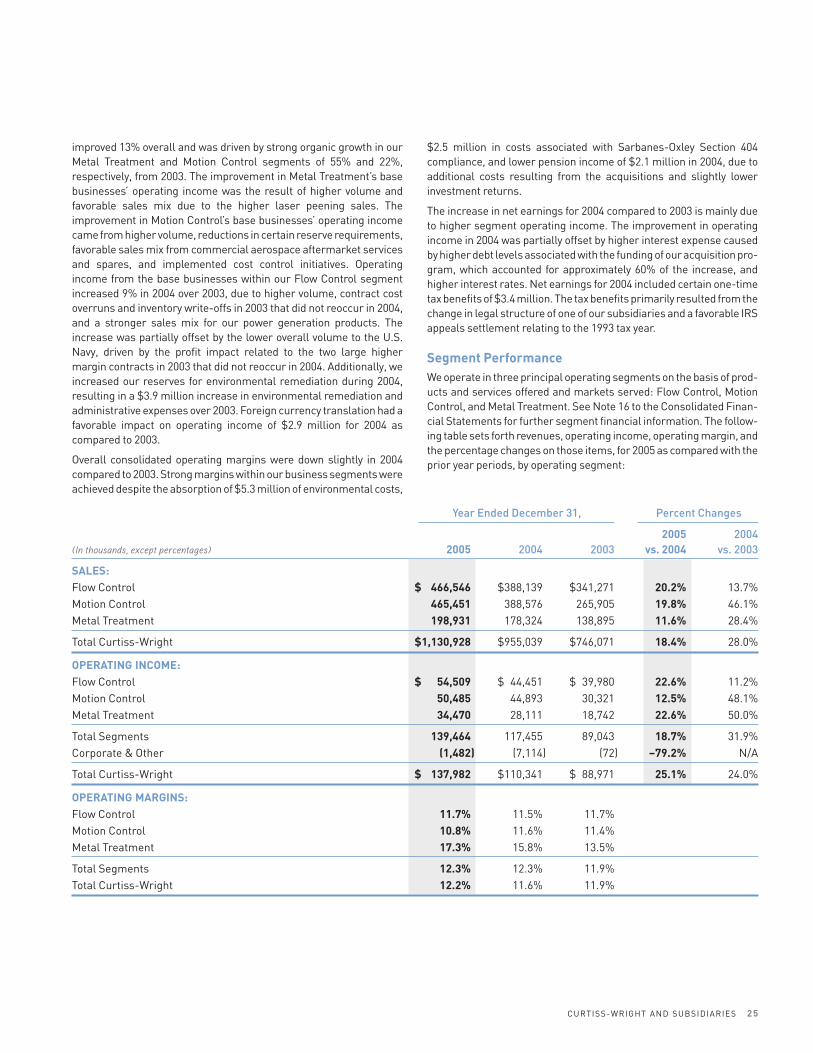
Segment PerformanceWe operate in three principal operating segments on the basis of prod-ucts and services offered and markets served: Flow Control, MotionControl, and Metal Treatment. See Note 16 to the Consolidated Finan-cial Statements for further segment financial information. The follow-ing table sets forth revenues, operating income, operating margin, andthe percentage changes on those items, for 2005 as compared with theprior year periods, by operating segment:
Year Ended December 31, Percent Changes
2005 2004 (In thousands, except percentages) 2005 2004 2003 vs. 2004 vs. 2003
SALES:Flow Control $ 466,546 $388,139 $341,271 20.2% 13.7%Motion Control 465,451 388,576 265,905 19.8% 46.1%Metal Treatment 198,931 178,324 138,895 11.6% 28.4%
Total Curtiss-Wright $1,130,928 $955,039 $746,071 18.4% 28.0%
OPERATING INCOME:Flow Control $ 54,509 $ 44,451 $ 39,980 22.6% 11.2%Motion Control 50,485 44,893 30,321 12.5% 48.1%Metal Treatment 34,470 28,111 18,742 22.6% 50.0%
Total Segments 139,464 117,455 89,043 18.7% 31.9%Corporate & Other (1,482) (7,114) (72) –79.2% N/A
Total Curtiss-Wright $ 137,982 $110,341 $ 88,971 25.1% 24.0%
OPERATING MARGINS:Flow Control 11.7% 11.5% 11.7%Motion Control 10.8% 11.6% 11.4%Metal Treatment 17.3% 15.8% 13.5%
Total Segments 12.3% 12.3% 11.9%Total Curtiss-Wright 12.2% 11.6% 11.9%

FLOW CONTROL
Our Flow Control segment reported sales of $466.5 million for 2005, a20% increase over 2004 sales of $388.1 million. The sales increase wasachieved through organic sales growth of 8% and full year salescontribution of our 2004 acquisitions of Nova Machine, Trentec, Gro-quip, and EPD, which contributed $49.0 million in incremental revenue.The organic growth in sales was driven by higher sales to the oil andgas industry of $22.6 million and higher product sales and develop-ment work to the defense market of $3.6 million. Coker valve productsaccounted for approximately 80% of the increased oil and gas marketsales due to greater customer acceptance and increased installations,while our other oil and gas valve and field service revenues were higherbecause of increased maintenance expenditures by refineries world-wide. Higher valve sales to the U.S. Navy of $8.3 million were driven bystrong demand for our JP-5 jet fuel transfer valves and ball valves usedon Nimitz-class aircraft carriers and Virginia-class submarines,respectively. Electronic instrumentation and digital signal processingcard sales on naval platforms increased $7.4 million as compared tothe prior year. These increased sales to the U.S. Navy were partiallyoffset by anticipated lower revenues from electromechanical productsbecause of timing of major programs. Revenues from pump produc-tion decreased $26.3 million compared to the prior year due to com-pletion of Los Angeles and Virginia-class submarine production pumpcontracts and development prototype programs, such as for the CVN-21 aircraft carrier, and were partially offset by sales for developmentwork on the U.S. Army’s electromagnetic gun, which increased $10.7million, and sales of generators which increased $4.8 million. In addi-tion, foreign currency translation favorably impacted this segment’ssales by $1.2 million in 2005 compared to 2004.
Operating income for 2005 was $54.5 million, an increase of 23% over2004 operating income of $44.5 million. The base business operatingincome grew 10% organically for the full year ended December 31,2005, while the 2004 acquisitions contributed an additional $3.4 mil-lion of incremental operating income in 2005. The improvement inoperating income of base businesses was driven primarily by highersales volume. Factors impacting the comparison of the base busi-nesses to the prior year include increased sales and margins from ouroil and gas products, notably record orders for our coker valves and thehigher margin field service and repairs business. In addition, the oper-ating income benefit from the higher overall volume to the U.S. Navywas partially offset by unfavorable mix within our electronic productsand lower margin development work performed in anticipation of fol-low-on production orders with the U.S. Army. Higher raw materialcosts, such as the cost of steel, and higher administrative infrastruc-ture costs have adversely impacted our operating margins. In addition,foreign currency translation favorably impacted operating income by$0.2 million in 2005 as compared to 2004.
Backlog at December 31, 2005 is $429.3 million compared with $396.3million at December 31, 2004 and $317.8 million at December 31, 2003.New orders received in 2005 totaled $500.1 million, which representsa 15% increase over 2004 new orders of $436.7 million and a 41%increase over new orders received in 2003. The increase is mainly dueto our new acquisitions, which accounted for $64.0 million in incre-mental new orders during 2005. Record new orders for our coker valveproducts to the oil and gas industry were offset by lower fundingreceived from the U.S. Navy for our electromechanical products in 2005compared to 2004.
Our Flow Control segment reported sales of $388.1 million for 2004, a14% increase over 2003 sales of $341.3 million. The higher sales wereprimarily due to the contributions of our 2004 acquisitions of NovaMachine, Trentec, Groquip, and EPD. The 2004 incremental sales fromthese acquisitions amounted to $30.7 million. The remaining businessunits of this segment produced organic sales growth of 5%. The solidorganic growth was lead by stronger sales of valves, pumps, otherelectro-mechanical products, and field services to the power genera-tion market, which increased $15.0 million due to additional orders,new teaming arrangements, and expedited plant outage servicerequirements. Increased demand helped drive record new orders ofour coker valves for the oil and gas industry, which positively impactedsales by $9.2 million, and higher sales of our electronic products to theU.S. Navy, which increased $5.7 million and also contributed to theorganic growth. This increase was partially offset by lower sales of flowcontrol products to the U.S. Navy of $14.5 million due to the timing ofcontractual revenues. In 2003, the Flow Control segment completedthe shipment of two large projects to the U.S. Navy, which generatedapproximately $25 million in sales. We were able to partially offset theimpact of these completed naval projects with higher sales of pumpsand other generators for aircraft carriers and submarines andincreased demand for the non-nuclear ball valves to the U.S. Navy.Sales of the remaining valve product lines to the oil and gas industrywere down in 2004 compared to the prior year. In addition, foreigncurrency translation favorably impacted sales by $2.3 million in 2004compared to 2003.
Operating income in 2004 increased by 11% over 2003. The increasewas mainly due to solid organic growth of 9% and the contributionsfrom the 2004 acquisitions, which generated operating income of $1.0million in 2004. The increase in organic operating income was mainlydue to contract cost overruns on a safety relief valve project and inven-tory write-offs of approximately $2.9 million in 2003 that did not reoc-cur in 2004, higher volume and a stronger sales mix within our powergeneration products, and higher overall volumes for our valve productsto the oil and gas industry and electronic products to the U.S. Navy. Theincrease was partially offset by the lower volume to the U.S. Navy, dri-ven by the profit impact related to the two large higher margin con-tracts in 2003 that did not reoccur in 2004. These projects contributedapproximately $9.7 million in operating income in 2003. Foreign cur-rency translation had a $0.2 million positive impact on 2004 operatingincome compared to 2003.
MOTION CONTROL
Our Motion Control segment reported sales of $465.5 million for 2005,a 20% increase over 2004 sales of $388.6 million. The higher saleslargely reflect the contributions of our 2005 acquisition of Indal,and the full year contributions of our 2004 acquisitions of Dy 4, Synergy,and Primagraphics. The 2005 incremental sales associated with theseacquisitions amounted to $49.9 million. Organic sales increased 7%.Sales in the base business were driven by several factors, including a$7.4 million increase in commercial aerospace OEM market sales.Commercial aerospace OEM sales were driven largely by increaseddemand for our actuation systems content on the Boeing 737 platformand increased sales of sensors and components. Commercial aero-space aftermarket sales increased $8.8 million during the period, with$4.3 million of that increase in our repair and overhaul business, driven
26 CURTISS-WRIGHT AND SUBSIDIARIES
by improving conditions in the commercial airline industry, whilespares sales contributed an additional $4.0 million. The remainingchange in our commercial markets was highlighted by $3.4 million ofhigher controller product sales for use in general industrial applica-tions, which was partially offset by the expiration of a tilting train drivesystems project in Europe, which contributed $3.7 million in sales in2004. We also experienced a $3.2 million sales increase in the defenseaerospace market, driven by production work on the new AN-APR39radar warning system for use on various helicopter programs, alongwith strong sales increases in ruggedized embedded computing.Remaining sales to the military aerospace market were essentially flatas increased ship set production of our actuation systems on the F-22aircraft were offset by lower sales of F-16 spares. Sales to the grounddefense market were up $1.6 million, as higher turret drive stabiliza-tion systems and mobile gun systems sales were largely offset bylower spares sales for the Bradley Fighting Vehicle. In addition, foreigncurrency translation negatively impacted sales by $0.1 million in 2005as compared to 2004.
Operating income for 2005 increased $5.6 million, or 12% over 2004.Operating income in our base businesses increased 14% drivenprimarily by higher sales volume and related improvements in grossmargin. The operating margins in 2005 decreased 80 basis points to10.8%. Factors impacting the comparison of the base businesses to theprior year include increased sales and margins from commercial aero-space programs, notably the Boeing 737 and 747 programs, and favor-able industry trends in the markets for commercial aftermarketservices and spares leading to higher sales and margins, and costreduction initiatives. Offsetting these increases are the completion ofa tilting train drive systems project in Europe and lower F-16 sparesorders, both high margin products that contributed favorably in theprior year, continuing integration efforts in the embedded computingbusiness, and lower margins associated with development work per-formed in anticipation of follow-on production orders, the bulk of whichrelated to cost overruns on a fixed price contract for the 767 tankerrefueling program.
The 2005 operating margin associated with businesses acquired in2004 and 2005 was 6.1%, significantly lower than the base businesses;however, we expect our integration efforts will improve these marginsin the future. In the current year, our newly acquired businesses’ oper-ating income was impacted by the delay of orders for our naval systemsproducts, which was anticipated to be realized in 2005, the ongoingintegration efforts in the embedded computing business, and marginerosion from changes in foreign exchange rates on certain foreign cur-rency denominated contracts for similar products.
Backlog at December 31, 2005 was $374.5 million compared with$229.6 million at December 31, 2004 and $186.3 million at December31, 2003. Acquisitions made during 2005 represent $51.9 million of thebacklog at December 31, 2005. New orders received in 2005 totaled$562.2 million, which represents a 47% increase over 2004 new ordersof $383.5 million and a 125% increase over new orders received in2003. The increase is mainly due to strong orders for our mechanicalactuator and embedded computing products. The segment’s 2005 and2004 acquisitions accounted for $49.4 million in incremental neworders in 2005 versus 2004.
Motion Control segment sales in 2004 were $388.6 million, a 46%increase over 2003 sales of $265.9 million. The higher sales largely
reflect the contributions of our 2004 acquisitions of Dy 4, Primagraph-ics, and Synergy, and the full year contributions of our December 2003acquisitions of Systran, Novatronics, and Pickering. The 2004 incre-mental sales associated with these acquisitions amounted to $110.8million. Sales from the remaining base businesses grew 4% organi-cally. Improvement in commercial aerospace aftermarket sales con-tributed $5.9 million to the growth, $2.8 million of which came from ourrepair and overhaul business, with the remainder attributable mainlyto increased sensors and controls sales. Drive system sales to theEuropean ground defense market declined by $2.9 million as expe-dited customer delivery requirements shifted production from thebeginning of 2004 into 2003. Domestic electro-mechanical systemsproduction experienced a slight increase in domestic military aero-space sales, with F-22 production and spares revenue replacing F-16spares sales, which had ramped up at the end of 2003. The baseembedded computing businesses were essentially flat, with increasedsales to the domestic military aerospace market of $10.1 million dri-ven by new contract wins including the start of full scale production ofradar warning systems for the U.S. Army’s helicopter programs andthe design, development, and integration of the actuators for the 767refueling program. These wins were offset by declines to the domes-tic ground defense market of $10.6 million, mainly from scheduledproduction declines on the Abrams tank and the Bradley Fighting Vehi-cle, while Bradley spares revenue remained strong through 2004 dueto the support of the Iraqi war effort. Additionally, foreign currencytranslation favorably impacted sales in 2004 by $7.7 million comparedto 2003.
Operating income for this segment in 2004 increased 48% over 2003.Acquisitions made in 2003 and 2004 generated incremental operatingincome of $8.9 million, while the base businesses increased 22%. Theimprovement was driven by the higher sales volume, favorable salesmix from commercial aerospace aftermarket services and spares, andimplemented cost control initiatives, offset by lower margin develop-ment work performed in anticipation of follow on production orders.The segment benefited from reductions in reserve requirements at itsEuropean sensors business totaling $1.7 million during 2004, result-ing in a $2.5 million variance in a year over year comparison, since themajority of the reserves were recorded in 2003. Foreign currencytranslation had a $1.2 million positive impact on 2004 operatingincome compared to 2003.
METAL TREATMENT
Our Metal Treatment segment reported sales of $198.9 million in 2005,an increase of 12% over 2004 sales of $178.3 million. Organic salesgrowth of 11% contributed $18.2 million to the increase. The organicgrowth was due to solid performance in our global shot peening ser-vices, which contributed $13.5 million of additional sales mainly in theEuropean commercial aerospace and global automotive markets.Increases in shot peen forming services, primarily on wing compo-nents on the Airbus family of aircraft including the A380, and shotpeening services on aircraft engines were both driven by customerproduction requirements. Sales of shot peening services for the auto-motive industry increased in both Europe and North America by$2.7 million and $1.1 million, respectively, due to favorable overlap ofexisting and new programs in the first half of the year, partially offsetby decreased volumes from General Motors and Ford in the secondhalf of the year. Sale of our heat treating and coatings divisions were up
CURTISS-WRIGHT AND SUBSIDIARIES 27
$2.1 million and $1.9 million, respectively, over the prior year period.The increases were derived primarily from the commercial aerospacemarket, as customer demand for these services on aircraft componentparts increased with the continuing recovery of the aerospace market.In 2005, laser peening sales were essentially flat compared to 2004, aswe continue to develop applications for this new technology to be usedon highly stressed critical components in the turbine engine, aircraftstructures, medical implant, and oil and gas markets. The remainingsales increase was due to contributions from our 2004 acquisitions,which contributed $1.7 million of incremental sales during 2005. For-eign currency translation had a nominal positive impact on sales in2005 compared to 2004.
Operating income for 2005 increased 23% to $34.5 million from $28.1million during 2004, mainly due to higher sales volume. Gross marginsimproved slightly on the higher sales volume, partially offset by higherenergy costs of $2.3 million, primarily in our heat treating division.However, the impact of the greater sales volume was felt most signif-icantly on operating income, which had margins of 17.3% in 2005 com-pared to 15.8% in 2004. Selling, general, and administrative costs,which are generally fixed in nature, increased only 4% over the prioryear period, contributing to the higher operating income margin per-centage. Foreign currency translation had a nominal negative impacton operating income in 2005 compared to 2004.
Backlog at December 31, 2005 and 2004 was $1.9 million comparedwith $1.4 million at December 31, 2003. New orders received in 2005totaled $199.0 million, which represents an 11% increase from 2004new orders of $178.7 million and a 43% increase over new ordersreceived in 2003. The increase is mainly due to the improvement in theglobal economy, which positively impacted the core shot peening busi-ness and the segment’s recent acquisitions.
Metal Treatment sales were $178.3 million in 2004, an increase of 28%over 2003 sales of $138.9 million. Organic sales growth of 21% con-tributed $24.7 million to the increase. The organic growth was due tostrong sales growth from our new laser peening technology, whichcontributed $4.8 million in incremental sales, as well as solid growthin our global shot peening services, which contributed $14.2 millionof incremental sales mainly in the German automotive, Europeancommercial aerospace, and North American commercial and militaryaerospace markets. Sales from our heat treating division were up $2.8million over the prior year period mainly due to overflow from a com-petitor and to the segment’s new aluminum treatment capabilities forthe aerospace industry. The remaining sales increase came from our2003 and 2004 acquisitions, which contributed $12.7 million of incre-mental sales during 2004. The main contributor to this increasewas our E/M Engineered Coatings Solutions businesses, whichwere acquired in April 2003. In addition, foreign currency translationfavorably impacted sales by $5.8 million compared to 2003.
Operating income for 2004 increased 50% to $28.1 million from $18.7million during 2003. Margin improvement was due to higher sales vol-ume, favorable sales mix due to higher laser peening sales, and imple-mented cost reduction initiatives. Offsetting our margin improvementswere increased medical costs and higher energy costs as compared tothe prior year period. Foreign currency translation had a $1.5 millionpositive impact on 2004 operating income as compared to 2003.
CORPORATE AND OTHER EXPENSES
Non-segment operating costs consist mainly of environmental reme-diation and administrative expenses, pension expense/income associ-ated with the Curtiss-Wright pension plan, and other income andexpense not directly associated with the ongoing performance of thesegments. We had non-segment operating costs of $1.5 million, $7.1million and $0.1 million in 2005, 2004, and 2003, respectively. Environ-mental remediation and administration costs represented $0.8 mil-lion, $5.3 million, and $1.4 million in 2005, 2004, and 2003, respectively.The increase in 2004 was due to a $4.4 million increase in remediationreserve requirements related to the Caldwell Trucking landfill super-fund site. Pension expense associated with the Curtiss-Wright PensionPlan was $2.0 million and $0.5 million in 2005 and 2004, respectively,while 2003 experienced income of $1.6 million. The increase in pensionexpense is due to increased service costs and lower returns on planassets. We also realized a gain of $2.8 million during 2005 on the saleof a former operating property located in Fairfield, New Jersey. Higherconsulting fees associated with Sarbanes-Oxley Section 404 com-pliance in 2005 and 2004 accounted for the remaining difference ascompared to 2003.
INTEREST EXPENSE
Interest expense increased $8.0 million in 2005 compared to 2004.Higher interest rates accounted for approximately 54% of the increase,and the remaining increase was due to higher debt levels associatedwith the funding of our acquisitions. Interest expense in 2004 increased$6.4 million from 2003, with higher debt levels associated withthe funding of our acquisitions accounting for 60% of the increase.The remaining increase in 2004 versus 2003 was caused by higherinterest rates.
PROVISION FOR INCOME TAXES
Our effective tax rates for 2005, 2004, and 2003 are 36.4%, 34.1%, and37.8%, respectively. Our 2005 effective tax rate included a charge of$0.3 million from the repatriation of foreign earnings under the Amer-ican Jobs Creation Act of 2004. Our 2004 effective tax rate includednonrecurring benefits totaling $3.4 million resulting primarily from thechange in legal structure of one of our subsidiaries and a favorable IRSappeals settlement. Our 2003 effective tax rate included the benefit ofthe restructuring of some of our European operations.
Liquidity and Capital ResourcesSOURCES AND USES OF CASH
We derive the majority of our operating cash inflow from receipts onthe sale of goods and services and cash outflow for the procurement ofmaterials and labor and cash flow is therefore subject to market fluc-tuations and conditions. A substantial portion of our business is in thedefense sector, which is characterized by long-term contracts. Most ofour long-term contracts allow for several billing points (progress ormilestone) that provide us with cash receipts as costs are incurredthroughout the project rather than upon contract completion, therebyreducing working capital requirements. In some cases, these pay-ments can exceed the costs incurred on a project.
OPERATING ACTIVITIES
Our working capital was $269.0 million at December 31, 2005, anincrease of $56.8 million from the working capital at December 31,
28 CURTISS-WRIGHT AND SUBSIDIARIES

2004 of $212.2 million. Our ratio of current assets to current liabilitieswas 2.2 to 1 at December 31, 2005, compared with a ratio of 2.1 to 1 atDecember 31, 2004. Cash and cash equivalents totaled $59.0 million inthe aggregate at December 31, 2005, up from $41.0 million at Decem-ber 31, 2004. The increase is primarily due to an increase in cash andcash equivalents following the 2005 Senior Note offering and subse-quent pay down of our outstanding debt under our revolving creditfacilities. Excluding the impact on cash, working capital increased$38.8 million partially due to our Indal acquisition made in the firstquarter of 2005. The remainder of the increase was driven mainly byincreases in inventory of $26.9 million and accounts receivables of$21.6 million. Inventory balances rose primarily as a result of build upfor expected increases in sales in 2006 and strategic initiatives to lowerturn-around time for deliveries. Accounts receivable increased due tothe timing of contractual billings and industry cycles, partially offset bycollection of receivables from certain large projects outstanding atDecember 31, 2004. Unbilled receivables increased substantially dueto funding and other operational delays by certain customers as wellas increased contracts for which progress billings do not apply.Partially offsetting these increases in working capital requirementswas an increase in accounts payable and accrued expenses associatedwith the build up of inventories and higher accrued compensation.
Our short-term debt was $0.9 million at December 31, 2005 and $1.6million at December 31, 2004. Our long-term debt was $364.0 millionat December 31, 2005, an increase of $23.2 million from the balance atDecember 31, 2004. The increase in long-term debt is primarily due tofunds borrowed to purchase Indal offset by cash generation during2005. Days sales outstanding at December 31, 2005 decreased to 43days from 47 days at December 31, 2004 while inventory turnoverdecreased to 5.6 turns at December 31, 2005 as compared to 5.8 turnsat December 31, 2004.
Our balance of cash and cash equivalents totaled $41.0 million atDecember 31, 2004, down from $98.7 million at December 31, 2003.The decrease was primarily due to the use of available cash to fund ouracquisition of Dy 4 Systems, Inc. on January 31, 2004. Excluding theimpact on cash, working capital increased $33.1 million due to ouracquiring eleven businesses in 2004. In addition to the impact of theseacquisitions, working capital changes were highlighted by an increasein receivables of $39.9 million and an increase in accounts payableand accrued expenses of $19.8 million. Unbilled receivables increasedsubstantially due to funding and other operational delays by certaincustomers as well as increased contracts for which progress billingsdo not apply. The increase in accounts payable and accrued expensesis due to the timing of year-end payments and higher accrued com-pensation. Our short-term debt was $1.6 million at December 31, 2004and $1.0 million at December 31, 2003. Our long-term debt was $340.9million at December 31, 2004, an increase of $116.7 million from thebalance at December 31, 2003. The increase in long-term debt wasthe result of additional funds borrowed to acquire eleven businessesin 2004. Days sales outstanding at December 31, 2004 decreased to47 days from 56 days at December 31, 2003 while inventory turnoverincreased to 5.8 turns at December 31, 2004 as compared to 5.5 turnsat December 31, 2003.
INVESTING ACTIVITIES
We have acquired twenty-five businesses since 2001 and expect to con-tinue to seek acquisitions that are consistent with our long-term
growth strategy. A combination of cash resources, funds availableunder our credit agreement, and proceeds from our Senior Notes wereutilized to fund our acquisitions, which totaled $73.1 million and$247.4 million in 2005 and 2004, respectively. As indicated in Note 2to the Consolidated Financial Statements, some of our acquisitionagreements contain purchase price adjustments, such as potentialearn-out payments and working capital adjustments. During 2005, wemade approximately $8.6 million in such payments relative to priorperiod acquisitions. Additional acquisitions will depend, in part, on theavailability of financial resources at a cost of capital that meets ourstringent criteria. As such, future acquisitions, if any, may be fundedthrough the use of our cash and cash equivalents, through additionalfinancing available under the credit agreement, or through newfinancing alternatives.
Our capital expenditures were $42.4 million in 2005, $32.5 million in2004, and $33.3 million in 2003. In 2005 and 2004, principal capitalexpenditures included a move to a new flow control facility, new andreplacement machinery and equipment within the business segmentsand for the expansion of new product lines and facilities. Our capitalexpenditures in 2003 included building expansions, a new laser peeningfacility and associated laser machinery, and various other machineryand equipment.
FINANCING ACTIVITIES
On December 1, 2005, we issued $150.0 million of 5.51% Senior SeriesNotes (the “2005 Notes”). Our 2005 Notes mature on December 1, 2017and are senior unsecured obligations, equal in right of payment to ourexisting senior indebtedness. We, at our option, can prepay at any timeall or any part of our 2005 Notes, subject to a make-whole payment inaccordance with the terms of the Note Purchase Agreement. In con-nection with our 2005 Notes, we paid customary fees that have beendeferred and will be amortized over the term of our 2005 Notes. We arerequired under the Note Purchase Agreement to maintain certainfinancial ratios, the most restrictive of which is a debt to capitalizationlimit of 60%, and a cross default provision with our other seniorindebtedness. As of December 31, 2005, we were in compliance withall covenants.
In November 2005, we unwound our interest rate swap agreementswith notional amounts of $20 million and $60 million which were orig-inally put in place to convert a portion of our fixed interest on the $75million 5.13% Senior Notes and $125 million 5.74% Senior Notes,respectively, to variable rates based on specified spreads over six-month LIBOR. The unwinding of these swap agreements resulted in anet loss of $0.2 million, which has been deferred and is being amor-tized over the remaining term of the underlying debt.
At December 31, 2005, wehad a $400 million revolving credit agreement(the “Agreement”) with a group of ten banks. The agreement expires in2009. Borrowings under the Agreement bear interest at a floating ratebased on market conditions. In addition, our interest rate and level offacility fees are dependent on certain financial ratio levels, as defined inthe Agreement. We are subject to annual facility fees on the commit-ments under the Agreement. In connection with the Agreement, wepaid customary transaction fees that have been deferred and are beingamortized over the term of the Agreement. We are required under theAgreement to maintain certain financial ratios and meet certain finan-cial tests, the most restrictive of which is a debt to capitalization limit of55% and a cross default provision with our other senior indebtedness.
CURTISS-WRIGHT AND SUBSIDIARIES 29

The Agreement does not contain any subjective acceleration clauses.Asof December 31, 2005, we were in compliance with all covenants andhad the flexibility to issue additional debt of approximately $400 millionwithout exceeding the covenant limit defined in the Agreement. Wewould consider other financing alternatives to maintain capital struc-ture balance and ensure compliance with all debt covenants. We didnot have any cash borrowings outstanding (excluding letters of credit)under the Agreement at December 31, 2005 compared to $124.5 mil-lion of cash borrowings outstanding at December 31, 2004. The unusedcredit available under the agreement at December 31, 2005 was$367.9 million.
On September 25, 2003 we issued $200.0 million of Senior Notes (the“2003 Notes”). The 2003 Notes consist of $75.0 million of 5.13% SeniorNotes that mature on September 25, 2010 and $125.0 million of 5.74%Senior Notes that mature on September 25, 2013. Our 2003 Notes aresenior unsecured obligations and are equal in right of payment to ourexisting senior indebtedness. We, at our option, can prepay at any timeall or any part of our 2003 Notes, subject to a make-whole payment inaccordance with the terms of the Note Purchase Agreement. In con-nection with our 2003 Notes, we paid customary fees that have beendeferred and will be amortized over the terms of the 2003 Notes. Weare required under the Note Purchase Agreement to maintain certainfinancial ratios, the most restrictive of which is a debt to capitalizationlimit of 60% and a cross default provision with our other senior indebt-edness. As of December 31, 2005, we were in compliance withall covenants.
Our industrial revenue bonds, which are collateralized by real estate,were $14.2 million at December 31, 2005 and $14.3 million at Decem-ber 31, 2004. The loans outstanding under the 2003 and 2005 Notes,Interest Rate Swaps, Revolving Credit Agreement, and Industrial Rev-enue Bonds had variable interest rates averaging 4.67% for 2005 and3.65% for 2004.
FUTURE COMMITMENTS
Cash generated from operations is considered adequate to meet ouroperating cash requirements for the upcoming year, including plannedcapital expenditures of approximately $50 million, interest paymentsof approximately $20 million to $22 million, estimated income tax pay-ments of approximately$40 million to$50 million, dividends of approx-imately $11 million, pension funding of approximately $7 million, andadditional working capital requirements. We have approximately $3million in short-term environmental liabilities, which is manage-ment’s estimation of cash requirements for 2006. Additionally, we arecommitted topotential earn-out payments on seven of our acquisitionsdating back to 2001, which are estimated to be between approximately$9 million to $11 million in 2006. There can be no assurance, however,that we will continue to generate cash flow at the current level. If cashgenerated from operations is not sufficient to support these require-ments and investing activities, we may be required to reduce capitalexpenditures, refinance a portion of our existing debt, or obtain addi-tional financing.
In 2006, our capital expenditures are expected to be approximately $50million due to the construction of new facilities, expansion of facilitiesto accommodate new product lines, and new machinery and equip-ment, such as additional investment in our laser peening technology.
The following table quantifies our significant future contractual oblig-ations and commercial commitments as of December 31, 2005:
InterestDebt Payments
Principal on Fixed Operating(In thousands) Repayments(1) Rate Debt Leases Total
2006 $ 885 $ 19,288 $15,471 $ 35,6442007 5,060 19,288 13,600 37,9482008 62 19,288 11,423 30,7732009 64 19,288 8,679 28,03120010 125,066 18,254 5,763 149,083Thereafter 233,928 76,752 16,402 327,082
Total $365,065 $172,158 $71,338 $608,561
(1)Amounts exclude a $0.2 million adjustment to the fair value of long-term debtrelating to the Corporation’s interest rate swap agreements that were settled incash during 2005.
We do not have material purchase obligations. Most of our raw mate-rial purchase commitments are made directly pursuant to specificcontract requirements.
We enter into standby letters of credit agreements with financial insti-tutions and customers primarily relating to guarantees of repaymenton our Industrial Revenue Bonds, future performance on certaincontracts to provide products and services, and to secure advancepayments we have received from certain international customers.At December 31, 2005, we had contingent liabilities on outstandingletters of credit due as follows:
Letters(In thousands) of Credit
2006 $ 7,5682007 7,2562008 16,0522009 242010 —Thereafter 1,387
Total $32,287
CRITICAL ACCOUNTING POLICIES
Our consolidated financial statements and accompanying notes areprepared in accordance with generally accepted accounting principlesin the United States of America. Preparing consolidated financialstatements requires us to make estimates and assumptions that affectthe reported amounts of assets, liabilities, revenues, and expenses.These estimates and assumptions are affected by the applicationof our accounting policies. Critical accounting policies are those thatrequire application of management’s most difficult, subjective, orcomplex judgments, often as a result of the need to make estimatesabout the effects of matters that are inherently uncertain and maychange in subsequent periods. We believe that the following are someof the more critical judgment areas in the application of our account-ing policies that affect our financial condition and results of operations:
30 CURTISS-WRIGHT AND SUBSIDIARIES

REVENUE RECOGNITION
The realization of revenue refers to the timing of its recognition in ouraccounts and is generally considered realized or realizable and earnedwhen the earnings process is substantially complete and all of thefollowing criteria are met: 1) persuasive evidence of an arrangementexists; 2) delivery has occurred or services have been rendered; 3) ourprice to our customer is fixed or determinable; and 4) collectibility isreasonably assured.
We record sales and related profits on production and service type con-tracts as units are shipped and title and risk of loss have transferred oras services are rendered. This method is used in our Metal Treatmentsegment and in some of the business units within the Motion Controland Flow Control segments that serve non-military markets.
For certain contracts in our Flow Control and Motion Control segmentsthat require performance over an extended period before deliveriesbegin, sales and estimated profits are recorded by applying thepercentage-of-completion method of accounting. The percentage-of-completion method of accounting is used primarily for our defensecontracts and certain long-term commercial contracts. This methodrecognizes revenue and profit as the contracts progress towards com-pletion. For certain contracts that contain a significant number of per-formance milestones, as defined by the customer, sales are recordedbased upon achievement of these performance milestones. The per-formance milestone method is an output measure of progress towardscompletion made in terms of results achieved. For certain fixed pricecontracts, where none or a limited number of milestones exist, thecost-to-cost method is used, which is an input measure of progresstoward completion. Under the cost-to-cost input method, sales andprofits are recorded based on the ratio of costs incurred to an estimateof costs at completion. Under our percentage-of-completion methodsof accounting, a single estimated total profit margin is used to recog-nize profit for each contract over its entire period of performance.
Application of percentage-of-completion methods of revenue recogni-tion requires the use of reasonable and dependable estimates of thefuture material, labor, and overhead costs that will be incurred and adisciplined cost estimating system in which all functions of the busi-ness are integrally involved. These estimates are determined basedupon industry knowledge and experience of our engineers, projectmanagers, and financial staff. These estimates are significant andreflect changes in cost and operating performance throughout thecontract and could have a significant impact on our operating perfor-mance. Adjustments to original estimates for contract revenue, esti-mated costs at completion, and the estimated total profit are oftenrequired as work progresses throughout the contract and as experi-ence and more information is obtained, even though the scope of workunder the contract may not change. These changes are recorded on acumulative basis in the period they are determined to be necessary.
Under the percentage-of-completion method of accounting, provisionsfor estimated losses on uncompleted contracts are recognized in theperiod in which the likelihood of such losses are determined. Amountsrepresenting contract change orders are included in revenue only whenthey can be estimated reliably and their realization is reasonablyassured. Certain contracts contain provisions for the redeterminationof price and, as such, management defers a portion of the revenue fromthose contracts until such time as the price has been finalized.
Some of our customers withhold certain amounts from the billingsthey receive. These retainages are generally not due until the projecthas been completed and accepted by the customer.
INVENTORY
Inventory costs include materials, direct labor, and manufacturingoverhead costs, which are stated at the lower of cost or market, wheremarket is limited to the net realizable value. We estimate the net real-izable value of our inventories and establish reserves to reduce thecarrying amount of these inventories to net realizable value, as neces-sary. We continually evaluate the adequacy of the inventory reserves byreviewing historical scrap rates, on-hand quantities, as compared withhistorical and projected usage levels and other anticipated contractualrequirements. The stated inventory costs are also reflective of theestimates used in applying the percentage-of-completion revenuerecognition method.
We purchase materials for the manufacture of components for sale.The decision to purchase a set quantity of a particular item is influ-enced by several factors including: current and projected price, futureestimated availability, existing and projected contracts to producecertain items, and the estimated needs for our businesses.
For certain of our long-term contracts, we utilize progress billings,which represent amounts billed to customers prior to the delivery ofgoods and services and are recorded as a reduction to inventory andreceivables. Progress billings are generally based on costs incurred,including direct costs, overhead, and general and administrative costs.
PENSION AND OTHER POSTRETIREMENT BENEFITS
We, in consultation with our actuaries, determine the appropriateassumptions for use in determining the liability for future pension andother postretirement benefits. The most significant of these assump-tions include the number of employees who will receive benefits alongwith the tenure and salary level of those employees, the expected returnon plan assets, the discount rates used to determine plan obligations,and the trends in the costs of medical and other health care benefits inthe case of the postretirement benefit obligations. Changes in theseassumptions, if significant in future years, may have an effect on ourpension and postretirement expense, associated pension and postre-tirement assets and liabilities, and our annual cash requirements tofund these plans.
The discount rate used to determine the benefit obligations of the plansas of December 31, 2005 and the annual periodic costs for 2006 waslowered in 2005 to 5.75% for both the EMD and Curtiss-Wright PensionPlans and the EMD Postretirement Benefit Plan to better reflectcurrent economic conditions. The rate was based on current and futureeconomic indicators. The reduction in the discount rate increased thebenefit obligation of the plans. A quarter of one percentage pointdecrease in the discount rate would have the effect of increasing theannual pension expense by $0.5 million and the pension benefit oblig-ation by $8.1 million. We also updated the mortality tables for the pen-sion and postretirement benefit plans to the RP 2000 Mortality Tableto better reflect the general improvements in mortality experiencedover the past years. This change caused an additional increase to thebenefit obligation.
The overall expected return on assets assumption is based on a com-bination of historical performance of the pension fund and expectations
CURTISS-WRIGHT AND SUBSIDIARIES 31

of future performance. The historical returns are determined using themarket–related value of assets, which is the same value used in the cal-culation of annual net periodic benefit cost. The market-related valueof assets includes the recognition of realized and unrealized gains andlosses over a five-year period, which effectively averages the volatilityassociated with the actual performance of the plan’s assets from yearto year. Although over the last ten years the market related value ofassets had an average annual yield of 10.6%, the actual returns aver-aged 11.3% during the same period. We have consistently used the8.5% rate as a long-term overall average return. Given the uncertain-ties of the current economic and geopolitical landscapes, we considerthe 8.5% rate to be a reasonable assumption of the future long-terminvestment returns. A quarter of one percentage point decrease in theexpected return on assets would have the effect of increasing ourannual pension expense by $0.7 million.
The long-term medical trend assumptions start with a current rate thatis in line with expectations for the near future, and then grades the ratesdown over time until it reaches an ultimate rate that is close to expec-tations for growth in GDP. The reasoning is that medical trends cannotcontinue to be higher than the rate of GDP growth in the long term. Anychange in the expectation of these rates to return to a normal levelshould have an impact on the amount of expense we recognize.
The timing and amount of future pension income or expense to be rec-ognized each year is dependent on the demographics and expectedearnings of the plan participants, the expected interest rates in effectin future years, and the actual and expected investment returns of theassets in the pension trust.
See Note 14 for further information on our pension and postretirementplans, including an estimate of future cash contributions.
ENVIRONMENTAL RESERVES
We provide for environmental reserves on a site by site basis when, inconjunction with internal and external legal counsel, it is determinedthat a liability is both probable and estimable. In many cases, the liabil-ity is not fixed or capped when we first record a liability for a particularsite. If only a range of potential liability can be estimated and no amountwithin the range is moreprobable than another, a reservewill be estab-lished at the low end of that range. At sites involving multiple parties,we accrue environmental liabilities based upon our expected share ofthe liability, taking into account the financial viability of our other jointlyliable partners. Judgment is required when we make assumptions andestimate costs expected to be incurred for environmental remediationactivities due to, among other factors, difficulties in assessing theextent and type of environmental remediation to be performed, theimpact of complex environmental regulations and remediation tech-nologies, and agreements between potentially responsible parties toshare in the cost of remediation. In estimating the future liability andcontinually evaluating the sufficiency of such liabilities, we weigh cer-tain factors including our participation percentage due to a settlementby or bankruptcy of other potentially responsible parties, a change inthe environmental laws requiring more stringent requirements, anincrease or decrease in the estimated time required to remediate, achange in the estimate of future costs that will be incurred to remedi-ate the site, and changes in technology related to environmentalremediation. We do not believe that continued compliance with envi-ronmental laws applicable to our operations will have a materialadverse effect on our financial condition or results of operation. How-
ever, given the level of judgment and estimation used in the recordingof environmental reserves, it is reasonably possible that materially dif-ferent amounts could be recorded if different assumptions were usedor if circumstances were to change, such as environmental regulationsor remediation solution remedies.
As of December 31, 2005, our environmental reserves totaled $25.3million, the majority of which is long-term. Approximately 80% of theenvironmental reserves represent the current value of our anticipatedremediation costs and are not discounted primarily due to theuncertainty of timing of expenditures. The remaining environmentalreserves are discounted to reflect the time value of money since theamount and timing of cash payments for the liability are reasonablydeterminable. We use a discount rate of 4%, which approximates anamount at which the environmental liability could be settled in anarm’s length transaction with a third party. All environmental reservesexclude any potential recovery from insurance carriers or third-partylegal actions.
PURCHASE ACCOUNTING
We apply the purchase method of accounting to our acquisitions. Underthis method, the purchase price, including any capitalized acquisitioncosts, is allocated to the underlying tangible and intangible assetsacquired and liabilities assumed based on their respective fair marketvalues, with any excess recorded as goodwill. We determine the fairvalues of such assets and liabilities, generally in consultation withthird-party valuation advisors. The fair value of assets acquired (net ofcash) and liabilities assumed of our one 2005 acquisition were esti-mated to be $88.4 million and $23.9 million, respectively. The initial fairvalue assigned to this acquisition is preliminary and may be revisedprior to finalization, which is to be completed within a reasonableperiod, generally within one year of acquisition.
GOODWILL
We have $388.2 million in goodwill as of December 31, 2005. The recov-erability of goodwill is subject to an annual impairment test basedon the estimated fair value of the underlying businesses. Additionally,goodwill is tested for impairment when an event occurs or if circum-stances change that would more likely than not reduce the fair value ofa reporting unit below its carrying amount. These estimated fair valuesare based on estimates of future cash flows of the businesses. Factorsaffecting these future cash flows include the continued market accep-tance of the products and services offered by the businesses, thedevelopment of new products and services by the businesses and theunderlying cost of development, the future cost structure of the busi-nesses, and future technological changes. Estimates are also used forthe Corporation’s cost of capital in discounting the projected futurecash flows. If it has been determined that impairment has occurred, wemay be required to recognize an impairment of our asset, which wouldbe limited to the difference between the book value of the asset and itsfair value. Any such impairment would be recognized in full in thereporting period in which it has been identified.
OTHER INTANGIBLE ASSETS
Other intangible assets are generally the result of acquisitions andconsist primarily of purchased technology, customer related intangi-bles, trademarks and service marks, and technology licenses. Intan-gible assets are recorded at their fair values as determined through
32 CURTISS-WRIGHT AND SUBSIDIARIES
purchase accounting. Definite lived intangible assets are amortizedratably to match their cash flow streams over their estimated usefullives, which range from 1 to 20 years, while indefinite lived intangibleassets are not amortized. Indefinite lived intangible assets arereviewed for impairment annually based on the discounted future cashflows. Additionally, we review the recoverability of all intangible assets,including the related useful lives, whenever events or changes in cir-cumstances indicate that the carrying amount might not be recover-able. We would record any impairment in the reporting period in whichit has been identified.
Recently Issued Accounting StandardsIn June 2005, the FASB issued SFAS No. 154, “Accounting Changes andError Corrections – A Replacement of APB Opinion No. 20 and FASBStatement No. 3” (“FAS 154”). This Statement requires that a voluntarychange in accounting principle be applied retrospectively with all priorperiod financial statements presented on the basis of the new account-ing principle, unless it is impracticable to do so. FAS 154 also providesthat (1) a change in method of depreciating or amortizing a long-livednonfinancial asset be accounted for as a change in estimate (prospec-tively) that was effected by a change in accounting principle, and (2)correction of errors in previously issued financial statements shouldbe termed a “restatement.” The new standard is effective for account-ing changes and correction of errors made in fiscal years beginningafter December 15, 2005. Early adoption of this standard is permittedfor accounting changes and correction of errors made in fiscal yearsbeginning after June 1, 2005. We do not anticipate that the adoption ofthis statement will have a material impact on our results of operationor financial condition.
In December 2004, the FASB issued SFAS No. 123 (revised 2004),“Accounting for Stock-Based Compensation” (“FAS 123(R)”). ThisStatement requires a public entity to measure the cost of employeeservices received in exchange for an award of equity instrumentsbased on the grant-date fair value of the award (with limited excep-tions). That cost will be recognized over the period during which anemployee is required to provide service in exchange for the award—the requisite service period (usually the vesting period). No compen-sation cost is recognized for equity instruments for which employeesdo not render the requisite service. Employee share purchase planswill not result in recognition of compensation cost if certain conditionsare met; those conditions are much the same as the related conditionsin FAS 123. This Statement is effective as of the beginning of the first
interim or annual reporting period that begins after June 15, 2005. OnApril 14, 2005 the SEC announced a deferral of the effective date of FAS123(R) for calendar year companies until January 1, 2006. We expectthe adoption of this statement to have a pre-tax expense of approxi-mately $5 million on operating income in 2006.
In March of 2005, the FASB issued FIN No. 47, “Accounting for Condi-tional Asset Retirement Obligations—an interpretation of FASB State-ment No. 143” (“FAS 143”). This Interpretation clarifies that the term“conditional asset retirement obligation” as used in FAS 143, “Account-ing for Asset Retirement Obligations,” refers to a legal obligation toperform an asset retirement activity in which the timing and (or)method of settlement are conditional on a future event that may or maynot be within the control of the entity. The obligation to perform theasset retirement activity is unconditional even though uncertaintyexists about the timing and (or) method of settlement. Thus, the tim-ing and (or) method of settlement may be conditional on a future event.Accordingly, an entity is required to recognize a liability for the fairvalue of a conditional asset retirement obligation if the fair value of theliability can be reasonably estimated. The fair value of a liability for theconditional asset retirement obligation should be recognized whenincurred—generally upon acquisition, construction, or developmentand (or) through the normal operation of the asset. Uncertainty aboutthe timing and (or) method of settlement of a conditional asset retire-ment obligation should be factored into the measurement of the liabil-ity when sufficient information exists. FAS 143 acknowledges that insome cases, sufficient information may not be available to reasonablyestimate the fair value of an asset retirement obligation. This Inter-pretation also clarifies when an entity would have sufficient informa-tion to reasonably estimate the fair value of an asset retirementobligation. The adoption of this interpretation did not have a materialimpact on our results of operation or financial condition.
Recent DevelopmentOn February 7, 2006, the Board of Directors declared a 2-for-1 stocksplit in the form of a 100% stock dividend. The split, in the form of 1share of Common stock for each share of Common stock outstanding,is payable on April 7, 2006. As the market price of the shares does notreflect the stock split as of the date of this Annual Report, all referencesthroughout this Annual Report to number of shares, per shareamounts, stock options data, and market prices of the Corporation’sCommon stock have not been adjusted to reflect the effect of thisstock split.
CURTISS-WRIGHT AND SUBSIDIARIES 33

34 CURTISS-WRIGHT AND SUBSIDIARIES
We are exposed to certain market risks from changes in interest ratesand foreign currency exchange rates as a result of our global operatingand financing activities. We seek to minimize any material risks fromforeign currency exchange rate fluctuations through our normal oper-ating and financing activities and, when deemed appropriate, throughthe use of derivative financial instruments. We do not use such instru-ments for trading or other speculative purposes. We used interest rateswaps and forward foreign currency contracts to manage our interestrate and currency rate exposures during the year ended December 31,2005. We unwound our interest rate swaps in November 2005. Infor-mation regarding our accounting policy on financial instruments iscontained in Note 1-K to the Consolidated Financial Statements.
The market risk for a change in interest rates relates primarily to ourdebt obligations. We shifted our interest rate exposure from 65% vari-able at December 31, 2004 to 96% fixed at December 31, 2005. The netproceeds of the new $150 million 2005 Notes offering principally con-tributed to our ability to pay down our outstanding debt under ourrevolving credit facility at December 31, 2005. The variable rates on theIndustrial Revenue Bonds are based on market rates. A change ininterest rates of 1% would have an impact on consolidated interestexpense of approximately $0.1 million. Information regarding our 2005and 2003 Notes, Revolving Credit Agreement, and Interest Rates Swapsis contained in Note 10 to the Consolidated Financial Statements.
Financial instruments expose us to counter-party credit risk for non-performance and to market risk for changes in interest and foreign cur-rency rates. We manage exposure to counter-party credit risk through
specific minimum credit standards, diversification of counter-parties,and procedures to monitor concentrations of credit risk. We monitor theimpact of market risk on the fair value and cash flows of our investmentsby investing primarily in investment grade interest bearing securities,which have short-term maturities. We attempt to minimize possiblechanges in interest and currency exchange rates to amounts that are notmaterial to our consolidated results of operations and cash flows.
Our acquisitions of Indal, Dy 4 and Novatronics have increased ourexposure to foreign currency exchange rate fluctuations related pri-marily to the Canadian dollar. We currently have a hedging program inplace to mitigate the Canadian dollar foreign currency risk. Althoughthe majority of our sales, expenses, and cash flows are transacted inU.S. dollars, we do have some market risk exposure to changes in for-eign currency exchange rates, primarily as it relates to the value of theU.S. dollar versus the Canadian dollar, the British pound, the euro, andthe Swiss franc. Any significant change in the value of the currenciesof those countries in which we do business against the U.S. dollar couldhave an adverse effect on our business, financial condition, and resultsof operations. We seek to minimize the risk from these foreign cur-rency fluctuations principally through invoicing our customers in thesame currency as the functional currency of the revenue producingentity. However, our efforts to minimize these risks may not be suc-cessful. If foreign exchange rates were to collectively weaken orstrengthen against the dollar by 10%, net earnings would have beenreduced or increased, respectively, by approximately $3 million as itrelates exclusively to foreign currency exchange rate exposures.
QUANTITATIVE AND QUALITATIVE DISCLOSURES ABOUT MARKET RISK
CURTISS-WRIGHT AND SUBSIDIARIES 35
The consolidated financial statements appearing on pages 38 through41 of this Annual Report have been prepared by the Corporation in con-formity with accounting principles generally accepted in the UnitedStates of America. The financial statements necessarily include someamounts that are based on the best estimates and judgments ofthe Corporation. Other financial information in the Annual Report isconsistent with that in the financial statements.
The Corporation maintains accounting systems, procedures, andinternal accounting controls designed to provide reasonable assur-ance that assets are safeguarded and that transactions are executedin accordance with the appropriate corporate authorization and areproperly recorded. The accounting systems and internal accountingcontrols are augmented by written policies and procedures; organiza-tional structure providing for a division of responsibilities; selectionand training of qualified personnel; and an internal audit program.The design, monitoring, and revision of internal accounting controlsystems involve, among other things, management’s judgment withrespect to the relative cost and expected benefits of specific controlmeasures. Management of the Corporation has completed an assess-ment of the Corporation’s internal controls over financial reporting andhas included “Managements’ Annual Report On Internal Control OverFinancial Reporting” below.
Deloitte & Touche LLP, independent auditors, performed an audit ofthe Corporation’s financial statements that also included forming an
opinion on management’s assessment of internal controls over finan-cial reporting as well as the effectiveness of such controls for the yearended December 31, 2005. An audit includes examining, on a test basis,evidence supporting the amounts and disclosures in the financial state-ments. An audit also includes assessing the accounting principles usedand significant estimates made by management, as well as evaluatingthe overall financial statement presentation. The objective of their auditis the expression of an opinion on the fairness of the presentation of theCorporation’s financial statements in conformity with accountingprinciples generally accepted in the United States of America, in allmaterial respects, on management’s assessment of the effectivenessof internal controls over financial reporting, and on the effectiveness ofinternal controls over financial reporting as of December 31, 2005.
The Audit Committee of the Board of Directors, composed entirely ofdirectors who are independent of the Corporation, appoints the inde-pendent auditors for ratification by stockholders and, among otherthings, considers the scope of the independent auditors’ examination,the audit results and the adequacy of internal accounting controls of theCorporation. The independent auditors and the internal auditor havedirect access to the Audit Committee, and they meet with the commit-tee from time to time, with and without management present, todiscuss accounting, auditing, non-audit consulting services, internalcontrol, and financial reporting matters.
REPORT OF THE CORPORATION
The Corporation’s management is responsible for establishing andmaintaining adequate internal control over financial reporting, asdefined in Rules 13a-15 (f) and 15d-15 (f) under the SecuritiesExchange Act of 1934, as amended.
Because of its inherent limitations, internal control over financialreporting may not prevent or detect misstatements. Also, projectionsof the future effectiveness of controls currently deemed effective aresubject to the risk that controls may become inadequate because ofchanges in conditions or deterioration in the degree of compliance withthe policies or procedures.
As discussed in Note 2 to the Consolidated Financial Statements, theCorporation acquired Indal Technologies, Inc. during the year endedDecember 31, 2005. This acquisition with assets at December 31, 2005and current year revenues representing 6.5% and 2.7%, respectively,of the consolidated amounts, have been excluded from management’sassessment of internal control over financial reporting.
The Corporation’s management assessed the effectiveness of theCorporation’s internal control over financial reporting as of December31, 2005. In making this assessment, the Corporation’s managementused the criteria established by the Committee of Sponsoring Organi-zations of the Treadway Commission in Internal Control-IntegratedFramework.
Based on management’s assessment, excluding the acquired com-pany referred to in the third paragraph, management believes that, asof December 31, 2005, the Corporation’s internal control over financialreporting is effective based on the established criteria.
The Corporation’s assessment of the effectiveness of internal controlsover financial reporting as of December 31, 2005 has been auditedby Deloitte & Touche LLP, an independent registered public account-ing firm, and their report thereon is included on page 37 of thisAnnual Report.
MANAGEMENT’S ANNUAL REPORT ON INTERNAL CONTROL OVER FINANCIAL REPORTING

36 CURTISS-WRIGHT AND SUBSIDIARIES
To the Board of Directors and Stockholders ofCurtiss-Wright Corporation Roseland, New JerseyWe have audited the accompanying consolidated balance sheets ofCurtiss-Wright Corporation and subsidiaries (the “Company”) as ofDecember 31, 2005 and 2004, and the related consolidated statementsof earnings, stockholders’ equity, and cash flows for each of the threeyears in the period ended December 31, 2005. These financial state-ments are the responsibility of the Company’s management. Ourresponsibility is to express an opinion on these financial statementsbased on our audits.
We conducted our audits in accordance with the standards of the Pub-lic Company Accounting Oversight Board (United States). Those stan-dards require that we plan and perform the audit to obtain reasonableassurance about whether the financial statements are free of mater-ial misstatement. An audit includes examining, on a test basis,evidence supporting the amounts and disclosures in the financialstatements. An audit also includes assessing the accounting princi-ples used and significant estimates made by management, as well asevaluating the overall financial statement presentation. We believethat our audits provide a reasonable basis for our opinion.
In our opinion, such consolidated financial statements present fairly,in all material respects, the financial position of the Company atDecember 31, 2005 and 2004, and the results of its operations and itscash flows for each of the three years in the period ended December31, 2005 in conformity with accounting principles generally accepted inthe United States of America.
We have also audited, in accordance with the standards of the PublicCompany Accounting Oversight Board (United States), the effective-ness of the Company’s internal control over financial reporting as ofDecember 31, 2005, based on the criteria established in Internal Control—Integrated Framework issued by the Committee of Sponsoring Orga-nizations of the Treadway Commission and our report dated March 3,2006 expressed an unqualified opinion on management’s assessmentof the effectiveness of the Company’s internal control over financialreporting and an unqualified opinion on the effectiveness of the Com-pany’s internal control over financial reporting.
Deloitte & Touche LLPParsippany, New JerseyMarch 3, 2006
REPORT OF INDEPENDENT REGISTERED PUBLIC ACCOUNTING FIRM

CURTISS-WRIGHT AND SUBSIDIARIES 37
To the Board of Directors and Stockholders ofCurtiss-Wright Corporation Roseland, New JerseyWe have audited management’s assessment, included in the accom-panying Management’s Annual Report On Internal Control Over Finan-cial Reporting, that Curtiss-Wright Corporation and subsidiaries(the “Company”) maintained effective internal control over financialreporting as of December 31, 2005, based on the criteria establishedin Internal Control—Integrated Framework issued by the Committee ofSponsoring Organizations of the Treadway Commission. As describedin Management’s Annual Report On Internal Control Over FinancialReporting, management excluded from their assessment the internalcontrol over financial reporting at Indal Technologies, Inc., which wasacquired on March 1, 2005 and whose financial statements reflect totalassets and revenues constituting 6.5 and 2.7 percent, respectively, ofthe related consolidated financial statement amounts as of and for theyear ended December 31, 2005. Accordingly, our audit did not includethe internal control over financial reporting at Indal Technologies, Inc.The Company’s management is responsible for maintaining effectiveinternal control over financial reporting and for its assessment of theeffectiveness of internal control over financial reporting. Our respon-sibility is to express an opinion on management’s assessment and anopinion on the effectiveness of the Company’s internal control overfinancial reporting based on our audit.
We conducted our audit in accordance with the standards of the PublicCompany Accounting Oversight Board (United States). Those standardsrequire that we plan and perform the audit to obtain reasonable assur-ance about whether effective internal control over financial reportingwas maintained in all material respects. Our audit included obtainingan understanding of internal control over financial reporting, evaluat-ing management’s assessment, testing and evaluating the design andoperating effectiveness of internal control, and performing such otherprocedures as we considered necessary in the circumstances. Webelieve that our audit provides a reasonable basis for our opinions.
A company’s internal control over financial reporting is a processdesigned by, or under the supervision of, the company’s principal exec-utive and principal financial officers, or persons performing similarfunctions, and effected by the company’s board of directors, manage-ment, and other personnel to provide reasonable assurance regardingthe reliability of financial reporting and the preparation of financialstatements for external purposes in accordance with generallyaccepted accounting principles. A company’s internal control over
financial reporting includes those policies and procedures that (1) per-tain to the maintenance of records that, in reasonable detail, accuratelyand fairly reflect the transactions and dispositions of the assets of thecompany; (2) provide reasonable assurance that transactions arerecorded as necessary to permit preparation of financial statements inaccordance with generally accepted accounting principles, and thatreceipts and expenditures of the company are being made only inaccordance with authorizations of management and directors of thecompany; and (3) provide reasonable assurance regarding preventionor timely detection of unauthorized acquisition, use, or disposition ofthe company’s assets that could have a material effect on the financialstatements.
Because of the inherent limitations of internal control over financialreporting, including the possibility of collusion or improper manage-ment override of controls, material misstatements due to error or fraudmay not be prevented or detected on a timely basis. Also, projections ofany evaluation of the effectiveness of the internal control over financialreporting to future periods are subject to the risk that the controls maybecome inadequate because of changes in conditions, or that thedegree of compliance with the policies or procedures may deteriorate.
In our opinion, management’s assessment that the Company main-tained effective internal control over financial reporting as of December31, 2005, is fairly stated, in all material respects, based on the criteriaestablished in Internal Control—Integrated Framework issued by theCommittee of Sponsoring Organizations of the Treadway Commission.Also in our opinion, the Company maintained, in all material respects,effective internal control over financial reporting as of December 31,2005, based on the criteria established in Internal Control—IntegratedFramework issued by the Committee of Sponsoring Organizations of theTreadway Commission.
We have also audited, in accordance with the standards of the PublicCompany Accounting Oversight Board (United States), the consolidatedfinancial statements and financial statement schedule as of and for theyear ended December 31, 2005 of the Company and our report datedMarch 3, 2006 expressed an unqualified opinion on those financialstatements and financial statement schedule.
Deloitte & Touche LLPParsippany, New JerseyMarch 3, 2006
REPORT OF INDEPENDENT REGISTERED PUBLIC ACCOUNTING FIRM

38 CURTISS-WRIGHT AND SUBSIDIARIES
For the years ended December 31, (In thousands, except per share data) 2005 2004 2003
Net sales $1,130,928 $ 955,039 $746,071Cost of sales 740,416 624,536 505,153
Gross profit 390,512 330,503 240,918Research and development costs (39,681) (33,825) (22,111)Selling expenses (69,687) (61,648) (38,816)General and administrative expenses (144,982) (118,270) (89,238)Environmental remediation and administrative expenses (818) (5,285) (1,423)Gain (loss) on sale of real estate and fixed assets 2,638 (1,134) (359)
Operating income 137,982 110,341 88,971Interest expense (19,983) (12,031) (5,663)Other income, net 299 443 748
Earnings before income taxes 118,298 98,753 84,056Provision for income taxes (43,018) (33,687) (31,788)
Net earnings $ 75,280 $ 65,066 $ 52,268
NET EARNINGS PER SHARE:Basic earnings per share $ 3.48 $ 3.07 $ 2.53
Diluted earnings per share $ 3.44 $ 3.02 $ 2.50
See notes to consolidated financial statements.
CONSOLIDATED STATEMENTS OF EARNINGS

CURTISS-WRIGHT AND SUBSIDIARIES 39
At December 31, (In thousands) 2005 2004
ASSETS:Current assets:
Cash and cash equivalents $ 59,021 $ 41,038Receivables, net 244,689 214,084Inventories, net 146,297 115,979Deferred tax assets, net 28,844 25,693Other current assets 11,615 12,460
Total current assets 490,466 409,254
Property, plant, and equipment, net 274,821 265,243Prepaid pension costs 76,002 77,802Goodwill 388,158 364,313Other intangible assets, net 158,267 140,369Other assets 12,571 21,459
Total assets $1,400,285 $1,278,440
LIABILITIES:Current liabilities:
Short-term debt $ 885 $ 1,630Accounts payable 80,460 65,364Accrued expenses 74,252 63,413Income taxes payable 22,855 13,895Other current liabilities 43,051 52,793
Total current liabilities 221,503 197,095
Long-term debt 364,017 340,860Deferred tax liabilities, net 53,570 40,043Accrued pension and other postretirement benefit costs 74,999 80,612Long-term portion of environmental reserves 22,645 23,356Other liabilities 25,331 20,860
Total liabilities 762,065 702,826
CONTINGENCIES AND COMMITMENTS (Notes 10, 13, 15 & 17)STOCKHOLDERS’ EQUITY:Preferred stock, $1 par value, 650,000 shares authorized, none issued — —Common stock, $1 par value, 100,000,000 and 33,750,000 shares authorized at
December 31, 2005 and 2004, respectively; 25,493,442 and 16,646,359 shares issued at December 31, 2005 and 2004, respectively; outstanding shares were 21,746,362 at December 31, 2005 and 12,673,912 at December 31, 2004 25,493 16,646
Class B common stock, $1 par value, 11,250,000 shares authorized, 8,764,800 shares issued and 8,764,246 shares outstanding at December 31, 2004 — 8,765
Additional paid-in capital 59,806 55,885Retained earnings 667,892 601,070Unearned portion of restricted stock (12) (34)Accumulated other comprehensive income 20,655 36,797
773,834 719,129Less: Common treasury stock, at cost (3,747,080 shares at December 31, 2005 and
3,973,001 shares at December 31, 2004) (135,614) (143,515)
Total stockholders’ equity 638,220 575,614
Total liabilities and stockholders’ equity $1,400,285 $1,278,440
See notes to consolidated financial statements.
CONSOLIDATED BALANCE SHEETS

40 CURTISS-WRIGHT AND SUBSIDIARIES
For the years ended December 31, (In thousands) 2005 2004 2003
CASH FLOWS FROM OPERATING ACTIVITIES:Net earnings $ 75,280 $ 65,066 $ 52,268
Adjustments to reconcile net earnings to net cash provided by operating activities:Depreciation and amortization 47,851 40,742 31,327Net (gain) loss on sales and disposals of real estate and equipment (2,638) 1,134 359Deferred income taxes 141 (3,500) 6,035Changes in operating assets and liabilities, net of businesses acquired:
Increase in receivables (21,558) (39,875) (5,958)(Increase) decrease in inventories (26,908) 7,578 1,893Increase (decrease) in progress payments 9,815 (4,338) 1,967Increase in accounts payable and accrued expenses 22,976 19,785 9,343(Decrease) increase in deferred revenue (8,049) 4,849 (10,070)Increase in income taxes payable 11,266 8,403 3,240(Decrease) increase in net pension and postretirement liabilities (3,813) 5,054 (5,872)Increase in other current and long-term assets (912) (1,830) (963)Increase (decrease) in other current and long-term liabilities 1,727 2,279 (45)
Total adjustments 29,898 40,281 31,256
Net cash provided by operating activities 105,178 105,347 83,524
CASH FLOWS FROM INVESTING ACTIVITIES:Proceeds from sales and disposals of real estate and equipment 11,268 1,192 1,132Acquisition of intangible assets (5,086) (2,100) (1,575)Additions to property, plant, and equipment (42,444) (32,452) (33,329)Acquisition of new businesses, net of cash acquired (73,111) (247,402) (69,793)
Net cash used for investing activities (109,373) (280,762) (103,565)
CASH FLOWS FROM FINANCING ACTIVITIES:Borrowings of debt 655,000 624,106 384,712Principal payments on debt (630,327) (508,025) (314,204)Proceeds from exercise of stock options 8,492 7,458 3,868Dividends paid (8,458) (7,666) (6,520)
Net cash provided by financing activities 24,707 115,873 67,856
Effect of exchange-rate changes on cash (2,529) 1,908 3,140
Net increase (decrease) in cash and cash equivalents 17,983 (57,634) 50,955Cash and cash equivalents at beginning of year 41,038 98,672 47,717
Cash and cash equivalents at end of year $ 59,021 $ 41,038 $ 98,672
Supplemental disclosure of non-cash investing activities:Fair value of assets acquired from current year acquisitions $ 88,578 $ 303,041 $ 78,231Additional consideration on prior year acquisitions 8,618 3,027 3,147Fair value of Common Stock issued as consideration for acquisitions — (14,000) —Liabilities assumed from current year acquisitions (23,863) (42,331) (10,750)Cash acquired (222) (2,335) (835)
Acquisition of new businesses, net of cash acquired $ 73,111 $ 247,402 $ 69,793
See notes to consolidated financial statements.
CONSOLIDATED STATEMENTS OF CASH FLOWS

CURTISS-WRIGHT AND SUBSIDIARIES 41
Unearned AccumulatedClass B Additional Portion of Other
Common Common Paid in Retained Restricted Comprehensive Comprehensive Treasury(In thousands) Stock Stock Capital Earnings Stock Awards Income (Loss) Income Stock
JANUARY 1, 2003 $10,618 $4,382 $52,200 $508,298 $(60) $ 6,482 $(170,692)
Comprehensive income:Net earnings — — — 52,268 — — $ 52,268 —Translation adjustments, net — — — — — 16,152 16,152 —
Total comprehensive income $ 68,420
Dividends paid — — — (6,520) — — —Stock options exercised, net — — 741 — — — 4,812Other — — 57 — 5 — 138Two-for-one common stock split
effected in the form of a 100%stock dividend 5,993 4,383 — (10,376) — — —
DECEMBER 31, 2003 16,611 8,765 52,998 543,670 (55) 22,634 (165,742)
Comprehensive income:Net earnings — — — 65,066 — — $ 65,066 —Translation adjustments, net — — — — — 14,163 14,163 —
Total comprehensive income $ 79,229
Dividends paid — — — (7,666) — — —Stock options exercised, net — — (1,748) — — — 11,345Stock issued under employee
stock purchase plan, net 35 — 1,358 — — — —Equity issued in connection
with acquisitions — — 3,259 — — — 10,741Other — — 18 — 21 — 141
DECEMBER 31, 2004 $16,646 $8,765 $55,885 $601,070 $(34) $ 36,797 $(143,515)
Comprehensive income:Net earnings — — — 75,280 — — $ 75,280 —Translation adjustments, net — — — — — (16,142) (16,142) —
Total comprehensive income $ 59,138
Dividends paid — — — (8,458) — — —Stock options exercised, net — — 42 — — — 7,721Stock issued under employee
stock purchase plan, net 82 — 3,863 — — — —Recapitalization 8,765 (8,765) — — — — —Other — — 16 — 22 — 180
DECEMBER 31, 2005 $25,493 — $59,806 $667,892 $(12) $ 20,655 $(135,614)
See notes to consolidated financial statements.
CONSOLIDATED STATEMENTS OF STOCKHOLDERS’ EQUITY

42 CURTISS-WRIGHT AND SUBSIDIARIES
1. Summary of Significant Accounting PoliciesCurtiss-Wright Corporation and its subsidiaries (the “Corporation”) isa diversified multinational manufacturing and service company thatdesigns, manufactures, and overhauls precision components and sys-tems and provides highly engineered products and services to theaerospace, defense, automotive, shipbuilding, processing, oil, petro-chemical, agricultural equipment, railroad, power generation, secu-rity, and metalworking industries. Operations are conducted through33 manufacturing facilities, 56 metal treatment service facilities, and2 aerospace component overhaul and repair locations.
A. Principles of ConsolidationThe consolidated financial statements include the accounts of Curtiss-Wright and its majority-owned subsidiaries. All material intercompanytransactions and accounts have been eliminated. Certain prior yearinformation has been reclassified to conform to current presentation.
B. Use of EstimatesThe financial statements of the Corporation have been prepared inconformity with accounting principles generally accepted in the UnitedStates of America, which requires management to make estimatesand judgments that affect the reported amount of assets, liabilities,revenue, and expenses and disclosure of contingent assets and liabil-ities in the accompanying financial statements. The most significant ofthese estimates include the estimate of costs to complete long-termcontracts under the percentage-of-completion accounting methods,the estimate of useful lives for property, plant, and equipment, cashflow estimates used for testing the recoverability of assets, pensionplan and postretirement obligation assumptions, estimates for inven-tory obsolescence, estimates for the valuation and useful lives of intan-gible assets, warranty reserves, and the estimate of futureenvironmental costs. Actual results may differ from these estimates.
C. Revenue RecognitionThe realization of revenue refers to the timing of its recognition in theaccounts of the Corporation and is generally considered realized orrealizable and earned when the earnings process is substantially com-plete and all of the following criteria are met: 1) persuasive evidence ofan arrangement exists; 2) delivery has occurred or services have beenrendered; 3) the Corporation’s price to its customer is fixed or deter-minable; and 4) collectibility is reasonably assured.
The Corporation records sales and related profits on production andservice type contracts as units are shipped and title and risk of losshave transferred or as services are rendered, net of estimated returnsand allowances. Sales and estimated profits under certain long-termcontracts are recognized under the percentage-of-completion meth-ods of accounting, whereby profits are recorded pro rata, based uponcurrent estimates of direct and indirect costs to complete such con-tracts. In addition, the Corporation also records sales under certainlong-term government fixed price contracts upon achievement of per-formance milestones as specified in the related contracts. Losses oncontracts are provided for in the period in which the losses becomedeterminable. Revisions in profit estimates are reflected on a cumula-tive basis in the period in which the basis for such revision becomesknown. Deferred revenue represents the excess of the billings overcost and estimated earnings on long-term contracts.
D. Cash and Cash EquivalentsCash equivalents consist of money market funds and commercialpaper that are readily convertible into cash, all with original maturitydates of three months or less.
E. InventoryInventories are stated at lower of production cost (principally averagecost) or market. Production costs are comprised of direct material andlabor and applicable manufacturing overhead.
F. Progress PaymentsCertain long-term contracts provide for the interim billings as costsare incurred on the respective contracts. Pursuant to contract provi-sions, agencies of the U.S. government and other customers aregranted title or a secured interest in the unbilled costs included inunbilled receivables and materials and work-in-process included ininventory to the extent of progress payments. Accordingly, theseprogress payments received have been reported as a reduction ofunbilled receivables and inventories, as presented in Notes 3 and 4.
G. Property, Plant, and EquipmentProperty, plant, and equipment are carried at cost less accumulateddepreciation. Major renewals and betterments are capitalized, whilemaintenance and repairs that do not improve or extend the life of theasset are expensed in the period they are incurred. Depreciation iscomputed using the straight-line method based upon the estimateduseful lives of the respective assets.
Average useful lives for property, plant and equipment are as follows:
Buildings and improvements 5 to 40 yearsMachinery, equipment, and other 3 to 15 years
H. Intangible AssetsIntangible assets are generally the result of acquisitions and consistprimarily of purchased technology, customer related intangibles,trademarks and service marks, and technology licenses. Definite livedintangible assets are amortized ratably to match their cash flowstreams over their estimated useful lives, which range from 1 to 20years, while indefinite lived intangible assets are not amortized. Indef-inite lived intangible assets are reviewed for impairment annuallybased on the discounted future cash flows. See Note 7 for further infor-mation on other intangible assets.
I. Impairment of Long-Lived AssetsThe Corporation reviews the recoverability of all long-term assets,including the related useful lives, whenever events or changes in cir-cumstances indicate that the carrying amount of a long-lived assetmight not be recoverable. If required, the Corporation compares theestimated undiscounted future net cash flows to the related asset’scarrying value to determine whether there has been an impairment. Ifan asset is considered impaired, the asset is written down to fair value,which is based either on discounted cash flows or appraised values inthe period the impairment becomes known. There were no such write-downs in 2005, 2004, or 2003.
NOTES TO CONSOLIDATED FINANCIAL STATEMENTS

CURTISS-WRIGHT AND SUBSIDIARIES 43
J. GoodwillGoodwill results from business acquisitions. The Corporationaccounts for business acquisitions by allocating the purchase price totangible and intangible assets and liabilities. Assets acquired and lia-bilities assumed are recorded at their fair values, and the excess of thepurchase price over the amounts allocated is recorded as goodwill. Therecoverability of goodwill is subject to an annual impairment test, orwhenever an event occurs or circumstances change that would morelikely than not result in an impairment. The impairment test is basedon the estimated fair value of the underlying businesses. See Note 6 forfurther information on goodwill.
K. Fair Value of Financial InstrumentsSFAS No. 107, “Disclosure About Fair Value of Financial Instruments,”requires certain disclosures regarding the fair value of financial instru-ments. Due to the short maturities of cash and cash equivalents,accounts receivable, accounts payable, and accrued expenses, the netbook value of these financial instruments are deemed to approximatefair value.
The estimated fair values of the Corporation’s fixed rate debt instru-ments at December 31, 2005 aggregated $357.9 million compared to acarrying value of $349.8 million. The carrying amount of the variableinterest rate debt approximates fair value because the interest ratesare reset periodically to reflect current market conditions. Fair valuesfor the Corporation’s fixed rate debt were estimated by management.
The fair values described above may not be indicative of net realizablevalue or reflective of future fair values. Furthermore, the use of differ-ent methodologies to determine the fair value of certain financialinstruments could result in a different estimate of fair value at thereporting date.
L. Research and DevelopmentThe Corporation funds research and development programs for com-mercial products and independent research and development and bidand proposal work related to government contracts. Developmentcosts include engineering and field support for new customer require-ments. Corporation-sponsored research and development costs areexpensed as incurred.
Research and development costs associated with customer-spon-sored programs are charged to inventory and are recorded in cost ofsales when products are delivered or services performed.
M. Environmental CostsThe Corporation establishes a reserve for a potential environmentalremediation liability on a site by site basis when it concludes that adetermination of legal liability is probable and the amount of the liabil-ity can be reasonably estimated based on current law and existingtechnologies. Such amounts, if quantifiable, reflect the Corporation’sestimate of the amount of that liability. If only a range of potential lia-bility can be estimated and no amount within the range is more prob-able than another, a reserve will be established at the low end of thatrange. At sites involving multiple parties, the Corporation accruesenvironmental liabilities based upon its expected share of the liability,taking into account the financial viability of other jointly liable partners.Such reserves, which are reviewed quarterly, are adjusted as assess-
ment and remediation efforts progress or as additional informationbecomes available. Approximately 80% of the Corporation’s environ-mental reserves as of December 31, 2005 represent the current valueof anticipated remediation costs and are not discounted primarily dueto the uncertainty of timing of expenditures. The remaining environ-mental reserves are discounted to reflect the time value of moneysince the amount and timing of cash payments for the liability are reli-ably determinable. All environmental reserves exclude any potentialrecovery from insurance carriers or third-party legal actions.
N. Accounting for Stock-Based CompensationIn accordance with SFAS No. 123, “Accounting for Stock-Based Com-pensation” (“FAS 123”), the Corporation elected to account for itsstock-based compensation using the intrinsic value method underAccounting Principles Board Opinion No. 25, “Accounting for StockIssued to Employees”. As such, the Corporation does not recognizecompensation expense on non-qualified stock options granted toemployees under the Corporation’s 1995 or 2005 Long-Term IncentivePlan (the “1995 LTI Plan” or the “2005 LTI Plan” respectively), whenthe exercise price of the options is equal to the market price of theunderlying stock on the date of the grant, or on non-qualified stockoptions granted under the Corporation’s Employee Stock PurchasePlan (“ESPP”). In December 2004, the FASB issued FAS 123 (revised2004)(“FAS 123R”), under which, the Corporation will begin toexpense stock option grants beginning in the first quarter 2006.Please see Recently Issued Accounting Standards for further informationon this standard.
Pro forma information regarding net earnings and earnings per shareis required by FAS 123 and has been determined as if the Corporationhad accounted for its employee stock option grants under the fair valuemethod prescribed by that Statement. Information with regard to thenumber of options granted, market price of the grants, vesting require-ments, and the maximum term of the options granted appears by plantype in Note 12. The fair value of the LTI Plan options was estimated atthe date of grant using a Black-Scholes option pricing model with thefollowing weighted-average assumptions:
2005 2004 2003
Risk-free interest rate 4.52% 3.89% 3.68%Expected volatility 23.21% 31.37% 31.68%Expected dividend yield 0.86% 0.64% 0.94%Weighted-average option life 7 years 7 years 7 yearsWeighted-average grant-date
fair value of options $18.12 $21.43 $13.97
The fair value of the ESPP options was estimated at the date of grantusing a Black-Scholes option pricing model with the followingweighted-average assumptions:
2005 2004
Risk-free interest rate 2.86% 1.33%Expected volatility 30.98% 23.99%Expected dividend yield 0.33% 0.35%Weighted-average option life 0.5 years 0.5 yearsWeighted-average grant-date
fair value of options $13.35 $11.21

44 CURTISS-WRIGHT AND SUBSIDIARIES
The Corporation’s pro forma information for the years ended Decem-ber 31, 2005, 2004, and 2003 is as follows:
(In thousands, except per share data) 2005 2004 2003
NET EARNINGS: AS REPORTED $75,280 $65,066 $52,268
Deduct:Total stock-based employee compensation expense determined under fair value based method for all awards, net of related tax effects (2,565) (1,862) (1,261)
Pro forma $72,715 $63,204 $51,007NET EARNINGS
PER SHARE:As reported:
Basic $ 3.48 $ 3.07 $ 2.53Diluted $ 3.44 $ 3.02 $ 2.50
Pro forma:Basic $ 3.36 $ 2.98 $ 2.47Diluted $ 3.32 $ 2.93 $ 2.44
The Corporation receives tax deductions related to the exercise of non-qualified LTI Plan options and disqualifying dispositions of stockgranted under the ESPP, the offset of which is recorded in equity. Thetax benefit of these deductions totaled $3.2 million, $3.5 million, and$1.7 million in 2005, 2004, and 2003, respectively.
O. Capital StockOn May 24, 2005, the Corporation completed a recapitalization thatresulted in the combination of the Corporation’s two classes of com-mon stock into a single new class by converting all outstanding sharesof Common stock and Class B common stock into a single new class ofcommon stock. The recapitalization was accomplished through amerger of a wholly owned subsidiary into the Corporation, in which theoutstanding shares of Common stock and Class B common stock wereexchanged for shares of the single class of Common stock. The rela-tive ownership of the Corporation’s new class of Common stock wasthe same immediately after the merger as it was immediately prior.
In addition to the recapitalization, in May 2005, shareholders approveda proposal to increase the number shares of Common stock autho-rized for issuance from 45 million shares to 100 million shares.
On May 23, 2003, the stockholders approved an increase in the num-ber of authorized shares of the Corporation’s Common stock from11,250,000 to 33,750,000. On November 18, 2003, the Board of Direc-tors declared a 2-for-1 stock split in the form of a 100% stock dividend.The split, in the form of 1 share of Common stock for each share ofCommon stock outstanding and 1 share of Class B common stock foreach share of Class B common stock outstanding, was payable onDecember 17, 2003. To effectuate the stock split, the Corporationissued 5,993,864 original shares of Common stock and 4,382,400 orig-inal shares of Class B common stock, at $1.00 par value from capitalsurplus, with a corresponding reduction in retained earnings of $10.4million. Accordingly, all references throughout this Annual Report to
number of shares, per share amounts, stock options data, and marketprices of the Corporation’s two classes of common stock have beenadjusted to reflect the effect of the stock split for all periods presented,where applicable. On February 7, 2006, the Board of Directors declareda 2-for1 stock split in the form of a 100% stock dividend. Further infor-mation of the Corporation’s recently announced stock split is disclosedin Note 19.
The Corporation is authorized to repurchase 900,000 shares under itsexisting stock repurchase program. Purchases are authorized to bemade from time to time in the open market or privately negotiatedtransactions, depending on market and other conditions, whenevermanagement believes that the market price of the stock does not ade-quately reflect the true value of the Corporation and, therefore, repre-sented an attractive investment opportunity. The shares are held atcost and reissuance is recorded at the weighted-average cost. ThroughDecember 31, 2005, the Corporation had repurchased 210,930 sharesunder this program. There was no stock repurchased during 2005,2004, and 2003.
P. Earnings Per ShareThe Corporation is required to report both basic earnings per share(“EPS”), based on the weighted-average number of Common andClass B shares outstanding, and diluted earnings per share, based onthe basic EPS adjusted for all potentially dilutive shares issuable. Thecalculation of EPS is disclosed in Note 11.
Q. Income TaxesThe Corporation applies SFAS No. 109, “Accounting for Income Taxes.”Under the asset and liability method of SFAS No. 109, deferred taxassets and liabilities are recognized for future tax consequencesattributable to differences between the financial statement carryingamounts of existing assets and liabilities and their respective taxbases. The effect on deferred tax assets and liabilities of a change intax laws is recognized in the results of operations in the period the newlaws are enacted. A valuation allowance is recorded to reduce the car-rying amounts of deferred tax assets unless it is more likely than notthat such assets will be realized.
R. Foreign Currency TranslationFor operations outside the United States of America that preparefinancial statements in currencies other than the U.S. dollar, the Cor-poration translates assets and liabilities at period-end exchange ratesand income statement amounts using weighted-average exchangerates for the period. The cumulative effect of translation adjustmentsis presented as a component of accumulated other comprehensiveincome within stockholders’ equity. This balance is affected by foreigncurrency exchange rate fluctuations and by the acquisition of foreignentities. Gains and losses from foreign currency transactions areincluded in results of operations.
S. DerivativesThe Corporation has used interest rate swaps and forward foreign cur-rency contracts to manage its exposure to fluctuations in interest rateson a portion of its fixed rate debt instruments and foreign currencyrates at its foreign subsidiaries. The foreign currency contracts aremarked to market with changes in the fair value reported in income in
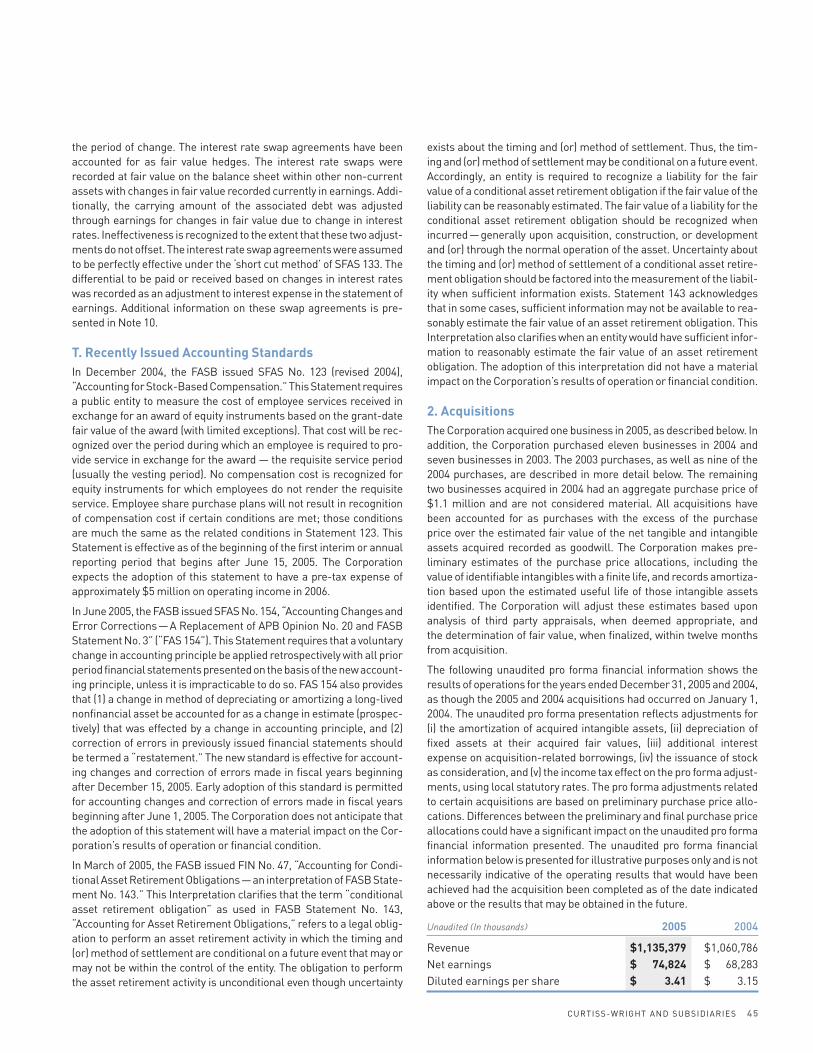
CURTISS-WRIGHT AND SUBSIDIARIES 45
the period of change. The interest rate swap agreements have beenaccounted for as fair value hedges. The interest rate swaps wererecorded at fair value on the balance sheet within other non-currentassets with changes in fair value recorded currently in earnings. Addi-tionally, the carrying amount of the associated debt was adjustedthrough earnings for changes in fair value due to change in interestrates. Ineffectiveness is recognized to the extent that these two adjust-ments do not offset. The interest rate swap agreements were assumedto be perfectly effective under the ‘short cut method’ of SFAS 133. Thedifferential to be paid or received based on changes in interest rateswas recorded as an adjustment to interest expense in the statement ofearnings. Additional information on these swap agreements is pre-sented in Note 10.
T. Recently Issued Accounting StandardsIn December 2004, the FASB issued SFAS No. 123 (revised 2004),“Accounting for Stock-Based Compensation.” This Statement requiresa public entity to measure the cost of employee services received inexchange for an award of equity instruments based on the grant-datefair value of the award (with limited exceptions). That cost will be rec-ognized over the period during which an employee is required to pro-vide service in exchange for the award — the requisite service period(usually the vesting period). No compensation cost is recognized forequity instruments for which employees do not render the requisiteservice. Employee share purchase plans will not result in recognitionof compensation cost if certain conditions are met; those conditionsare much the same as the related conditions in Statement 123. ThisStatement is effective as of the beginning of the first interim or annualreporting period that begins after June 15, 2005. The Corporationexpects the adoption of this statement to have a pre-tax expense ofapproximately $5 million on operating income in 2006.
In June 2005, the FASB issued SFAS No. 154, “Accounting Changes andError Corrections—A Replacement of APB Opinion No. 20 and FASBStatement No. 3” (“FAS 154”). This Statement requires that a voluntarychange in accounting principle be applied retrospectively with all priorperiod financial statements presented on the basis of the new account-ing principle, unless it is impracticable to do so. FAS 154 also providesthat (1) a change in method of depreciating or amortizing a long-livednonfinancial asset be accounted for as a change in estimate (prospec-tively) that was effected by a change in accounting principle, and (2)correction of errors in previously issued financial statements shouldbe termed a “restatement.” The new standard is effective for account-ing changes and correction of errors made in fiscal years beginningafter December 15, 2005. Early adoption of this standard is permittedfor accounting changes and correction of errors made in fiscal yearsbeginning after June 1, 2005. The Corporation does not anticipate thatthe adoption of this statement will have a material impact on the Cor-poration’s results of operation or financial condition.
In March of 2005, the FASB issued FIN No. 47, “Accounting for Condi-tional Asset Retirement Obligations—an interpretation of FASB State-ment No. 143.” This Interpretation clarifies that the term “conditionalasset retirement obligation” as used in FASB Statement No. 143,“Accounting for Asset Retirement Obligations,” refers to a legal oblig-ation to perform an asset retirement activity in which the timing and(or) method of settlement are conditional on a future event that may ormay not be within the control of the entity. The obligation to performthe asset retirement activity is unconditional even though uncertainty
exists about the timing and (or) method of settlement. Thus, the tim-ing and (or) method of settlement may be conditional on a future event.Accordingly, an entity is required to recognize a liability for the fairvalue of a conditional asset retirement obligation if the fair value of theliability can be reasonably estimated. The fair value of a liability for theconditional asset retirement obligation should be recognized whenincurred—generally upon acquisition, construction, or developmentand (or) through the normal operation of the asset. Uncertainty aboutthe timing and (or) method of settlement of a conditional asset retire-ment obligation should be factored into the measurement of the liabil-ity when sufficient information exists. Statement 143 acknowledgesthat in some cases, sufficient information may not be available to rea-sonably estimate the fair value of an asset retirement obligation. ThisInterpretation also clarifies when an entity would have sufficient infor-mation to reasonably estimate the fair value of an asset retirementobligation. The adoption of this interpretation did not have a materialimpact on the Corporation’s results of operation or financial condition.
2. AcquisitionsThe Corporation acquired one business in 2005, as described below. Inaddition, the Corporation purchased eleven businesses in 2004 andseven businesses in 2003. The 2003 purchases, as well as nine of the2004 purchases, are described in more detail below. The remainingtwo businesses acquired in 2004 had an aggregate purchase price of$1.1 million and are not considered material. All acquisitions havebeen accounted for as purchases with the excess of the purchaseprice over the estimated fair value of the net tangible and intangibleassets acquired recorded as goodwill. The Corporation makes pre-liminary estimates of the purchase price allocations, including thevalue of identifiable intangibles with a finite life, and records amortiza-tion based upon the estimated useful life of those intangible assetsidentified. The Corporation will adjust these estimates based uponanalysis of third party appraisals, when deemed appropriate, andthe determination of fair value, when finalized, within twelve monthsfrom acquisition.
The following unaudited pro forma financial information shows theresults of operations for the years ended December 31, 2005 and 2004,as though the 2005 and 2004 acquisitions had occurred on January 1,2004. The unaudited pro forma presentation reflects adjustments for(i) the amortization of acquired intangible assets, (ii) depreciation offixed assets at their acquired fair values, (iii) additional interestexpense on acquisition-related borrowings, (iv) the issuance of stockas consideration, and (v) the income tax effect on the pro forma adjust-ments, using local statutory rates. The pro forma adjustments relatedto certain acquisitions are based on preliminary purchase price allo-cations. Differences between the preliminary and final purchase priceallocations could have a significant impact on the unaudited pro formafinancial information presented. The unaudited pro forma financialinformation below is presented for illustrative purposes only and is notnecessarily indicative of the operating results that would have beenachieved had the acquisition been completed as of the date indicatedabove or the results that may be obtained in the future.
Unaudited (In thousands) 2005 2004
Revenue $1,135,379 $1,060,786Net earnings $ 74,824 $ 68,283Diluted earnings per share $ 3.41 $ 3.15

46 CURTISS-WRIGHT AND SUBSIDIARIES
The results of each acquired business have been included in the con-solidated financial results of the Corporation from the date of acquisi-tion in the segment indicated as follows:
FLOW CONTROLENGINEERED PUMP DIVISION
On November 10, 2004, the Corporation acquired certain assets of theGovernment Marine Business Unit division of Flowserve Corporation,subsequently renamed the Engineered Pump Division (“EPD”). Theeffective date of the acquisition was November 1, 2004. The purchaseprice, subject to customary adjustments provided for in the Asset Pur-chase Agreement, was $28.1 million in cash and the assumption ofcertain liabilities. The purchase price was funded from credit availableunder the Corporation’s revolving credit facilities. The excess of thepurchase price over the fair value of the net assets acquired is $7.6 mil-lion at December 31, 2005. Revenues of the purchased business were$26.4 million for the year ended December 31, 2003.
EPD is a leading designer and manufacturer of highly engineered,critical function pumps for the U.S. Navy nuclear submarine and air-craft carrier programs and non-nuclear surface ships. EPD is the solesource supplier of main and auxiliary seawater, fresh water, and cool-ing pumps, coolant purification pumps, injection, chilled water, andother critical pumps. Approximately 85% of this business supportsnuclear programs, and 15% supports non-nuclear naval surfaceprograms. EPD has a strong and growing aftermarket businessfor repairs, refurbishments, and parts, which constitutes approxi-mately 45% of total sales. EPD’s operations are located in Phillipsburg,New Jersey.
GROQUIP
On July 12, 2004, the Corporation acquired the outstanding stock ofGroth Equipment Corporation of Louisiana (“Groquip”). The purchaseprice, subject to customary adjustments provided for in the Stock Pur-chase Agreement, was $4.5 million payable in approximately 18,000shares of the Corporation’s restricted Common stock valued at $1.0million and cash of $3.5 million, and the assumption of certain liabili-ties. The cash portion of the purchase price was funded from creditavailable under the Corporation’s revolving credit facilities. The pur-chase price approximated the fair value of the net assets acquired asof December 31, 2005.
Groquip is a market leader in the hydrocarbon and chemical process-ing industries. Groquip provides products and services for variouspressure-related processes that ensure safe operation and regulatorycompliance. Groquip is a manufacturer’s sales representative for rup-ture discs, conservation vents, fire and gas detectors, and pressurerelief valves. They also provide field and in-shop service and repairs forpressure relief valves and a variety of specialty valves. Groquip is head-quartered in Geismar, Louisiana and has a sales and service centerlocated in Sulphur, Louisiana. Revenues of the acquired business were$10.1 million for the twelve months ended June 30, 2004.
NOVA
On May 24, 2004, the Corporation acquired certain assets of NOVAMachine Products Corporation (“NOVA”). The purchase price was$20.0 million in cash and the assumption of certain liabilities. The pur-chase price was funded from credit available under the Corporation’srevolving credit facilities. There are provisions in the agreement for
additional payments upon the achievement of certain financial perfor-mance criteria through 2009 up to a maximum additional payment of$9.2 million. Through December 31, 2005, the Corporation has madeno payments of additional consideration under these provisions. Theexcess of the purchase price over the fair value of the net assetsacquired is $5.0 million at December 31, 2005.
NOVA is one of the largest suppliers of safety-related fasteners tothe U.S. nuclear power industry and the Department of Energy andalso provides a wide range of manufactured and distributed prod-ucts and related services. NOVA is headquartered in MiddleburgHeights, Ohio, with distribution centers in Glendale Heights, Illinois,and Decatur, Alabama, and five sales offices throughout the U.S. Rev-enues of the acquired business were $17.1 million for the year endedDecember 31, 2003.
On September 1, 2005, NOVA acquired the HydraNut product line andrelated intellectual property of Technofast International, a whollyowned subsidiary of Tech Novus Pty. Ltd of Brisbane, Australia (“Tech-nofast”). The acquisition of this product line replaced a licensing agree-ment between NOVA and Technofast, which was part of the acquiredassets of the Corporation’s acquisition of NOVA in 2004.
The purchase price of $8.0 million included an initial cash payment of$4.5 million and will require quarterly cash payments calculated as apercentage of sales of the product line, not to exceed $3.5 million overan eight year period. Any remaining purchase price unpaid at the endof eight years will expire unpaid. The Corporation estimates this liabil-ity will be paid down within five years.
The acquisition of this technology was accounted for as an acquisitionof intangible assets. As such, the Corporation has estimated the fairvalue of the future payments as of September 1, 2005 to be $3.0 mil-lion and has recorded a liability. The intangible asset was capitalized asdeveloped technology in the amount of $7.5 million and will be amor-tized over its 20 year useful life.
The HydraNut fastener provides simple and accurate tensioning insafety risk situations and hard to access areas for customers in nuclearpower generation, industrial, and other energy markets.
TRENTEC
On May 24, 2004, the Corporation acquired certain assets of Trentec,Inc. (“Trentec”). The purchase price, subject to customary adjustmentsprovided for in the Asset Purchase Agreement, was $13.9 million,payable in approximately 280,000 shares of the Corporation’srestricted Common stock valued at $13.0 million, cash of $0.9 million,and the assumption of certain liabilities. The excess of the purchaseprice over the fair value of the net assets acquired is $5.3 million atDecember 31, 2005.
In August 2005, the Corporation completed negotiations with the sell-ers of Trentec regarding a post-closing dispute. The settlementresulted in $0.9 million of recovery, which is included in operatingincome for 2005, and $0.1 million of additional consideration paidunder the working capital adjustment, which increased the purchaseprice of the acquired business. The effect of the settlement was treatedas a non-cash transaction for purposes of preparing the statement ofcash flows as the net settlement of $0.8 million was effectuatedthrough the forfeiture of the cash holdback in the same amount.

CURTISS-WRIGHT AND SUBSIDIARIES 47
Trentec’s services include specialty equipment fabrication, diamondwiresaw cutting, nuclear power plant equipment qualification, andthird-party dedication and supply of nuclear components. Trentec’soperations are located in Cincinnati, Ohio. Revenues of the acquiredbusiness were $13.5 million for the year ended December 31, 2003.
MOTION CONTROLINDAL TECHNOLOGIES, INC.
On March 1, 2005, the Corporation acquired the outstanding stock ofthe parent corporation of Indal Technologies, Inc. (“Indal”). The pur-chase price was 80.3 million Canadian dollars ($64.7 million) in cashand was funded from credit available under the Corporation’s revolv-ing credit facilities.
The purchase price of the acquisition has been preliminarily allocatedto the net tangible and intangible assets acquired, with the remainderrecorded as goodwill, on the basis of estimated fair values as ofDecember 31, 2005, as follows:
(In thousands)
Net working capital $ 16,216Property, plant, and equipment 11,324Intangible assets 21,456Deferred income tax liabilities (11,315)
Net tangible and intangible assets 37,681Purchase price, including capitalized acquisition costs 64,715
Goodwill $ 27,034
The estimated excess of the purchase price over the fair value of thenet assets acquired is $28.8 million at December 31, 2005, includingforeign currency translation adjustment gains of $1.8 million. The fairvalue of the net assets acquired was based on current estimates. TheCorporation may adjust these estimates based upon analysis of thirdparty appraisals and the final determination of fair value.
Indal provides shipboard helicopter handling systems for naval appli-cations with a global installed base on over 200 ships, including morethan 100 systems deployed in the U.S. Navy. Indal’s highly engineered,proprietary products enable helicopters to land aboard naval vesselsin rough sea conditions. Indal also designs and manufactures special-ized telescopic hangars that provide protection for helicopters aboardships and cable handling systems for naval sonar applications. Indal isheadquartered near Toronto, Ontario, Canada. Revenues of theacquired business were 49.4 million Canadian dollars ($38.2 million)for the year ended December 31, 2004.
SYNERGY
On August 31, 2004, the Corporation acquired the outstanding stock ofSynergy Microsystems, Inc (“Synergy”). The purchase price was $49.1million in cash and was funded from credit available under the Corpo-ration’s revolving credit facilities. Under the terms of the agreement,the Corporation deposited $2.5 million into escrow as security forpotential indemnification claims against the seller. Any escrowremaining after claims for indemnification have been settled will bepaid to the seller 18 months from the acquisition date by the escrowagent. The excess of the purchase price over the fair value of the netassets acquired is $31.3 million at December 31, 2005.
Synergy specializes in the design, manufacture and integration of sin-gle- and multi-processor, single-board computers for VME and Com-pactPCI systems to meet the needs of demanding real-timeapplications in military, aerospace, industrial and commercial mar-kets. Synergy is headquartered in San Diego, California and has a facil-ity in Tucson, Arizona. Revenues of the acquired business were $17.5million for the year ended December 31, 2003.
PRIMAGRAPHICS
On May 28, 2004, the Corporation acquired the outstanding stock ofPrimagraphics Holdings Limited (“Primagraphics”). The purchaseprice, subject to customary adjustments provided for in the Stock Pur-chase Agreement, was £12.5 million ($22.4 million) in cash. The pur-chase price was funded from credit available under the Corporation’srevolving credit facilities. The estimated excess of the purchase priceover the fair value of the net assets acquired is $13.7 million at Decem-ber 31, 2005, including foreign currency translation adjustment lossesof $0.6 million.
Primagraphics is a market leader in the development of radar pro-cessing and graphic display systems used throughout the world formilitary and commercial applications, such as ship and airborne com-mand and control consoles, vessel tracking, air traffic control, and airdefense systems. Primagraphics’ products include graphics andimaging technologies, video and sensor processing hardware, andsoftware that can be readily engineered to provide vital components fora wide variety of systems. Primagraphics is headquartered near Cam-bridge in the United Kingdom, with an additional facility in Char-lottesville, Virginia, and a worldwide network of dealers anddistributors. Revenues of the acquired business were £6.8 million($10.9 million) for the fiscal year ended June 30, 2003.
Dy 4
On January 31, 2004, the Corporation acquired the outstanding stockof Dy 4 Systems, Inc. and Dy 4 (U.S.) Inc. (collectively “Dy 4”). The pur-chase price was $110.4 million in cash and the assumption of certainliabilities. Management funded the purchase price with cash on handand from the Corporation’s revolving credit facilities. The purchaseprice has been allocated to the net tangible and intangible assetsacquired, with the remainder recorded as goodwill, on the basis of fairvalues as of December 31, 2005, as follows:
(In thousands)
Net working capital $ 10,665Property, plant, and equipment 6,238Deferred tax liabilities (9,840)Intangible assets 40,549
Net tangible and intangible assets $ 47,612Purchase price, including capitalized acquisition costs 110,376
Goodwill $ 62,764
Dy 4 is considered a market leader in ruggedized embedded comput-ing solutions for the defense and aerospace industries. Using stan-dard, commercially available computing technologies, referred to ascommercial-off-the-shelf, Dy 4 customizes the products to performreliably in rugged conditions, such as extreme temperature, terrain,and speed. The acquisition was made primarily to complement the
48 CURTISS-WRIGHT AND SUBSIDIARIES
Corporation’s existing businesses that serve the embedded comput-ing market. Based in Ottawa, Canada, Dy 4 also has a facility in Virginiaand a sales office in the United Kingdom. Revenues of the purchasedbusiness for the fiscal year ending August 29, 2003 were $72.4 million.
NOVATRONICS/PICKERING
On December 4, 2003, the Corporation acquired all of the outstandingstock of Novatronics Inc. (“Novatronics”) and Pickering Controls Inc.(“Pickering”). The purchase price was $13.6 million in cash and theassumption of certain liabilities and was funded with proceeds fromthe Senior Notes issued in September 2003. The excess of the pur-chase price over the fair value of the net assets acquired as of Decem-ber 31, 2005 is $6.4 million, including foreign currency translationadjustment gains of $0.3 million.
Novatronics and Pickering design and manufacture electric motorsand position sensors (both linear and rotary) for the commercial aero-space, military aerospace, and industrial markets. Novatronics hasoperating facilities located in Stratford, Ontario, Canada, while Picker-ing is located in Plainview, NY. Revenues of the purchased businesswere $12.0 million for the year ended December 31, 2002.
SYSTRAN CORPORATION
On December 1, 2003, the Corporation acquired all of the outstandingshares of Systran Corporation (“Systran”). The purchase price was$18.3 million in cash and the assumption of certain liabilities and wasfunded with proceeds from the Senior Notes issued in September2003. The excess of the purchase price over the fair value of the netassets acquired as of December 31, 2005 is $9.2 million.
Systran is a leading supplier of highly specialized, high performancedatacommunications products for real-time systems, primarily for theaerospace and defense, industrial automation, and medical imagingmarkets. Key applications include simulation, process control,advanced digital signal processing, data acquisition, image process-ing, and test and measurement. Systran’s operations are located inDayton, Ohio. Revenues of the purchased business were $15.1 millionfor the year ended September 30, 2003.
PERITEK CORPORATION
On August 1, 2003, the Corporation acquired the assets and certain lia-bilities of Peritek Corporation (“Peritek”). The purchase price was $3.2million in cash and the assumption of certain liabilities. The purchaseprice of the acquisition approximates the fair value of the net assetsacquired as of December 31, 2005, which includes developed technol-ogy of approximately $2.6 million.
Peritek is a leading supplier of video and graphic display boards for theembedded computing industry and supplies a variety of industriesincluding aviation, defense, and medical. In addition, Peritek suppliesproducts for bomb detection, industrial automation, and medicalimaging applications. Peritek’s operations are located in Oakland, Cal-ifornia. Revenues of the purchased business for the fiscal year endingMarch 31, 2003 were $2.7 million.
COLLINS TECHNOLOGIES
On February 28, 2003, the Corporation acquired the assets of CollinsTechnologies (“Collins”). The purchase price was $11.8 million in cashand the assumption of certain liabilities. Management funded the pur-chase price from credit available under the Corporation’s Short-TermCredit Agreement. The excess of the purchase price over the fair valueof the net assets acquired as of December 31, 2005 is $6.2 million.
Collins designs and manufactures linear variable displacement trans-ducers (“LVDTs”) primarily for aerospace flight and engine controlapplications. Industrial LVDTs are used mostly in industrial automationand test applications. Collins’ operations are located in Long Beach,California. Revenues of the purchased business were $8.3 million forthe year ended March 31, 2002.
METAL TREATMENTEVERLUBE
On April 2, 2004, the Corporation purchased the assets of the EverlubeProducts division (“Everlube”) of Morgan Advanced Ceramics, Inc. Thepurchase price was $6.5 million in cash and the assumption of certainliabilities. The purchase price was funded from credit available underthe Corporation’s revolving credit facilities. The estimated excess ofthe purchase price over the fair value of the net assets acquired is $3.3million at December 31, 2005.
Everlube is a pioneer and leader in manufacturing solid film lubricant(“SFL”) and other specialty engineered coatings with more than 180formulations available. Everlube’s engineered coatings improve thefunctional performance of metal components in lubrication, tempera-ture, and corrosion resistance. Everlube is located in Peachtree City,Georgia. Revenues of the acquired business were $3.9 million for theyear ended December 31, 2003.
EVESHAM
On February 24, 2004, the Corporation purchased the assets of the Eve-sham coatings business located in the United Kingdom (“Evesham”)from Morgan Advanced Ceramics, Ltd. The purchase price was £3.5million ($6.5 million) in cash and the assumption of certain liabilities.The purchase price was funded from credit available under the Corpo-ration’s revolving credit facilities. The excess of the purchase price overthe fair value of the net assets acquired is $2.0 million at December 31,2005, including foreign currency translation adjustment losses of $0.2million.
Evesham manufactures and applies an extensive range of SFL coat-ings, which provide lubrication, corrosion resistance, and enhancedengineering performance. Revenues of the acquired business were£2.6 million ($4.2 million) for the year ended December 31, 2003.
E/M ENGINEERED COATINGS SOLUTIONS
On April 2, 2003, the Corporation purchased selected assets of E/MEngineered Coatings Solutions (“E/M Coatings”). The purchase pricewas $16.8 million in cash and the assumption of certain liabilities. Thepurchase price was funded from credit available under the Corpora-tion’s Short-Term Credit Agreement. The excess of the purchase priceover the fair value of the net assets acquired as of December 31, 2005is $6.4 million.

CURTISS-WRIGHT AND SUBSIDIARIES 49
The Corporation acquired six E/M Coatings facilities operating inChicago, Illinois; Detroit, Michigan; Minneapolis, Minnesota; Hartford,Connecticut; and North Hollywood and Chatsworth, California. Com-bined, these facilities are one of the leading providers of SFL coatingsin the United States. The E/M Coatings facilities have the capability ofapplying over 1,100 different coatings to impart lubrication, corrosionresistance, and certain cosmetic and dielectric properties to selectedcomponents. Revenues of the purchased business were approximately$26 million for the year ended December 31, 2002.
ADVANCED MATERIAL PROCESS
On March 11, 2003, the Corporation acquired selected net assets ofAdvanced Material Process Corp. (“AMP”), a private company withoperations located in Wayne, Michigan. The purchase price was $6.0million in cash and the assumption of certain liabilities. There are pro-visions in the agreement for additional payments upon the achieve-ment of certain financial performance criteria through 2008 up to amaximum additional payment of $1.0 million. As of December 31,2005, the Corporation has paid $0.1 million in such additional consid-eration. Management funded the purchase from credit available underthe Corporation’s Short-Term Credit Agreement. The excess of thepurchase price over the fair value of the net assets acquired as ofDecember 31, 2005 is $1.4 million.
AMP is a supplier of commercial shot peening services primarily to theautomotive market in the Detroit area. Revenues of the purchasedbusiness were $5.1 million for the year ended December 31, 2002.
3. ReceivablesReceivables include current notes, amounts billed to customers,claims and other receivables, and unbilled revenue on long-term con-tracts, consisting of amounts recognized as sales but not billed. Sub-stantially all amounts of unbilled receivables are expected to be billedand collected in the subsequent year.
Credit risk is generally diversified due to the large number of entitiescomprising the Corporation’s customer base and their geographic dis-persion. The Corporation is either a prime contractor or subcontrac-tor of various agencies of the U.S. Government. Revenues deriveddirectly and indirectly from government sources (primarily the U.S.Government) were 48%, 47%, and 46% of consolidated revenues in2005, 2004, and 2003, respectively. As of December 31, 2005 and 2004,accounts receivable due directly or indirectly from these governmentsources represented 52% and 42% of net receivables, respectively.Sales to one customer through which the Corporation is a subcontrac-tor to the U.S. Government were 10% of consolidated revenues in 2005,13% in 2004, and 16% in 2003. No single customer accounted for morethan 10% of the Corporation’s net receivables as of December 31, 2005and 2004.
The Corporation performs ongoing credit evaluations of its customersand establishes appropriate allowances for doubtful accounts basedupon factors surrounding the credit risk of specific customers, histor-ical trends, and other information.
The composition of receivables is as follows:
(In thousands) December 31, 2005 2004
BILLED RECEIVABLES:Trade and other receivables $171,203 $156,891
Less: Allowance for doubtful accounts (5,453) (4,011)
Net billed receivables 165,750 152,880
UNBILLED RECEIVABLES:Recoverable costs and estimated
earnings not billed 107,618 79,156Less: Progress payments applied (28,679) (17,952)
Net unbilled receivables 78,939 61,204
Receivables, net $244,689 $214,084
The net receivable balance at December 31, 2005 included $18.4 mil-lion related to the Corporation’s 2005 acquisition.
4. InventoriesIn accordance with industry practice, inventoried costs containamounts relating to long-term contracts and programs with long pro-duction cycles, a portion of which will not be realized within one year.Inventories are valued at the lower of cost (principally average cost) ormarket. The composition of inventories is as follows:
(In thousands) December 31, 2005 2004
Raw material $ 59,336 $ 49,616Work-in-process 43,099 35,157Finished goods and component parts 52,825 50,117Inventoried costs related to
U.S. Government and other long-term contracts 27,533 19,396
Gross inventories 182,793 154,286
Less: Inventory reserves (25,377) (26,276)Progress payments applied, principally related tolong-term contracts (11,119) (12,031)
Inventories, net $146,297 $115,979
The net inventory balance at December 31, 2005 included $5.0 millionrelated to the Corporation’s 2005 acquisition.

50 CURTISS-WRIGHT AND SUBSIDIARIES
5. Property, Plant, and EquipmentThe composition of property, plant, and equipment is as follows:
(In thousands) December 31, 2005 2004
Land $ 16,825 $ 12,563Buildings and improvements 111,409 101,476Machinery, equipment, and other 362,018 340,363
Property, plant, and equipment, at cost 490,252 454,402Less: Accumulated depreciation (215,431) (189,159)
Property, plant, and equipment, net $ 274,821 $ 265,243
Depreciation expense for the years ended December 31, 2005, 2004,and 2003 was $36.0 million, $32.4 million, and $27.7 million, respec-tively. The net property, plant, and equipment balance at December31, 2005 included $11.6 million related to the Corporation’s 2005acquisition.
6. GoodwillGoodwill consists primarily of the excess purchase price of acquisitions over the fair value of the net assets acquired.
The changes in the carrying amount of goodwill for 2005 and 2004 are as follows:
Flow Motion Metal(In thousands) Control Control Treatment Consolidated
December 31, 2003 $ 93,418 $110,850 $15,790 $220,058Goodwill from 2004 acquisitions 17,070 109,207 5,411 131,688Change in estimate to fair value of net assets acquired in prior years (2,260) 34 (871) (3,097)Additional consideration of prior years’ acquisitions 5,777 4,024 20 9,821Foreign currency translation adjustment 1,197 4,464 182 5,843
December 31, 2004 $115,202 $228,579 $20,532 $364,313
Goodwill from 2005 acquisitions — 27,034 — 27,034Change in estimate to fair value of net assets acquired in prior years 1,070 (536) — 534Additional consideration of prior years’ acquisitions 1,241 629 60 1,930Foreign currency translation adjustment (344) (4,810) (499) (5,653)
December 31, 2005 $117,169 $250,896 $20,093 $388,158
Additional consideration of prior years’ acquisitions includes accrualsof $0.4 million and $8.5 million for the years ended December 31, 2005and 2004, respectively, related to earn out and other required contrac-tual payments. These amounts are classified in other current liabili-ties as additional amounts due to sellers.
During 2005, the Corporation finalized the allocation of the purchaseprice for all businesses acquired prior to 2005. None of the goodwill onthe 2005 acquisition is deductible for tax purposes, while approxi-mately $29 million of the goodwill on acquisitions made during 2004 isdeductible for tax purposes.
In accordance with SFAS No. 142, the Corporation completed its annualimpairment test of goodwill in 2005 and concluded there was noimpairment of goodwill.
7. Other Intangible Assets, NetIntangible assets are generally the result of acquisitions and consistprimarilyof purchased technology, customer related intangibles, trade-
marks and service marks, and technology licenses. Intangible assetsare amortized over useful lives that range between 1 and 20 years.
The following table summarizes the intangible assets acquired(including their weighted-average useful lives) by the Corporation dur-ing 2005 and 2004. Indefinite lived intangible assets of $8.0 million areexcluded from the data in the 2004 table. No indefinite lived intangibleassets were purchased in 2005.
(In thousands, except years data) 2005 2004
Amount Years Amount Years
Developed technology $17,892 20.0 $46,858 17.6Customer related
intangibles 11,107 17.7 39,961 18.7Other intangible assets 818 13.9 1,391 8.2
Total $29,817 19.0 $88,210 17.9

CURTISS-WRIGHT AND SUBSIDIARIES 51
The following tables present the cumulative composition of the Corpo-ration’s acquired intangible assets as of December 31:
(In thousands) Accumulated2005 Gross Amortization Net
Developed technology $ 92,580 $(13,510) $ 79,070Customer related
intangibles 74,063 (8,960) 65,103Other intangible assets 16,697 (2,603) 14,094
Total $183,340 $(25,073) $158,267
(In thousands) Accumulated2004 Gross Amortization Net
Developed technology $ 75,970 $ (7,436) $ 68,534Customer related
intangibles 62,049 (4,282) 57,767Other intangible assets 15,952 (1,884) 14,068
Total $153,971 $(13,602) $140,369
The following table presents the changes in the net balance of otherintangibles assets during 2005:
Customer Other Developed Related Intangible
(In thousands) Technology Intangibles Assets Total
December 31, 2004 $68,534 $57,767 $14,068 $140,369Acquired during 2005 17,892 11,107 818 29,817Amortization expense (6,475) (4,682) (726) (11,883)Net foreign currency
translation adjustment (881) 911 (66) (36)
Total $79,070 $65,103 $14,094 $158,267
Included in other intangible assets at December 31, 2005 and 2004 are$9.9 million of intangible assets not subject to amortization. In accor-dance with SFAS No. 142, the Corporation completed its annual test ofimpairment of indefinite lived intangible assets, and concluded therewas no impairment of value.
Amortization expense for the years ended December 31, 2004 and 2003was $8.3 million and $3.6 million, respectively. The estimated futureamortization expense of purchased intangible assets is as follows:
(In thousands)
2006 $10,9882007 10,9882008 10,9352009 9,8462010 9,342
8. Accrued Expenses and Other Current LiabilitiesAccrued expenses consist of the following:
(In thousands) December 31, 2005 2004
Accrued compensation $45,270 $36,520Accrued commissions 5,819 3,857Accrued taxes other than income taxes 4,048 3,642Accrued insurance 4,053 3,179Accrued interest 3,842 3,170Other 11,220 13,045
Total accrued expenses $74,252 $63,413
Other current liabilities consist of the following:
(In thousands) December 31, 2005 2004
Deferred revenue $21,634 $26,575Warranty reserves 9,850 9,667Additional amounts due to sellers
on acquisitions 3,274 10,899Current portion of environmental reserves 2,677 1,843Other 5,616 3,809
Total other current liabilities $43,051 $52,793
The accrued expenses and other current liabilities at December 31,2005 included $2.1 million and $5.3 million, respectively, related to theCorporation’s 2005 acquisition.
The Corporation provides its customers with warranties on certaincommercial and governmental products. Estimated warranty costsare charged to expense in the period the related revenue is recognizedbased on the terms of the product warranty, the related estimatedcosts, and quantitative historical claims experience. These estimatesare adjusted in the period in which actual results are finalized or addi-tional information is obtained. The following table presents thechanges in the Corporation’s warranty reserves:
(In thousands) 2005 2004
Warranty reserves at January 1, $ 9,667 $10,011Provision for current year sales 3,188 3,275Current year claims (2,534) (2,334)Change in estimates to
pre-existing warranties (1,700) (2,856)Increase due to acquisitions 1,618 1,135Foreign currency translation adjustment (389) 436
Warranty reserves at December 31, $ 9,850 $ 9,667

52 CURTISS-WRIGHT AND SUBSIDIARIES
9. Income TaxesEarnings before income taxes for the years ended December 31 con-sist of:
(In thousands) 2005 2004 2003
Domestic $ 77,440 $65,963 $67,429Foreign 40,858 32,790 16,627
Total $118,298 $98,753 $84,056
The provision for income taxes for the years ended December 31consist of:
(In thousands) 2005 2004 2003
Current:Federal $25,362 $21,158 $17,018State 6,028 5,481 4,103Foreign 12,791 10,548 5,050
44,181 37,187 26,171
Deferred:Federal (674) (878) 5,032State 472 (1,969) 426Foreign (961) (653) 159
(1,163) (3,500) 5,617
Provision for income taxes $43,018 $33,687 $31,788
The effective tax rate varies from the U.S. federal statutory tax rate forthe years ended December 31, principally as follows:
2005 2004 2003
U.S. Federal statutory tax rate 35.0% 35.0% 35.0%Add (deduct):
State and local taxes, net of federal benefit 3.4 1.6 3.5
All other, net (2.0) (2.5) (0.7)
Effective tax rate 36.4% 34.1% 37.8%
The 2004 effective tax rate included nonrecurring benefits totaling $3.4million, primarily resulting from the change in legal structure of one ofour subsidiaries and a favorable IRS appeals settlement.
The components of the Corporation’s deferred tax assets and liabilitiesat December 31 are as follows:
(In thousands) 2005 2004
Deferred tax assets:Environmental reserves $ 9,946 $ 9,141Inventories 8,353 10,730Postretirement/postemployment
benefits 16,453 16,204Incentive compensation 9,203 7,086Accrued vacation pay 4,570 4,229Warranty reserve 2,363 1,950Other 7,607 5,164
Total deferred tax assets 58,495 54,504
Deferred tax liabilities:Retirement plans 10,376 9,447Depreciation 21,054 17,607Goodwill amortization 19,044 20,974Other intangible amortization 28,332 19,078Other 4,416 1,748
Total deferred tax liabilities 83,222 68,854
Net deferred tax liabilities $(24,727) $(14,350)
Deferred tax assets and liabilities are reflected on the Corporation’sconsolidated balance sheet at December 31 as follows:
(In thousands) 2005 2004
Current deferred tax assets $ 28,843 $ 25,693Noncurrent deferred tax liabilities (53,570) (40,043)
Net deferred tax liabilities $(24,727) $(14,350)
As of December 31, 2005, the Corporation had state and foreign netoperating loss carryforwards of $0.5 million, after tax. The state netoperating loss carryforwards expire through the year 2023. The foreignnet operating loss carryforwards have no expiration date.
Income tax payments of $32.3 million were made in 2005, $28.8 mil-lion in 2004, and $22.8 million in 2003.
No provision has been made for U.S. federal or foreign taxes on thatportion of certain foreign subsidiaries’ undistributed earnings consid-ered to be permanently reinvested, which at December 31, 2005 was$28.0 million. It is not practicable to estimate the amount of tax thatwould be payable if these amounts were repatriated to the U.S.; how-ever, it is expected there would be minimal or no additional tax becauseof the availability of foreign tax credits.

CURTISS-WRIGHT AND SUBSIDIARIES 53
On October 22, 2004 the American Jobs Creation Act of 2004 (the “ACT”)was signed into law. The ACT includes a one time opportunity for adeduction of 85% of certain foreign dividends that are repatriated, asdefined in the ACT. Pursuant to this provision of the ACT, the Corpora-tion has repatriated $9.3 million in the fourth quarter of 2005 with atax cost of $0.3 million. This tax cost was net of foreign tax creditswhich were not previously provided. The Corporation should be con-sidered to have satisfied the Section 8.03 “safe harbor” contained inNotice 2005-10 since 100% of the required investments pursuant to theSection 965 dividend reinvestment plan have been made by the end ofthe 2005 tax year.
10. DebtDebt consists of the following:
(In thousands) December 31, 2005 2004
Industrial Revenue Bonds, due from 2007 through 2028 $ 14,239 $ 14,296
Revolving Credit Agreement, due 2009 — 124,5005.13% Senior Notes due 2010 74,729 75,3295.74% Senior Notes due 2013 125,108 126,7935.51% Senior Notes due 2017 150,000 —Other debt 826 1,572
Total debt 394,902 342,490Less: Short-term debt 885 1,630
Total Long-term debt $364,017 $340,860
The weighted-average interest rate of the Corporation’s IndustrialRevenue Bonds was 2.54% and 1.39% in 2005 and 2004, respectively.The weighted-average interest rate of the Corporation’s RevolvingCredit Agreement was 3.97% and 2.56% in 2005 and 2004, respectively.
The carrying amount of the Industrial Revenue Bonds approximatesfair value as the interest rates on variable debt are reset periodically toreflect market conditions and rates. Fair values for the Corporation’sfixed rate debt totaled $357.9 million and $205.3 million at December31, 2005 and 2004, respectively. These fair values were estimated bymanagement. The fair values described above may not be indicative ofnet realizable value or reflective of future fair values. Furthermore, theuse of different methodologies to determine the fair value of certainfinancial instruments could result in a different estimate of fair valueat the reporting date.
Aggregate maturities of debt are as follows(1):
(In thousands)
2006 $ 8852007 5,0602008 622009 642010 125,066Thereafter 233,928
Total $365,065
(1) Amounts exclude a $0.2 million adjustment to the fair value of long-term debtrelating to the Corporation’s interest rate swap agreements that were settled incash during 2005.
Interest payments of $18.3 million, $12.1 million, and $2.6 millionwere made in 2005, 2004, and 2003, respectively.
On December 1, 2005, the Corporation issued $150.0 million of 5.51%Senior Notes (the “2005 Notes”). The 2005 Notes mature on December1, 2017. The Notes are senior unsecured obligations and are equal inright of payment to the Corporation’s existing senior indebtedness. TheCorporation, at its option, can prepay at any time all or any part of the2005 Notes, subject to a make-whole amount in accordance with theterms of the Note Purchase Agreement. In connection with the 2005Notes, the Corporation paid customary fees that have been deferredand will be amortized over the terms of the Notes. The Corporation isrequired under the Note Purchase Agreement to maintain certainfinancial ratios, the most restrictive of which is a debt to capitalizationlimit of 60% and a cross default provision with the Corporation’s othersenior indebtedness. As of December 31, 2005, the Corporation was incompliance with all covenants.
In November 2005, the Corporation unwound its interest rate swapagreements with notional amounts of $20 million and $60 millionwhich were originally put in place to convert a portion of the fixed inter-est on the $75 million 5.13% Senior Notes and $125 million 5.74%Senior Notes, respectively, to variable rates based on specifiedspreads over six-month LIBOR. The unwind of these swap agreementsresulted in a net loss of $0.2 million, which has been deferred and isbeing amortized over the remaining term of the underlying debt.
On July 23, 2004, the Corporation amended its existing credit facility,increasing the available line of credit from $225 million to $400 millionwith a group of ten banks. The Corporation plans to use the credit linefor working capital purposes, internal growth initiatives, funding offuture acquisitions, and other general corporate purposes. The creditagreement expires in 2009. Borrowings under the agreement bearinterest at a floating rate based on market conditions. In addition, theCorporation’s interest rate and level of facility fees depend on main-taining certain financial ratios defined in the agreement. The Corpora-tion is subject to annual facility fees on the commitments under theRevolving Credit Agreement. In connection with the Revolving CreditAgreement, the Corporation paid customary transaction fees that havebeen deferred and are being amortized over the term of the agree-ment. The Corporation is required under the agreement to maintaincertain financial ratios and meet certain financial tests as detailed inthe agreement, of which the Corporation is in compliance at Decem-ber 31, 2005. The unused credit available under the Revolving CreditAgreement at December 31, 2005 and 2004 was $367.9 million and$256.7 million, respectively.
On September 25, 2003, the Corporation issued $200.0 million ofSenior Notes (the “2003 Notes”). The 2003 Notes consist of $75.0 mil-lion of 5.13% Senior Notes that mature on September 25, 2010 and$125.0 million of 5.74% Senior Notes that mature on September 25,2013. The 2003 Notes are senior unsecured obligations and are equalin right of payment to the Corporation’s existing senior indebtedness.The Corporation, at its option, can prepay at any time all or any part ofthe 2003 Notes, subject to a make-whole amount in accordance withthe Note Purchase Agreement. The Corporation paid customary feesthat have been deferred and will be amortized over the terms of the2003 Notes. The Corporation is required under the Note PurchaseAgreement to maintain certain financial ratios, the most restrictive ofwhich is a debt to capitalization limit of 60% and a cross default provi-

54 CURTISS-WRIGHT AND SUBSIDIARIES
sion with the Corporation’s other senior indebtedness. As of Decem-ber 31, 2005, the Corporation was in compliance with all covenants.
At December 31, 2005, substantially all of the industrial revenue bondissues are collateralized by real estate, machinery, and equipment.Certain of these issues are supported by letters of credit, which total$13.7 million. The Corporation had various other letters of credit total-ing $18.6 million. Substantially all letters of credit are included underthe Revolving Credit Agreement.
11. Earnings Per ShareThe Corporation is required to report both basic earnings per share(“EPS”), based on the weighted-average number of Common andClass B common shares outstanding, and diluted earnings per share,based on the basic EPS adjusted for all potentially dilutive sharesissuable. Share and per share amounts presented below have beenadjusted on a pro forma basis for the December 17, 2003 stock split.See Note 1-O for further information regarding the stock split.
The Corporation had no antidilutive options outstanding at December31, 2005 or December 31, 2004. At December 31, 2003, the Corporationhad stock options outstanding of 148,052 shares that were not includedin the computation of diluted EPS, because to do so would have beenantidilutive. Earnings per share calculations for the years endedDecember 31, 2005, 2004, and 2003 are as follows:
Weighted-Average
(In thousands, except Net Shares Earningsper share data) Income Outstanding Per Share
2005:Basic earnings per share $75,280 21,635 $3.48Effect of dilutive securities:
Stock options 250Deferred stock
compensation 29
Diluted earnings per share $75,280 21,914 $3.44
2004:Basic earnings per share $65,066 21,196 $3.07Effect of dilutive securities:
Stock options 324Deferred stock
compensation 27
Diluted earnings per share $65,066 21,547 $3.02
2003:Basic earnings per share $52,268 20,640 $2.53Effect of dilutive securities:
Stock options 222Deferred stock
compensation 25
Diluted earnings per share $52,268 20,887 $2.50
12. Stock Compensation Plans2005 Long-Term Incentive Plan: Under the 2005 LTI Plan approved bystockholders in 2005 and effective as of May 19, 2005, an aggregatetotal of 2,500,000 shares of Common stock were reserved for issuance.The Common stock to be used to satisfy employee option exerciseswill be from the Corporation’s treasury stock. The Corporation doesnot expect to repurchase any shares in 2006 to replenish treasurystock for issuances made to satisfy stock option exercises. No morethan 200,000 shares of Common stock or 100,000 shares of restrictedstock may be awarded in any year to any one participant in the 2005LTI Plan. Awards under the 2005 LTI Plan currently consist of threecomponents—performance units (cash), non-qualified stock options,and contingent restricted stock.
Under the 2005 LTI Plan, the Corporation awarded performance unitsof 8.0 million in 2005 to certain key employees. The performance unitsare denominated in dollars and are contingent upon the satisfaction ofperformance objectives keyed to achieving profitable growth over aperiod of three fiscal years commencing with the fiscal year followingsuch awards. The anticipated cost of such awards is expensed over thethree-year performance period, which for the 2005 awards will beginin 2006. The actual cost of the performance units may vary from thetotal value of the awards depending upon the degree to which the keyperformance objectives are met.
Under the 2005 LTI Plan, the Corporation has granted non-qualifiedstock options in 2005 to key employees. Grants under the 2005 LTI Planwere made in the fourth quarter. Stock options granted under the 2005LTI Plan expire ten years after the date of the grant and are generallyexercisable as follows: up to one-third of the grant after one year, up totwo-thirds of the grant after two years, and in full three years from thedate of grant.
Under the 2005 LTI Plan, the Corporation has granted 54,336 contin-gent restricted stock units in 2005 to certain of the Corporation’s offi-cers. The contingent restricted stock granted under this LTI Plan aredenominated in shares based on the fair market value of the Corpora-tion’s stock on the day of the grant, and are contingent upon the satis-faction of performance objectives keyed to achieving profitable growthover a period of three fiscal years commencing with the fiscal year fol-lowing such award. The anticipated cost of such award is expensedover the three-year performance period. The actual cost of the contin-gent restricted stock may vary from the total value of the awardsdepending upon the degree to which the key performance objectivesare met.
The remaining allowable shares for issuance under the 2005 LTI Planas of December 31, 2005 is 2,257,582.

CURTISS-WRIGHT AND SUBSIDIARIES 55
1995 Long-Term Incentive Plan: Under the 1995 LTI Plan approved bystockholders in 1995 and as amended in 2002 and 2003, an aggregatetotal of 3,000,000 shares of Common stock were reserved for issuance.The Common stock used to satisfy employee option exercises will befrom the Corporation’s treasury stock. The Corporation does notexpect to repurchase any shares in 2006 to replenish treasury stock forissuances made to satisfy stock option exercise. No more than 50,000shares of Common stock may be awarded in any year to any one par-ticipant in the 1995 LTI Plan. Awards under the 1995 LTI Plan consistedof three components—performance units (cash), non-qualified stockoptions, and non-employee director grants.
Under the 1995 LTI Plan, the Corporation awarded performance unitsof 6.3 million in 2004 and 4.8 million in 2003 to certain key employees.The performance units are denominated in dollars and are contingentupon the satisfaction of performance objectives keyed to achievingprofitable growth over a period of three fiscal years commencing withthe fiscal year following such awards. The anticipated cost of suchawards is expensed over the three-year performance period, whichamounted to $5.3 million, $4.3 million, and $3.3 million in 2005, 2004,and 2003, respectively. The actual cost of the performance units mayvary from the total value of the awards depending upon the degree towhich the key performance objectives are met.
Under the 1995 LTI Plan, the Corporation granted non-qualified stockoptions in 2004 and 2003 to key employees. Grants under the 1995 LTIPlan were made in the fourth quarter of both years. Stock optionsgranted under the 1995 LTI Plan expire ten years after the date of thegrant and are generally exercisable as follows: up to one-third of thegrant after one year, up to two-thirds of the grant after two years, andin full three years from the date of grant.
In May 2003, the Corporation’s Board of Directors and stockholdersapproved an amendment to the 1995 LTI Plan to authorize non-employee directors to participate under the plan. The amendment pro-vided that each non-employee director could receive the equivalent of$15,000 of the Corporation’s Common stock per year. The Board ofDirectors approved and issued stock grants of 277 shares, 268 shares,and 480 shares in 2005, 2004, and 2003, respectively, of the Corpora-tion’s Common stock to each of the eight non-employee directors. Thestock grants were valued at $15,000 based on the market price of theCorporation’s Common stock on the grant date and were expensed atthe time of issuance.
1995 LTI Plan was superseded by the 2005 LTI Plan so there are noremaining allowable shares for future awards under the 1995 LTI Plan.As of December 31, 2005 there were options representing a total of769,936 shares outstanding under the 1995 plan.
Employee Stock Purchase Plan: In May 2003, the Corporation’s Board ofDirectors and stockholders approved the 2003 Employee Stock Pur-chase Plan (the “ESPP”) under which eligible employees may pur-chase the Corporation’s Common stock at a price per share equal to85% of the lower of the fair market value of the Common stock at thebeginning or end of each offering period. Each offering period of theESPP lasts six months, with the first offering period commencing onJanuary 1, 2004. Participation in the offering is limited to 10% of anemployee’s base salary (not to exceed amounts allowed under Section423 of the Internal Revenue Code), may be terminated at any time bythe employee, and automatically ends on termination of employmentwith the Corporation. A total of 1,000,000 shares of Common stock havebeen reserved for issuance under the ESPP. The Common stock to sat-isfy the stock purchases under the ESPP will be newly issued sharesof Common stock. During 2005, 82,283 shares were purchased underthe ESPP. As of December 31, 2005, there were 882,822 shares avail-able for future offerings, and the corporation has withheld $2.2 millionfrom employees, the equivalent of 48,605 shares.
Stock option activity during the periods for both plans is indicatedas follows:
Weighted- Weighted-Average AverageExercise Options Exercise
Shares Price Exercisable Price
Outstanding at January 1, 2003 1,340,304 $21.16 837,024 $18.48Granted 148,052 38.16Exercised (233,708) 16.57Forfeited (16,926) 24.39
Outstanding atDecember 31, 2003 1,237,722 24.01 855,676 20.83Granted 126,336 55.91Exercised (315,517) 19.37Forfeited (50,385) 25.68
Outstanding atDecember 31, 2004 998,156 29.43 729,690 23.51Granted 189,278 55.84Exercised (219,696) 21.11Forfeited (9,720) 42.82
Outstanding atDecember 31, 2005 958,018 $36.42 641,549 $28.08

56 CURTISS-WRIGHT AND SUBSIDIARIES
The following table summarizes information about stock options outstanding at December 31, 2005:
Options Outstanding Options Exercisable
Weighted-Average Weighted-AverageRemaining Weighted- Remaining Weighted-
Contractual Average Contractual AverageRange of Exercise Prices Shares Life in Years Exercise Price Shares Life in Years Exercise Price
Less than $20.00 100,862 3.2 $18.73 100,862 3.2 $18.73$20.00 – $29.99 291,993 5.5 22.59 291,993 5.5 22.59$30.00 – $40.00 253,282 7.4 35.45 207,667 7.3 34.86Greater than $40.00 311,881 9.5 55.87 41,027 8.9 55.91
958,018 7.1 $36.42 641,549 5.9 $28.08
2005 Stock Plan for Non-Employee Directors: The Stock Plan for Non-Employee Directors (“2005 Stock Plan”), approved by the stockholdersin 2005 authorized the grant of stock awards and, at the option of thenon-employee directors, the deferred payment of regular stipulatedcompensation and meeting fees in equivalent shares. Pursuant to theterms of the 2005 Stock Plan, the Corporation’s non-employee direc-tors each receive annual restricted stock awards valued at $50,000,which are subject to a three year restriction period commencing on thedate of the grant. These restricted stock awards are subject to forfei-ture if the non-employee director resigns or retires by reason of his orher decision not to stand for re-election prior to the lapsing of allrestrictions, unless the restrictions are otherwise removed by theCommittee on Directors and Governance. The cost of the restrictedstock awards will be amortized over the three year restriction periodfrom the date of grant. Newly elected non-employee directors receivea one-time restricted stock award valued at $25,000. The total numberof shares of Common stock available for grant under the 2005 StockPlan may not exceed 50,000 shares. During 2005, no grants ofrestricted stock were awarded under the 2005 Stock Plan.
1996 Stock Plan for Non-Employee Directors: The Stock Plan for Non-Employee Directors (“1996 Stock Plan”), approved by the stockholdersin 1996, authorized the grant of restricted stock awards and, at theoption of the non-employee directors, the deferred payment of regularstipulated compensation and meeting fees in equivalent shares. Pur-suant to the terms of the 1996 Stock Plan, non-employee directorsreceived an initial restricted stock grant of 3,612 shares in 1996, whichbecame unrestricted in 2001. Additionally, on the fifth anniversary ofthe initial grant, those non-employee directors who remained a non-employee director, received an additional restricted stock grant equalto the product of increasing $13,300 at an annual rate of 2.96%, com-pounded monthly from the effective date of the 1996 Stock Plan. In2001, the amount per director was calculated to be $15,419, repre-senting a total additional grant of 1,555 restricted shares. The cost ofthe restricted stock awards is being amortized over the five-yearrestriction period from the date of grant. Prior to the effective date ofthe 2005 Stock Plan, newly elected non-employee directors receivedsimilar compensation under the terms of the 1996 Stock Plan upontheir election to the Board.
Pursuant to election by non-employee directors to receive shares inlieu of payment for earned and deferred compensation under the 1996Stock Plan, the Corporation had provided for an aggregate additional29,027 shares, at an average price of $32.76 as of December 31, 2005.
During 2005, the Corporation issued 2,802 shares in deferred com-pensation pursuant to such elections.
13. Environmental CostsThe Corporation has continued the operation of the ground water andsoil remediation activities at the Wood-Ridge, New Jersey site through2005. The cost of constructing and operating this site was provided forin 1990 when the Corporation established a reserve to remediate theproperty. Costs for operating and maintaining this site totaled $0.8 mil-lion in 2005, $1.5 million in 2004, and $0.6 million in 2003, all of whichhave been charged against the previously established reserve. TheCorporation increased the remediation reserve by $0.2 million and$0.3 million in 2005 and 2004, respectively, based upon revised oper-ating projections. The reserve balance as of December 31, 2005 was$6.5 million. Even though this property was sold in December 2001, theCorporation retained the responsibility for this remediation in accor-dance with the sale agreement.
The Corporation has been named as a potentially responsible party(“PRP”), as have many other corporations and municipalities, in anumber of environmental clean-up sites. The Corporation continues tomake progress in resolving these claims through settlement discus-sions and payments from established reserves. Significant sitesremaining open at the end of the year are: Caldwell Trucking landfillsuperfund site, Fairfield, New Jersey; Sharkey landfill superfund site,Parsippany, New Jersey; Amenia landfill site, Amenia, New York; andChemsol, Inc. superfund site, Piscataway, New Jersey. The Corpora-tion believes that the outcome for any of these remaining sites will nothave a materially adverse effect on the Corporation’s results of opera-tions or financial condition.
In the first quarter of 2005, the Corporation sold its Fairfield, New Jer-sey property, which was formerly an operating facility for the Corpora-tion’s Motion Control segment. Under the sale agreement, theCorporation has retained the responsibility to continue the ongoingenvironmental remediation on the property. At the date of the sale,remediation costs associated with the Fairfield site were anticipated tobe incurred over three to five years with an estimated cost of $1.5 mil-lion. As of December 31, 2005, $0.4 million of costs have been incurred.
In the fourth quarter of 2004, the Corporation increased the remedia-tion reserve related to the Caldwell Trucking landfill superfund site by$4.4 million. The increase related to the estimated groundwater reme-diation for this site, which could span over 30 years. Through 2005, themajority of the costs for this site have been for the soil remediation.

CURTISS-WRIGHT AND SUBSIDIARIES 57
In 2003, the Corporation responded to a U.S.E.P.A. Request For Infor-mation concerning the Lower Passaic River site. The Corporation sub-sequently joined a cooperating parties group to share costs relating tothe site and in 2004 signed an agreement with the other group mem-bers providing for an EPA study of the site. As of December 31, 2005,the Corporation estimates the costs associated with this study will nothave a materially adverse effect on the Corporation’s results of opera-tion or financial condition.
In October 2002 the Corporation acquired the Electro-Mechanical Divi-sion (“EMD”) facility from Westinghouse Government Services LLC(“Seller”). Included in the purchase was the assumption of severalNuclear Regulatory Commission (“NRC”) licenses, necessary for thecontinued operation of the business. In connection with these licenses,the NRC required financial assurance from the Corporation (in theform of a parent company guarantee) representing estimated environ-mental decommissioning and remediation costs associated with thecommercial operations covered by the licenses. In addition, the Cor-poration has assumed obligations for additional environmental reme-diation costs. Remediation and investigation of the EMD facility areongoing. As of December 31, 2005, the balance in this reserve is $11.8million. The Corporation obtained partial environmental insurancecoverage specifically for the EMD facility. The policy provides coveragefor losses due to on or off-site pollution conditions, which are pre-existing and unknown.
The Corporation’s aggregate environmental obligation at December31, 2005 was $25.3 million compared to $25.2 million at December 31,2004. Approximately 80% of the Corporation’s environmental reservesas of December 31, 2005 represent the current value of anticipatedremediation costs and are not discounted primarily due to the uncer-tainty of timing of expenditures. The remaining environmentalreserves are discounted using a rate of 4% to reflect the time value ofmoney since the amount and timing of cash payments for the liabilityare reliably determinable. All environmental reserves exclude anypotential recovery from insurance carriers or third-party legal actions.As of December 31, 2005, the undiscounted cash flows associated withthe discounted reserves were $9.3 million and are anticipated to bepaid over the next 30 years.
14. Pension and Other Postretirement Benefit PlansThe Corporation maintains six separate and distinct domestic pensionand other postretirement benefit plans, as described in further detailbelow. Prior to the acquisition of EMD in October 2002, the Corporationmaintained a qualified pension plan, a non-qualified pension plan, anda postretirement health benefits plan (the “Curtiss-Wright Plans”). Asa result of the acquisition, the Corporation obtained three unfundedpension and postretirement benefit plans (the “EMD Plans”), similar innature to those listed above. The unfunded status of the acquired EMDPlans was recorded as a liability at the date of acquisition. During 2003,the funds associated with the qualified pension plans of both the Cur-tiss-Wright Plans and EMD Plans were placed under a master trustfund, from which the Corporation directs the investment strategy forboth plans.
The Curtiss-Wright PlansThe Corporation maintains a non-contributory defined benefit pensionplan covering substantially all employees other than those employeescovered by the EMD Pension Plan described below. The Curtiss-WrightRetirement Plan (the “CW Pension Plan”) formula for non-unionemployees is based on years of credited service and the five highestconsecutive years’ compensation during the last ten years of serviceand a “cash balance” benefit. Union employees who have negotiated abenefit under the CW Pension Plan are entitled to a benefit based onyears of service multiplied by a monthly pension rate. Employeesbecome participants under the CW Pension Plan after one year of ser-vice and are vested after five years of service. At December 31, 2005and December 31, 2004, the Corporation had prepaid pension costs of$76.0 million and $77.8 million, respectively, under the CW PensionPlan. Due to the funded status, the Corporation does not expect to con-tribute funds to the CW Pension Plan in 2006.
The Corporation also maintains a non-qualified restoration plan (the“CW Restoration Plan”) covering those employees whose compensa-tion or benefits exceed the IRS limitation for pension benefits. Benefitsunder the CW Restoration Plan are not funded, and, as such, the Cor-poration had an accrued pension liability of $0.7 million at December31, 2005 and 2004. The Corporation’s contributions to the CW Restora-tion Plan are not expected to be material in 2006.
The Corporation provides postretirement health benefits to certainemployees (the “CW Retirement Plan”). In 2002, the Corporationrestructured the postretirement medical benefits for certain activeemployees, effectively freezing the plan. The obligation associated withthese active employees was transferred to the CW Pension Plan. Theplan continues to be maintained for retired employees. As of Decem-ber 31, 2005 and 2004, the Corporation had an accrued postretirementbenefit liability of $1.0 million and $1.2 million, respectively, as bene-fits under the plan are not funded. The Corporation’s contributions tothe CW Retirement Plan are not expected to be material in 2006.

58 CURTISS-WRIGHT AND SUBSIDIARIES
The Curtiss-Wright Plans
Pension Benefits Postretirement Benefits
(In thousands) 2005 2004 2005 2004
CHANGE IN BENEFIT OBLIGATION:Benefit obligation at beginning of year $124,784 $126,523 $ 580 $ 628Service cost 10,315 9,838 — —Interest cost 8,097 7,540 35 29Plan participants’ contributions — — 8 —Amendments 273 303 — —Actuarial loss (gain) 7,181 (5,575) 217 19Benefits paid (13,152) (13,845) (112) (96)
Benefit obligation at end of year 137,498 124,784 728 580
CHANGE IN PLAN ASSETS:Fair value of plan assets at beginning of year 211,593 199,013 — —Actual return on plan assets 30,527 25,832 — —Employer contribution 127 593 104 96Plan participants’ contribution — — 8 —Benefits paid (13,152) (13,845) (112) (96)
Fair value of plan assets at end of year 229,095 211,593 — —
Funded status 91,597 86,809 (728) (580)Unrecognized net actuarial gain (18,031) (11,238) (315) (570)Unrecognized transition obligation (3) (7) — —Unrecognized prior service costs 1,705 1,554 — —
Prepaid (accrued) benefit costs $ 75,268 $ 77,118 $(1,043) $(1,150)
ACCUMULATED BENEFIT OBLIGATION $120,888 $110,112 N/A N/A
WEIGHTED-AVERAGE ASSUMPTIONS IN DETERMINATION OF BENEFIT OBLIGATION:Discount rate 5.75% 6.00% 5.50% 5.00%Rate of compensation increase 3.50% 3.50% — —Health care cost trends:
Rate assumed for subsequent year — — 13.00% 10.50%Ultimate rate reached in 2011 and 2010, respectively — — 5.50% 5.50%
Measurement date September 30 September 30 October 31 October 31
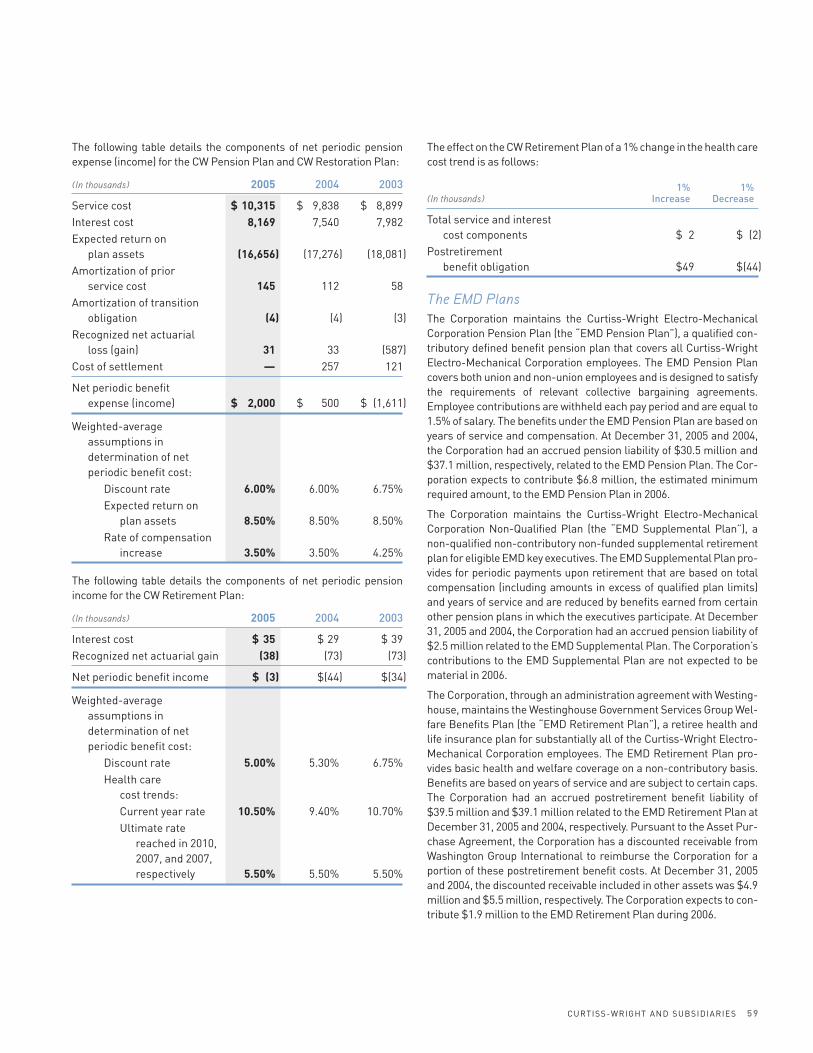
CURTISS-WRIGHT AND SUBSIDIARIES 59
The following table details the components of net periodic pensionexpense (income) for the CW Pension Plan and CW Restoration Plan:
(In thousands) 2005 2004 2003
Service cost $ 10,315 $ 9,838 $ 8,899Interest cost 8,169 7,540 7,982Expected return on
plan assets (16,656) (17,276) (18,081)Amortization of prior
service cost 145 112 58Amortization of transition
obligation (4) (4) (3)Recognized net actuarial
loss (gain) 31 33 (587)Cost of settlement — 257 121
Net periodic benefit expense (income) $ 2,000 $ 500 $ (1,611)
Weighted-average assumptions in determination of net periodic benefit cost:
Discount rate 6.00% 6.00% 6.75%Expected return on
plan assets 8.50% 8.50% 8.50%Rate of compensation
increase 3.50% 3.50% 4.25%
The following table details the components of net periodic pensionincome for the CW Retirement Plan:
(In thousands) 2005 2004 2003
Interest cost $ 35 $ 29 $ 39Recognized net actuarial gain (38) (73) (73)
Net periodic benefit income $ (3) $(44) $(34)
Weighted-average assumptions in determination of net periodic benefit cost:
Discount rate 5.00% 5.30% 6.75%Health care
cost trends:Current year rate 10.50% 9.40% 10.70%Ultimate rate
reached in 2010,2007, and 2007, respectively 5.50% 5.50% 5.50%
The effect on the CW Retirement Plan of a 1% change in the health carecost trend is as follows:
1% 1%(In thousands) Increase Decrease
Total service and interest cost components $ 2 $ (2)
Postretirement benefit obligation $49 $(44)
The EMD PlansThe Corporation maintains the Curtiss-Wright Electro-MechanicalCorporation Pension Plan (the “EMD Pension Plan”), a qualified con-tributory defined benefit pension plan that covers all Curtiss-WrightElectro-Mechanical Corporation employees. The EMD Pension Plancovers both union and non-union employees and is designed to satisfythe requirements of relevant collective bargaining agreements.Employee contributions are withheld each pay period and are equal to1.5% of salary. The benefits under the EMD Pension Plan are based onyears of service and compensation. At December 31, 2005 and 2004,the Corporation had an accrued pension liability of $30.5 million and$37.1 million, respectively, related to the EMD Pension Plan. The Cor-poration expects to contribute $6.8 million, the estimated minimumrequired amount, to the EMD Pension Plan in 2006.
The Corporation maintains the Curtiss-Wright Electro-MechanicalCorporation Non-Qualified Plan (the “EMD Supplemental Plan”), anon-qualified non-contributory non-funded supplemental retirementplan for eligible EMD key executives. The EMD Supplemental Plan pro-vides for periodic payments upon retirement that are based on totalcompensation (including amounts in excess of qualified plan limits)and years of service and are reduced by benefits earned from certainother pension plans in which the executives participate. At December31, 2005 and 2004, the Corporation had an accrued pension liability of$2.5 million related to the EMD Supplemental Plan. The Corporation’scontributions to the EMD Supplemental Plan are not expected to bematerial in 2006.
The Corporation, through an administration agreement with Westing-house, maintains the Westinghouse Government Services Group Wel-fare Benefits Plan (the “EMD Retirement Plan”), a retiree health andlife insurance plan for substantially all of the Curtiss-Wright Electro-Mechanical Corporation employees. The EMD Retirement Plan pro-vides basic health and welfare coverage on a non-contributory basis.Benefits are based on years of service and are subject to certain caps.The Corporation had an accrued postretirement benefit liability of$39.5 million and $39.1 million related to the EMD Retirement Plan atDecember 31, 2005 and 2004, respectively. Pursuant to the Asset Pur-chase Agreement, the Corporation has a discounted receivable fromWashington Group International to reimburse the Corporation for aportion of these postretirement benefit costs. At December 31, 2005and 2004, the discounted receivable included in other assets was $4.9million and $5.5 million, respectively. The Corporation expects to con-tribute $1.9 million to the EMD Retirement Plan during 2006.

60 CURTISS-WRIGHT AND SUBSIDIARIES
The EMD Plans
Pension Benefits Postretirement Benefits
(In thousands) 2005 2004 2005 2004
CHANGE IN BENEFIT OBLIGATION:Benefit obligation at beginning of year $137,623 $128,287 $ 37,740 $ 41,106Service cost 3,899 3,249 570 789Interest cost 8,364 8,080 1,781 2,366Plan participants’ contributions 774 804 181 —Amendments 70 — — —Actuarial loss (gain) 941 3,503 (8,548) (4,918)Benefits paid (6,832) (6,300) (1,772) (1,603)
Benefit obligation at end of year 144,839 137,623 29,952 37,740
CHANGE IN PLAN ASSETS:Fair value of plan assets at beginning of year 88,436 83,737 — —Actual return on plan assets 12,444 10,052 — —Employer contribution 10,822 143 1,591 1,603Plan participants’ contribution 744 804 181 —Benefits paid (6,832) (6,300) (1,772) (1,603)
Fair value of plan assets at end of year 105,644 88,436 — —
Funded status (39,195) (49,187) (29,952) (37,740)Unrecognized net actuarial loss (gain) 6,160 9,700 (9,514) (1,326)Unrecognized prior service costs 64 — — —
Accrued benefit costs $ (32,971) $ (39,487) $(39,466) $(39,066)
ACCUMULATED BENEFIT OBLIGATION $131,505 $124,793 N/A N/A
WEIGHTED-AVERAGE ASSUMPTIONS IN DETERMINATION OF BENEFIT OBLIGATION:Discount rate 5.75% 6.00% 5.75% 6.00%Rate of compensation increase 3.50% 3.50% — —Health care cost trends:
Rate assumed for subsequent year — Pre-65 — — 9.50% 10.50%Rate assumed for subsequent year — Post-65 — — 13.00% 13.00%Ultimate rate reached in 2010 — Pre-65 — — 5.50% 5.50%Ultimate rate reached in 2011 and 2010,
respectively — Post-65 — — 5.50% 5.50%Measurement date September 30 September 30 October 31 October 31

CURTISS-WRIGHT AND SUBSIDIARIES 61
The following table details the components of net periodic pensionexpense for the EMD Pension Plan and EMD Supplemental Plan:
(In thousands) 2005 2004 2003
Service cost $ 3,899 $3,248 $2,709Interest cost 8,320 8,080 7,854Expected return on plan assets (7,919) (7,613) (7,618)Recognized net actuarial
loss (gain) 7 — (394)
Net periodic benefit expense $ 4,307 $3,715 $2,551
Weighted-average assumptions in determination of net periodic benefit cost:
Discount rate 6.00% 6.25% 7.00%Expected return on
plan assets 8.50% 8.50% 8.50%Rate of compensation
increase 3.50% 3.25% 4.00%
The following table details the components of net periodic pensionexpense for the EMD Retirement Plan:
(In thousands) 2005 2004 2003
Service cost $ 570 $ 789 $ 705Interest cost 1,781 2,366 2,388Recognized net actuarial gain (360) — —
Net periodic benefit expense $1,991 $3,155 $3,093
Weighted-average assumptions in determination of net periodic benefit cost:
Discount rate 6.00% 6.25% 6.75%Health care cost trends:
Current year rate —Pre-65 10.50% 9.70% 11.10%
Current year rate —Post-65 13.00% 15.70% 18.00%
Ultimate rate reached in 2007 — Pre-65 5.50% 5.50% 5.50%
Ultimate rate reached in 2010, 2007, and 2007, respectively—Post-65 5.50% 6.50% 6.50%
The effect on the EMD Retirement Plan of a 1% change in the healthcare cost trend is as follows:
1% 1%(In thousands) Increase Decrease
Total service and interest cost components $ 370 $ (295)
Postretirement benefit obligation $3,421 $(3,613)
The Medicare Prescription Drug, Improvement and Modernization Actof 2003 (the “Act”) was signed into law on December 8, 2003. In accor-dance with FASB Staff Position FAS 106-1, the Corporation made aone-time election to defer recognition of the effects of the law in theaccounting for its plan under FAS 106 and in providing disclosuresrelated to the plan until authoritative guidance on the accounting forthe federal prescription drug subsidy is issued. Final regulationsregarding the implementation of the Act were issued in February 2005.During the fourth quarter of 2005, the Corporation decided to apply forthe Medicare Part D subsidy under this Act. An attestation of actuarialequivalence was submitted on October 31, 2005 with the understand-ing that in 2006, the prescription drug plan would be enriched to adesign that is actuarially equivalent. The effect of the anticipated sub-sidy is a $2.7 million reduction in the balance of the Accumulated Pen-sion Benefit Obligation disclosed as of December 31, 2005. Thereduction is treated as an actuarial gain in accordance with FSP FAS106-2 and is included in the gain in the reconciliation above.

62 CURTISS-WRIGHT AND SUBSIDIARIES
The following benefit payments, which reflect expected future service, as appropriate, are expected to be paid from the plans:
CW CW EMD EMD EMDPension Retirement Pension Retirement Subsidy
(In thousands) Plans Plan Plans Plan Receipts Total
2006 $10,480 $ 96 $ 8,586 $ 2,023 $ (83) $ 21,1022007 10,110 88 8,902 2,050 (94) 21,0562008 10,277 82 9,279 2,077 (104) 21,6112009 10,541 75 9,622 2,002 (115) 22,1252010 13,356 66 9,989 2,077 (125) 25,3632011 – 2015 55,329 262 55,789 10,513 (744) 121,149
Pension Plan AssetsThe Corporation maintains the funds of the CW Pension Plan and theEMD Pension Plan under one master trust. The Corporation’s Retire-ment Plans are diversified across investment classes and amonginvestment managers in order to achieve an optimal balance betweenrisk and return. In accordance with this policy, the Corporation hasestablished target allocations for each asset class and ranges ofexpected exposure. The Corporation’s retirement assets are investedwithin this allocation structure in three major categories: domesticequity securities, international equity securities, and debt securities.Below are the Corporation’s actual and established target allocations:
As of December 31, Target ExpectedAsset class 2005 2004 Exposure Range
Domestic Equities 54% 54% 50% 40% – 60%International Equities 15% 15% 15% 10% – 20%
Total Equity 69% 69% 65% 55% – 75%Fixed Income 31% 31% 35% 25% – 45%Cash 0% 0% 0% 0% – 10%
The Corporation may from time to time require the reallocation ofassets in order to bring the retirement plans into conformity with theseranges. The Corporation may also authorize alterations or deviationsfrom these ranges where appropriate for achieving the objectives ofthe retirement plans. The Corporation’s investment policy does notpermit its investment manager to invest plan funds in the Corpora-tion’s stock.
The long-term investment objective of the Retirement Plans is toachieve a total rate of return, net of fees, which exceeds the actuarialoverall expected return on assets assumption of 8.50% used for fund-ing purposes and which provides an appropriate premium over infla-tion. The intermediate-term objective of the Retirement Plans, definedas three to five years, is to outperform each of the capital markets inwhich assets are invested, net of fees. During periods of extreme mar-ket volatility, preservation of capital takes a higher precedence thanout performing the capital markets.
The overall expected return on assets assumption used in the calcu-lation of annual net periodic benefit cost is based on a combination ofthe historical performance of the pension fund and expectations offuture performance. The historical returns are determined using themarket-related value of assets, includes the recognition of realizedand unrealized gains and losses over a five-year period. Although overthe last ten years the market-related value of assets had an averageannual yield of 10.6%, the actual returns averaged 11.3% during thesame period. Given the uncertainties of the current economic andgeopolitical landscape, the Corporation considers 8.5% to be a rea-sonable assumption of future long-term investment returns. Whilethe Corporation takes into account historical performance, itsassumptions also consider the forward-looking long-term outlookfor the capital markets.

CURTISS-WRIGHT AND SUBSIDIARIES 63
Other Pension and Postretirement PlansThe Corporation offers all of its domestic employees the opportunity toparticipate in a defined contribution plan. Costs incurred by the Cor-poration in the administration and record keeping of the defined con-tribution plan are paid for by the Corporation and are not consideredmaterial.
In addition, the Corporation had foreign pension costs under variousretirement plans of $3.6 million, $3.5 million, and $1.9 million in 2005,2004, and 2003, respectively.
15. LeasesThe Corporation conducts a portion of its operations from leased facil-ities, which include manufacturing and service facilities, administra-tive offices, and warehouses. In addition, the Corporation leasesautomobiles, machinery, and office equipment under operatingleases. The leases expire at various dates and may include renewalsand escalations. Rental expenses for all operating leases amounted to$21.9 million in 2005, $18.5 million in 2004, and $10.5 million in 2003.
At December 31, 2005, the approximate future minimum rental com-mitments under operating leases that have initial or remaining non-cancelable lease terms in excess of one year are as follows:
Rental(In thousands) Commitment
2006 $15,4712007 13,6002008 11,4232009 8,6792010 5,763Thereafter 16,402
Total $71,338
16. Industry SegmentsThe Corporation manages and evaluates its operations based on theproducts and services it offers and the different markets it serves.Based on this approach, the Corporation has three reportable seg-ments: Flow Control, Motion Control, and Metal Treatment. The FlowControl segment primarily designs, manufactures, distributes, andservices a broad range of highly engineered flow control products forsevere service military and commercial applications. The Motion Con-trol segment primarily designs, develops, and manufactures mechan-ical systems, drive systems, and electronic controls and sensors forthe aerospace and defense industries. Metal Treatment providesvarious metallurgical services, principally shot peening, coatings,and heat treating. The segment provides these services to a broadspectrum of customers in various industries, including aerospace,automotive, construction equipment, oil and gas, petrochemical, andmetal working.
The accounting policies of the operating segments are the same asthose described in the summary of significant accounting policies.Interest expense and income taxes are not reported on an operatingsegment basis because they are not considered in the performanceevaluation by the Corporation’s chief operating decision-maker, itsChairman and CEO.
Sales to one customer of the Flow Control segment through which theCorporation is a subcontractor to the U.S. Government were 10% ofconsolidated revenues in 2005, 13% in 2004, and 16% in 2003. During2005, 2004, and 2003, the Corporation had no commercial customerrepresenting more than 10% of consolidated revenue.

64 CURTISS-WRIGHT AND SUBSIDIARIES
Consolidated Industry Segment Information:Flow Motion Metal Segment Corporate Consolidated
(In thousands) Control Control Treatment Total & Other(1) Total
YEAR ENDED DECEMBER 31, 2005:Revenue from external customers $466,546 $465,451 $198,931 $1,130,928 $ — $1,130,928Intersegment revenues — 548 545 1,093 (1,093) —Operating income (expense) 54,509 50,485 34,470 139,464 (1,482) 137,982Depreciation and amortization expense 17,307 19,572 10,836 47,715 136 47,851Segment assets 440,550 653,037 194,316 1,287,903 112,382 1,400,285Capital expenditures 16,459 12,966 12,919 42,344 100 42,444
YEAR ENDED DECEMBER 31, 2004:Revenue from external customers $388,139 $388,576 $178,324 $ 955,039 $ — $ 955,039Intersegment revenues — 144 555 699 (699) —Operating income (expense) 44,451 44,893 28,111 117,455 (7,114) 110,341Depreciation and amortization expense 15,884 14,214 10,381 40,479 263 40,742Segment assets 415,504 576,275 194,783 1,186,562 91,878 1,278,440Capital expenditures 10,420 10,171 11,728 32,319 133 32,452
YEAR ENDED DECEMBER 31, 2003:Revenue from external customers $341,271 $265,905 $138,895 $ 746,071 $ — $ 746,071Intersegment revenues — — 544 544 (544) —Operating income (expense) 39,980 30,321 18,742 89,043 (72) 88,971Depreciation and amortization expense 14,458 7,983 8,685 31,126 201 31,327Segment assets 323,689 317,631 170,547 811,867 161,798 973,665Capital expenditures 12,417 4,791 15,727 32,935 394 33,329
(1) Operating income (expense) for Corporate and Other includes pension (expense) income, environmental remediation and administrative expenses, and other expenses.
Reconciliations:
For the years ended December 31, (In thousands) 2005 2004 2003
REVENUES:Total segment revenue $1,130,928 $ 955,039 $746,071Intersegment revenue 1,093 699 544Elimination of intersegment revenue (1,093) (699) (544)
Total consolidated revenues $1,130,928 $ 955,039 $746,071
EARNINGS BEFORE TAXES:Total segment operating income $ 139,464 $ 117,455 $ 89,043Corporate and administrative (1,482) (7,114) (72)Other income, net 299 443 748Interest expense (19,983) (12,031) (5,663)
Total consolidated earnings before tax $ 118,298 $ 98,753 $ 84,056
ASSETS:Total assets for reportable segments $1,287,903 $1,186,562 $811,867Pension assets 76,002 77,802 77,877Non-segment cash 24,995 545 72,582Other assets 11,422 13,608 11,384Elimination of intersegment receivables (37) (77) (45)
Total consolidated assets $1,400,285 $1,278,440 $973,665

CURTISS-WRIGHT AND SUBSIDIARIES 65
The following table presents geographical information of the Corporation’s revenues and property, plant, and equipment based on the location ofthe customer and the assets, respectively:
December 31, (In thousands) 2005 2004 2003
Long-Lived Long-Lived Long-LivedRevenues Assets Revenues Assets Revenues Assets
Geographic Information:United States of America $ 864,465 $182,277 $735,356 $181,708 $574,427 $176,273United Kingdom 109,659 49,796 92,541 52,568 66,210 40,614Canada 38,595 26,286 20,675 14,136 17,052 6,528Other foreign countries 118,209 16,462 106,467 16,831 88,382 14,724
Consolidated total $1,130,928 $274,821 $955,039 $265,243 $746,071 $238,139
17. Contingencies and CommitmentsThe Corporation, through its Flow Control segment, has several NRClicenses necessary for the continued operation of its commercialnuclear operations. In connection with these licenses, the NRCrequired financial assurance from the Corporation in the form of a par-ent company guarantee, representing estimated environmentaldecommissioning and remediation costs associated with the com-mercial operations covered by the licenses. The guarantee for thedecommissioning costs of the refurbishment facility, which is esti-mated for 2017, is $3.1 million. See Note 13 for further information.
The Corporation enters into standby letters of credit agreements withfinancial institutions and customers primarily relating to guaranteesof repayment on certain Industrial Revenue Bonds, future perfor-mance on certain contracts to provide products and services, and tosecure advance payments the Corporation has received from certaininternational customers. At December 31, 2005, 2004, and 2003, theCorporation had contingent liabilities on outstanding letters of creditof $32.3 million, $19.4 million, and $19.5 million, respectively.
Consistent with other entities its size, the Corporation is party to anumber of legal actions and claims, none of which individually or in theaggregate, in the opinion of management, are expected to have a mate-rial adverse effect on the Corporation’s results of operations or finan-cial position.
18. Gain on the Sale of Real EstateOn March 17, 2005, the Corporation completed the sale of its Fairfield,New Jersey property, a former operating property, for $10.5 million.The property encompasses approximately 39 acres and was formerlyan operating facility for the Corporation’s Motion Control segment nowlocated in Shelby, North Carolina. As a result of the sale, the Corpora-tion recognized a pre-tax gain of $2.8 million in the first quarter of 2005,which is recorded in operating income in the Corporation’s Consoli-dated Statements of Earnings.
19. Subsequent EventOn February 7, 2006, the Board of Directors declared a 2-for-1 stocksplit in the form of a 100% stock dividend. The split, in the form of 1share of Common stock for each share of Common stock outstand-ing, is payable on April 7, 2006. As the market price of the shares doesnot reflect the stock split as of the date of this Annual Report, all ref-erences throughout this Annual Report to number of shares, per shareamounts, stock options data, and market prices of the Corporation’sCommon stock have not been adjusted to reflect the effect of thisstock split.

66 CURTISS-WRIGHT AND SUBSIDIARIES
Corporate Headquarters4 Becker Farm Road, 3rd FloorRoseland, NJ 07068www.curtisswright.com
Annual MeetingThe 2006 annual meeting of stockholders will be held on May 5,2006, at 2:00 pm at the Wilshire Grand Hotel, 350 Pleasant ValleyWay, West Orange, NJ 07052.
Stock Exchange ListingThe Corporation's Common stock is listed and traded on the NewYork Stock Exchange under the symbol CW.
Common ShareholdersAs of December 31, 2005, the approximate number of holders ofrecord of Common stock, par value of $1.00 per share of the Corporation was 7,100.
Stock Transfer Agent And RegistrarFor services such as changes of address, replacement of lost certificates or dividend checks, and changes in registered ownership, or for inquiries as to account status, write to American Stock Transfer & Trust Company at 59 Maiden Lane, New York,New York 10038.
Please include your name, address, and telephone number with all correspondence. Telephone inquiries may be made to (800) 937-5449. Foreign (212) 936-5100. Internet inquiries shouldbe addressed to http://www.amstock.com. Hearing-impairedshareholders are invited to log on to the website and select theLive Chat option.
Direct Stock Purchase Plan/Dividend Reinvestment PlanA plan is available to purchase or sell shares of Curtiss-WrightCommon stock. The plan provides a low cost alternative to the traditional methods of buying, holding and selling stock. The planalso provides for the automatic reinvestment of Curtiss-Wrightdividends. For more information, contact our transfer agent,American Stock Transfer & Trust Company toll-free at (877) 854-0844.
Investor InformationInvestors, stockbrokers, security analysts, and others seekinginformation about Curtiss-Wright Corporation should contactAlexandra M. Deignan, Director of Investor Relations, at the Corporate Headquarters listed above.
Stockholder CommunicationsAny stockholder wishing to communicate directly with our Board ofDirectors should write to Dr. William W. Sihler at SoutheasternConsultants Group, LTD, P.O. Box 5645, Charlottesville, VA 22905.
Financial ReportsThis Annual Report includes most of the periodic financial information required to be on file with the Securities and ExchangeCommission. The Corporation also files an Annual Report on Form 10-K, a copy of which may be obtained free of charge. Thesereports, as well as additional financial documents such as quarterly shareholder reports, proxy statements, and quarterlyreports on Form 10-Q, may be obtained by written request toAlexandra M. Deignan, Director of Investor Relations, at the Corporate Headquarters, or at the Corporation’s website www.curtisswright.com.
Stock Price Range
2005 2004
Common High Low High LowFirst Quarter $59.85 $48.81 $48.70 $44.20 Second Quarter 62.67 50.14 56.19 45.74 Third Quarter 67.40 52.35 58.28 51.10 Fourth Quarter 63.88 54.15 60.00 52.65
2005 2004
Class B High Low High LowFirst Quarter $58.65 $48.23 $47.50 $43.00 Second Quarter 62.22 53.41 53.77 43.50 Third Quarter — — 54.99 49.29 Fourth Quarter — — 58.32 50.00
Note: Class B shares converted to Common shares on May 24, 2005.
Dividends
Common 2005 2004
First Quarter $0.09 $0.09 Second Quarter 0.09 0.09 Third Quarter 0.09 0.09Fourth Quarter 0.12 0.09
Class B 2005 2004
First Quarter $0.09 $0.09Second Quarter 0.08 0.09 Third Quarter — 0.09Fourth Quarter — 0.09
Note: Class B shares converted to Common shares on May 24, 2005.
CORPORATE INFORMATION