Embed Size (px)
Citation preview

GrowingKnowing.com © 2011
1GrowingKnowing.com © 2011

VariabilityWe often want to know the variability of data.Please give me $1000, I will give you…
8% to 9% in a year. Small variability.-50% to 300% in a week. Large variability.
Most people prefer certainty to variability.We won’t meet in this classroom next week, and I
am not certain where we will meet? Sound good? Everyone happy?
Business people consider variability a risk.Business people like to avoid risks.
We can measure variability using range, variance, standard deviation, and coefficient of variation.
GrowingKnowing.com © 2011 2

RangeThe range is the largest number minus the
smallest.What is the Range of 1, 3, 4 and 9?
Range = 9 – 1 = 8
The range is fast and easy but a crude measure We don’t know if most or a few data items are
variable. The common mistake in range is going to fast
and missing the actual smallest or largest number.
GrowingKnowing.com © 2011 3

ExcelExcel does not have an =RANGE function.
TIP: if you do a search in Excel Help files you will find lots of references to range because Excel uses the term often in a non-statistical way to refer to a group of cells.
Use two functions=MAX to find the largest number =MIN for the smallest numberSubtract =max from =min to get the range.Example: =MAX(a1:a9)-MIN(a1:a9)
GrowingKnowing.com © 2011 4

VarianceVariance subtracts every data item from the meanVariance is a better measure of variability than range
because you look at every data item rather than just 2 data items.
Variance is not easy to understand as the measure is units squared.For example, if your data measures how long a job takes in
seconds, variance will be seconds squared (seconds2).Most people cannot understand or visualize a squared
second.Variance is important because variance is used to
calculate the standard deviation which is a very useful measure.
GrowingKnowing.com © 2011 5

FormulaSample variance:
Population variance:
Σ is called "Sigma" (upper case) and requires you sum the data values.
xi represents each data value. xI is pronounced "x bar" and it represents a sample mean. μ is called "mu" and it represents a population mean. n is the count of the number of data values in a set of sample data. N is the count of the number of data values in a population data set.
Note: Sample and population formulas are different!
GrowingKnowing.com © 2011 6

Excel=VAR(a1:a5) for a sample=VARP(a1:a5) for a population
To use the correct formula, you must know, are you are working with a sample or
population?
GrowingKnowing.com © 2011 7

Manual CalculationWhat is the variance of 1, 2, 3 days?1) Calculate the mean: =(1+2+3) / n = 6 /3 = 22)Data xi - xI (xi - xI)2
1 1 - 2 = -1 1 2 2 - 2 = 0 0 3 3 - 2 = +1 1 Totals: 0 2
Variance = 2 / (3-1) = 1 days2
GrowingKnowing.com © 2011 8

Standard deviation
GrowingKnowing.com © 2011 9

SkewedWhen you chart your data is the data
symmetrical, or lopsided to the right or left? A skew value of zero indicates symmetricalNotice the long tail on the skewed diagram
GrowingKnowing.com © 2011 10
Symmetrical Skewed right
Formula
There is more than one formula for skewness. The above formula is used for the test questions on our
website.
Excel has a function called =SKEW(a1:a9) Excel uses a different formula than the one
above. Check with your teacher to see what method is preferred.
GrowingKnowing.com © 2011 11

Skew questionsThe question may provide raw data,
if so, calculate the mean, median, and standard deviation and use the results to find skewness
The question may give you the mean, median, and standard deviation, so 3 fewer calculations are needed.
A popular test question asks if data is skewed right or left by comparing the mean, median, and mode.If the mean, median, or mode are approximately equal
then the data is symmetricalIf the data is skewed, the mean will be pulled towards
the long tail since the mean is easily influenced by extreme values If the mean is larger than the median, data is skewed right If mean is smaller than the median, data is skewed left
GrowingKnowing.com © 2011 12

Calculate if the data is skewed for these numbers: 1, 2, 3, 4, 5, 9, 23, -5, and -39.
In Excel:=3*(AVERAGE(a1:a9)-MEDIAN(a1:a9))/
STDEV(a1:a9)= -0.4813
This example is skewed to the left.
GrowingKnowing.com © 2011 13

Empirical RuleMany books are about six sigma; a concept using the
empirical rule.Six sigma is popular in business to set quality objectives
If your data is normally distributed, the empirical rule states (S.D. is abbreviated for standard deviation) 68% of the data will fall between 1 S.D. from the mean95% of the data will fall between 2 S.D. from the mean99.7% of the data will fall between 3 S.D. from the mean
We recommend you memorize the values: .68, .95, or .997
The symbol for S.D. is sigma, so 3 S.D. above the mean plus 3 S.D. below the mean adds to 6 sigma99.7% of work must meet quality objectives to be six
sigmaIs six sigma quality good enough?
GrowingKnowing.com © 2011 14

Calculate the empirical ruleThere are 2 types of questions
You are given the probability and asked for the data interval
You are given the data interval and asked for the probability
GrowingKnowing.com © 2011 15

Probability given: With a mean of 600, and S.D. of 10, what is the interval needed to hold 95% of the data? 95% is 2 S.D. above and below the mean
(memorized) Upper value is 600+10+10 = 620 Lower value is 600-10-10 = 580 Answer is 580 to 620
GrowingKnowing.com © 2011 16

With a mean of 20, standard deviation of 2, and interval of 18 to 22, what is the probability data lies in this interval?22 is 1 S.D. above the mean, 18 is 1 S.D.
belowAnswer = .68 because we memorized it 1 S.D.
is 68%.
GrowingKnowing.com © 2011 17

Chebyshev Empirical rule is for data that is normally
distributed. Chebyshev is for data NOT normally distributed.
Formula
Percent of data = 1 – 1/standard deviation2
The questions are similar to the empirical rule
GrowingKnowing.com © 2011 18

For data that is NOT normally distributed, what is the probability data will fall within 2 standard deviations of the mean? Probability = 1 – 1/22 = 1 – ¼ = 75%Answer: 75% of data will fall within 2 standard
deviations of the mean.Using Chebyshev, what is the interval and
percentage of data that will fall within 3 standard deviations if the mean is 100 and standard deviation is 10.For 3 standard deviations, mean +/- 3 x S.D.
Upper interval = 100 +30 =130 Lower interval = 100 -30 = 70
Percent = 1 – 1/32 = 1 – 1/9 = .89There is 89% probability data will fall within 3 std
deviations.GrowingKnowing.com © 2011 19

Coefficient of VariationIs standard deviation (S.D) of 100 large variability?
We are not sure until we know the size of the mean Mean = 200, then S.D. = 100 is very large Mean = 10 million then variability of S.D. = 100 is small
How do we compare variability if one variable measures payment by the hour and another measures payment by commission in dollars?
We can compare using Coefficient of VariationFormula: Coefficient Variation = (S.D/ Mean) x 100
GrowingKnowing.com © 2011 20
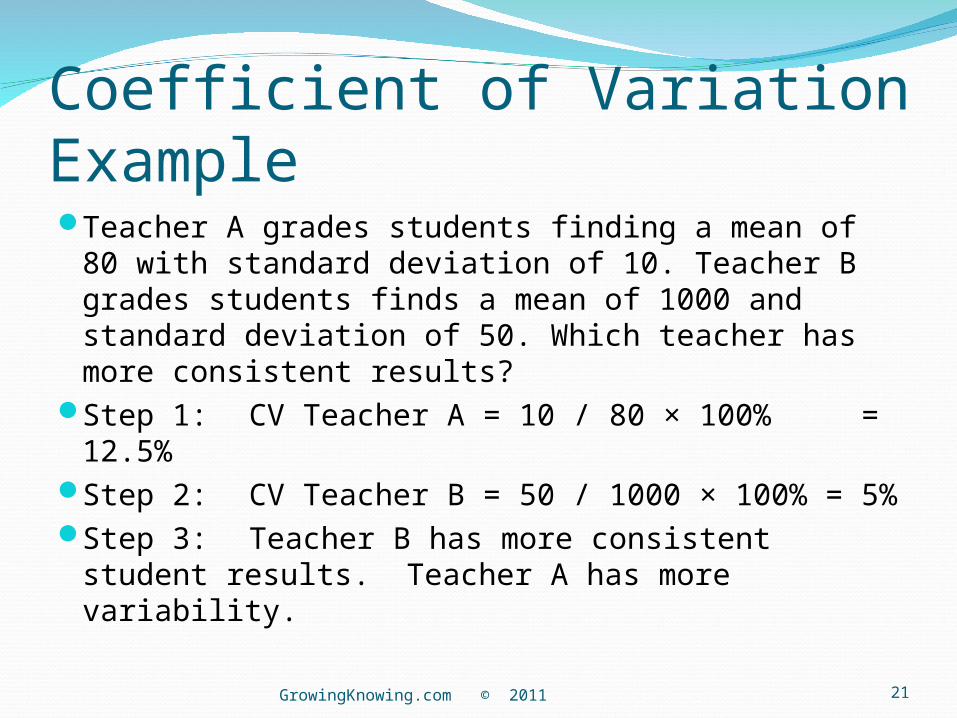
Coefficient of Variation ExampleTeacher A grades students finding a mean of 80
with standard deviation of 10. Teacher B grades students finds a mean of 1000 and standard deviation of 50. Which teacher has more consistent results?
Step 1: CV Teacher A = 10 / 80 × 100% = 12.5%
Step 2: CV Teacher B = 50 / 1000 × 100% = 5%
Step 3: Teacher B has more consistent student results. Teacher A has more variability.
GrowingKnowing.com © 2011 21

The endof the beginning
or the beginning of the end, if you have not been practising enough problems
Keep practising questions is the key to success.End when you can get 3 questions right in a row
at the hardest difficulty level for every topic. Run the Progress report to see your completion
results.
GrowingKnowing.com © 2011 22