Embed Size (px)
Citation preview
1
G R O W I N G W I T H E F F E C T I V E D I S T R I B U T I O N E X PA N S I O N
BY NIELSEN SALESFORCE ACTIVATION TEAM - Nov 2016
BY TARGETING TOP 20 PROVINCES
Co
pyr
igh
t ©
2013
Th
e N
iels
en C
om
pan
y. C
on
fid
enti
al a
nd
pro
pri
etar
y.
2
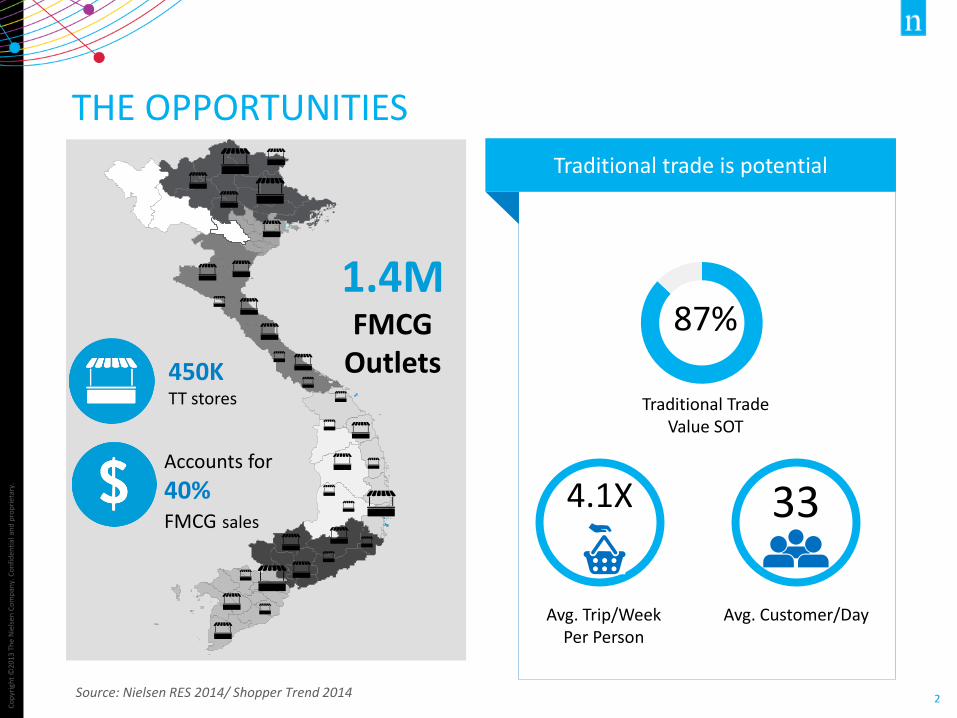
Traditional trade is potential
87%
Traditional Trade Value SOT
Avg. Customer/Day Avg. Trip/Week Per Person
33 4.1X
1.4M
FMCG Outlets
THE OPPORTUNITIES
Source: Nielsen RES 2014/ Shopper Trend 2014
450K TT stores
Accounts for
40% FMCG sales
Co
pyr
igh
t ©
2013
Th
e N
iels
en C
om
pan
y. C
on
fid
enti
al a
nd
pro
pri
etar
y.
3
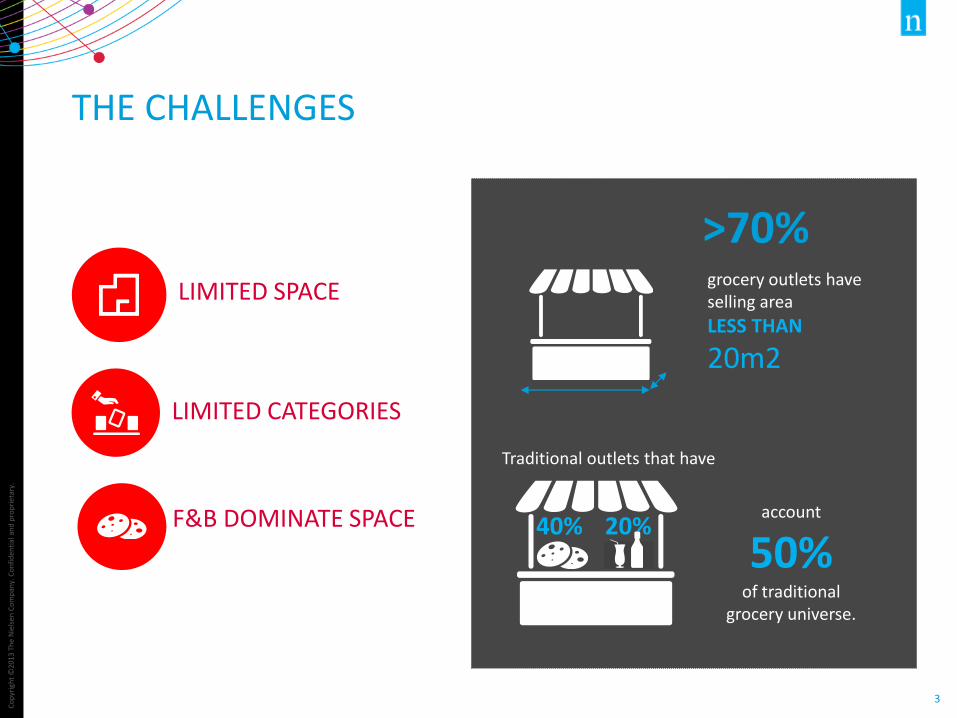
THE CHALLENGES
LIMITED CATEGORIES
LIMITED SPACE
F&B DOMINATE SPACE
Traditional outlets that have
account
50% of traditional
grocery universe.
40% 20%
>70% grocery outlets have selling area
LESS THAN
20m2
Co
pyr
igh
t ©
2013
Th
e N
iels
en C
om
pan
y. C
on
fid
enti
al a
nd
pro
pri
etar
y.
4
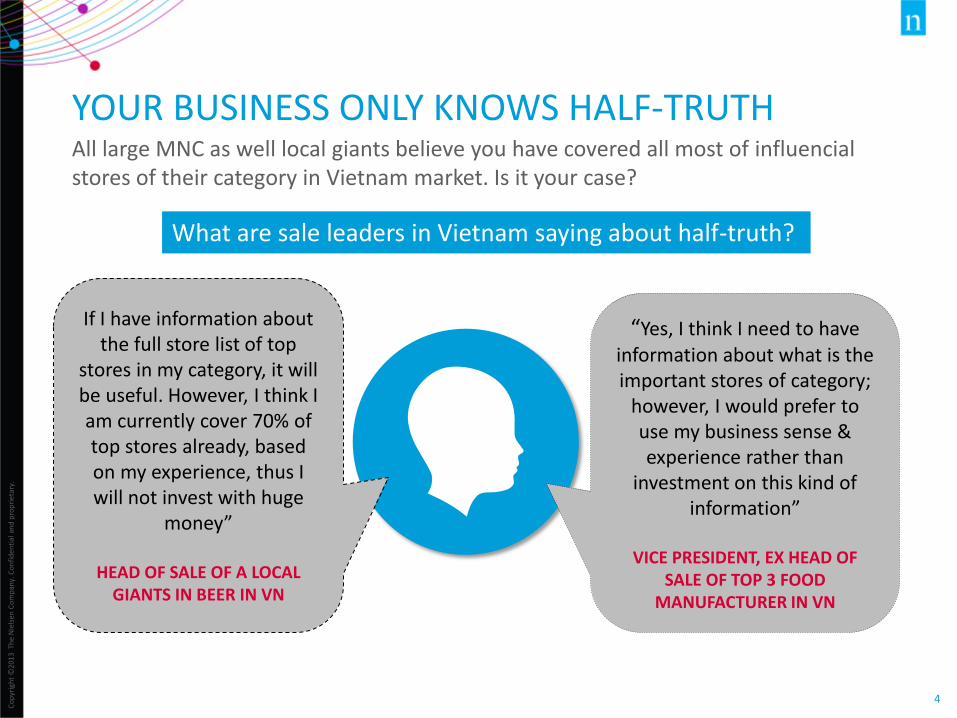
YOUR BUSINESS ONLY KNOWS HALF-TRUTH All large MNC as well local giants believe you have covered all most of influencial stores of their category in Vietnam market. Is it your case?
What are sale leaders in Vietnam saying about half-truth?
If I have information about the full store list of top
stores in my category, it will be useful. However, I think I am currently cover 70% of top stores already, based on my experience, thus I will not invest with huge
money”
HEAD OF SALE OF A LOCAL GIANTS IN BEER IN VN
“Yes, I think I need to have information about what is the important stores of category;
however, I would prefer to use my business sense & experience rather than
investment on this kind of information”
VICE PRESIDENT, EX HEAD OF
SALE OF TOP 3 FOOD MANUFACTURER IN VN
Co
pyr
igh
t ©
2013
Th
e N
iels
en C
om
pan
y. C
on
fid
enti
al a
nd
pro
pri
etar
y.
5
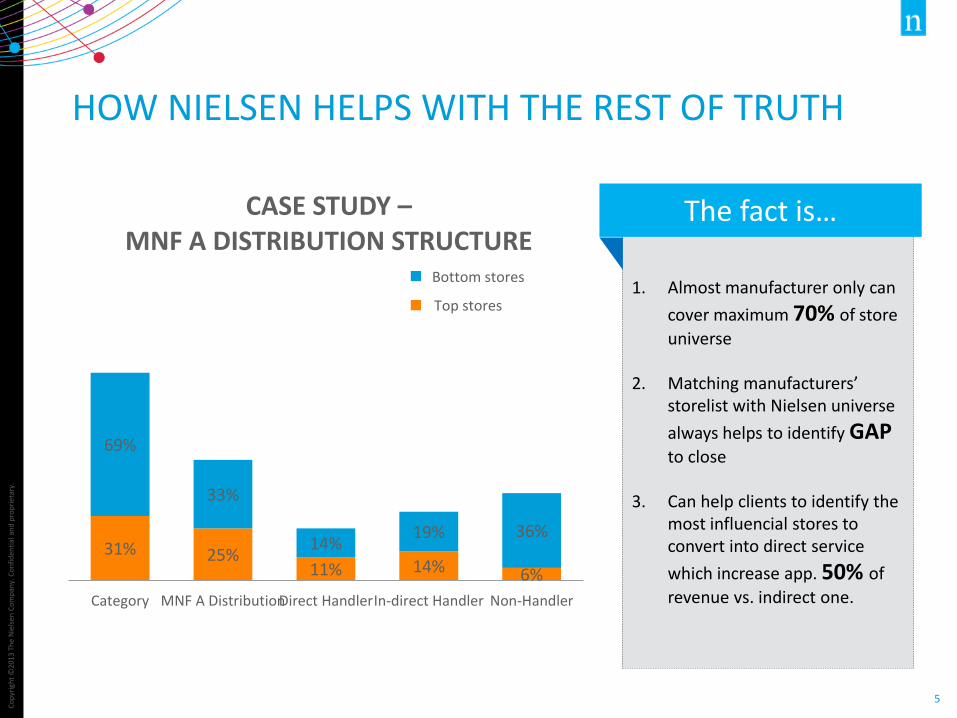
HOW NIELSEN HELPS WITH THE REST OF TRUTH
31% 25% 11% 14% 6%
69%
33%
14% 19% 36%
Category MNF A DistributionDirect HandlerIn-direct Handler Non-Handler
CASE STUDY – MNF A DISTRIBUTION STRUCTURE
Series2
Series1Top stores
Bottom stores 1. Almost manufacturer only can
cover maximum 70% of store
universe
2. Matching manufacturers’ storelist with Nielsen universe
always helps to identify GAP
to close
3. Can help clients to identify the most influencial stores to convert into direct service
which increase app. 50% of
revenue vs. indirect one.
The fact is…
Co
pyr
igh
t ©
2013
Th
e N
iels
en C
om
pan
y. C
on
fid
enti
al a
nd
pro
pri
etar
y.
6
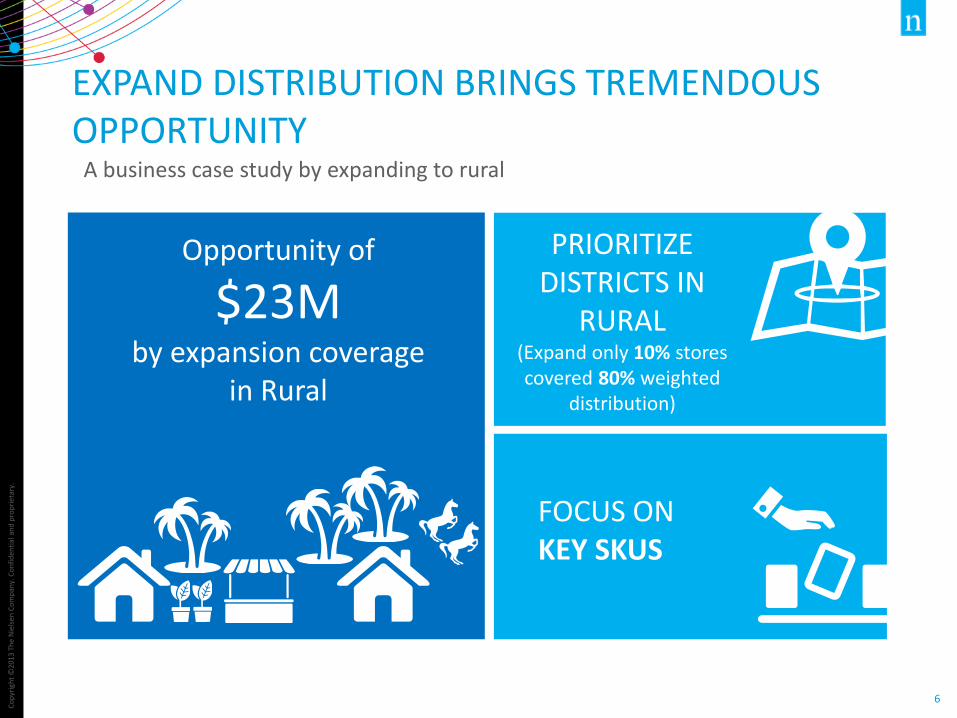
EXPAND DISTRIBUTION BRINGS TREMENDOUS OPPORTUNITY
A business case study by expanding to rural
Opportunity of
$23M by expansion coverage
in Rural
FOCUS ON KEY SKUS
PRIORITIZE DISTRICTS IN
RURAL (Expand only 10% stores covered 80% weighted
distribution)
Co
pyr
igh
t ©
2013
Th
e N
iels
en C
om
pan
y. C
on
fid
enti
al a
nd
pro
pri
etar
y.
8
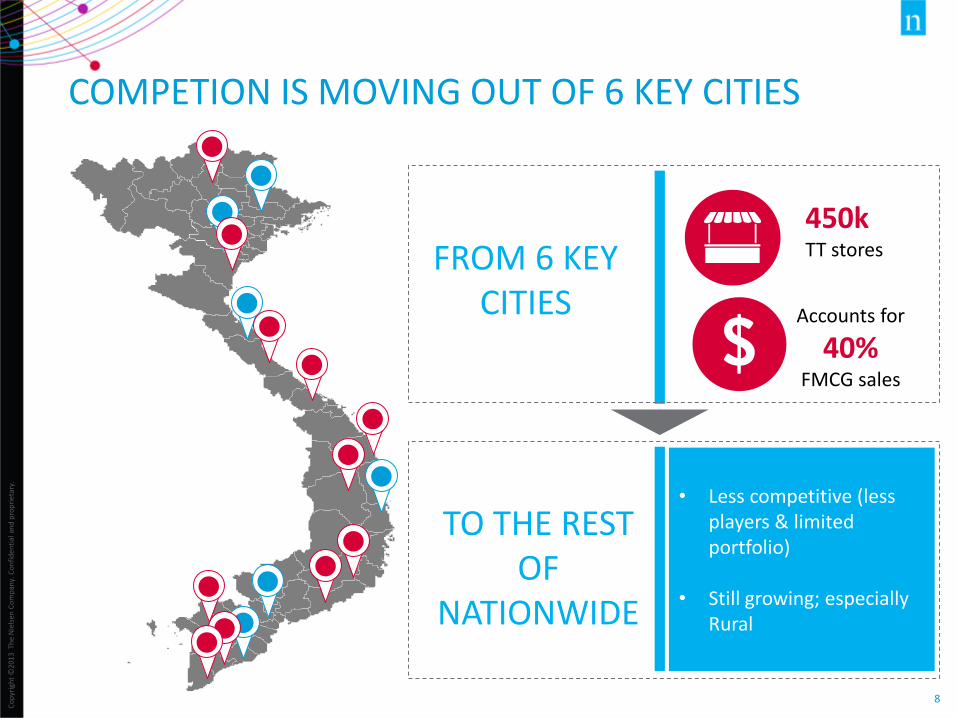
COMPETION IS MOVING OUT OF 6 KEY CITIES
FROM 6 KEY CITIES
TO THE REST OF
NATIONWIDE
450k TT stores
Accounts for
40% FMCG sales
• Less competitive (less players & limited portfolio)
• Still growing; especially Rural
9
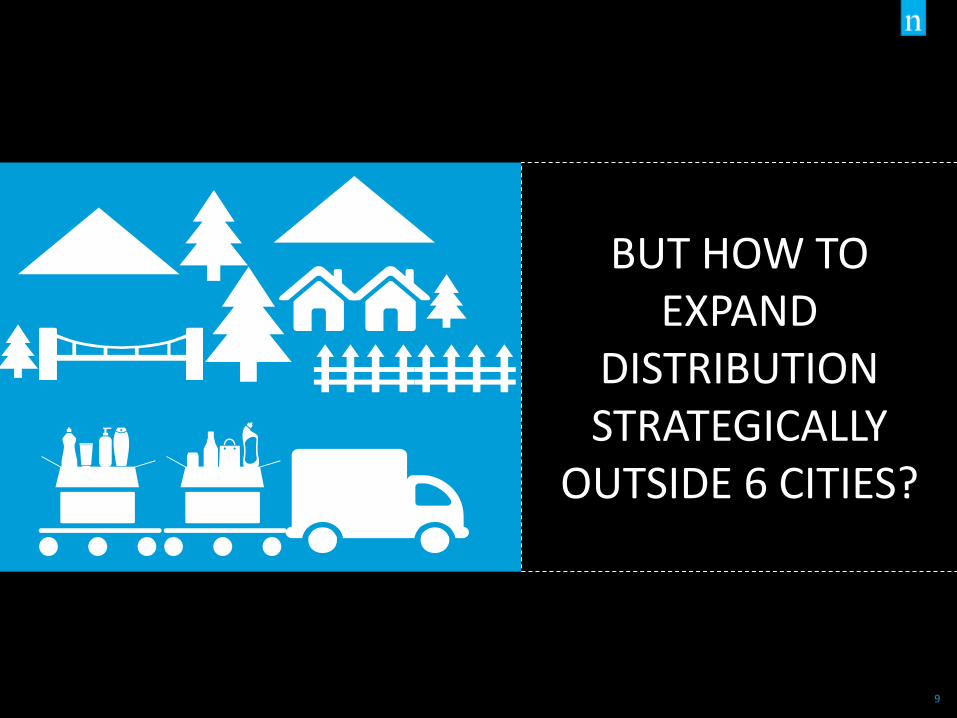
BUT HOW TO EXPAND
DISTRIBUTION STRATEGICALLY
OUTSIDE 6 CITIES?
Co
pyr
igh
t ©
2013
Th
e N
iels
en C
om
pan
y. C
on
fid
enti
al a
nd
pro
pri
etar
y.
10
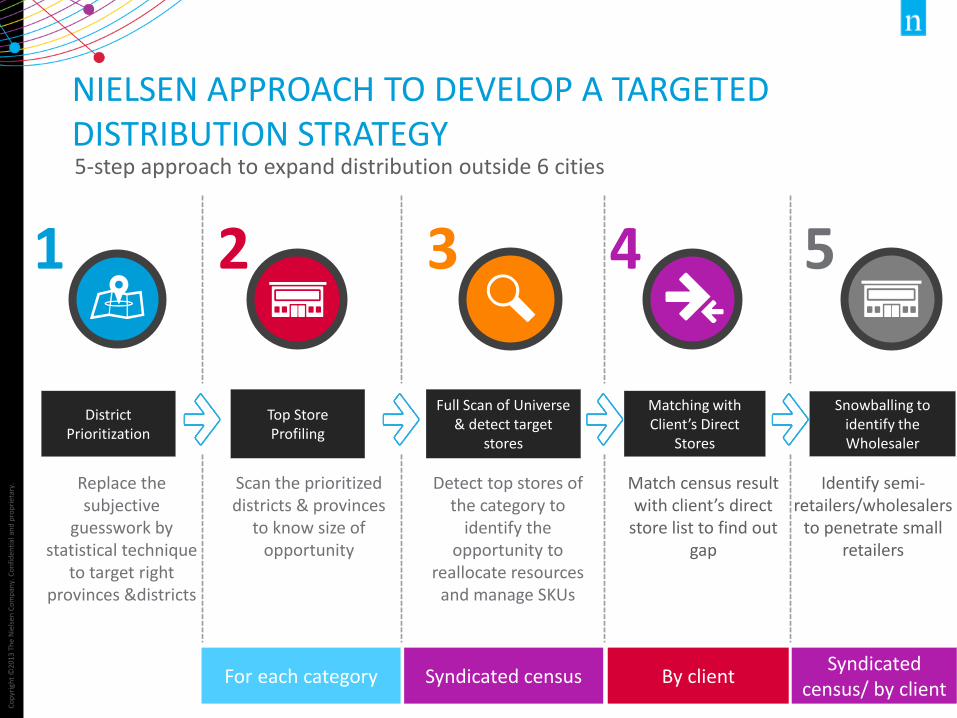
NIELSEN APPROACH TO DEVELOP A TARGETED DISTRIBUTION STRATEGY 5-step approach to expand distribution outside 6 cities
District Prioritization
Top Store Profiling
2 3
Full Scan of Universe & detect target
stores
Matching with Client’s Direct
Stores
1 4 5
Snowballing to identify the Wholesaler
Detect top stores of the category to
identify the opportunity to
reallocate resources and manage SKUs
Replace the subjective
guesswork by statistical technique
to target right provinces &districts
Scan the prioritized districts & provinces
to know size of opportunity
Identify semi-retailers/wholesalers
to penetrate small retailers
Match census result with client’s direct
store list to find out gap
For each category Syndicated census By client Syndicated
census/ by client
Co
pyr
igh
t ©
2013
Th
e N
iels
en C
om
pan
y. C
on
fid
enti
al a
nd
pro
pri
etar
y.
11
CLIENT’S BENEFIT FROM THE APPROACH
ALLOCATE ENOUGH SALES RESOURCES BY TARGETING RIGHT WHOLESALER
SAVING TIME BY TAPPING TOP CATEGORY SALES
OPTIMIZE COST BY SYNDICATION
Co
pyr
igh
t ©
2013
Th
e N
iels
en C
om
pan
y. C
on
fid
enti
al a
nd
pro
pri
etar
y.
12
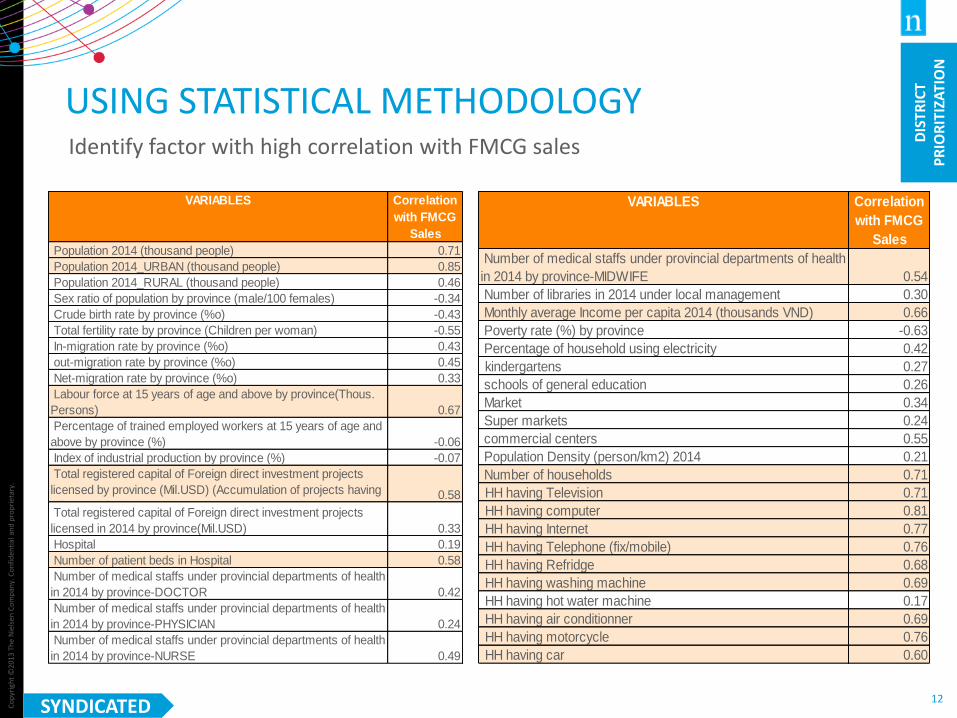
USING STATISTICAL METHODOLOGY Identify factor with high correlation with FMCG sales
VARIABLES Correlation
with FMCG
Sales
Population 2014 (thousand people) 0.71
Population 2014_URBAN (thousand people) 0.85
Population 2014_RURAL (thousand people) 0.46
Sex ratio of population by province (male/100 females) -0.34
Crude birth rate by province (%o) -0.43
Total fertility rate by province (Children per woman) -0.55
In-migration rate by province (%o) 0.43
out-migration rate by province (%o) 0.45
Net-migration rate by province (%o) 0.33
Labour force at 15 years of age and above by province(Thous.
Persons) 0.67
Percentage of trained employed workers at 15 years of age and
above by province (%) -0.06
Index of industrial production by province (%) -0.07
Total registered capital of Foreign direct investment projects
licensed by province (Mil.USD) (Accumulation of projects having
effect as of 31/12/2014) 0.58
Total registered capital of Foreign direct investment projects
licensed in 2014 by province(Mil.USD) 0.33
Hospital 0.19
Number of patient beds in Hospital 0.58
Number of medical staffs under provincial departments of health
in 2014 by province-DOCTOR 0.42
Number of medical staffs under provincial departments of health
in 2014 by province-PHYSICIAN 0.24
Number of medical staffs under provincial departments of health
in 2014 by province-NURSE 0.49
VARIABLES Correlation
with FMCG
Sales
Number of medical staffs under provincial departments of health
in 2014 by province-MIDWIFE 0.54
Number of libraries in 2014 under local management 0.30
Monthly average Income per capita 2014 (thousands VND) 0.66
Poverty rate (%) by province -0.63
Percentage of household using electricity 0.42
kindergartens 0.27
schools of general education 0.26
Market 0.34
Super markets 0.24
commercial centers 0.55
Population Density (person/km2) 2014 0.21
Number of households 0.71
HH having Television 0.71
HH having computer 0.81
HH having Internet 0.77
HH having Telephone (fix/mobile) 0.76
HH having Refridge 0.68
HH having washing machine 0.69
HH having hot water machine 0.17
HH having air conditionner 0.69
HH having motorcycle 0.76
HH having car 0.60
SYNDICATED
DIS
TRIC
T P
RIO
RIT
IZA
TIO
N
Co
pyr
igh
t ©
2013
Th
e N
iels
en C
om
pan
y. C
on
fid
enti
al a
nd
pro
pri
etar
y.
13
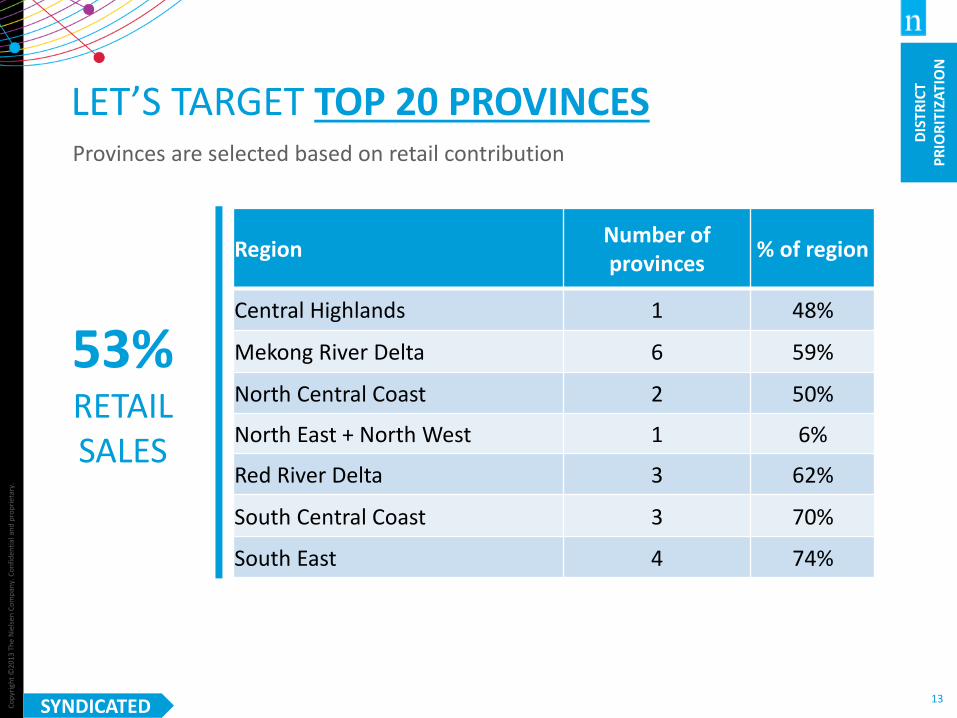
LET’S TARGET TOP 20 PROVINCES Provinces are selected based on retail contribution
Region Number of provinces
% of region
Central Highlands 1 48%
Mekong River Delta 6 59%
North Central Coast 2 50%
North East + North West 1 6%
Red River Delta 3 62%
South Central Coast 3 70%
South East 4 74%
53% RETAIL SALES
DIS
TRIC
T P
RIO
RIT
IZA
TIO
N
SYNDICATED
Co
pyr
igh
t ©
2013
Th
e N
iels
en C
om
pan
y. C
on
fid
enti
al a
nd
pro
pri
etar
y.
14
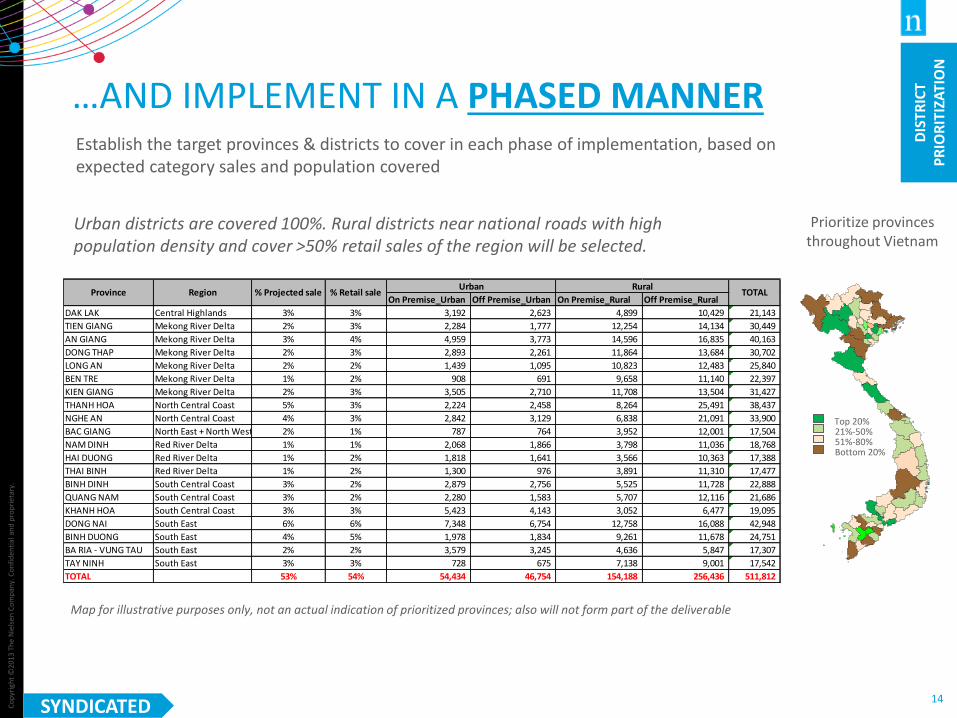
Urban districts are covered 100%. Rural districts near national roads with high population density and cover >50% retail sales of the region will be selected.
…AND IMPLEMENT IN A PHASED MANNER
Map for illustrative purposes only, not an actual indication of prioritized provinces; also will not form part of the deliverable
Top 20% 21%-50% 51%-80% Bottom 20%
Establish the target provinces & districts to cover in each phase of implementation, based on expected category sales and population covered
Prioritize provinces throughout Vietnam
On Premise_Urban Off Premise_Urban On Premise_Rural Off Premise_Rural
DAK LAK Central Highlands 3% 3% 3,192 2,623 4,899 10,429 21,143
TIEN GIANG Mekong River Delta 2% 3% 2,284 1,777 12,254 14,134 30,449
AN GIANG Mekong River Delta 3% 4% 4,959 3,773 14,596 16,835 40,163
DONG THAP Mekong River Delta 2% 3% 2,893 2,261 11,864 13,684 30,702
LONG AN Mekong River Delta 2% 2% 1,439 1,095 10,823 12,483 25,840
BEN TRE Mekong River Delta 1% 2% 908 691 9,658 11,140 22,397
KIEN GIANG Mekong River Delta 2% 3% 3,505 2,710 11,708 13,504 31,427
THANH HOA North Central Coast 5% 3% 2,224 2,458 8,264 25,491 38,437
NGHE AN North Central Coast 4% 3% 2,842 3,129 6,838 21,091 33,900
BAC GIANG North East + North West 2% 1% 787 764 3,952 12,001 17,504
NAM DINH Red River Delta 1% 1% 2,068 1,866 3,798 11,036 18,768
HAI DUONG Red River Delta 1% 2% 1,818 1,641 3,566 10,363 17,388
THAI BINH Red River Delta 1% 2% 1,300 976 3,891 11,310 17,477
BINH DINH South Central Coast 3% 2% 2,879 2,756 5,525 11,728 22,888
QUANG NAM South Central Coast 3% 2% 2,280 1,583 5,707 12,116 21,686
KHANH HOA South Central Coast 3% 3% 5,423 4,143 3,052 6,477 19,095
DONG NAI South East 6% 6% 7,348 6,754 12,758 16,088 42,948
BINH DUONG South East 4% 5% 1,978 1,834 9,261 11,678 24,751
BA RIA - VUNG TAU South East 2% 2% 3,579 3,245 4,636 5,847 17,307
TAY NINH South East 3% 3% 728 675 7,138 9,001 17,542
TOTAL 53% 54% 54,434 46,754 154,188 256,436 511,812
% Projected saleRegionProvince TOTALUrban Rural
% Retail sale
DIS
TRIC
T P
RIO
RIT
IZA
TIO
N
SYNDICATED
Co
pyr
igh
t ©
2013
Th
e N
iels
en C
om
pan
y. C
on
fid
enti
al a
nd
pro
pri
etar
y.
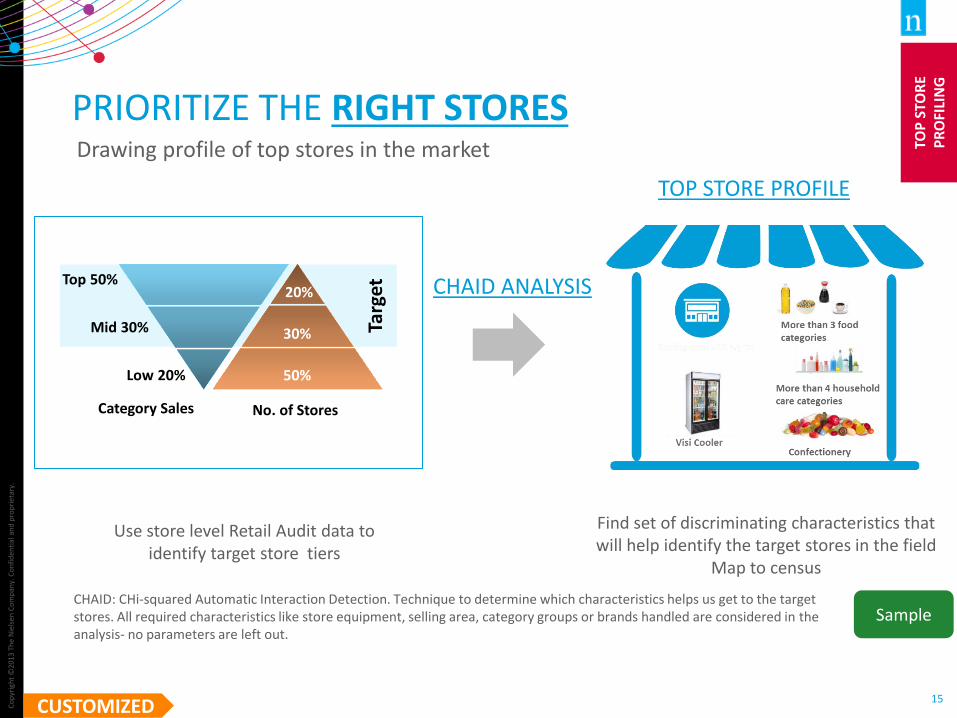
15
PRIORITIZE THE RIGHT STORES Drawing profile of top stores in the market
CHAID: CHi-squared Automatic Interaction Detection. Technique to determine which characteristics helps us get to the target stores. All required characteristics like store equipment, selling area, category groups or brands handled are considered in the analysis- no parameters are left out.
Sample
20%
30%
50%
Top 50%
Mid 30%
Low 20%
Category Sales No. of Stores
Targ
et
Use store level Retail Audit data to identify target store tiers
Find set of discriminating characteristics that will help identify the target stores in the field
Map to census
TOP STORE PROFILE
CHAID ANALYSIS
TOP
STO
RE
PR
OFI
LIN
G
CUSTOMIZED
Co
pyr
igh
t ©
2013
Th
e N
iels
en C
om
pan
y. C
on
fid
enti
al a
nd
pro
pri
etar
y.
16
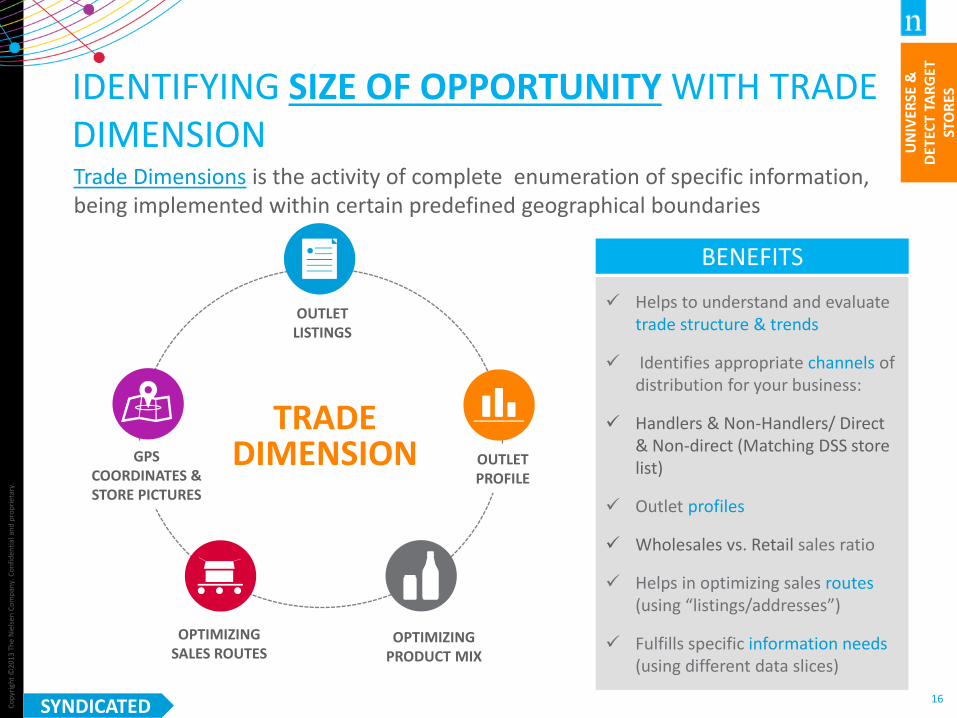
IDENTIFYING SIZE OF OPPORTUNITY WITH TRADE DIMENSION Trade Dimensions is the activity of complete enumeration of specific information, being implemented within certain predefined geographical boundaries
TRADE DIMENSION
OUTLET LISTINGS
OUTLET PROFILE
OPTIMIZING PRODUCT MIX
GPS COORDINATES & STORE PICTURES
OPTIMIZING SALES ROUTES
Helps to understand and evaluate trade structure & trends
Identifies appropriate channels of distribution for your business:
Handlers & Non-Handlers/ Direct & Non-direct (Matching DSS store list)
Outlet profiles
Wholesales vs. Retail sales ratio
Helps in optimizing sales routes (using “listings/addresses”)
Fulfills specific information needs (using different data slices)
BENEFITS
SYNDICATED
FULL
SC
AN
OF
UN
IVER
SE &
D
ETEC
T TA
RG
ET
STO
RES
Co
pyr
igh
t ©
2013
Th
e N
iels
en C
om
pan
y. C
on
fid
enti
al a
nd
pro
pri
etar
y.
17
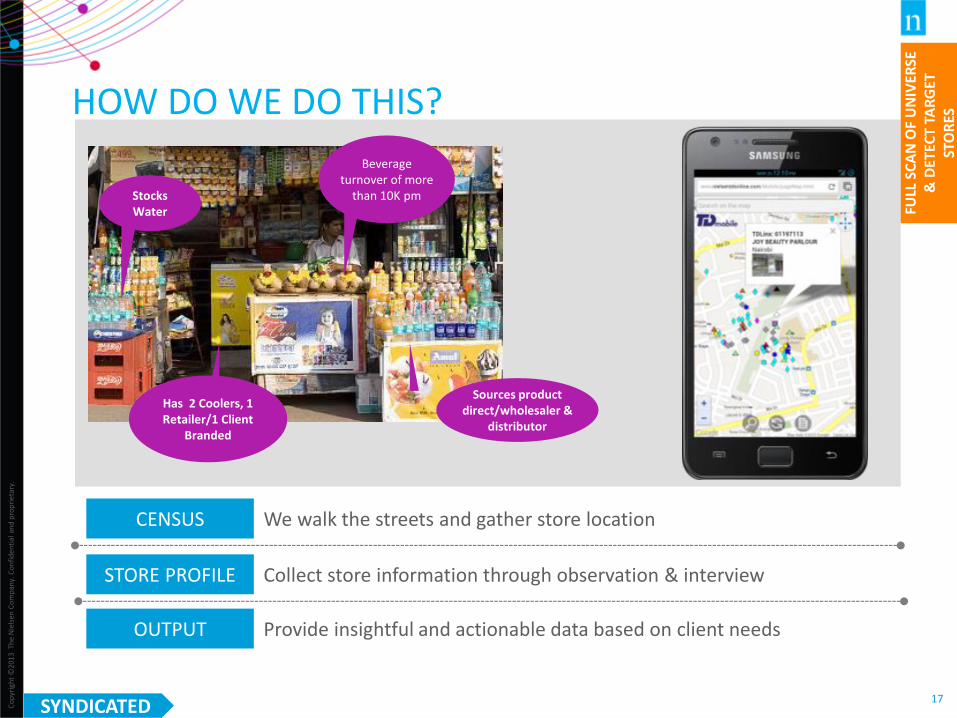
Stocks Water
Has 2 Coolers, 1 Retailer/1 Client
Branded
Sources product direct/wholesaler &
distributor
Beverage turnover of more
than 10K pm
HOW DO WE DO THIS?
CENSUS We walk the streets and gather store location
STORE PROFILE Collect store information through observation & interview
OUTPUT Provide insightful and actionable data based on client needs
FULL
SC
AN
OF
UN
IVER
SE
& D
ETEC
T TA
RG
ET
STO
RES
SYNDICATED
Co
pyr
igh
t ©
2013
Th
e N
iels
en C
om
pan
y. C
on
fid
enti
al a
nd
pro
pri
etar
y.
18
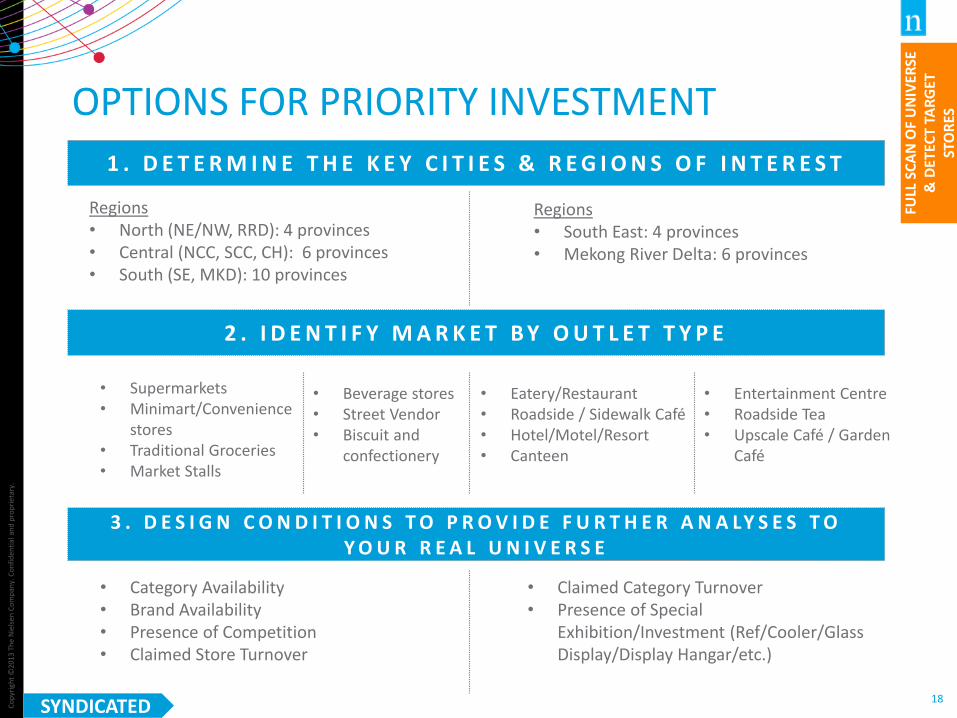
1 . D E T E R M I N E T H E K E Y C I T I E S & R E G I O N S O F I N T E R E S T
Regions • North (NE/NW, RRD): 4 provinces • Central (NCC, SCC, CH): 6 provinces • South (SE, MKD): 10 provinces
• Supermarkets • Minimart/Convenience
stores • Traditional Groceries • Market Stalls
• Eatery/Restaurant • Roadside / Sidewalk Café • Hotel/Motel/Resort • Canteen
• Category Availability • Brand Availability • Presence of Competition • Claimed Store Turnover
• Beverage stores • Street Vendor • Biscuit and
confectionery
• Entertainment Centre • Roadside Tea • Upscale Café / Garden
Café
2 . I D E N T I F Y M A R K E T B Y O U T L E T T Y P E
3 . D E S I G N C O N D I T I O N S T O P R O V I D E F U R T H E R A N A LY S E S T O Y O U R R E A L U N I V E R S E
• Claimed Category Turnover • Presence of Special
Exhibition/Investment (Ref/Cooler/Glass Display/Display Hangar/etc.)
Regions • South East: 4 provinces • Mekong River Delta: 6 provinces
OPTIONS FOR PRIORITY INVESTMENT
FULL
SC
AN
OF
UN
IVER
SE
& D
ETEC
T TA
RG
ET
STO
RES
SYNDICATED
Co
pyr
igh
t ©
2013
Th
e N
iels
en C
om
pan
y. C
on
fid
enti
al a
nd
pro
pri
etar
y.
19
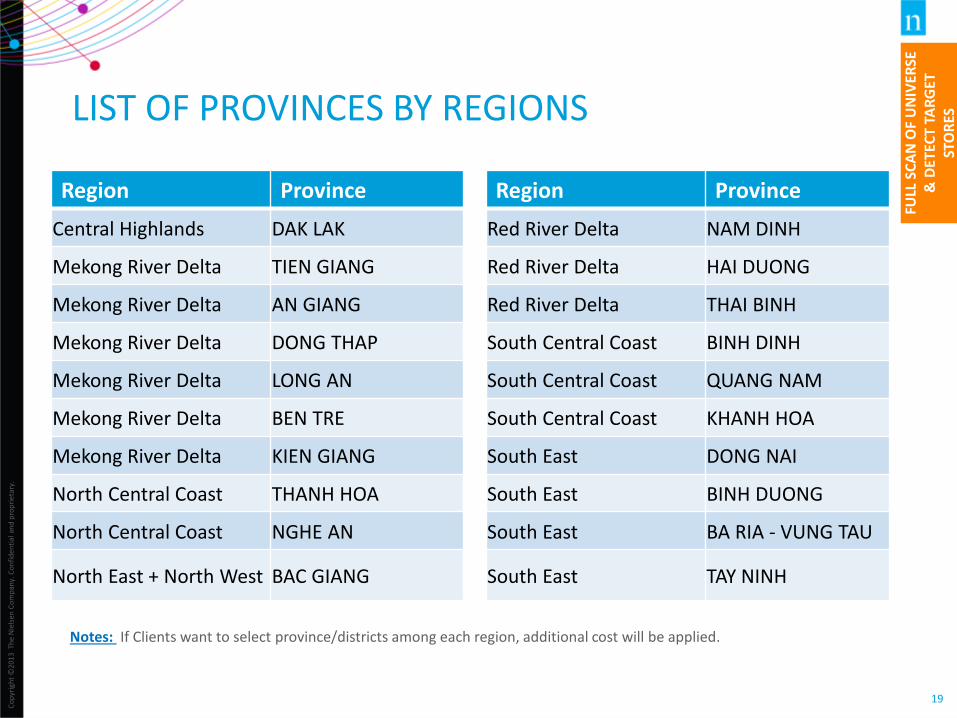
LIST OF PROVINCES BY REGIONS
Notes: If Clients want to select province/districts among each region, additional cost will be applied.
Region Province
Central Highlands DAK LAK
Mekong River Delta TIEN GIANG
Mekong River Delta AN GIANG
Mekong River Delta DONG THAP
Mekong River Delta LONG AN
Mekong River Delta BEN TRE
Mekong River Delta KIEN GIANG
North Central Coast THANH HOA
North Central Coast NGHE AN
North East + North West BAC GIANG
Region Province
Red River Delta NAM DINH
Red River Delta HAI DUONG
Red River Delta THAI BINH
South Central Coast BINH DINH
South Central Coast QUANG NAM
South Central Coast KHANH HOA
South East DONG NAI
South East BINH DUONG
South East BA RIA - VUNG TAU
South East TAY NINH
FULL
SC
AN
OF
UN
IVER
SE
& D
ETEC
T TA
RG
ET
STO
RES
Co
pyr
igh
t ©
2013
Th
e N
iels
en C
om
pan
y. C
on
fid
enti
al a
nd
pro
pri
etar
y.
20
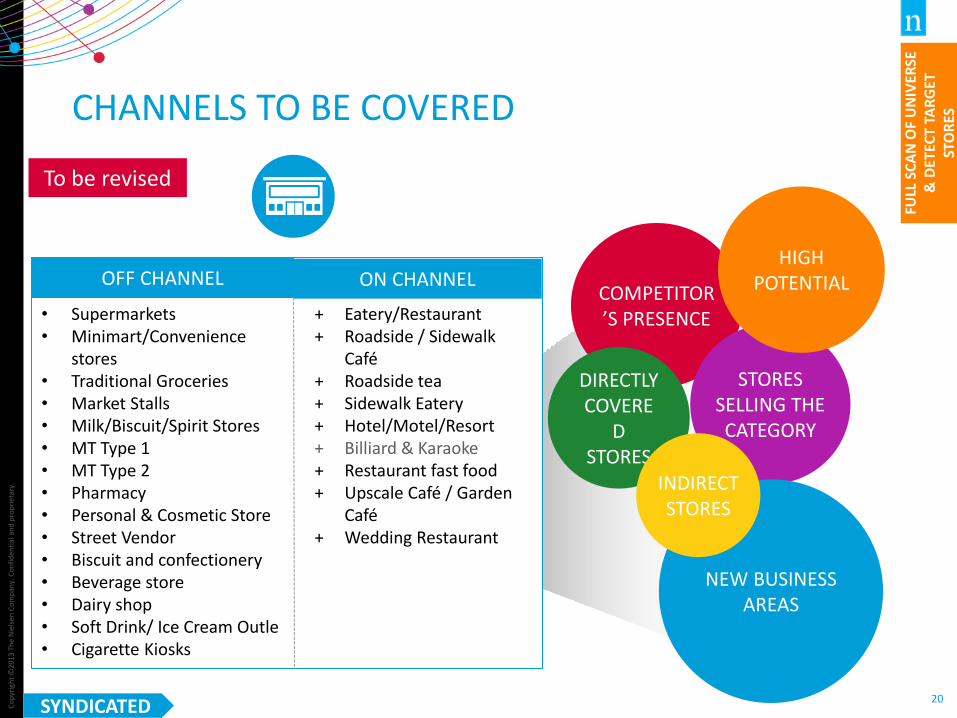
OFF CHANNEL
• Supermarkets • Minimart/Convenience
stores • Traditional Groceries • Market Stalls • Milk/Biscuit/Spirit Stores • MT Type 1 • MT Type 2 • Pharmacy • Personal & Cosmetic Store • Street Vendor • Biscuit and confectionery • Beverage store • Dairy shop • Soft Drink/ Ice Cream Outle • Cigarette Kiosks
ON CHANNEL
+ Eatery/Restaurant + Roadside / Sidewalk
Café + Roadside tea + Sidewalk Eatery + Hotel/Motel/Resort + Billiard & Karaoke + Restaurant fast food + Upscale Café / Garden
Café + Wedding Restaurant
COMPETITOR’S PRESENCE
STORES SELLING THE CATEGORY
DIRECTLY COVERE
D STORES
NEW BUSINESS AREAS
HIGH POTENTIAL
INDIRECT STORES
CHANNELS TO BE COVERED
To be revised
FULL
SC
AN
OF
UN
IVER
SE
& D
ETEC
T TA
RG
ET
STO
RES
SYNDICATED
Co
pyr
igh
t ©
2013
Th
e N
iels
en C
om
pan
y. C
on
fid
enti
al a
nd
pro
pri
etar
y.
21
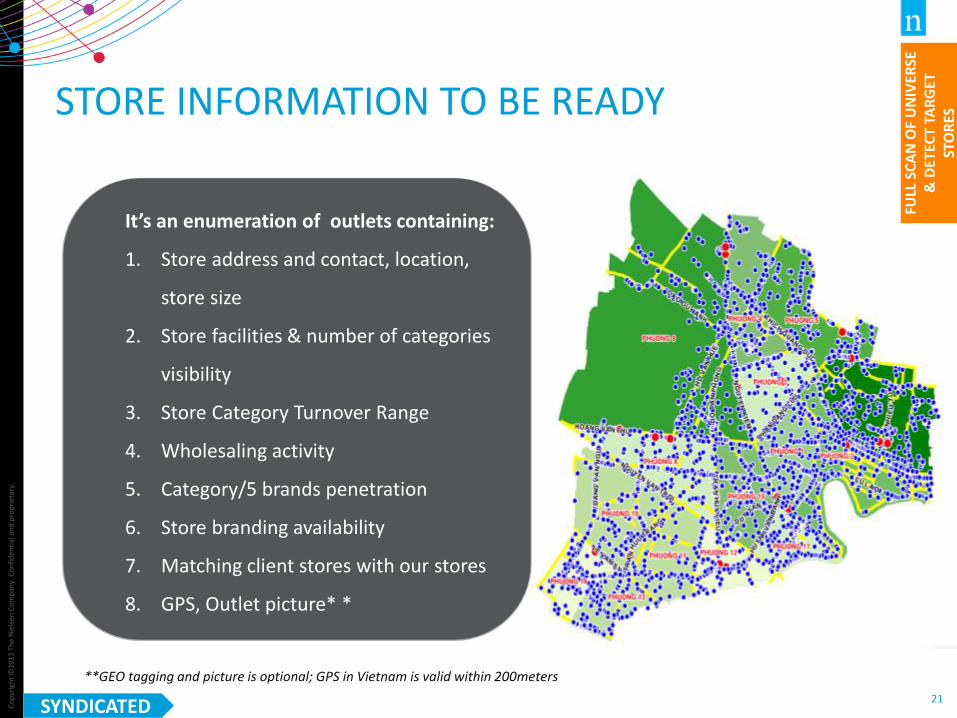
It’s an enumeration of outlets containing:
1. Store address and contact, location,
store size
2. Store facilities & number of categories
visibility
3. Store Category Turnover Range
4. Wholesaling activity
5. Category/5 brands penetration
6. Store branding availability
7. Matching client stores with our stores
8. GPS, Outlet picture* *
**GEO tagging and picture is optional; GPS in Vietnam is valid within 200meters
STORE INFORMATION TO BE READY
FULL
SC
AN
OF
UN
IVER
SE
& D
ETEC
T TA
RG
ET
STO
RES
SYNDICATED
Co
pyr
igh
t ©
2013
Th
e N
iels
en C
om
pan
y. C
on
fid
enti
al a
nd
pro
pri
etar
y.
22
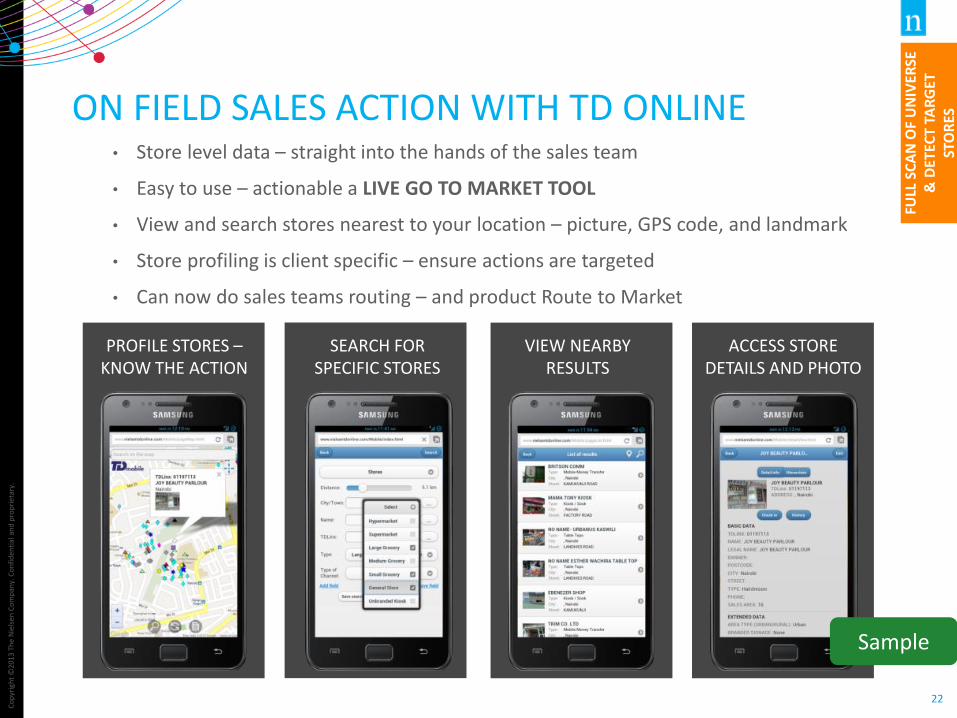
ON FIELD SALES ACTION WITH TD ONLINE • Store level data – straight into the hands of the sales team
• Easy to use – actionable a LIVE GO TO MARKET TOOL
• View and search stores nearest to your location – picture, GPS code, and landmark
• Store profiling is client specific – ensure actions are targeted
• Can now do sales teams routing – and product Route to Market
PROFILE STORES – KNOW THE ACTION
SEARCH FOR SPECIFIC STORES
VIEW NEARBY RESULTS
ACCESS STORE DETAILS AND PHOTO
Sample
FULL
SC
AN
OF
UN
IVER
SE
& D
ETEC
T TA
RG
ET
STO
RES
Co
pyr
igh
t ©
2013
Th
e N
iels
en C
om
pan
y. C
on
fid
enti
al a
nd
pro
pri
etar
y.
23
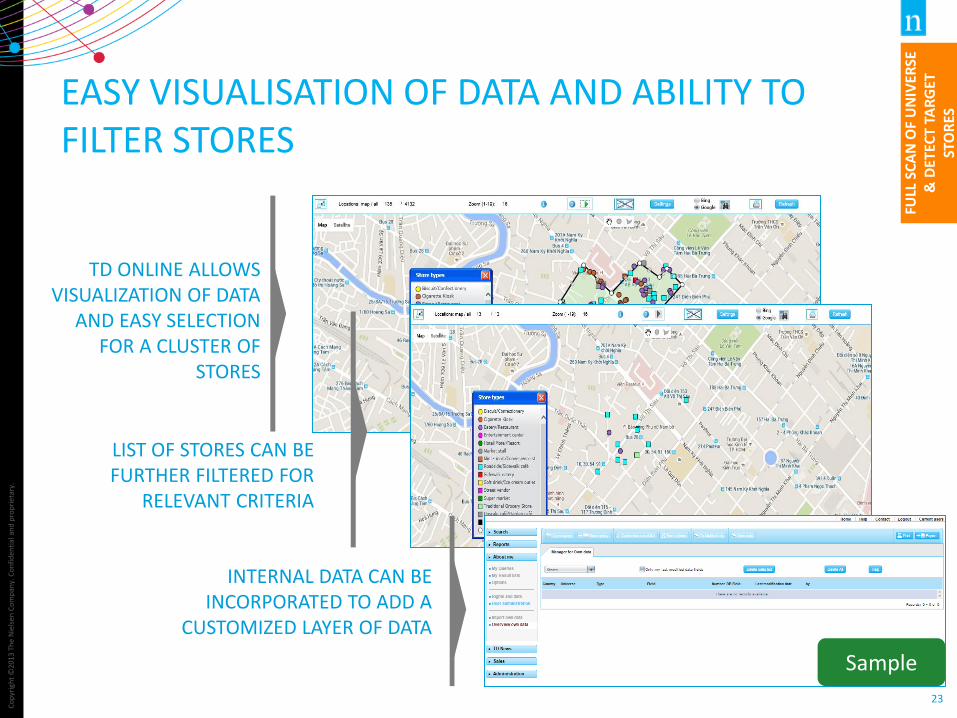
EASY VISUALISATION OF DATA AND ABILITY TO FILTER STORES
TD ONLINE ALLOWS VISUALIZATION OF DATA
AND EASY SELECTION FOR A CLUSTER OF
STORES
INTERNAL DATA CAN BE INCORPORATED TO ADD A
CUSTOMIZED LAYER OF DATA
Sample
FULL
SC
AN
OF
UN
IVER
SE
& D
ETEC
T TA
RG
ET
STO
RES
LIST OF STORES CAN BE FURTHER FILTERED FOR
RELEVANT CRITERIA
Co
pyr
igh
t ©
2013
Th
e N
iels
en C
om
pan
y. C
on
fid
enti
al a
nd
pro
pri
etar
y.
24
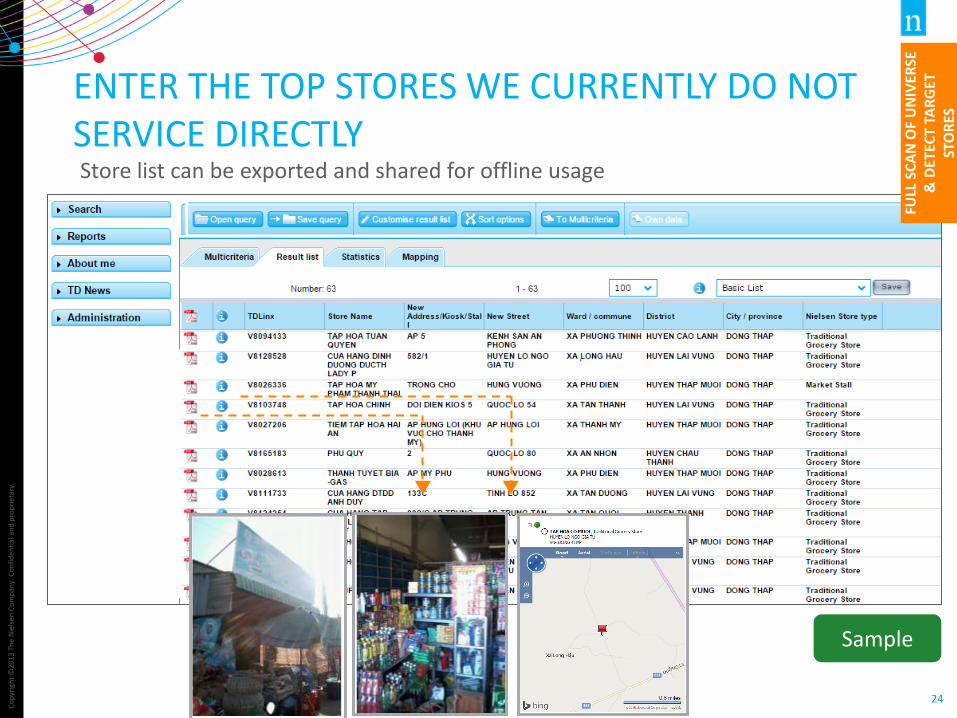
ENTER THE TOP STORES WE CURRENTLY DO NOT SERVICE DIRECTLY Store list can be exported and shared for offline usage
Sample
FULL
SC
AN
OF
UN
IVER
SE
& D
ETEC
T TA
RG
ET
STO
RES
Co
pyr
igh
t ©
2013
Th
e N
iels
en C
om
pan
y. C
on
fid
enti
al a
nd
pro
pri
etar
y.
25
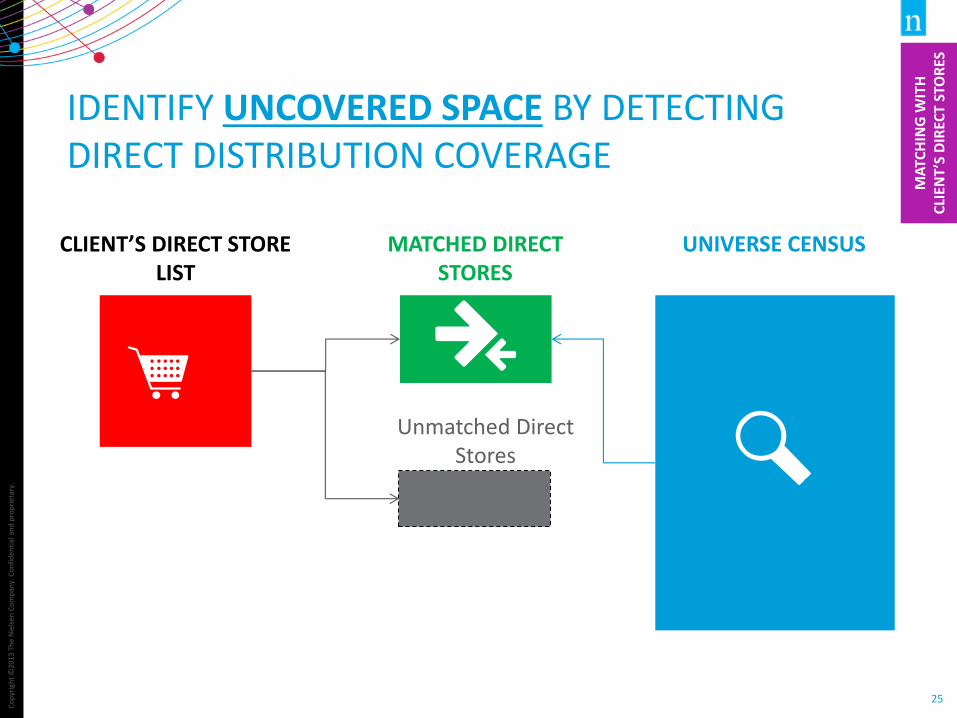
IDENTIFY UNCOVERED SPACE BY DETECTING DIRECT DISTRIBUTION COVERAGE
CLIENT’S DIRECT STORE LIST
UNIVERSE CENSUS MATCHED DIRECT STORES
Unmatched Direct Stores
Check this chart
MA
TCH
ING
WIT
H
CLI
ENT
’S D
IREC
T ST
OR
ES
Co
pyr
igh
t ©
2013
Th
e N
iels
en C
om
pan
y. C
on
fid
enti
al a
nd
pro
pri
etar
y.
26
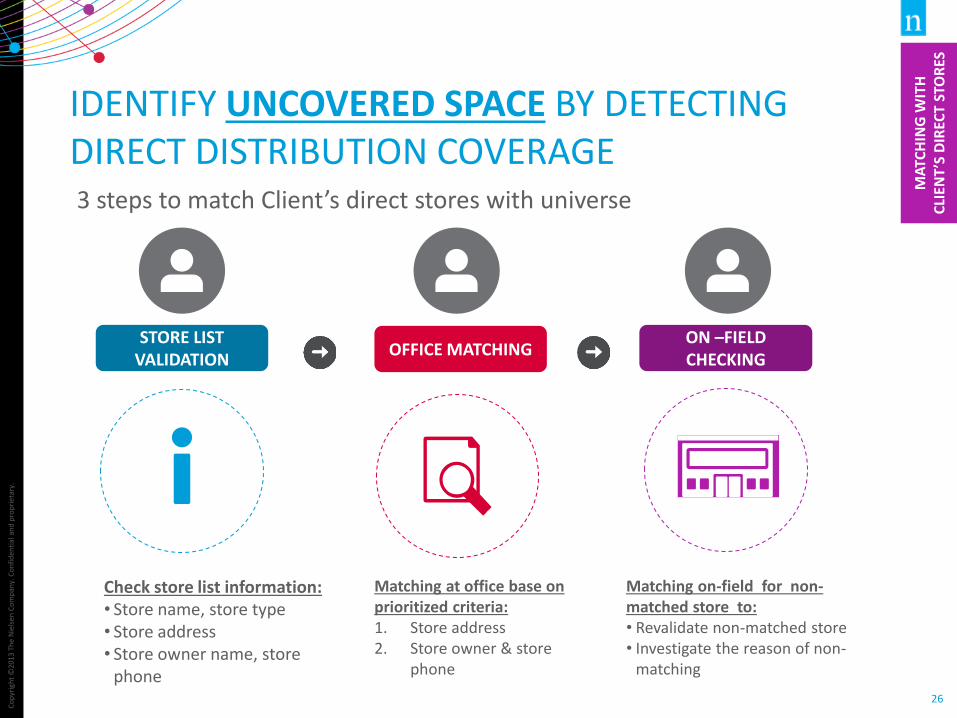
IDENTIFY UNCOVERED SPACE BY DETECTING DIRECT DISTRIBUTION COVERAGE 3 steps to match Client’s direct stores with universe
STORE LIST VALIDATION
Check store list information: • Store name, store type • Store address • Store owner name, store
phone
OFFICE MATCHING
Matching at office base on prioritized criteria: 1. Store address 2. Store owner & store
phone
ON –FIELD CHECKING
Matching on-field for non-matched store to: • Revalidate non-matched store • Investigate the reason of non-
matching
MA
TCH
ING
WIT
H
CLI
ENT
’S D
IREC
T ST
OR
ES
Co
pyr
igh
t ©
2013
Th
e N
iels
en C
om
pan
y. C
on
fid
enti
al a
nd
pro
pri
etar
y.
27
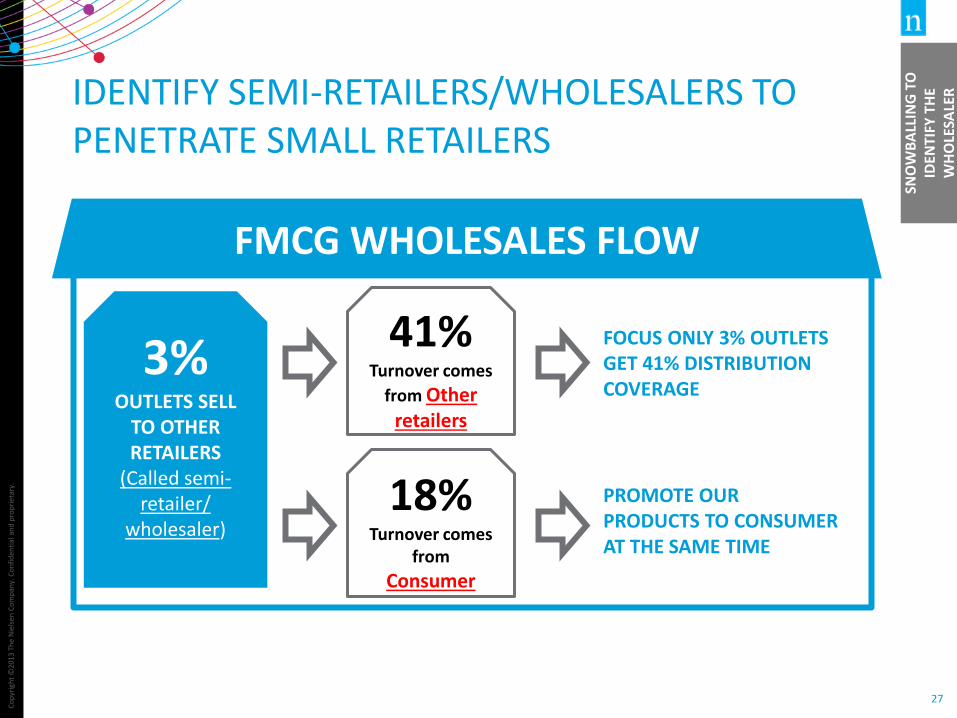
IDENTIFY SEMI-RETAILERS/WHOLESALERS TO PENETRATE SMALL RETAILERS
FMCG WHOLESALES FLOW
3% OUTLETS SELL
TO OTHER RETAILERS
(Called semi-retailer/
wholesaler)
41% Turnover comes
from Other retailers
18% Turnover comes
from
Consumer
FOCUS ONLY 3% OUTLETS GET 41% DISTRIBUTION COVERAGE
PROMOTE OUR PRODUCTS TO CONSUMER AT THE SAME TIME
Check this slide Source of
information
SNO
WB
ALL
ING
TO
ID
ENTI
FY T
HE
WH
OLE
SALE
R
Co
pyr
igh
t ©
2013
Th
e N
iels
en C
om
pan
y. C
on
fid
enti
al a
nd
pro
pri
etar
y.
28
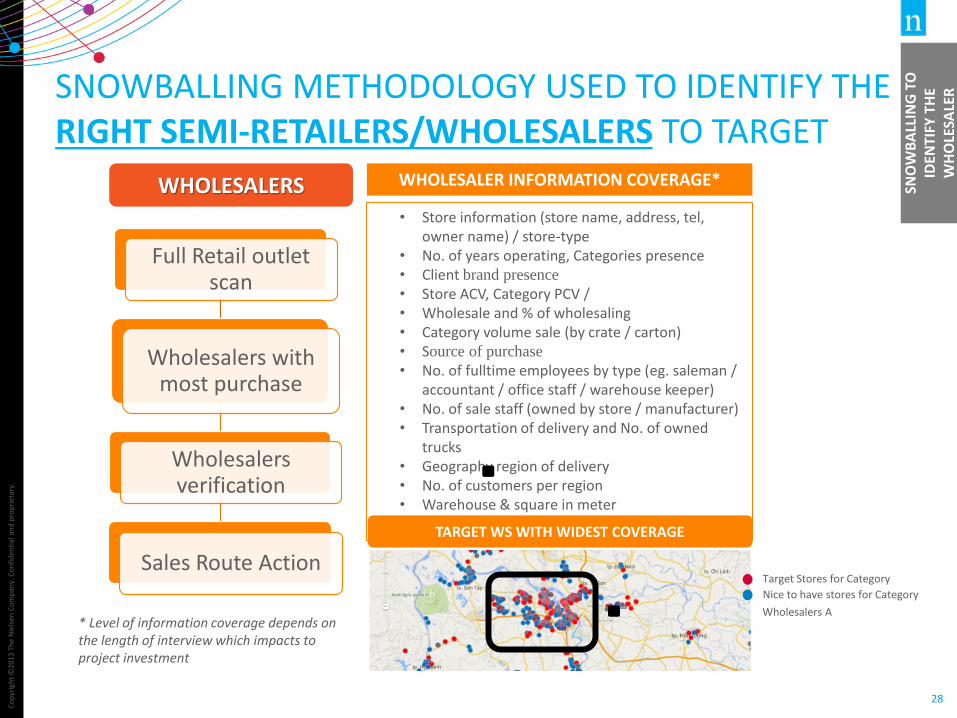
SNOWBALLING METHODOLOGY USED TO IDENTIFY THE RIGHT SEMI-RETAILERS/WHOLESALERS TO TARGET
WHOLESALERS
Full Retail outlet scan
Wholesalers with most purchase
Wholesalers verification
Sales Route Action
• Store information (store name, address, tel, owner name) / store-type
• No. of years operating, Categories presence • Client brand presence • Store ACV, Category PCV / • Wholesale and % of wholesaling • Category volume sale (by crate / carton) • Source of purchase • No. of fulltime employees by type (eg. saleman /
accountant / office staff / warehouse keeper) • No. of sale staff (owned by store / manufacturer) • Transportation of delivery and No. of owned
trucks • Geography region of delivery • No. of customers per region • Warehouse & square in meter • No. of offices & office facilities
WHOLESALER INFORMATION COVERAGE*
TARGET WS WITH WIDEST COVERAGE
Target Stores for Category
Nice to have stores for Category
Wholesalers A * Level of information coverage depends on the length of interview which impacts to project investment
SNO
WB
ALL
ING
TO
ID
ENTI
FY T
HE
WH
OLE
SALE
R
CLIENT INVESTMENT
TIMELINE TO GO!
34
T H A N K Y O U
BY NIELSEN SALESFORCE ACTIVATION TEAM - Nov 2016