Embed Size (px)
Citation preview

Growing taller among toilets:Evidence from changes in sanitation and child height in
Cambodia, 2005-2010
Phyrum Kov Susanna Smets Dean Spears∗ Sangita Vyas
June 30, 2013
Abstract
Child height is an important indicator of human capital and human development,in large part because early life health and net nutrition shape both height and adulteconomic productivity and health. Recent medical evidence suggests that exposure topoor sanitation – and specifically to widespread open defecation – can pose a criticalthreat to child growth. Cambodia saw a significant decline in open defecation andincrease in child height between its 2005 and 2010 Demographic and Health Surveys.This paper identifies an effect of open defecation on child height from within-provincechanges in the local area open defecation to which children are exposed. In particular,it is local open defecation that matters most for child height, underscoring the negativeexternalities that make reducing open defecation a policy priority where it is common.Our estimate is quantitatively robust, and corroborated by model averaging techniques.Decomposition analysis, in the spirit of Blinder-Oaxaca, further suggests that reductionin children’s exposure to open defecation can statistically account for much or all ofthe increase in average child height between 2005 and 2010.
∗Corresponding author: [email protected]. Affiliations: Kov, Smets: World Bank Water and Sani-tation Program; Spears: Centre for Development Economics at Delhi School of Economics and rice; Vyas:rice. This work received no specific funding, beyond the ordinary funding of its authors. This paper reflectsthe conclusions if its authors alone, and not necessarily of any government or organization.
1
1 Introduction
Child height is an important indicator of human capital and human development, in large
part because of its importance for adult economic productivity and health (Currie, 2009;
Vogl, 2011). This is cheifly because height is determined by health and net nutrition in the
first few years of life, a critical period for cognitive development (Case and Paxson, 2008). In
poor countries, the importance for height and child development of early-life health, relative
to genetics, is even greater than in richer countries (Martorell et al., 1977; Spears, 2012b).
Recent econometric evidence suggests that exposure to germs from open defecation is an
important determinant of child height in developing countries (World Bank, 2008; Spears,
2013). It is therefore important to better understand the relationship among sanitation, the
early-life disease environment, and subsequent child health and human capital outcomes,
especially in countries where practicing open defecation is widespread.
We study the effect of open defecation on child height in Cambodia, where more than half
of the population defecates in the open, without using a toilet or latrine. The primary con-
tribution of this paper is to econometrically identify an effect of the local prevalence of open
defecation on child height by studying changes over time within geographic areas of Cam-
bodia. In studying Cambodia this paper makes an important contribution to the literature
for two reasons. First, in Cambodia open defecation is particularly common, representing
an enduring development challenge and an unusually threatening disease environment for
children. Second, although the country remains far from eliminating open defecation or
child stunting, Cambodia saw an improvement in child height 2005 to 2010, coupled with a
decrease in open defecation, a type of natural experiment that gives us the opportunity to
identify effects of a change in sanitation.1
The empirical analysis in this paper comes in two parts. First, we combine the two most
1In Cambodia, open defecation rates fell by 14 percentage points over the 5 year studied, compared witha 8 percentage point decline over the 7 years between India’s two most recent DHS surveys. According toWHO-UNICEF joint monitoring program data, Cambodia’s decline in open defecation over this period wasin the 96th percentile of all countries.
2

recent Demographic and Health Surveys in Cambodia to estimate the effect on child height of
the local area open defecation to which a child is exposed, using panel data methods. We find
that provinces within which open defecation decreased by more saw a greater improvement
in child height, on average. Our result is robust to a range of specifications and is confirmed
by two model averaging techniques: Bayesian model averaging and weighted-average least
squares. In this section, we document important negative externalities of open defecation in
Cambodia, an important motivation for policy action.
Second, we ask how much of the increase in child height from 2005 to 2010 can be statis-
tically accounted for by the reduction in open defecation. We apply several complementary
decomposition techniques in the spirit of Blinder-Oaxaca. Although open defecation remains
common in Cambodia, we find that its decline over the period studied can account for much
of the increase in child height.
1.1 Open defecation and child stunting
According to joint UNICEF and WHO (2013) estimates, 15 percent of people in the world,
and 18 percent of people in developing countries - about one billion people overall - defecate
in the open without using a toilet or latrine. Of these one billion people, more than 8 million
live in Cambodia, representing 58 percent of the country’s population. Among developing
countries, open defecation is particularly common in Cambodia, notably more common than
in sub-Saharan Africa, and slightly moreso than in India, where about half of all people who
defecate in the open live.
Research in medicine and epidemiology links open defecation to poor health through at
least two mechanisms. The first, and most commonly recognized, mechanism is diarrhea
from fecal-oral contamination. Checkley et al. (2008) use detailed longitudinal data to
demonstrate an association between childhood diarrhea and subsequent height. A second
mechanism, only recently becoming understood, is chronic “environmental enteropathy,” a
disorder of the intestine that reduces the body’s absorption of nutrients due to an inflamma-
3

tory response to continued contamination with fecal pathogens. Humphrey (2009) proposes
that chronic environmental enteropathy could cause malnutrition, stunting, and cognitive de-
fects, even without manifesting as diarrhea such that a child would appear ill. If so, diarrhea
could be merely the “tip of the iceberg” of effects of open defecation on child development,
resting atop a more quantitatively important threat from enteropathy. For example, recent
epidemiological studies by Lin et al. (2013) and Kosek et al. (2013) document important
links among sanitation, enteropathy, and child growth.
This paper joins a growing econometric literature documenting effects of open defecation
on child height. Spears (2012a) studies a program that improved rural sanitation in some
districts of India. Averaging over the heterogeneity of program implementation across ru-
ral India, the government program reduced infant mortality and increased children’s height
in the places where it reduced open defecation. In a recent field experiment in Indone-
sia, Cameron et al. (2013) show that a Total Sanitation and Sanitation Marketing project
increased average height of children living in households without access to sanitation at base-
line. Similarly, Hammer and Spears (2013) study the effects of a randomized field experiment
in Maharashtra, India, in which children living in villages randomly assigned to receive san-
itation motivation and subsidized latrine construction grew taller than children in control
villages. Finally, Spears (2013) investigates the difference in child height between India and
Africa and documents that cross-country variation in sanitation statistically explains a large
fraction of international height differences.
1.2 Sanitation in Cambodia
Cambodia is a Southeast Asian country of 14 million people bordering Thailand, Vietnam
and Laos. Three-fourths of the population – and 90 percent of Cambodia’s poor – live in
rural places (World Bank, forthcoming). The country has a moderate population density of
about 75 people per square kilometer, which is about one-fifth of India’s population density.
Over the five year period we study from 2005 to 2010, the fraction of the population living
4

on less than $1.25 a day fell from around 35 percent to under 20 percent, according to World
Bank World Development Indicator statistics.
Open defecation has historically been high in Cambodia. We study change over the
period from 2005 to 2010, when the average exposure to local open defecation of children
under five fell by about 14 percentage points, starting from about three-fourths of the av-
erage child’s neighbors. Sanitation coverage also varies substantially within Cambodia over
geographic areas (Robinson, 2007), another dimension of heterogeneity that this paper ex-
ploits. Unsurprisingly given Cambodia’s high rates of open defecation relative to its region,
the sanitation sector has been an important part of development activity in Cambodia,
with attention from the government, NGOs, and other partners. In the period 2005-2010 a
number of sanitation programs were active in Cambodia, mostly following a supply-driven
approach towards sanitation. Unlike in, for example, India, where open defecation is also
extremely widespread but most new rural latrines are subsidized by the government (Alok,
2010), in Cambodia the private sector has historically been playing a significant role in the
provision of the majority of latrines, accounting for almost 80 percent of all latrines built
in the country (Rosenboom et al, 2011, p. 23). Although there has been some diversity of
approach and method across NGO and other programs and over time during this period,
much of the improvement in sanitation that this paper studies reflects new latrines that
were largely invested by households themselves, complemented by some subsidized provision
through development projects.
2 Empirical strategy
Demographic and Health Surveys (DHS) are large, nationally representative surveys con-
ducted in poor and middle-income countries. We use data on the heights of children under
5 years old in the two most recent DHS surveys in Cambodia, conducted in 2005 and 2010.
Our central dependent variable is child height-for-age, which is a z-score of a child’s distance
5

in standard deviations from the average height of healthy children in a reference population
of the same sex and age in months. We compute z-scores using the WHO’s 2006 interna-
tional reference population, and follow their recommendation of omitting children beyond 6
standard deviations from the mean.
Our key independent variable is local area open defecation. Each household is classified
as defecating in the open or not according to its report of where members “usually” defecate
in the DHS questionnaire. However, infectious diseases often involve negative externalities
(Gersovitz and Hammer, 2004), and intestinal disease resulting from open defecation is no
exception: children are exposed to fecal pathogens from neighboring households. Therefore,
we compute, as a measure of “local open defecation,” the fraction of households in a child’s
survey Primary Sampling Unit (PSU) who defecate in the open, a continuous variable from
0 to 1. For comparison as a placebo independent variable and as a control, we similarly
compute the fraction of households in a PSU with electrification, an alternative measure of
local living standards and infrastructure development. Because all households potentially
contribute feces to the environment but not all households have children under 5 years old,
we compute these PSU averages from the DHS household recode. All other variables are
also taken from the DHS, except measures of province mean consumption are from Knowles
(2012) and population density is computed from Cambodian census data.
2.1 Fixed effects identification strategy
Our identification strategy asks whether geographic areas which experienced a decrease over
time in local area open defecation also experienced an increase in child height. Thus, we
apply panel data methods to a pooled dataset of repeated cross sections (Deaton, 1985).
6

The regression we estimate is:
zi`pt = β1local open defecation`pt + β2household open defecationi`pt+
β3local electrification`pt + β4mother’s heighti`pt + β5mother’s BMIi`pt+
Ei`ptθ +Di`ptϑ+Hi`ptφ+ Ai`pt + αp + δt + εi`pt.
(1)
where i indexes individual children, ` is local areas (survey PSUs), p are 38 rural or urban
parts of provinces,2 and t is time. Fixed effects αp and δt are included for geographic and
secular time variation.
The dependent variable z is a child’s height-for-age z score. Local open defecation and
local electrification are fractions 0 to 1 and household open defecation is an indicator, 0 or 1.
Mother’s height and BMI are included to control for heterogeneity in maternal nutrition and
to account for any possible direct effect of mother’s size (Ounsted et al., 1986). Standard
errors are clustered by survey PSU, the level of heterogeneity in the key independent variable;
610 are more than enough for asymptotic clustered standard errors (Cameron et al., 2008).
The fixed effects identification strategy differences out any fixed heterogeneity across
provinces within Cambodia, as well as the secular trend in child height. Controlling for local
electrification serves as both a placebo alternative independent variable and an alternative
control for PSU welfare and infrastructure. We include three further sets of control variables
in stages, in order to demonstrate robustness of our regression specification:
• Ei`pt Household socio-economic controls: household electrification; indicators for own-
ing a radio, TV, and refrigerator; 10 indicators for floor material (an important indica-
tor of disease exposure); 19 indicators for household size; indicators for level of literacy
of the child’s mother; indicators for cooking fuel type; and province-level measures of
average consumption and population density.
2Thus, provinces with both rural and urban data in the DHS have two index numbers within p and theseparts each have their own separate fixed effect; provinces with only rural or urban members have one fixedeffect.
7
• Di`pt Child birth demography controls: 13 indicators for birth order and 11 indicators
for birth month (Doblhammer and Vaupel, 2001).
• Hi`pt Health and healthcare: an indicator for the child having a health and vaccination
card; an indicator for having had an institutional delivery; and indicators for being
breastfed immediately and within the first day.3
Additionally, all specifications include 120 age-in-months times sex dummies Ai`pt to non-
parametrically account for any average difference between Cambodian children and the in-
ternational reference norms (Cummins, 2013).
2.2 Averaging over model uncertainty
We include a wide range of control variables to rule out omitted variable bias as a plausible
explanation for our results. However, many of these controls’ coefficients will not be statis-
tically significantly different from zero, and it is unclear whether they belong in a properly
specified regression. Therefore, after presenting the results from the fully specified equation
(1), we will apply two model averaging techniques (cf. De Luca and Magnus, 2011) which
compute a weighted average over possible models – in this case, models including various
subsets of the auxiliary control variables. In particular, we use Bayesian model averaging
(Leamer, 1978; Raftery et al., 1997), a standard technique in empirical growth economics,
and weighted-average least squares, recently proposed by Magnus et al. (2010).
2.3 Decomposition of change between 2005 and 2010
If open defecation causes child stunting, and if open defecation became less common between
2005 and 2010, then how much of the increase in child height can be statistically accounted
3The DHS does not have a consumption module and detailed information about food consumption isnot available. Moreover, in the particular case of the 2005 to 2010 Cambodian DHS, infant and young childfeeding indicators are not directly comparable across survey rounds, however, according the the official reportfor the 2010 Cambodian DHS, this is unlikely to threaten any bias for our results, because “There has notbeen much improvement in complementary feeding practices since 2005” (ICF Macro, 2011, p. 160).
8

for by the decline in open defecation? In a separate analysis from the fixed effects estimates
of the effect of open defecation, we approach this question with three complementary de-
composition methods in section 5. First, in the course of the regression analysis, we will see
that controlling for open defecation eliminates the statistical importance of an indicator for
survey year. Second, we will implement a standard linear Blinder-Oaxaca decomposition.
Third, will conduct a non-parametric decomposition by computing a counterfactual average
height for children in the 2005 DHS survey, reweighted to match the 2010 distribution of
open defecation.
3 Summary statistics
Children in our sample are almost two standard deviations shorter than the healthy inter-
national reference population, and they live in households that are poor, but standards of
living were detectably improving in Cambodia between 2005 and 2010. Table 1 presents
sample means of the variables used in our analysis. Note that these summary statistics, like
all estimates in this paper, are representative of children under 5 and not of all Cambodians.
The first and second columns show averages for 2005 and 2010, and the third column re-
ports a test that these are different. Over the period we study, the height of children under
5 significantly increased relative to the international reference population while the rates of
open defecation in the locality and by individual households significantly decreased.
3.1 Height is associated with open defecation: Non-parametric
descriptive regressions
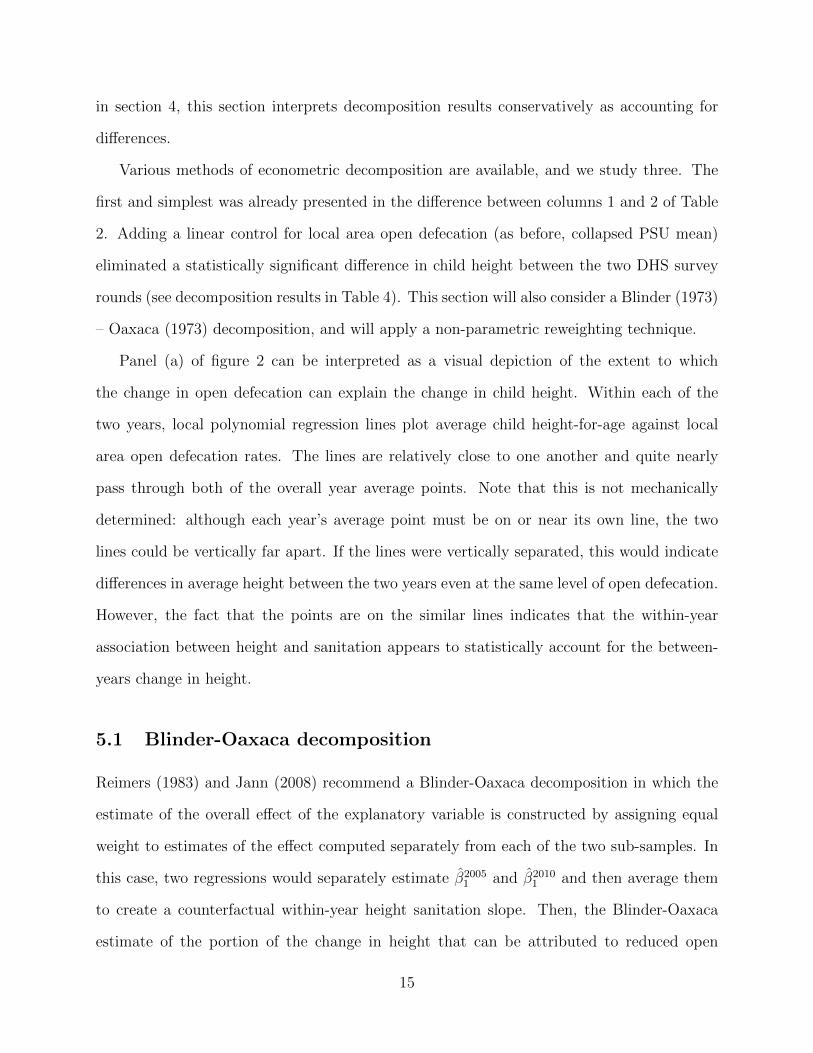
Figure 1 presents non-parametric local regressions that document that child height is associ-
ated with local open defecation. Panel (a) plots child height as a function of age in months,
replicating the well-known fact that most stunting occurs in the first two years of life, with
height-for-age generally flat thereafter. These curves are plotted separately for children who
9

live in local areas where they are exposed to no open defecation (6 percent of children),
where everybody surveyed in their local area defecates in the open (19 percent of children),
and the rest, living in areas with an intermediate sanitation profile. Children in all three
groups are a little more than half of a height-for-age standard deviation too short at birth,
but the lines separate as stunting unfolds over the first two years. Children exposed to the
most open defecation are almost a standard deviation shorter than children exposed to no
open defecation, on average. However, open defecation is not the only cause of child growth
defects: even children exposed to no open defecation are more than a standard deviation
shorter than the reference population.
One reason why children exposed to better sanitation are taller is that they are also
richer; people in poorer households are more likely to defecate in the open. However, open
defecation imposes negative externalities on people who live nearby, and fecal pathogens
in the environment transmit disease to neighboring children. Panel (b) plots average child
height-for-age of children under 5 as a function of local area (PSU) open defecation. House-
holds that do and do not defecate in the open are plotted separately. Unsurprisingly, children
who live in households that dispose of feces safely are taller, on average, than children who
do not. The key feature of the graph, however, is that the line slopes down for both groups.
Whether or not a child’s own household defecates in the open, she is shorter, on average,
if more of her neighbors do. Of course, neither of these curves represents a well-identified
estimate of a causal effect; therefore, the next section proceeds to regression estimates.
4 Changes within provinces: Regression evidence
Did parts of Cambodian provinces where open defecation declined by more from 2005 to
2010 also see the greatest increases in average child height? Figure 2 presents two depictions
of the change over time in sanitation and stunting. Panel (a) plots the association between
height and local area open defecation within each of the two years. The vertical nearness of
10
the two lines suggests that the change in open defecation can statistically account for much
of the change in height, a possibility which will be further explored in section 5.
Panel (b) presents a visual depiction of this section’s fixed effects analysis. In this plot,
each rural or urban region of a province is represented by one of the small lines. Each line
connects one geographic area’s 2005 averages of child height and rate of open defecation to
its 2010 averages. Of the 38 lines, 24 slope down, indicating that the average reduction in
local area open defecation an increase in child height in 24 urban and rural parts of provinces.
As a preliminary non-parametric statistical significance test, a binomial distribution reports
that there is only a 7 percent chance of seeing at least 24 of 38 slope down if these slopes are
independent of one another and if there really were no association, so that each line were
equally likely to slope up or down.
4.1 Regression results
Table 2 reports our main regression results. Panel A shows estimates from OLS regressions
without province part fixed effects, while Panel B displays results from regressions with fixed
effects for urban and rural province parts. The OLS regressions identify the variation both
between and within urban and rural regions of provinces, while the fixed effects regressions
isolate the within-region variation, indicating that the relationship is not merely driven
by coincidental differences between regions. An increase from 0 to 1 in the rate of open
defecation in a child’s locality is linearly associated with a decrease in children’s height by
between 0.43 to 0.84 standard deviations, depending on the estimation strategy and model
used.
Column 1 shows that child height improved from 2005 to 2010 on average using both
estimation strategies. Could the reduction in open defecation account for this overall increase
in average child height? Notably, when we introduce open defecation rates in the locality
in column 2, the 2010 dummy variable becomes insignificant, indicating that sanitation
statistically explains the average change over time. As we progress from column 3 to column
11

7, progressively more controls are added.4
Two conclusions emerge from the table. The first is that the point estimate for open
defecation in the child’s locality stays quite stable as controls are added.5 The stability of
the coefficient on local open defecation despite the wide range of controls suggests that it is
unlikely to be due to omitted variable bias. Measures of maternal anthropometry also do not
diminish the apparent role of sanitation, although measures of maternal size and nutrition
are unsurprisingly themselves robust predictors of child size.6 The clear similarity between
coefficients obtained from the OLS and fixed effects regressions suggests that the results from
the OLS regressions are not a spurious artifact of heterogeneity across regions.7
Second, an important result for policy is that the coefficient on household open defecation
loses statistical significance and falls to zero when other household socio-economic controls
are included in column 4. This is unsurprising for two reasons: richer households are less
likely to defecate in the open, and open defecation – like other sources of infectious disease
– involves important negative externalities.8 This result corroborates this role of negative
4We further tested the stability of the effect of the sanitation environment by including a rough measure ofprovince-level averages of calories consumed per person per day obtained from the Cambodia Socio-EconomicSurveys in 2004 and 2009. Inclusion of this control variable does not materially affect the magnitude ordirection of the open defecation effect. We elected not to include this result due to the geographic coarsenessof the calorie measure.
5The estimate is also consistently highly statistically significant. If instead at clustering at the PSUlevel we cluster at the more conservative level of 38 rural/urban province parts, then the t-statistic on opendefecation in the most controlled specification, column 7 of Panel B, becomes -3.7, although this may be toofew clusters for asymptotic results (Cameron et al., 2008).
6The DHS does not include measures of food or calorie consumption, but overall household food avail-ability would likely be at least partially reflected in mothers’s BMI, controlling for which does not changeour result.
7Fixed effects are well-known to risk attenuation bias, although this appears to be unlikely in this case dueto the small differences between corresponding parts of Panel A and Panel B. Nevertheless, attenuation biasmay also result from the fact that local area open defecation rates are themselves estimates (computed samplemeans), and therefore contain measurement error (Deaton, 1985). To respond to this concern, we instrumentfor the same PSU-level local open defecation independent variable with another measure of the local diseaseenvironment: district-level open defecation. The time and place fixed effects estimate in column 2 of PanelB rises in absolute value from -0.77 without instrumenting to -1.12 (s.e. = 0.32) with instrumenting, or anintermediate point estimate of -0.91 with instrumenting and all of the controls in column 7 of Panel B. Thus,if attenuation bias is indeed a problem here, the true effect of open defecation on child height may be greaterthan we have estimated.
8This finding is also econometrically important as a reminder that statistical approaches which study the“effects” of a child’s own household’s open defecation are likely to both importantly overlook these externaleffects and conflate heterogeneity in wealth. For example, in a recent analysis of child height in Cambodia
12

externalities in the effect of open defecation on child stunting. Because such externalities
are a classic economic rationale for public action, they point to the importance of a policy
response to open defecation.
4.2 Averaging over model uncertainty
After controls are added to the regressions in Table 2, estimates vary from a range of about
0.4 to 0.6 standard deviations linearly associated with a change from 0% to 100% open defe-
cation. The coefficients appear robust, but many of the included controls are not statistically
significant, and it is unclear which estimate is most “correct.” Table 3 presents results from
two approaches to averaging estimates over model uncertainty: Bayesian model averaging
and weighted-average least squares. It would be computationally intractable to include the
full range of controls, so eight representative auxiliary controls are used, creating a space of
512 models over which these algorithms search. The resulting effect estimates are quantita-
tively similar to those in Table 2, suggesting we can be confident in the robustness of these
results.
4.3 A mechanism check: Steeper slope in urban places
The importance of local open defecation, rather than a household’s own open defecation,
indicates a key role for externalities of disease. If so, then because children are more exposed
to others’ fecal pathogens where people live nearer together, we would further expect that
open defecation should have a steeper association with child height in urban areas where
population density is particularly high (Bateman et al., 1993; Bateman and Smith, 1991).
We test this by introducing an interaction between prevalence of open defecation in the
locality and an urban dummy to the specification in column 2 of table 2.
Ikeda et al. (2013) include an indicator for household sanitation as an independent variable, but they omitany measure of local or otherwise geographic sanitation. Unsurprisingly, they find, as we do, that householdopen defecation is not a particularly important predictor of child height after including other measures ofhousehold wealth.
13

Does open defecation indeed havea a steeper association with child height in urban parts
of Cambodia than in rural parts? The fraction of open defecation in the PSU interacts
with an indicator for an urban place, with and without fixed effects: when the rate of open
defecation increases from 0 to 1, the decrease in average child height is between 0.32 and 0.41
standard deviations greater in urban areas than in rural areas. This effect is statistically
significant at the two-sided 10 percent level.9 This finding is consistent with both Spears
(2012a), who finds a greater effect of a widespread government sanitation program in districts
with higher population density, and with Spears (2013) who finds that internationally, open
defecation has a steeper association with child height in urban places and where population
density is greater.
5 Decomposition of the 2005-2010 increase in child
height
How much of the increase in child height between 2005 and 2010 in Cambodia can be ex-
plained by the decrease in local open defecation to which the average child was exposed?
Econometric decompositions ask how much of the difference in an outcome variable across
two groups can be accounted for by observable differences in input variables (Fortin et al.,
2011). Although the canonical use of decomposition in labor economics is to analyze differ-
ences in economic outcomes (such as wages) between two groups of people (such as black and
white people in the U.S.), here we will be asking how much of the difference in child height
in Cambodia between 2005 and 2010 can be accounted for by the difference in the level of
open defecation in a child’s locality. In general, econometric decompositions of observational
data are tools of statistical accounting that may or may not have a causal interpretation
depending on the details of the data and the source of heterogeneity studied. Although we
have already offered evidence of a quantitatively robust effect of sanitation on child height
9The p-value in the OLS regression is 0.062 and the p-value in the fixed effects regression is 0.078.
14
in section 4, this section interprets decomposition results conservatively as accounting for
differences.
Various methods of econometric decomposition are available, and we study three. The
first and simplest was already presented in the difference between columns 1 and 2 of Table
2. Adding a linear control for local area open defecation (as before, collapsed PSU mean)
eliminated a statistically significant difference in child height between the two DHS survey
rounds (see decomposition results in Table 4). This section will also consider a Blinder (1973)
– Oaxaca (1973) decomposition, and will apply a non-parametric reweighting technique.
Panel (a) of figure 2 can be interpreted as a visual depiction of the extent to which
the change in open defecation can explain the change in child height. Within each of the
two years, local polynomial regression lines plot average child height-for-age against local
area open defecation rates. The lines are relatively close to one another and quite nearly
pass through both of the overall year average points. Note that this is not mechanically
determined: although each year’s average point must be on or near its own line, the two
lines could be vertically far apart. If the lines were vertically separated, this would indicate
differences in average height between the two years even at the same level of open defecation.
However, the fact that the points are on the similar lines indicates that the within-year
association between height and sanitation appears to statistically account for the between-
years change in height.
5.1 Blinder-Oaxaca decomposition
Reimers (1983) and Jann (2008) recommend a Blinder-Oaxaca decomposition in which the
estimate of the overall effect of the explanatory variable is constructed by assigning equal
weight to estimates of the effect computed separately from each of the two sub-samples. In
this case, two regressions would separately estimate β20051 and β2010
1 and then average them
to create a counterfactual within-year height sanitation slope. Then, the Blinder-Oaxaca
estimate of the portion of the change in height that can be attributed to reduced open
15

defecation would be:
explained change =(
0.5β20051 + 0.5β2010
1
)×(PSU open defecation
2010 − PSU open defecation2010
).
(2)
As table 4 shows, this approach finds that the reduction in local area open defecation to
which the average child was exposed can linearly explain 0.128 of the 0.129 standard deviation
increase in child height. Thus, 98 percent of the difference in height can be accounted for by
the difference in sanitation..
5.2 Non-parametric re-weighting decomposition
A final, most flexible, decomposition method is non-parametric reweighting.10 This method
creates a counterfactual avreage of 2005 children’s height, reweighted to match the 2010
distribution of open defecation. In particular, the sample is split into 12 bins of PSU open
defecation levels: 10 deciles with extra categories for 0 open defecation and for 1 open
defecation. These are crossed with an indicator for own household open defecation to create
22 overall open defecation bins (22 instead of 24 because there are no children in households
that openly defecate who also live in PSUs where nobody sampled openly defecates, and vice
versa). Then, within each of the 22 bins, the total sample weight is computed separately for
2010 and 2005. Finally, a set of new weights is computed for children in 2005 by multiplying
their sampling weight by the ratio of their bin’s 2010 total sampling weight to their bin’s
2005 total sampling weight.
The result is compared with the other decomposition methods in table 4. The true
sample mean height-for-age was -1.77 in 2005 and was -1.64 in 2010. When the 2005 sample
is reweighted to match the 2010 sanitation distribution, the counterfactual mean height-for-
10Spears (2013) uses this method to estimate the fraction of the India-Africa average height gap that isattributable to open defecation, and Geruso (2012) employs it to estimate the extent to which socio-economicstatus can account for the difference in life expectancy between blacks and whites in the U.S.
16

age is -1.62, essentially the same as the true 2010 average (this difference is not statistically
significant t = 0.41).
Therefore, all three approaches to decomposing the change over time in child height
reach similar conclusions. Using simple pooled regression, a Blinder-Oaxaca decomposition,
or non-parametric re-weighting, the decline in exposure to open defecation can statistically
account for almost all of the approximately 0.13 standard deviation increase in height-for-age.
6 Conclusion
Child height is an important economic variable predicting adult human capital, cognitive
achievement, and health. The average child under 5 in Cambodia was 0.13 standard devia-
tions taller in 2010 than in 2005. This is an important difference: Spears’ (2012b) estimates
of the height-cognitive achievement gradient for Indian children suggest that a 0.13 stan-
dard deviation increase in child height would be associated with a 1 to 4 percentage point
increase in the probability of being able to read words or paragraphs among 8 to 11 year-
olds. Reductions in the amount of open defecation to which the average child exposed are
able to account for much of this difference; increasing open defecation predicts a large and
quantitatively robust decline in Cambodian children’s height.
These results indicate that widespread open defecation could be a critical constraint
for human development. Moreover, we have seen various indicators of the role of negative
externalities in propagating fecal pathogens. Open defecation has decreased, and child height
has increased, but open defecation is still common in Cambodia and the mean child was still
1.6 standard deviations below a healthy height distribution. In any country where this is the
case, spillovers of poor sanitation indicate that reducing open defecation must be a policy
priority.
17

References
Alok, Kumar. 2010. Squatting with Dignity: Lessons from India, New Delhi: Sage.
Bateman, O. Massee and Shelley Smith. 1991. “A comparison of the health effects of
water supply and sanitaiton in urban and rural Guatemala.” WASH Field Report 352,
USAID.
Bateman, O. Massee, Shelley Smith, and Philip Roark. 1993. “A comparison of
the health effects of water supply and sanitaiton in urban and rural areas of five African
countries.” WASH Field Report 398, USAID.
Blinder, Alan S. 1973. “Wage Discrimination: Reduced Form and Structural Estimates.”
Journal of Human Resources, 8: 436455.
Cameron, A. Colin, Jonah B. Gelbach, and Douglas L. Miller. 2008. “Bootstrap-
Based Improvements for Inference with Clustered Errors.” The Review of Economics and
Statistics, 90(3): 414–427.
Cameron, Lisa, Manisha Shah, and Susan Olivia. 2013. “Impact Evaluation of a
Large-Scale Rural Sanitation Project in Indonesia.” Policy Research Working Paper 6360,
World Bank.
Case, Anne and Christina Paxson. 2008. “Stature and Status: Height, Ability, and
Labor Market Outcomes.” Journal of Political Economy, 116(3): 499–532.
Checkley, William, Gillian Buckley, Robert H Gilman, Ana MO Assis, Richard L
Guerrant, Saul S Morris, Kare Mølbak, Palle Valentiner-Branth, Claudio F
Lanata, Robert E Black, and The Childhood Malnutrition and Infection Net-
work. 2008. “Multi-country analysis of the effects of diarrhoea on childhood stunting.”
International Journal of Epidemiology, 37: 816–830.
Cummins, Joseph R. 2013. “On the Use and Misuse of Child Height-for-Age Z-score in
the Demographic and Health Surveys.” working paper, University of California, Davis.
Currie, Janet. 2009. “Healthy, Wealthy, and Wise: Socioeconomic Status, Poor Health
18

in Childhood, and Human Capital Development.” Journal of Economic Literature, 47(1):
87–122.
De Luca, Giuseppe and Jan R Magnus. 2011. “Bayesian model averaging and weighted-
average least squares: Equivariance, stability, and numerical issues.” The Stata Journal,
11(4): 518–544.
Deaton, Angus. 1985. “Panel data from time series of cross-sections.” Journal of Econo-
metrics, 30: 109–126.
Doblhammer, Gabriele and James W. Vaupel. 2001. “Lifespan depends on month of
birth.” PNAS, 98(5): 2934–2939.
Fortin, Nicole, Thomas Lemieux, and Sergio Firpo. 2011. “Decomposition Methods
in Economics.” Handbook of Labor Economics, 4a: 1–102.
Gersovitz, Mark and Jeffrey S Hammer. 2004. “The Economical Control of Infectious
Diseases.” Economic Journal, 114(492): 1–27.
Geruso, Michael. 2012. “Black-White Disparities in Life Expectancy: How Much Can the
Standard SES Variables Explain?” Demography, 49(2): 553–574.
Hammer, Jeffrey and Dean Spears. 2013. “Village sanitation and children’s human
capital: Evidence from a randomized experiment by the Maharashtra government.” policy
reasearch working paper, World Bank.
Humphrey, Jean H. 2009. “Child undernutrition, tropical enteropathy, toilets, and hand-
washing.” The Lancet, 374: 1032 – 35.
ICF Macro. 2011. Cambodia Demographic and Health Survey 2010: National Institute of
Statistics, Directorate General for Health, and ICF Macro.
Ikeda, Nayu, Yuki Irie, and Kenji Shibuya. 2013. “Determinants of reduced child stunt-
ing in Cambodia: analysis of pooled data from three Demographic and Health Surveys.”
Bulletin of the World Health Organization, 91: 341–349.
Jann, Ben. 2008. “A Stata implementation of the Blinder-Oaxaca decomposition.” Stata
Journal, 8(4): 453–479.
19

Joint Monitoring Programme for Water Supply and Sanitation. 2013. Progress on
Drinking Water and Sanitation: 2013 Update: WHO and UNICEF.
Knowles, James C. 2012. Poverty Profile for Cambodia 2009: World Bank.
Kosek, Margaret, et al., and the MAL-ED network. 2013. “Fecal Markers of Intestinal
Inflammation and Permeability Associated with the Subsequent Acquisition of Linear
Growth Deficits in Infants.” American Journal of Tropical Medicine and Hygiene, 88(2):
390–396.
Leamer, Edward E. 1978. Specification Searches: Ad Hoc Inference with Nonexperimental
Data: Wiley.
Lin, Audrie, Benjamin F. Arnold, Sadia Afreen, Rie Goto, Tarique Moham-
mad Nurul Huda, Rashidul Haque, Rubhana Raqib, Leanne Unicomb, Tah-
meed Ahmed, John M. Colford Jr., and Stephen P Luby. 2013. “Household En-
vironmental Conditions Are Associated with Enteropathy and Impaired Growth in Rural
Bangladesh.” American Journal of Tropical Medicine and Hygiene.
Magnus, Jan R., Owen Powell, and Patricia Prufer. 2010. “A comparison of two model
averaging techniques with an application to growth empirics.” Journal of Econometrics,
154: 139–153.
Martorell, Reynaldo, Charles Yarbrough, Aaron Lechtig, Hernan Delgado, and
Robert E. Klein. 1977. “Genetic-environmental interactions in physical growth.” Acta
Pædiatr Scand, 66: 579–584.
Oaxaca, Ronald. 1973. “Male-Female Wage Differentials in Urban Labor Markets.” Inter-
national Economic Review, 14: 693709.
Ounsted, M., S. Scott, and C. Ounsted. 1986. “Transmission through the female line of
a mechanism constraining human fetal growth.” Annals of Human Biology, 13(2): 143–151.
Raftery, Adrian E., David Madigana, and Jennifer A Hoeting. 1997. “Bayesian
Model Averaging for Linear Regression Models.” Journal of the American Statistical As-
sociation, 92(437): 179–191.
20
Reimers, Cordelia W.. 1983. “Labor Market Discrimination Against Hispanic and Black
Men.” Review of Economics and Statistics, 65(4): 570–579.
Robinson, A. 2007. Rural Sanitation and Hygiene in Cambodia: The way forward?: World
Bank Water and Sanitation Program.
Rosenboom, Jan Willem, Cordell Jacks, Phyrum Kov, Michael Roberts, and
Tamara Baker. 2011. “Sanitation marketing in Cambodia.” Waterlines, 30(1).
Spears, Dean. 2012a. “Effects of Rural Sanitation on Infant Mortality and Human Capital:
Evidence from a Local Governance Incentive in India.” working paper, Princeton.
2012b. “Height and Cognitive Achievement among Indian Children.” Economics
and Human Biology, 10: 210–219.
2013. “How much international variation in child height can sanitation explain?”
Policy Research Working Paper 6351, World Bank.
Vogl, Tom. 2011. “Height, Skills, and Labor Market Outcomes in Mexico.” Working Paper.
World Bank. 2008. Environmental Health and Child Survival: Epidemiology, Economics,
Experiences: World Bank.
forthcoming. Where Have All The Poor Gone? Cambodia Poverty Assessment 2013:
World Bank.
21

(a) stunting unfolds in the first two years of life, depending on the disease environment
-2.5
-2-1
.5-1
-.5
heig
ht-f
or-a
ge
0 20 40 60age in months
0% local open defecation between 0% and 100%100% local open defecation
(b) negative externalities:neighbors’ open defecation matters for households with and without sanitation
-1.8
-1.6
-1.4
-1.2
heig
ht-f
or-a
ge z
-sco
re
0 .2 .4 .6 .8 1open defecation in child's locality
household does not openly defecate household does
Figure 1: Open defecation predicts child heightBoth panels present local non-parametric regressions.
22

(a) differences within and across years in height and sanitation
201020102010201020102010201020102010201020102010201020102010201020102010201020102010201020102010201020102010201020102010201020102010201020102010201020102010201020102010201020102010201020102010201020102010201020102010201020102010201020102010201020102010201020102010201020102010201020102010201020102010201020102010201020102010201020102010201020102010201020102010201020102010201020102010201020102010201020102010201020102010201020102010201020102010201020102010201020102010201020102010201020102010201020102010201020102010201020102010201020102010201020102010201020102010201020102010201020102010201020102010201020102010201020102010201020102010201020102010201020102010201020102010201020102010201020102010201020102010201020102010201020102010201020102010201020102010201020102010201020102010201020102010201020102010201020102010201020102010201020102010201020102010201020102010201020102010201020102010201020102010201020102010201020102010201020102010201020102010201020102010201020102010201020102010201020102010201020102010201020102010201020102010201020102010201020102010201020102010201020102010201020102010201020102010201020102010201020102010201020102010201020102010201020102010201020102010201020102010201020102010201020102010201020102010201020102010201020102010201020102010201020102010201020102010201020102010201020102010201020102010201020102010201020102010201020102010201020102010201020102010201020102010201020102010201020102010201020102010201020102010201020102010201020102010201020102010201020102010201020102010201020102010201020102010201020102010201020102010201020102010201020102010201020102010201020102010201020102010201020102010201020102010201020102010201020102010201020102010201020102010201020102010201020102010201020102010201020102010201020102010201020102010201020102010201020102010201020102010201020102010201020102010201020102010201020102010201020102010201020102010201020102010201020102010201020102010201020102010201020102010201020102010201020102010201020102010201020102010201020102010201020102010201020102010201020102010201020102010201020102010201020102010201020102010201020102010201020102010201020102010201020102010201020102010201020102010201020102010201020102010201020102010201020102010201020102010201020102010201020102010201020102010201020102010201020102010201020102010201020102010201020102010201020102010201020102010201020102010201020102010201020102010201020102010201020102010201020102010201020102010201020102010201020102010201020102010201020102010201020102010201020102010201020102010201020102010201020102010201020102010201020102010201020102010201020102010201020102010201020102010201020102010201020102010201020102010201020102010201020102010201020102010201020102010201020102010201020102010201020102010201020102010201020102010201020102010201020102010201020102010201020102010201020102010201020102010201020102010201020102010201020102010201020102010201020102010201020102010201020102010201020102010201020102010201020102010201020102010201020102010201020102010201020102010201020102010201020102010201020102010201020102010201020102010201020102010201020102010201020102010201020102010201020102010201020102010201020102010201020102010201020102010201020102010201020102010201020102010201020102010201020102010201020102010201020102010201020102010201020102010201020102010201020102010201020102010201020102010201020102010201020102010201020102010201020102010201020102010201020102010201020102010201020102010201020102010201020102010201020102010201020102010201020102010201020102010201020102010201020102010201020102010201020102010201020102010201020102010201020102010201020102010201020102010201020102010201020102010201020102010201020102010201020102010201020102010201020102010201020102010201020102010201020102010201020102010201020102010201020102010201020102010201020102010201020102010201020102010201020102010201020102010201020102010201020102010201020102010201020102010201020102010201020102010201020102010201020102010201020102010201020102010201020102010201020102010201020102010201020102010201020102010201020102010201020102010201020102010201020102010201020102010201020102010201020102010201020102010201020102010201020102010201020102010201020102010201020102010201020102010201020102010201020102010201020102010201020102010201020102010201020102010201020102010201020102010201020102010201020102010201020102010201020102010201020102010201020102010201020102010201020102010201020102010201020102010201020102010201020102010201020102010201020102010201020102010201020102010201020102010201020102010201020102010201020102010201020102010201020102010201020102010201020102010201020102010201020102010201020102010201020102010201020102010201020102010201020102010201020102010201020102010201020102010201020102010201020102010201020102010201020102010201020102010201020102010201020102010201020102010201020102010201020102010201020102010201020102010201020102010201020102010201020102010201020102010201020102010201020102010201020102010201020102010201020102010201020102010201020102010201020102010201020102010201020102010201020102010201020102010201020102010201020102010201020102010201020102010201020102010201020102010201020102010201020102010201020102010201020102010201020102010201020102010201020102010201020102010201020102010201020102010201020102010201020102010201020102010201020102010201020102010201020102010201020102010201020102010201020102010201020102010201020102010201020102010201020102010201020102010201020102010201020102010201020102010201020102010201020102010201020102010201020102010201020102010201020102010201020102010201020102010201020102010201020102010201020102010201020102010201020102010201020102010201020102010201020102010201020102010201020102010201020102010201020102010201020102010201020102010201020102010201020102010201020102010201020102010201020102010201020102010201020102010201020102010201020102010201020102010201020102010201020102010201020102010201020102010201020102010201020102010201020102010201020102010201020102010201020102010201020102010201020102010201020102010201020102010201020102010201020102010201020102010201020102010201020102010201020102010201020102010201020102010201020102010201020102010201020102010201020102010201020102010201020102010201020102010201020102010201020102010201020102010201020102010201020102010201020102010201020102010201020102010201020102010201020102010201020102010201020102010201020102010201020102010201020102010201020102010201020102010201020102010201020102010201020102010201020102010201020102010201020102010201020102010201020102010201020102010201020102010201020102010201020102010201020102010201020102010201020102010201020102010201020102010201020102010201020102010201020102010201020102010201020102010201020102010201020102010201020102010201020102010201020102010201020102010201020102010201020102010201020102010201020102010201020102010201020102010201020102010201020102010201020102010201020102010201020102010201020102010201020102010201020102010201020102010201020102010201020102010201020102010201020102010201020102010201020102010201020102010201020102010201020102010201020102010201020102010201020102010201020102010201020102010201020102010201020102010201020102010201020102010201020102010201020102010201020102010201020102010201020102010201020102010201020102010201020102010201020102010201020102010201020102010201020102010201020102010201020102010201020102010201020102010201020102010201020102010201020102010201020102010201020102010201020102010201020102010201020102010201020102010201020102010201020102010201020102010201020102010201020102010201020102010201020102010201020102010201020102010201020102010201020102010201020102010201020102010201020102010201020102010201020102010201020102010201020102010201020102010201020102010201020102010201020102010201020102010201020102010201020102010201020102010201020102010201020102010201020102010201020102010201020102010201020102010201020102010201020102010201020102010201020102010201020102010201020102010201020102010201020102010201020102010201020102010201020102010201020102010201020102010201020102010201020102010201020102010201020102010201020102010201020102010201020102010201020102010201020102010201020102010201020102010201020102010201020102010201020102010201020102010201020102010201020102010201020102010201020102010201020102010201020102010201020102010201020102010201020102010201020102010201020102010201020102010201020102010201020102010201020102010201020102010201020102010201020102010201020102010201020102010201020102010201020102010201020102010201020102010201020102010201020102010201020102010201020102010201020102010201020102010201020102010201020102010201020102010201020102010201020102010201020102010201020102010201020102010201020102010201020102010201020102010201020102010201020102010201020102010201020102010201020102010201020102010201020102010201020102010201020102010201020102010201020102010201020102010201020102010201020102010201020102010201020102010201020102010201020102010201020102010201020102010201020102010201020102010201020102010201020102010201020102010201020102010201020102010201020102010201020102010201020102010201020102010201020102010201020102010201020102010201020102010201020102010201020102010201020102010201020102010201020102010201020102010201020102010201020102010201020102010201020102010201020102010201020102010201020102010201020102010201020102010201020102010201020102010201020102010201020102010201020102010201020102010201020102010201020102010201020102010201020102010201020102010201020102010201020102010201020102010201020102010201020102010201020102010201020102010201020102010201020102010201020102010201020102010201020102010201020102010201020102010201020102010201020102010201020102010201020102010201020102010201020102010201020102010201020102010201020102010201020102010201020102010201020102010201020102010201020102010201020102010201020102010201020102010201020102010201020102010201020102010201020102010201020102010201020102010201020102010201020102010201020102010201020102010201020102010201020102010201020102010201020102010201020102010201020102010201020102010201020102010201020102010201020102010201020102010201020102010201020102010201020102010201020102010201020102010201020102010201020102010201020102010201020102010201020102010201020102010201020102010201020102010201020102010201020102010201020102010201020102010201020102010201020102010201020102010201020102010201020102010201020102010201020102010201020102010201020102010201020102010201020102010201020102010201020102010201020102010201020102010201020102010201020102010201020102010201020102010201020102010201020102010201020102010201020102010201020102010201020102010201020102010201020102010201020102010201020102010201020102010201020102010201020102010201020102010201020102010201020102010201020102010201020102010201020102010201020102010201020102010201020102010201020102010201020102010201020102010201020102010201020102010201020102010201020102010201020102010201020102010201020102010201020102010201020102010201020102010201020102010201020102010201020102010201020102010201020102010201020102010201020102010201020102010201020102010201020102010201020102010201020102010201020102010201020102010201020102010201020102010201020102010201020102010201020102010201020102010201020102010201020102010201020102010201020102010201020102010201020102010201020102010201020102010201020102010201020102010201020102010201020102010201020102010201020102010201020102010201020102010201020102010201020102010201020102010201020102010201020102010201020102010201020102010201020102010201020102010201020102010201020102010201020102010201020102010201020102010201020102010201020102010201020102010201020102010201020102010201020102010201020102010201020102010201020102010201020102010201020102010201020102010201020102010201020102010201020102010201020102010201020102010201020102010201020102010201020102010201020102010201020102010201020102010201020102010201020102010201020102010201020102010201020102010201020102010201020102010201020102010201020102010201020102010201020102010201020102010201020102010201020102010201020102010201020102010201020102010201020102010201020102010201020102010201020102010201020102010201020102010201020102010201020102010201020102010201020102010201020102010201020102010201020102010201020102010201020102010201020102010201020102010201020102010201020102010201020102010201020102010201020102010201020102010201020102010201020102010201020102010201020102010201020102010201020102010201020102010201020102010201020102010201020102010201020102010201020102010201020102010201020102010201020102010201020102010201020102010201020102010201020102010201020102010201020102010201020102010201020102010201020102010201020102010201020102010201020102010201020102010201020102010201020102010201020102010201020102010201020102010201020102010201020102010201020102010201020102010201020102010201020102010201020102010201020102010201020102010201020102010201020102010201020102010201020102010201020102010201020102010201020102010201020102010201020102010201020102010201020102010201020102010201020102010201020102010201020102010201020102010201020102010201020102010201020102010201020102010201020102010201020102010201020102010201020102010201020102010201020102010201020102010201020102010201020102010201020102010201020102010201020102010201020102010201020102010201020102010201020102010201020102010201020102010201020102010201020102010201020102010201020102010201020102010201020102010201020102010201020102010201020102010201020102010201020102010201020102010201020102010201020102010201020102010201020102010201020102010201020102010201020102010201020102010201020102010201020102010201020102010201020102010201020102010201020102010201020102010201020102010201020102010201020102010201020102010201020102010201020102010201020102010201020102010201020102010201020102010201020102010201020102010201020102010201020102010201020102010201020102010201020102010201020102010201020102010201020102010201020102010201020102010201020102010201020102010201020102010201020102010201020102010201020102010201020102010201020102010201020102010201020102010201020102010201020102010201020102010201020102010201020102010201020102010201020102010201020102010201020102010201020102010201020102010201020102010201020102010201020102010201020102010201020102010201020102010201020102010201020102010201020102010201020102010201020102010201020102010201020102010201020102010201020102010201020102010201020102010201020102010201020102010201020102010201020102010201020102010201020102010201020102010201020102010201020102010201020102010201020102010201020102010201020102010201020102010201020102010201020102010201020102010201020102010201020102010201020102010201020102010201020102010201020102010201020102010201020102010201020102010201020102010201020102010201020102010201020102010201020102010201020102010201020102010201020102010201020102010201020102010201020102010201020102010201020102010201020102010201020102010201020102010201020102010201020102010201020102010201020102010201020102010201020102010201020102010201020102010201020102010201020102010201020102010201020102010201020102010201020102010201020102010201020102010201020102010201020102010201020102010201020102010201020102010201020102010201020102010201020102010201020102010201020102010201020102010201020102010201020102010201020102010201020102010201020102010201020102010201020102010201020102010201020102010201020102010201020102010201020102010201020102010201020102010201020102010201020102010201020102010201020102010201020102010201020102010201020102010201020102010201020102010201020102010201020102010201020102010201020102010201020102010201020102010201020102010201020102010201020102010201020102010201020102010201020102010201020102010201020102010201020102010201020102010201020102010201020102010201020102010201020102010201020102010201020102010201020102010201020102010201020102010201020102010201020102010
2005200520052005200520052005200520052005200520052005200520052005200520052005200520052005200520052005200520052005200520052005200520052005200520052005200520052005200520052005200520052005200520052005200520052005200520052005200520052005200520052005200520052005200520052005200520052005200520052005200520052005200520052005200520052005200520052005200520052005200520052005200520052005200520052005200520052005200520052005200520052005200520052005200520052005200520052005200520052005200520052005200520052005200520052005200520052005200520052005200520052005200520052005200520052005200520052005200520052005200520052005200520052005200520052005200520052005200520052005200520052005200520052005200520052005200520052005200520052005200520052005200520052005200520052005200520052005200520052005200520052005200520052005200520052005200520052005200520052005200520052005200520052005200520052005200520052005200520052005200520052005200520052005200520052005200520052005200520052005200520052005200520052005200520052005200520052005200520052005200520052005200520052005200520052005200520052005200520052005200520052005200520052005200520052005200520052005200520052005200520052005200520052005200520052005200520052005200520052005200520052005200520052005200520052005200520052005200520052005200520052005200520052005200520052005200520052005200520052005200520052005200520052005200520052005200520052005200520052005200520052005200520052005200520052005200520052005200520052005200520052005200520052005200520052005200520052005200520052005200520052005200520052005200520052005200520052005200520052005200520052005200520052005200520052005200520052005200520052005200520052005200520052005200520052005200520052005200520052005200520052005200520052005200520052005200520052005200520052005200520052005200520052005200520052005200520052005200520052005200520052005200520052005200520052005200520052005200520052005200520052005200520052005200520052005200520052005200520052005200520052005200520052005200520052005200520052005200520052005200520052005200520052005200520052005200520052005200520052005200520052005200520052005200520052005200520052005200520052005200520052005200520052005200520052005200520052005200520052005200520052005200520052005200520052005200520052005200520052005200520052005200520052005200520052005200520052005200520052005200520052005200520052005200520052005200520052005200520052005200520052005200520052005200520052005200520052005200520052005200520052005200520052005200520052005200520052005200520052005200520052005200520052005200520052005200520052005200520052005200520052005200520052005200520052005200520052005200520052005200520052005200520052005200520052005200520052005200520052005200520052005200520052005200520052005200520052005200520052005200520052005200520052005200520052005200520052005200520052005200520052005200520052005200520052005200520052005200520052005200520052005200520052005200520052005200520052005200520052005200520052005200520052005200520052005200520052005200520052005200520052005200520052005200520052005200520052005200520052005200520052005200520052005200520052005200520052005200520052005200520052005200520052005200520052005200520052005200520052005200520052005200520052005200520052005200520052005200520052005200520052005200520052005200520052005200520052005200520052005200520052005200520052005200520052005200520052005200520052005200520052005200520052005200520052005200520052005200520052005200520052005200520052005200520052005200520052005200520052005200520052005200520052005200520052005200520052005200520052005200520052005200520052005200520052005200520052005200520052005200520052005200520052005200520052005200520052005200520052005200520052005200520052005200520052005200520052005200520052005200520052005200520052005200520052005200520052005200520052005200520052005200520052005200520052005200520052005200520052005200520052005200520052005200520052005200520052005200520052005200520052005200520052005200520052005200520052005200520052005200520052005200520052005200520052005200520052005200520052005200520052005200520052005200520052005200520052005200520052005200520052005200520052005200520052005200520052005200520052005200520052005200520052005200520052005200520052005200520052005200520052005200520052005200520052005200520052005200520052005200520052005200520052005200520052005200520052005200520052005200520052005200520052005200520052005200520052005200520052005200520052005200520052005200520052005200520052005200520052005200520052005200520052005200520052005200520052005200520052005200520052005200520052005200520052005200520052005200520052005200520052005200520052005200520052005200520052005200520052005200520052005200520052005200520052005200520052005200520052005200520052005200520052005200520052005200520052005200520052005200520052005200520052005200520052005200520052005200520052005200520052005200520052005200520052005200520052005200520052005200520052005200520052005200520052005200520052005200520052005200520052005200520052005200520052005200520052005200520052005200520052005200520052005200520052005200520052005200520052005200520052005200520052005200520052005200520052005200520052005200520052005200520052005200520052005200520052005200520052005200520052005200520052005200520052005200520052005200520052005200520052005200520052005200520052005200520052005200520052005200520052005200520052005200520052005200520052005200520052005200520052005200520052005200520052005200520052005200520052005200520052005200520052005200520052005200520052005200520052005200520052005200520052005200520052005200520052005200520052005200520052005200520052005200520052005200520052005200520052005200520052005200520052005200520052005200520052005200520052005200520052005200520052005200520052005200520052005200520052005200520052005200520052005200520052005200520052005200520052005200520052005200520052005200520052005200520052005200520052005200520052005200520052005200520052005200520052005200520052005200520052005200520052005200520052005200520052005200520052005200520052005200520052005200520052005200520052005200520052005200520052005200520052005200520052005200520052005200520052005200520052005200520052005200520052005200520052005200520052005200520052005200520052005200520052005200520052005200520052005200520052005200520052005200520052005200520052005200520052005200520052005200520052005200520052005200520052005200520052005200520052005200520052005200520052005200520052005200520052005200520052005200520052005200520052005200520052005200520052005200520052005200520052005200520052005200520052005200520052005200520052005200520052005200520052005200520052005200520052005200520052005200520052005200520052005200520052005200520052005200520052005200520052005200520052005200520052005200520052005200520052005200520052005200520052005200520052005200520052005200520052005200520052005200520052005200520052005200520052005200520052005200520052005200520052005200520052005200520052005200520052005200520052005200520052005200520052005200520052005200520052005200520052005200520052005200520052005200520052005200520052005200520052005200520052005200520052005200520052005200520052005200520052005200520052005200520052005200520052005200520052005200520052005200520052005200520052005200520052005200520052005200520052005200520052005200520052005200520052005200520052005200520052005200520052005200520052005200520052005200520052005200520052005200520052005200520052005200520052005200520052005200520052005200520052005200520052005200520052005200520052005200520052005200520052005200520052005200520052005200520052005200520052005200520052005200520052005200520052005200520052005200520052005200520052005200520052005200520052005200520052005200520052005200520052005200520052005200520052005200520052005200520052005200520052005200520052005200520052005200520052005200520052005200520052005200520052005200520052005200520052005200520052005200520052005200520052005200520052005200520052005200520052005200520052005200520052005200520052005200520052005200520052005200520052005200520052005200520052005200520052005200520052005200520052005200520052005200520052005200520052005200520052005200520052005200520052005200520052005200520052005200520052005200520052005200520052005200520052005200520052005200520052005200520052005200520052005200520052005200520052005200520052005200520052005200520052005200520052005200520052005200520052005200520052005200520052005200520052005200520052005200520052005200520052005200520052005200520052005200520052005200520052005200520052005200520052005200520052005200520052005200520052005200520052005200520052005200520052005200520052005200520052005200520052005200520052005200520052005200520052005200520052005200520052005200520052005200520052005200520052005200520052005200520052005200520052005200520052005200520052005200520052005200520052005200520052005200520052005200520052005200520052005200520052005200520052005200520052005200520052005200520052005200520052005200520052005200520052005200520052005200520052005200520052005200520052005200520052005200520052005200520052005200520052005200520052005200520052005200520052005200520052005200520052005200520052005200520052005200520052005200520052005200520052005200520052005200520052005200520052005200520052005200520052005200520052005200520052005200520052005200520052005200520052005200520052005200520052005200520052005200520052005200520052005200520052005200520052005200520052005200520052005200520052005200520052005200520052005200520052005200520052005200520052005200520052005200520052005200520052005200520052005200520052005200520052005200520052005200520052005200520052005200520052005200520052005200520052005200520052005200520052005200520052005200520052005200520052005200520052005200520052005200520052005200520052005200520052005200520052005200520052005200520052005200520052005200520052005200520052005200520052005200520052005200520052005200520052005200520052005200520052005200520052005200520052005200520052005200520052005200520052005200520052005200520052005200520052005200520052005200520052005200520052005200520052005200520052005200520052005200520052005200520052005200520052005200520052005200520052005200520052005200520052005200520052005200520052005200520052005200520052005200520052005200520052005200520052005200520052005200520052005200520052005200520052005200520052005200520052005200520052005200520052005200520052005200520052005200520052005200520052005200520052005200520052005200520052005200520052005200520052005200520052005200520052005200520052005200520052005200520052005200520052005200520052005200520052005200520052005200520052005200520052005200520052005200520052005200520052005200520052005200520052005200520052005200520052005200520052005200520052005200520052005200520052005200520052005200520052005200520052005200520052005200520052005200520052005200520052005200520052005200520052005200520052005200520052005200520052005200520052005200520052005200520052005200520052005200520052005200520052005200520052005200520052005200520052005200520052005200520052005200520052005200520052005200520052005200520052005200520052005200520052005200520052005200520052005200520052005200520052005200520052005200520052005200520052005200520052005200520052005200520052005200520052005200520052005200520052005200520052005200520052005200520052005200520052005200520052005200520052005200520052005200520052005200520052005200520052005200520052005200520052005200520052005200520052005200520052005200520052005200520052005200520052005200520052005200520052005200520052005200520052005200520052005200520052005200520052005200520052005200520052005200520052005200520052005200520052005200520052005200520052005200520052005200520052005200520052005200520052005200520052005200520052005200520052005200520052005200520052005200520052005200520052005200520052005200520052005200520052005200520052005200520052005200520052005200520052005200520052005200520052005200520052005200520052005200520052005200520052005200520052005200520052005200520052005200520052005200520052005200520052005200520052005200520052005200520052005200520052005200520052005200520052005200520052005200520052005200520052005200520052005200520052005200520052005200520052005200520052005200520052005200520052005200520052005200520052005200520052005200520052005200520052005200520052005200520052005200520052005200520052005200520052005200520052005200520052005200520052005200520052005200520052005200520052005200520052005200520052005200520052005200520052005200520052005200520052005200520052005200520052005200520052005200520052005200520052005200520052005200520052005200520052005200520052005200520052005200520052005200520052005200520052005200520052005200520052005200520052005200520052005200520052005200520052005200520052005200520052005200520052005200520052005200520052005200520052005200520052005200520052005200520052005200520052005200520052005200520052005200520052005200520052005200520052005200520052005200520052005200520052005200520052005200520052005200520052005200520052005200520052005200520052005200520052005200520052005200520052005200520052005200520052005200520052005200520052005200520052005200520052005200520052005200520052005200520052005200520052005200520052005200520052005200520052005200520052005200520052005200520052005200520052005200520052005200520052005200520052005200520052005200520052005200520052005200520052005200520052005200520052005200520052005200520052005200520052005200520052005200520052005200520052005200520052005200520052005200520052005200520052005200520052005200520052005200520052005200520052005200520052005200520052005200520052005200520052005200520052005200520052005200520052005200520052005200520052005200520052005200520052005200520052005200520052005200520052005200520052005200520052005200520052005200520052005200520052005200520052005200520052005200520052005200520052005200520052005200520052005200520052005200520052005200520052005200520052005200520052005200520052005200520052005200520052005200520052005200520052005200520052005200520052005200520052005200520052005200520052005200520052005200520052005200520052005200520052005200520052005200520052005200520052005200520052005200520052005200520052005200520052005200520052005200520052005200520052005200520052005200520052005200520052005200520052005200520052005200520052005200520052005200520052005200520052005200520052005200520052005200520052005200520052005200520052005200520052005200520052005200520052005200520052005200520052005200520052005200520052005200520052005200520052005200520052005200520052005200520052005200520052005200520052005200520052005200520052005200520052005200520052005200520052005200520052005200520052005200520052005200520052005200520052005200520052005200520052005200520052005200520052005200520052005200520052005200520052005200520052005200520052005200520052005200520052005200520052005200520052005200520052005200520052005200520052005200520052005200520052005200520052005200520052005200520052005200520052005200520052005200520052005200520052005200520052005200520052005200520052005200520052005200520052005200520052005200520052005200520052005200520052005200520052005200520052005200520052005200520052005200520052005200520052005200520052005200520052005200520052005200520052005200520052005200520052005200520052005200520052005200520052005200520052005200520052005200520052005200520052005200520052005200520052005200520052005200520052005200520052005200520052005200520052005200520052005200520052005200520052005200520052005200520052005200520052005200520052005200520052005200520052005200520052005200520052005200520052005
-2-1
.8-1
.6-1
.4-1
.2-1
heig
ht-f
or-a
ge z
-sco
re
0 .2 .4 .6 .8 1open defecation in child's locality
2010 2005year averages
(b) decrease in open defecation and increase in height, by rural-urban province part
-2.5
-2-1
.5-1
heig
ht-f
or-a
ge z
-sco
re
0 .2 .4 .6 .8 1open defecation in child's locality
rural urban
Figure 2: Change over time in open defecation and child height, 2005-2010Panel (a) presents Cambodia-wide local non-parametric regressions by year, along with collapsed year
averages. In panel (b), for each rural or urban part of a province, its 2005 (open defecation, child height)
point is connected with its 2010 point, to depict change over time within provinces.23

Table 1: Summary statistics: Improvements in height, sanitation, and living standards
2005 2010 t-statistic 2005 = 2010height-for-age z-score -1.77 -1.64 2.65
(0.04) (0.03)open defecation in child’s locality 0.75 0.61 -6.27
(0.02) (0.02)household open defecation 0.78 0.65 -5.65
(0.02) (0.02)urban residence 0.14 0.16 0.76
(0.02) (0.02)consumption 3756 5148 12.38
(81) (78)local electrification 0.19 0.29 3.98
(0.02) (0.02)mother’s height 152.62 152.79 0.91
(0.13) (0.14)mother’s BMI 20.84 20.98 1.39
(0.07) (0.07)
n (children under 5) 3,587 3,699Table presents sample means, with standard errors in parentheses computed to reflect survey design. Note
that this table is representative of children under 5 and not of all Cambodians.
24

Table 2: Regression results: Open defecation in the child’s locality predicts child height
(1) (2) (3) (4) (5) (6) (7)Panel A: Without rural and urban province part fixed effectsopen defecation -0.838*** -0.675*** -0.578*** -0.475*** -0.500*** -0.462***
in child’s locality (0.0748) (0.146) (0.131) (0.126) (0.116) (0.113)year 2010 0.129*** 0.0124 0.0214 0.0322 0.0721 0.0464 -0.00410
(0.0488) (0.0474) (0.0471) (0.0447) (0.0516) (0.0480) (0.0490)household open -0.144** -0.116** 0.00411 0.0404 0.0449
defecation (0.0627) (0.0582) (0.0594) (0.0577) (0.0573)electrification in 0.0199 0.0389 -0.0922 -0.0739 -0.0858
child’s locality (0.108) (0.0988) (0.137) (0.129) (0.128)urban 0.00186 -0.000237 -0.0529 -0.0620 -0.0502
(0.0735) (0.0684) (0.0653) (0.0637) (0.0631)mother’s height 0.0568*** 0.0553*** 0.0567*** 0.0564***
(0.00364) (0.00356) (0.00341) (0.00341)mother’s BMI 0.0233*** 0.0209** 0.0259*** 0.0249***
(0.00686) (0.00693) (0.00681) (0.00686)household controls X X Xchild demography X Xhealth controls Xn (children under 5) 7,286 7,286 7,184 7,168 7,168 7,168 7,168
Panel B: With rural and urban province part fixed effectsopen defecation -0.771*** -0.587*** -0.501*** -0.444*** -0.469*** -0.432***
in child’s locality (0.0973) (0.142) (0.128) (0.128) (0.120) (0.117)year 2010 0.118** 0.00966 0.0164 0.0287 0.291 0.232 0.159
(0.0463) (0.0449) (0.0447) (0.0432) (0.152) (0.145) (0.145)household open -0.137** -0.108 0.00720 0.0413 0.0458
defecation (0.0622) (0.0590) (0.0590) (0.0574) (0.0571)electrification in 0.0594 0.0626 -0.0788 -0.0606 -0.0743
child’s locality (0.101) (0.0939) (0.137) (0.131) (0.130)mother’s height 0.0544*** 0.0537*** 0.0549*** 0.0547***
(0.00355) (0.00360) (0.00342) (0.00341)mother’s BMI 0.0257*** 0.0227** 0.0276*** 0.0264***
(0.00692) (0.00692) (0.00685) (0.00690)household controls X X Xchild demography X Xhealth controls Xn (children under 5) 7,286 7,286 7,184 7,168 7,168 7,168 7,168
Standard errors clustered by survey primary sampling unit in parentheses. Two-sided p values: * p < 0.05,
** p < 0.01, *** p < 0.001. All specifications include 120 age-in-month dummies, separately for boys and
girls.
25

Table 3: Model averaging estimates of effect of open defecation on child height
Model averaging technique:Bayesian Weighted-Average
Model Averaging Least SquaresWithout rural-urban province -0.519 -0.468part fixed effects: (0.056) (0.089)
With rural-urban province part -0.478 -0.376fixed effects: (0.077) (0.096)
Note: Estimates are of β1, the linear association between PSU open defecation rate and child height-for-age
z score also estimated in Table 2. The sample is the same 7,168 children under 5 in columns 4-7 of Table 2.
Focus parameters included in every specification include, in addition to PSU open defecation, a constant,
an indicator for the year 2010, and 120 age-in-months by sex dummies. Eight auxiliary regressors are PSU
electrification, household electrification, household open defecation, whether the household owns a radio,
whether the household owns a TV, household size, mother’s height, and mother’s BMI, making a search
space of 512 models.
Table 4: Decomposition results: Fraction of 2005-2010 height change explained by improvingsanitation
difference between 2005 and 2010 mean heightsdecomposition method before sanitation after sanitation percent explained:regression, OLS 0.129 0.012 90regression, fixed effects 0.118 0.010 92
Blinder-Oaxaca 0.129 0.001 98
reweighted mean 0.13 -0.02 115“Blinder-Oaxaca” is a two-way decomposition with equal weight on within-sample slopes. “Reweighted
mean” constructs a counterfactual mean 2005 height by reweighting the 2005 sample to match the
sanitation distribution of the 2010 sample; the after difference is negative because the counterfactual 2005
height is slightly greater than the real 2010 height. Regression results are reinterpreted from table 2.
“Before sanitation” is the simple average difference; “after sanitation” is the unexplained difference after
accounting for the improvement in open defecation.
26