Embed Size (px)
Citation preview

Looking Ahead 116
15
GROWING POPULATION:A MORE CROWDED WORLD
THE WORLD POPULATION WILL REACH 8 BILLION by 2024, a dozen years since its last billion, but increasing at a decreasing rate
Global Population(In Billions, CE 1-2100)
Population by Region (In Billions, 1804-2062)
World population reached its first billion around 1804. Over the last two centuries, the next 6 billion has been reached and another 4 will be added by the end of this century. However, population growth is slowing. The annual population growth between the 3rd billion and the 7th billion was 1.7%, while the expected growth from now until 2100 is 0.5%. Population growth will be strongest in Asia and Africa, which will represent 51% and 29%, respectively, of total global population by 2062
Sources: “World Population Prospects”, UN, 2014 Update; “Atlas of World Population History”, McEvedy, Colin and Richard Jones, 1978
0 200 400 600 800 1000 1200 1400 1600 1800 2000 2200
2 Billion
3
4
5
6
7
8
9
10
Years Taken toReach
each Billion
127
31
0
15
12
12
13
12
16
22
11
10
9
8
7
6
5
4
3
2
1
1804
1975
2012
2062
(7%)
(15%)(10%)(9%)(1%)
Asia
Africa
Europe
Latin America
North America
Oceania
(5%)
(29%)
(8%)
(59%)
(10%)
(17%)(8%)
(1%)
(1%)
(21.8%)
(9%) (3%) (2%)(0.2%)
(60%)
(5%)
(64%)
(4%)
(51%)
LA_PublicVersion(Bleed3175)_ENG_V22.indd 116 10/28/15 1:28 PM
Looking Ahead 117
DESPITE THE ONGOING FALL IN MORTALITY, DECREASING FERTILITY WILL SLOW DOWN POPULATION GROWTH with 58% of total world population below replacement rate by 2020
The drop in mortality rates (especially infant mortality and death due to infectious diseases) has been a major driver of population growth, especially in the last two centuries. However, the peak years of fast population growth are gone with global fertility rates dropping fast. By 2020, more than half the global population will be below replacement rates especially Europe and the Americas. Most growth will be in the developing world
Fertility and Mortality(Mortality In Crude Death per 1,000 Population and Fertility In Children per Woman, 1950-2100)
Population Above and Below Replacement Rate(In Billions of People, 1950-2020)
Source- Upper and Lower Charts: “World Population Prospects”, UN, 2014 Update
Forecast
Fertility
Mortality
0
5
10
15
20
1950 1960 1970 1980 1990 2000 2010 2020 2030 2040 2050 2060 2070 2080 2090 2100
3.2
1.9
1.2
0.1 0.03.2
2.0
1.0
0.2 0.03.2
1.9
0.8
0.50.02.8
1.8
0.6
0.40.0
2.9
2.0
0.40.3
0.22.2
1.4
0.20.2
0.4
1950
Replacement Rate (2.3)
4.5
0.40.3
0.3
3.7
0.7
2.12.7
2.8 0.7
0.10.6
2.4
0.4
0.20.7
0.40.10.1
0.1
0.7
1.4 1.7
0.3 0.7
Above
Below
1970 1990 2000 2010 2020
Latin America and the CaribbeanEuropeAsia Africa North AmericaOceania
LA_PublicVersion(Bleed3175)_ENG_V22.indd 117 10/28/15 1:28 PM
Looking Ahead 118
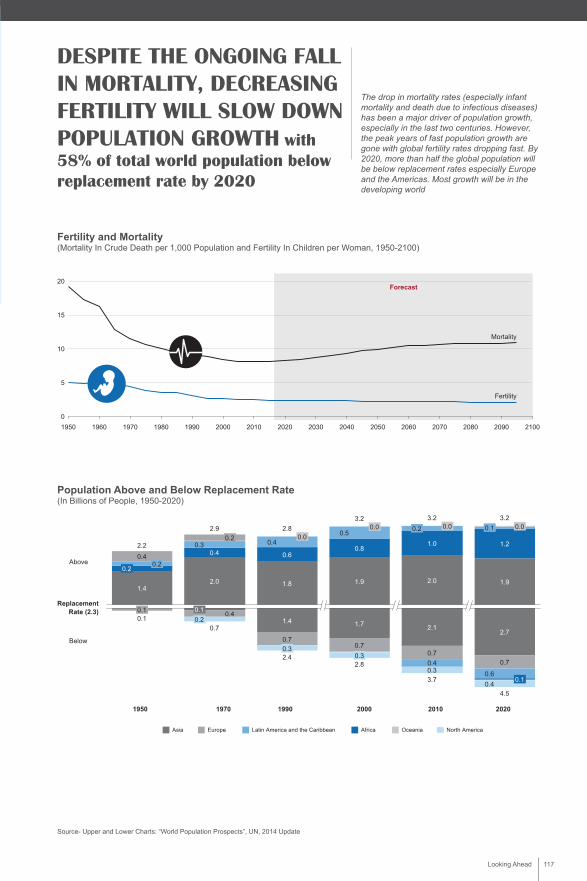
THE WORLD AS A WHOLE WILL BECOME MORE CROWDED; population density will be especially high in urban centers
The population of the world has been increasing for a long time. While in 1500 the entire world population could have fit into Florence, now it would take 26 Florences to fit everyone. Further, the share of people living in urban areas is growing which has been reflected in higher densities especially in the biggest and most dynamic cities
Land Area and Population(In Millions of People and In Square Kilometers, 1500, 1950, 1990, 2014, 2050 and 2100)
Note: (1) Based on the assumption that 4 adults fit in 1 square meterSources: World Bank Development Indicators; “World Population Prospects”, UN, 2014 Update; Maddison Historical Population Data
Land Area Taken up by World Population
Each Person Can Occupy an Area Equivalent to: (In Thousands of Square Meters, 1500, 1950, 1990, 2014, 2050 and 2100)
1500 1950 1990 2014 2050 2100
1X 6X 13X 17X 22X 26X
0.9X 0.3X 0.2X 0.9X 1.7X 10X
Area= 106 Km2 Area= 628 Km2 Area= 1,324 Km2 Area= 1,802 Km2 Area= 2,376 Km2 Area= 2,700 Km2
Area= 24.4
Sheikh Zayed Mosque
Area= 51.4
Forbidden City
Area= 17.9
The Colosseum
Population=438 Million
Area= 13.6
Empire State Building
Area= 12
Big Ben
Area= 305.3
The Pentagon
Population=2,526 Million
Population=5,320 Million
Population=7,243 Million
Population=9,551 Million
Population=10,854 Million
Area ofLandmark= 340
Area ofLandmark= 150
Area ofLandmark= 121
Area ofLandmark= 20
Area ofLandmark= 8.1
Area ofLandmark= 1.2
102Km2 = Standing space for 410
million people(1)
Florence
LA_PublicVersion(Bleed3175)_ENG_V22.indd 118 10/28/15 1:28 PM
Looking Ahead 119
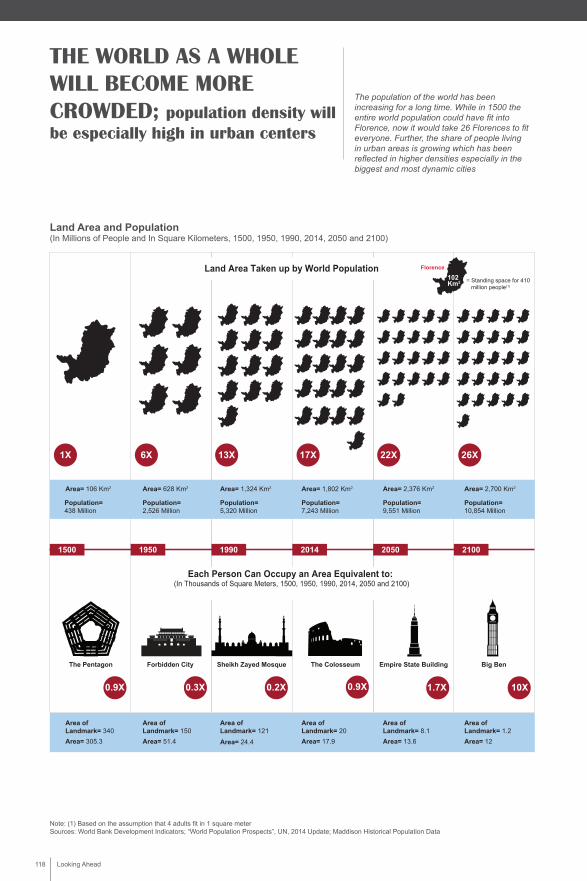
BY 2100, HALF OF THE WORLD’S POPULATION WILL LIVE IN FIVE COUNTRIES, and those countries will account for a third of global GDP, be relatively older and increasingly Muslim
India will become the world’s most populous country in 2028, overtaking China, which will start decreasing in population around 2030. Much of the industrialized world, particularly Europe, will start decreasing in total population by 2020; Europe will fall off the top ten population list altogether by the end of the century. Also, the population of the top five countries will be relatively old (driven by an ageing China) and increasingly Muslim (with Nigeria becoming a majority Muslim country)
Most Populous Countries over Time(In Millions and In Rank, 2010, 2020, 2050, 2080 and 2100)
Population Growth in Large Selected Countries Based on Share of Global Population(In %, 2010-2100 and In % of Total Global Population, 2010)
Sources- Upper Charts: “World Population Prospects: The 2012 Revision”, UN, 2012; “The Future of the Global Muslim Population”, Pew Research, 2011; “Country-level Projections”, Socioeconomic Data and Applications Center (SEDAC), NASA
Source- Lower Chart: “World Population Prospects”, UN, 2014 Update
2010 2020 2050 2080 2100In Millions
1,300
1,000
300
150
100
90
80
70
40
1,400+
130
1
2
3
7
9
10
15
16
30
1
2
3
6
9
11
1513
17
25
1 1
2
3
9
12
1513 14
24
1
2 2
34
613
17
23
29
4239
24
18
17
12 9
34
x Global Rank
Muslim Population
Population 65+
Global Population
TOP 5 POPULATION IN 2030
Indicators in % of World Total
29%
46%
48%
1
0.4 0.80.0-0.1-0.2-0.3-0.4-0.50
3
20
19
5
18
17
4
0.3
2
0.7 0.9 2.11.9 2.00.5 0.60.1 0.2
EgyptTurkey
India
US
Increasing Population and High Global Share
DecreasingPopulation and
High Global Share
Increasing Population and Low Global ShareDecreasingPopulation and
Low Global Share
Shar
e of
Glo
bal
Popu
latio
n (2
010)
Compounded Average Growth rate (2010-2100)
China
Japan Russia
Germany Philippines
Nigeria
Tanzania
LA_PublicVersion(Bleed3175)_ENG_V22.indd 119 10/28/15 1:28 PM