Embed Size (px)
Citation preview
OFFSHORE WIND IN THE ATLANTICGrowing Momentum for Jobs, EnergyIndependence, Clean Air, and Wildlife Protection
N A T I O N A L W I L D L I F E F E D E R A T I O N 2 0 1 0
ReportC O N F R O N T I N G G L O B A L W A R M I N G
Ves
tas
Win
d S
yste
ms
A/S
Authors: Curtis Fisher, Suraj Patel, Catherine Bowes, and Justin Allegro
This report was produced with much assistance and appreciation to the following individuals andorganizations: National Wildlife Federation (John Kostyack, Tim Warman, Felice Stadler, Bruce Stein,Ron Warnken, Jen Mihills, Emily Maxwell, Christopher Davis); Environment America (Rob Sargent, MattElliot); Natural Resources Council of Maine (Dylan Voorhees); Environmental League of Massachusetts(Ken Pruitt); Environment Council of Rhode Island (Tricia Jedele, Paul Beaudette); EnvironmentalAdvocates of New York (Ross Gould); New Jersey Audubon (Eric Stiles); Delaware Nature Society(Brenna Goggin); Virginia Conservation Network (Nathan Lott); North Carolina Wildlife Federation (Tim Gestwicki); South Carolina Wildlife Federation (Ben Gregg, Steve Moore); Georgia WildlifeFederation (Jerry McCollum, Shirl Parsons); Florida Wildlife Federation (Manley Fuller, Jay Liles, AnnVanek Dasovich, Preston Robertson); Mass Audubon (Jack Clarke); U.S. Offshore Wind Collaborative(Fara Courtney); Clean Energy States Alliance (Mark Sinclair); Conservation Law Foundation (SeanMahoney, Seth Kaplan, Tricia Jedele, Susan Reid); Southern Alliance for Clean Energy (Simon Mahan);Renewable Energy Long Island (Gordian Raacke); Sierra Club–VA Chapter (Ivy Main); ChesapeakeClimate Action Network (Chelsea Harnish, Ted Glick); Clean Power Now (Barbara Hill).
The National Wildlife Federation would also like to thank all the individuals that were profiled in thereport: Stewart Acuff, Utility Workers Union of America; Jan Blittersdorf, NRG Systems; Jack Clarke,Mass Audubon; Fara Courtney, U.S. Offshore Wind Collaborative; Tom Fote, Jersey Coast AnglersAssociation; Jonathan Gensler; Tom Gilmore, New Jersey Audubon; Mary Hallisey Hunt, Georgia Tech;Michael Hervey, Long Island Power Authority; William Moore, Deepwater Wind; Nick Rigas, ClemsonUniversity; and Greg Watson, Massachusetts Executive Office of Energy and Environmental Affairs.
The National Wildlife Federation gratefully acknowledges the following foundations for their supportof this project: Energy Foundation; Grace C. Harrison Trust; The Robertson Foundation; and TurnerFoundation.
Report designed by Barbara Raab Sgouros.
© 2010 National Wildlife Federation
Acknowledgments
THIS REPORT IS AVAILABLE ONLINE AT WWW.NWF.ORG/OFFSHOREWIND
REPORT COSPONSORS
LEAGUE OF
WOMEN VOTERS®
Page 1
Executive SummaryThe Atlantic states are uniquely positioned to forge a clean,
independent energy future. The region’s current dependence on fossil
fuels has far-reaching and devastating impacts —– affecting residents’
health, draining their pocketbooks, causing air and water pollution, and
warming the planet. Many Atlantic states have already become
leaders in energy efficiency and renewable energy technologies that
create jobs, lower energy costs, cut pollution, and reduce our reliance
on dirty fossil fuels. These efforts will greatly benefit people and
wildlife for generations to come.
It is time for Atlantic states to build on these successes by tapping
one of the region’s most significant renewable resources: offshore
wind. Key findings of this report include:
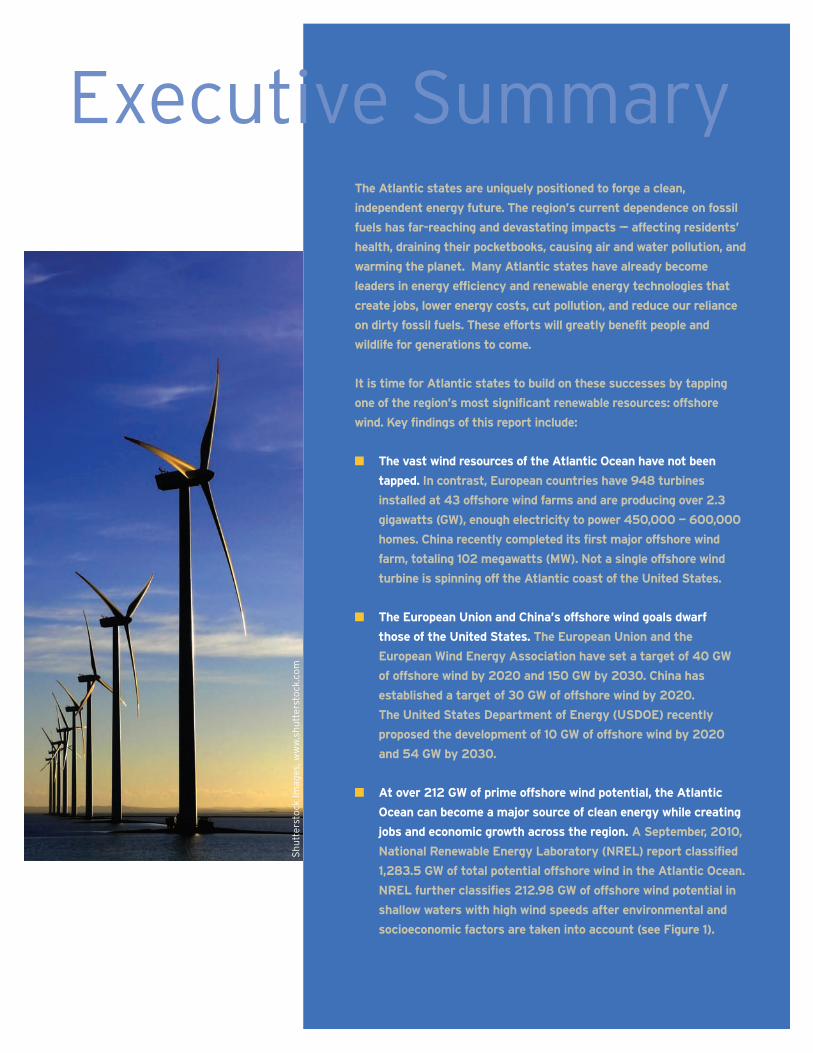
� The vast wind resources of the Atlantic Ocean have not been
tapped. In contrast, European countries have 948 turbines
installed at 43 offshore wind farms and are producing over 2.3
gigawatts (GW), enough electricity to power 450,000 — 600,000
homes . China recently completed its first major offshore wind
farm, totaling 102 megawatts (MW). Not a single offshore wind
turbine is spinning off the Atlantic coast of the United States.
� The European Union and China’s offshore wind goals dwarf
those of the United States. The European Union and the
European Wind Energy Association have set a target of 40 GW
of offshore wind by 2020 and 150 GW by 2030. China has
established a target of 30 GW of offshore wind by 2020.
The United States Department of Energy (USDOE) recently
proposed the development of 10 GW of offshore wind by 2020
and 54 GW by 2030.
� At over 212 GW of prime offshore wind potential, the Atlantic
Ocean can become a major source of clean energy while creating
jobs and economic growth across the region. A September, 2010,
National Renewable Energy Laboratory (NREL) report classified
1,283.5 GW of total potential offshore wind in the Atlantic Ocean.
NREL further classifies 212.98 GW of offshore wind potential in
shallow waters with high wind speeds after environmental and
socioeconomic factors are taken into account (see Figure 1).
Shutterstock Im
ages, w
ww.shutterstock.com
Page 2
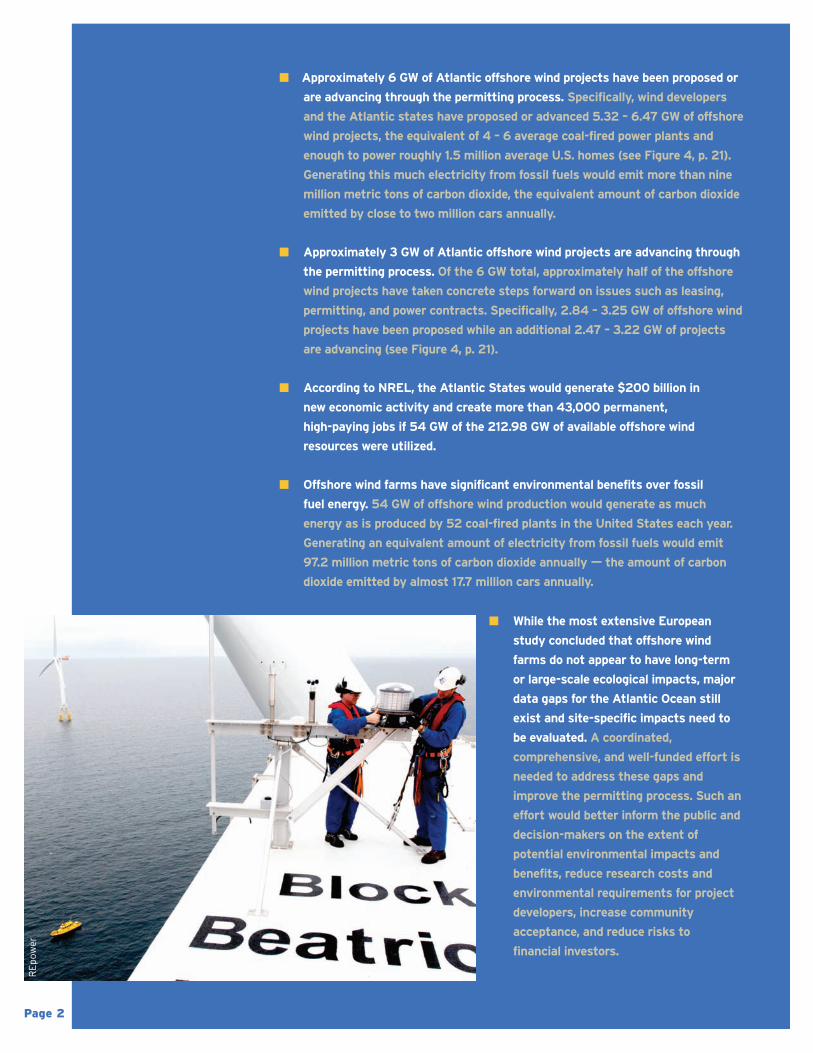
� While the most extensive European
study concluded that offshore wind
farms do not appear to have long-term
or large-scale ecological impacts, major
data gaps for the Atlantic Ocean still
exist and site-specific impacts need to
be evaluated. A coordinated,
comprehensive, and well-funded effort is
needed to address these gaps and
improve the permitting process. Such an
effort would better inform the public and
decision-makers on the extent of
potential environmental impacts and
benefits, reduce research costs and
environmental requirements for project
developers, increase community
acceptance, and reduce risks to
financial investors.
REpow
er
� Approximately 6 GW of Atlantic offshore wind projects have been proposed or
are advancing through the permitting process. Specifically, wind developers
and the Atlantic states have proposed or advanced 5.32 – 6.47 GW of offshore
wind projects, the equivalent of 4 – 6 average coal-fired power plants and
enough to power roughly 1.5 million average U.S. homes (see Figure 4, p. 21).
Generating this much electricity from fossil fuels would emit more than nine
million metric tons of carbon dioxide, the equivalent amount of carbon dioxide
emitted by close to two million cars annually.
� Approximately 3 GW of Atlantic offshore wind projects are advancing through
the permitting process. Of the 6 GW total, approximately half of the offshore
wind projects have taken concrete steps forward on issues such as leasing,
permitting, and power contracts. Specifically, 2.84 – 3.25 GW of offshore wind
projects have been proposed while an additional 2.47 – 3.22 GW of projects
are advancing (see Figure 4, p. 21).
� According to NREL, the Atlantic States would generate $200 billion in
new economic activity and create more than 43,000 permanent,
high-paying jobs if 54 GW of the 212.98 GW of available offshore wind
resources were utilized.
� Offshore wind farms have significant environmental benefits over fossil
fuel energy. 54 GW of offshore wind production would generate as much
energy as is produced by 52 coal-fired plants in the United States each year.
Generating an equivalent amount of electricity from fossil fuels would emit
97.2 million metric tons of carbon dioxide annually —– the amount of carbon
dioxide emitted by almost 17.7 million cars annually.
This report calls on government andstakeholders to create the politicalclimate and economic conditionsnecessary to jumpstart the offshorewind industry in the Atlantic Ocean.A concerted, diverse, and well-organized effort is needed. Thismust include initiatives to:
1. Accelerate the transition fromfossil fuels to clean energy.The region’s economic andenvironmental future depends onincreasing energy efficiency andthe use of renewable energytechnologies.
2. Jumpstart the offshore windindustry and individual projects inthe Atlantic Ocean by:
� Improving the offshore windpermitting process;
� Supporting policies andinvestments that spur offshorewind development;
� Identifying and reviewing highpriority zones off the AtlanticCoast with minimal conflict to theenvironment and to other oceanusers that can be prioritized forquicker permitting;
� Increasing research on offshore windtechnologies and their associatedbenefits and risks, includingwildlife and fishing impacts;
� Advancing efforts to promote jobsfrom this industry, especiallymanufacturing and other high-paying jobs;
� Promoting appropriately-sitedoffshore wind farms;
� Coordinating regional planning andeconomic development, includingports, vessels, transmissioninvestment, and other sharedopportunities; and
� Educating policymakers and thepublic about the benefits ofoffshore wind.
3. Ensure the protection of theAtlantic Ocean and its preciousresources. While each Atlanticstate is unique in terms of theavailability of offshore wind, localpolitics, and mix of energy sources,the one constant should be acomprehensive effort to protectthe Atlantic Ocean as a pricelessand connected ecosystem.
Offshore wind can help protect the Atlantic Ocean from climatechange and studies show thatprojects can be sited to avoidlarge-scale and long-termecological impacts.
4.Create a diverse and powerfulAtlantic offshore wind network. In order to realize the full potential of offshore wind, organizations(including labor representatives,conservation groups, communitygroups, commercial andrecreational fisherman, consumerorganizations, and businesses)must create a clear regional visionfor Atlantic offshore wind andcreate the political power needed toadvance key policies and projects.
Page 3
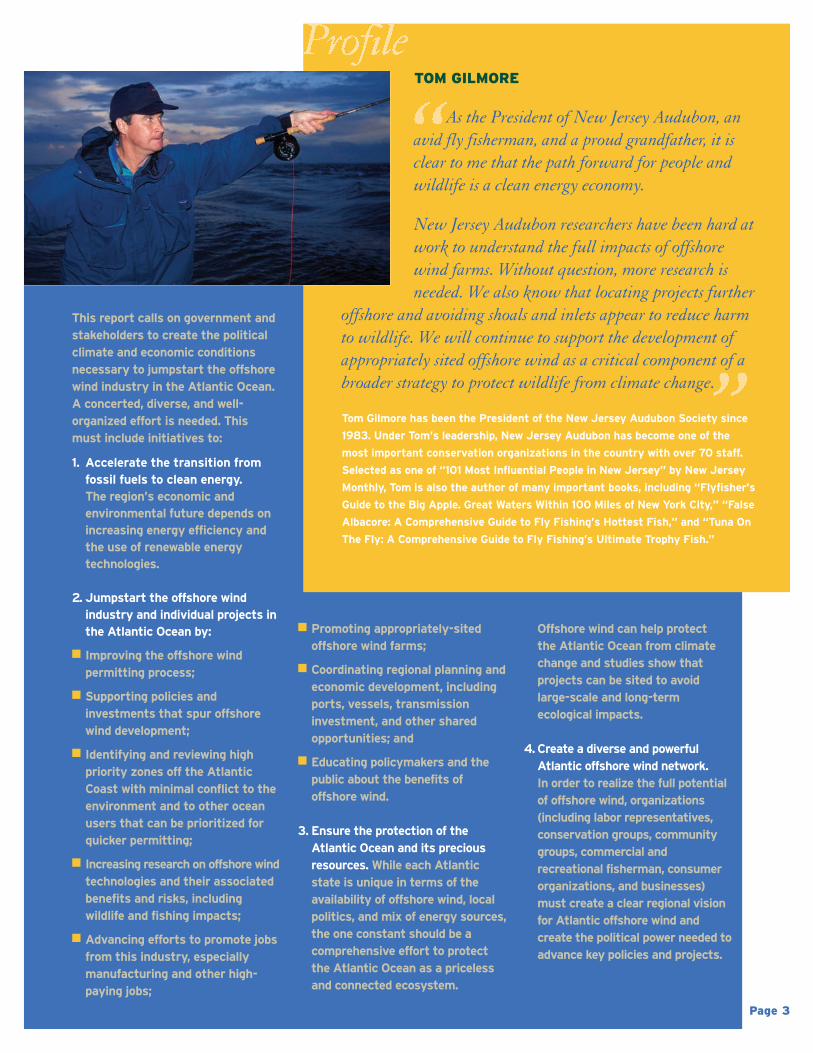
TOM GILMORE
As the President of New Jersey Audubon, anavid fly fisherman, and a proud grandfather, it isclear to me that the path forward for people andwildlife is a clean energy economy.
New Jersey Audubon researchers have been hard atwork to understand the full impacts of offshorewind farms. Without question, more research isneeded. We also know that locating projects further
offshore and avoiding shoals and inlets appear to reduce harmto wildlife. We will continue to support the development ofappropriately sited offshore wind as a critical component of abroader strategy to protect wildlife from climate change.
Tom Gilmore has been the President of the New Jersey Audubon Society since
1983. Under Tom’s leadership, New Jersey Audubon has become one of the
most important conservation organizations in the country with over 70 staff.
Selected as one of “101 Most Influential People in New Jersey” by New Jersey
Monthly, Tom is also the author of many important books, including “Flyfisher’s
Guide to the Big Apple. Great Waters Within 100 Miles of New York City,” “False
Albacore: A Comprehensive Guide to Fly Fishing’s Hottest Fish,” and “Tuna On
The Fly: A Comprehensive Guide to Fly Fishing’s Ultimate Trophy Fish.”
Page 4
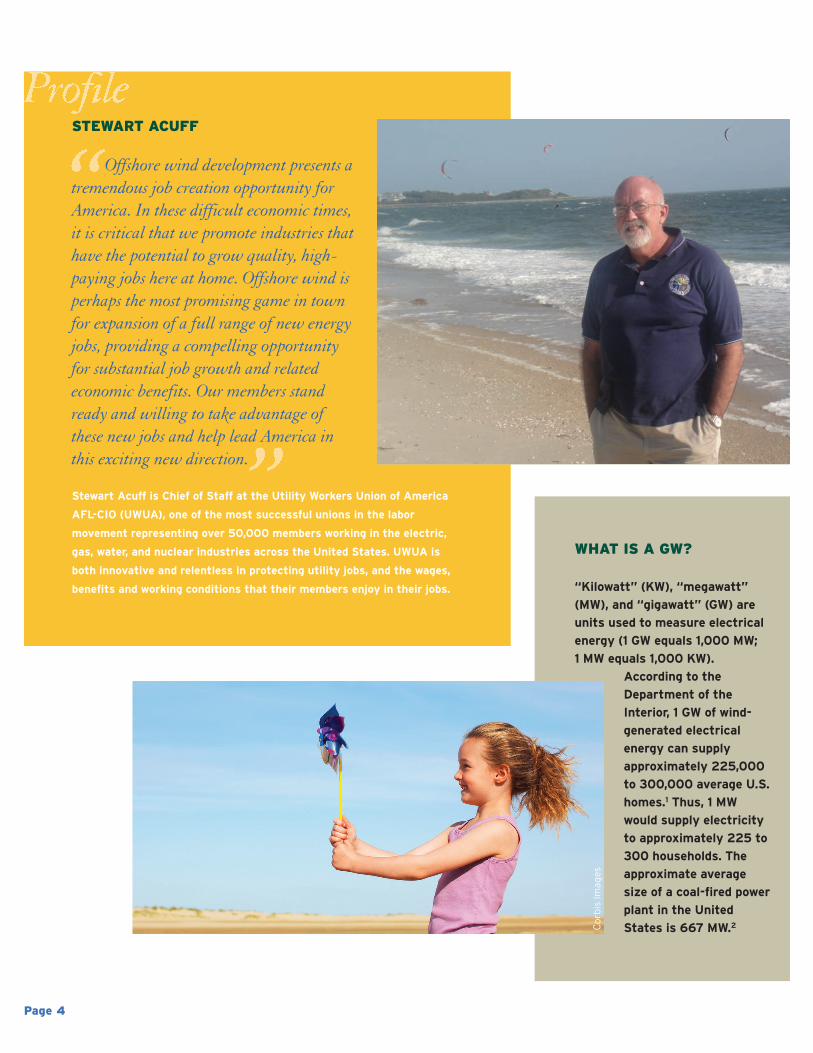
STEWART ACUFF
Offshore wind development presents atremendous job creation opportunity forAmerica. In these difficult economic times,it is critical that we promote industries thathave the potential to grow quality, high-paying jobs here at home. Offshore wind isperhaps the most promising game in townfor expansion of a full range of new energyjobs, providing a compelling opportunityfor substantial job growth and relatedeconomic benefits. Our members standready and willing to take advantage ofthese new jobs and help lead America inthis exciting new direction.
Stewart Acuff is Chief of Staff at the Utility Workers Union of America
AFL-CIO (UWUA), one of the most successful unions in the labor
movement representing over 50,000 members working in the electric,
gas, water, and nuclear industries across the United States. UWUA is
both innovative and relentless in protecting utility jobs, and the wages,
benefits and working conditions that their members enjoy in their jobs.
WHAT IS A GW?
“Kilowatt” (KW), “megawatt”
(MW), and “gigawatt” (GW) are
units used to measure electrical
energy (1 GW equals 1,000 MW;
1 MW equals 1,000 KW).
According to the
Department of the
Interior, 1 GW of wind-
generated electrical
energy can supply
approximately 225,000
to 300,000 average U.S.
homes.1 Thus, 1 MW
would supply electricity
to approximately 225 to
300 households. The
approximate average
size of a coal-fired power
plant in the United
States is 667 MW.2Corbis Im
ages
DWIA and GWEC
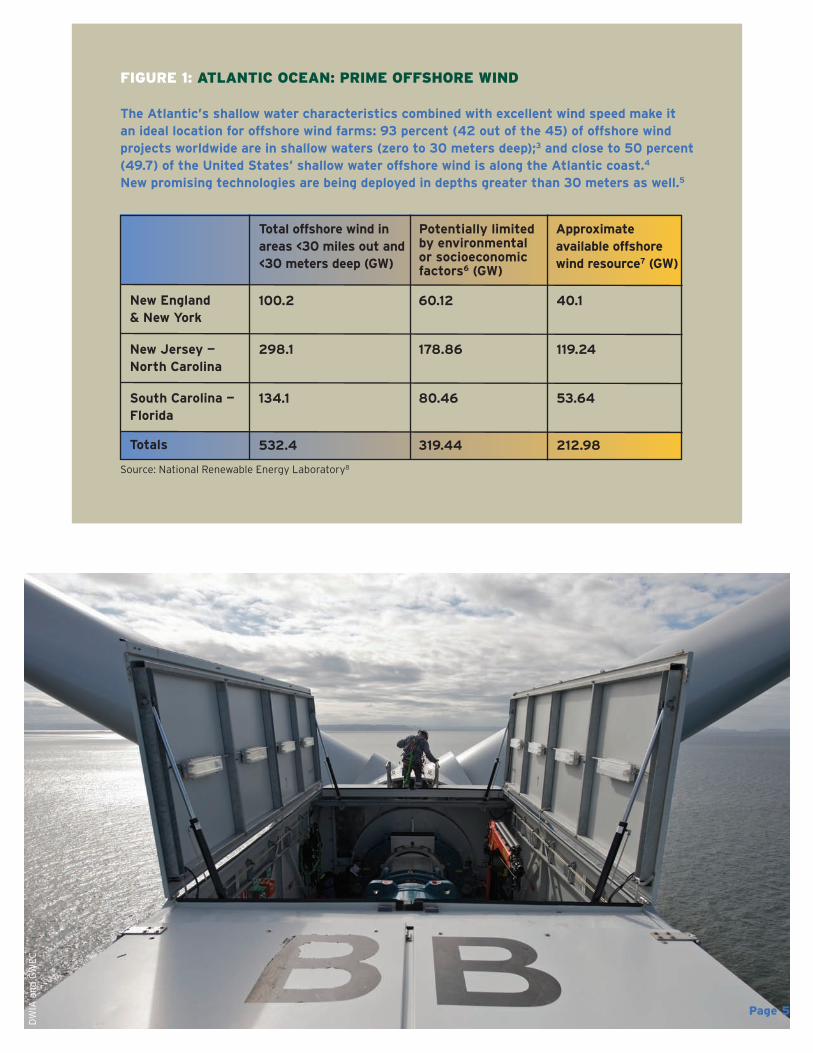
FIGURE 1: ATLANTIC OCEAN: PRIME OFFSHORE WIND
The Atlantic’s shallow water characteristics combined with excellent wind speed make itan ideal location for offshore wind farms: 93 percent (42 out of the 45) of offshore windprojects worldwide are in shallow waters (zero to 30 meters deep);3 and close to 50 percent(49.7) of the United States’ shallow water offshore wind is along the Atlantic coast.4
New promising technologies are being deployed in depths greater than 30 meters as well.5
Total offshore wind inareas <30 miles out and<30 meters deep (GW)
Potentially limitedby environmental or socioeconomicfactors6 (GW)
Approximateavailable offshorewind resource7 (GW)
New England& New York
New Jersey —North Carolina
South Carolina —Florida
Totals
100.2 60.12 40.1
298.1 178.86 119.24
134.1 80.46 53.64
532.4 319.44 212.98
Source: National Renewable Energy Laboratory8
Page 5
Page 6
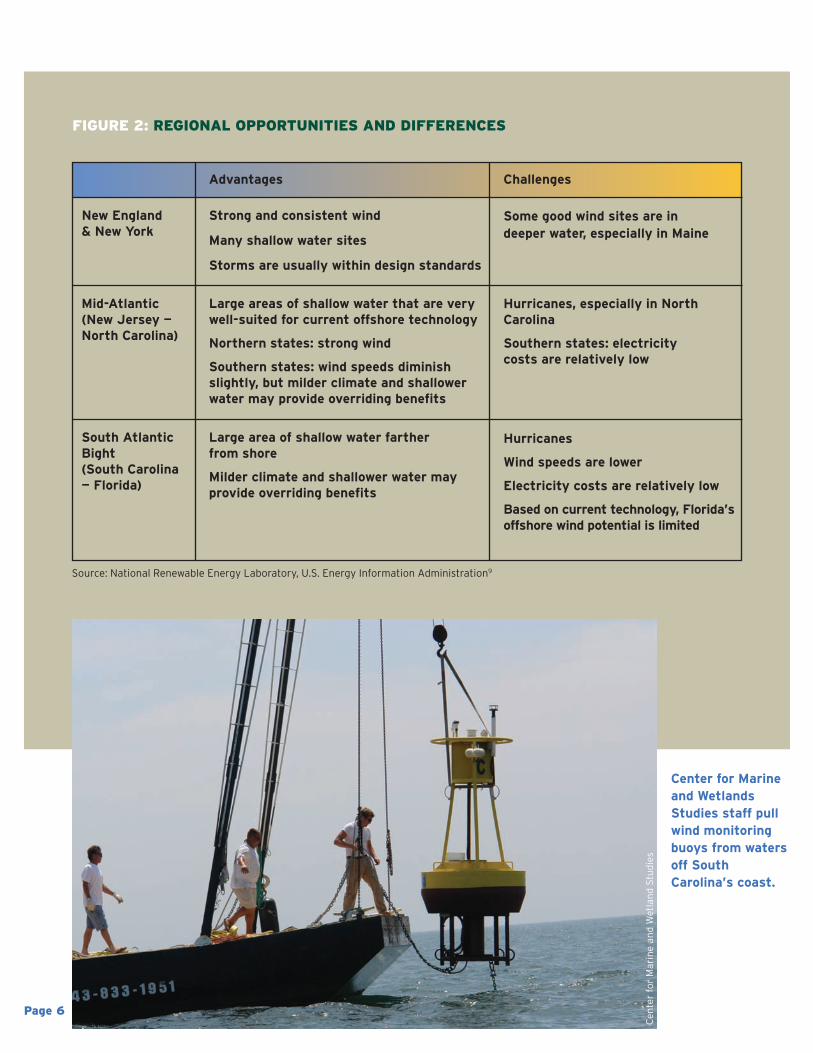
FIGURE 2: REGIONAL OPPORTUNITIES AND DIFFERENCES
Advantages Challenges
New England& New York
Strong and consistent wind
Many shallow water sites
Storms are usually within design standards
Large areas of shallow water that are verywell-suited for current offshore technology
Northern states: strong wind
Southern states: wind speeds diminishslightly, but milder climate and shallowerwater may provide overriding benefits
Large area of shallow water farther from shore
Milder climate and shallower water mayprovide overriding benefits
Some good wind sites are indeeper water, especially in Maine
Hurricanes, especially in NorthCarolina
Southern states: electricitycosts are relatively low
Hurricanes
Wind speeds are lower
Electricity costs are relatively low
Based on current technology, Florida’soffshore wind potential is limited
Mid-Atlantic (New Jersey —North Carolina)
South AtlanticBight (South Carolina— Florida)
Source: National Renewable Energy Laboratory, U.S. Energy Information Administration9
Cen
ter for Marine an
d Wetland Studies
Center for Marineand WetlandsStudies staff pullwind monitoringbuoys from watersoff SouthCarolina’s coast.
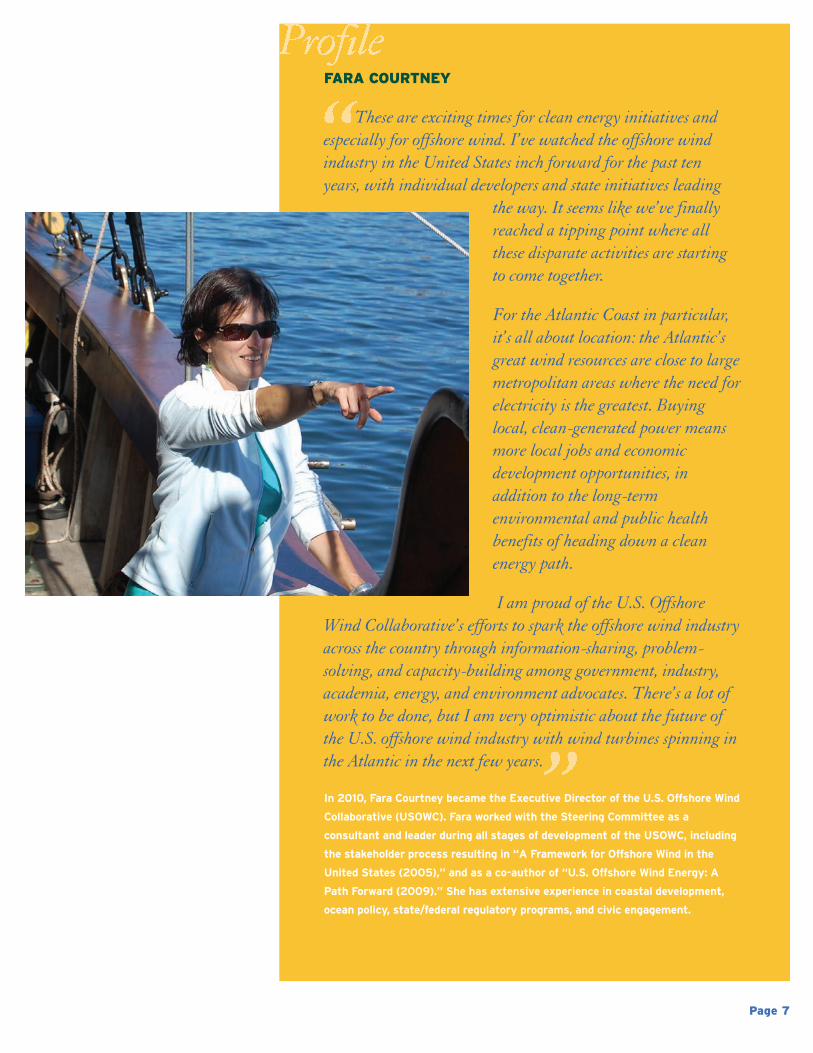
FARA COURTNEY
These are exciting times for clean energy initiatives andespecially for offshore wind. I’ve watched the offshore windindustry in the United States inch forward for the past tenyears, with individual developers and state initiatives leading
the way. It seems like we’ve finallyreached a tipping point where allthese disparate activities are startingto come together.
For the Atlantic Coast in particular,it’s all about location: the Atlantic’sgreat wind resources are close to largemetropolitan areas where the need forelectricity is the greatest. Buyinglocal, clean-generated power meansmore local jobs and economicdevelopment opportunities, inaddition to the long-termenvironmental and public healthbenefits of heading down a cleanenergy path.
I am proud of the U.S. OffshoreWind Collaborative’s efforts to spark the offshore wind industryacross the country through information-sharing, problem-solving, and capacity-building among government, industry,academia, energy, and environment advocates. There’s a lot ofwork to be done, but I am very optimistic about the future ofthe U.S. offshore wind industry with wind turbines spinning inthe Atlantic in the next few years.
In 2010, Fara Courtney became the Executive Director of the U.S. Offshore Wind
Collaborative (USOWC). Fara worked with the Steering Committee as a
consultant and leader during all stages of development of the USOWC, including
the stakeholder process resulting in “A Framework for Offshore Wind in the
United States (2005),” and as a co-author of “U.S. Offshore Wind Energy: A
Path Forward (2009).” She has extensive experience in coastal development,
ocean policy, state/federal regulatory programs, and civic engagement.
Page 7
Despite warnings from a string of
presidents from Jimmy Carter to
George W. Bush that America is
addicted to fossil fuels, our country’s
reliance on coal, oil, and natural gas
continues to grow. In the summer of
2010, electricity demand reached
record levels for most of the Atlantic
states.13 By 2030, the amount of miles
driven by vehicles in the region is
expected to increase by over 100
percent.14 The U.S. Energy Information
Administration (EIA) estimates that
U.S. consumption of liquid fuels will
increase from 20 million barrels/day in
2008 to 22 million barrels/day in 2035.
Consumption of coal is expected to
grow substantially over the next 25
years if no action is taken.15
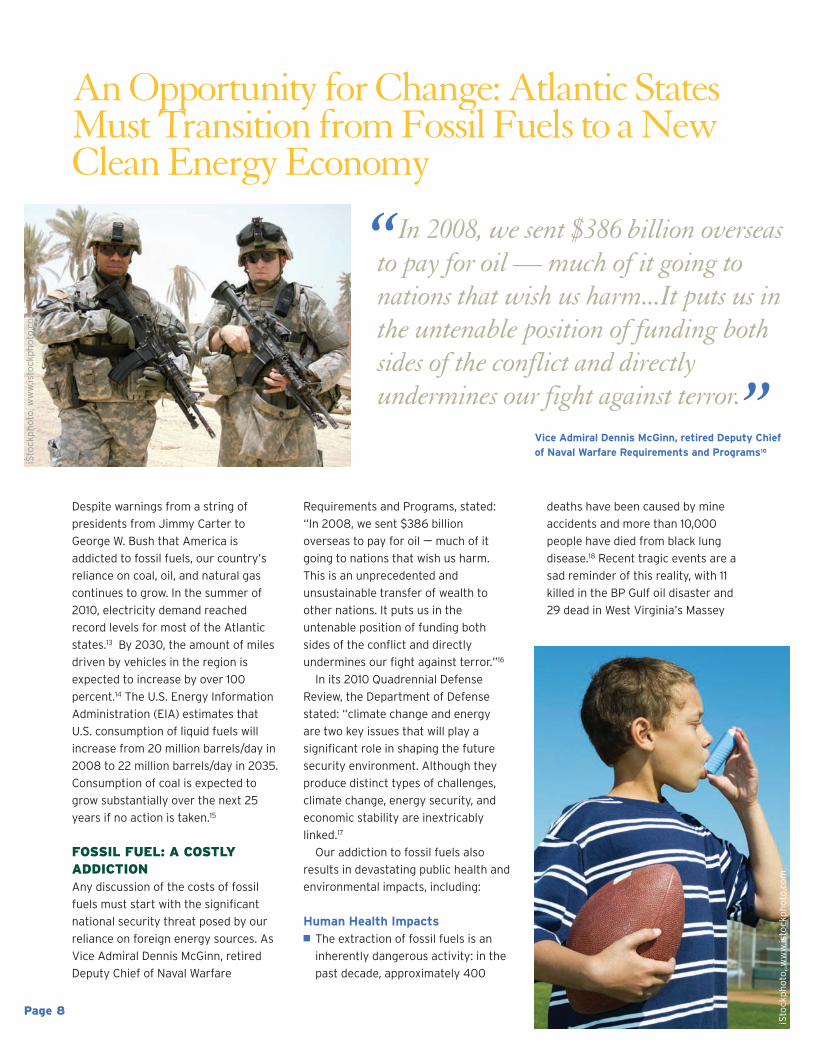
FOSSIL FUEL: A COSTLYADDICTION Any discussion of the costs of fossil
fuels must start with the significant
national security threat posed by our
reliance on foreign energy sources. As
Vice Admiral Dennis McGinn, retired
Deputy Chief of Naval Warfare
Requirements and Programs, stated:
“In 2008, we sent $386 billion
overseas to pay for oil —– much of it
going to nations that wish us harm.
This is an unprecedented and
unsustainable transfer of wealth to
other nations. It puts us in the
untenable position of funding both
sides of the conflict and directly
undermines our fight against terror.”16
In its 2010 Quadrennial Defense
Review, the Department of Defense
stated: “climate change and energy
are two key issues that will play a
significant role in shaping the future
security environment. Although they
produce distinct types of challenges,
climate change, energy security, and
economic stability are inextricably
linked.17
Our addiction to fossil fuels also
results in devastating public health and
environmental impacts, including:
Human Health Impacts � The extraction of fossil fuels is an
inherently dangerous activity: in the
past decade, approximately 400
deaths have been caused by mine
accidents and more than 10,000
people have died from black lung
disease.18 Recent tragic events are a
sad reminder of this reality, with 11
killed in the BP Gulf oil disaster and
29 dead in West Virginia’s Massey
An Opportunity for Change: Atlantic StatesMust Transition from Fossil Fuels to a NewClean Energy Economy
In 2008, we sent $386 billion overseasto pay for oil — much of it going tonations that wish us harm...It puts us inthe untenable position of funding bothsides of the conflict and directlyundermines our fight against terror.
“
Vice Admiral Dennis McGinn, retired Deputy Chiefof Naval Warfare Requirements and Programs10
”
iStockphoto, w
ww.istockphoto.com
iStockphoto, w
ww.istockphoto.com
Page 8
Page 9
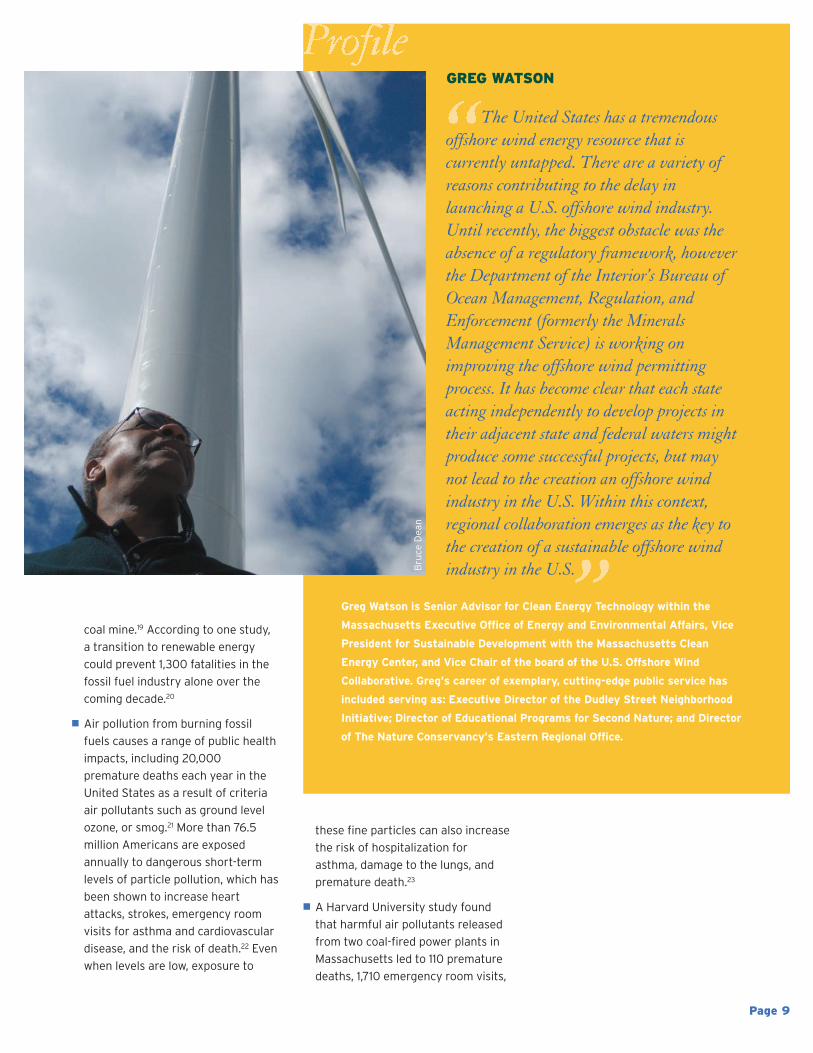
GREG WATSON
The United States has a tremendousoffshore wind energy resource that iscurrently untapped. There are a variety ofreasons contributing to the delay inlaunching a U.S. offshore wind industry.Until recently, the biggest obstacle was theabsence of a regulatory framework, howeverthe Department of the Interior’s Bureau ofOcean Management, Regulation, andEnforcement (formerly the MineralsManagement Service) is working onimproving the offshore wind permittingprocess. It has become clear that each stateacting independently to develop projects intheir adjacent state and federal waters mightproduce some successful projects, but maynot lead to the creation an offshore windindustry in the U.S. Within this context,regional collaboration emerges as the key tothe creation of a sustainable offshore windindustry in the U.S.
Greg Watson is Senior Advisor for Clean Energy Technology within the
Massachusetts Executive Office of Energy and Environmental Affairs, Vice
President for Sustainable Development with the Massachusetts Clean
Energy Center, and Vice Chair of the board of the U.S. Offshore Wind
Collaborative. Greg’s career of exemplary, cutting-edge public service has
included serving as: Executive Director of the Dudley Street Neighborhood
Initiative; Director of Educational Programs for Second Nature; and Director
of The Nature Conservancy’s Eastern Regional Office.
these fine particles can also increase
the risk of hospitalization for
asthma, damage to the lungs, and
premature death.23
� A Harvard University study found
that harmful air pollutants released
from two coal-fired power plants in
Massachusetts led to 110 premature
deaths, 1,710 emergency room visits,
Bruce Dean
coal mine.19 According to one study,
a transition to renewable energy
could prevent 1,300 fatalities in the
fossil fuel industry alone over the
coming decade.20
� Air pollution from burning fossil
fuels causes a range of public health
impacts, including 20,000
premature deaths each year in the
United States as a result of criteria
air pollutants such as ground level
ozone, or smog.21 More than 76.5
million Americans are exposed
annually to dangerous short-term
levels of particle pollution, which has
been shown to increase heart
attacks, strokes, emergency room
visits for asthma and cardiovascular
disease, and the risk of death.22 Even
when levels are low, exposure to
Page 10
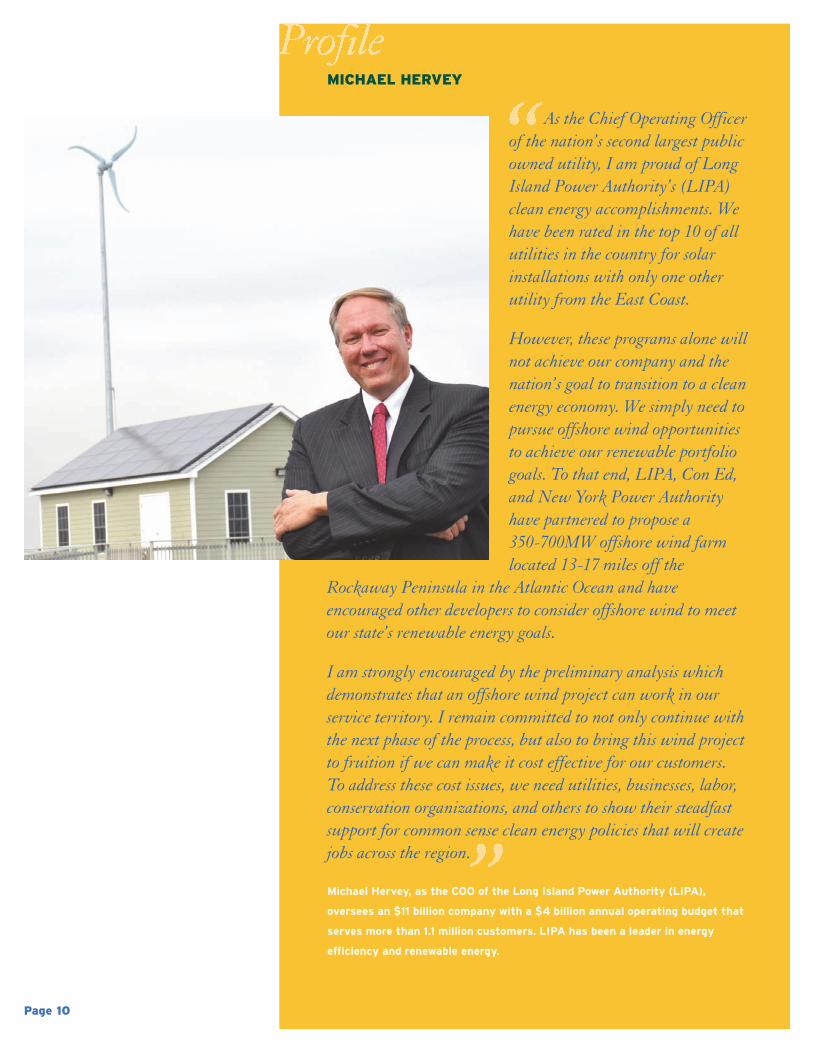
MICHAEL HERVEY
As the Chief Operating Officerof the nation’s second largest publicowned utility, I am proud of LongIsland Power Authority’s (LIPA)clean energy accomplishments. Wehave been rated in the top 10 of allutilities in the country for solarinstallations with only one otherutility from the East Coast.
However, these programs alone willnot achieve our company and thenation’s goal to transition to a cleanenergy economy. We simply need topursue offshore wind opportunitiesto achieve our renewable portfoliogoals. To that end, LIPA, Con Ed,and New York Power Authorityhave partnered to propose a 350-700MW offshore wind farmlocated 13-17 miles off the
Rockaway Peninsula in the Atlantic Ocean and haveencouraged other developers to consider offshore wind to meetour state’s renewable energy goals.
I am strongly encouraged by the preliminary analysis whichdemonstrates that an offshore wind project can work in ourservice territory. I remain committed to not only continue withthe next phase of the process, but also to bring this wind projectto fruition if we can make it cost effective for our customers.To address these cost issues, we need utilities, businesses, labor,conservation organizations, and others to show their steadfastsupport for common sense clean energy policies that will createjobs across the region.
Michael Hervey, as the COO of the Long Island Power Authority (LIPA),
oversees an $11 billion company with a $4 billion annual operating budget that
serves more than 1.1 million customers. LIPA has been a leader in energy
efficiency and renewable energy.
Page 11
43,300 asthma attacks, and
298,000 daily incidents of upper
respiratory problems.24 Based on the
Harvard case study, the U.S. Army
Corp of Engineers indicated that the
total economic costs of the health
impacts (illness and premature
deaths) caused by both power plants
are estimated to be $481.6 million.25
� Extracting and burning fossil fuels
results in an array of toxic chemical
emissions. Diesel emissions alone
may be responsible for 125,000
cancer cases in the U.S.26 In addition,
coal and oil combustion releases
high levels of mercury pollution and
other reproductive toxins.27
Environmental Damage� Air pollution deposition from coal-
fired power plants, including
mercury and acid rain, has destroyed
lakes and resulted in the toxic
contamination of fish and a wide
range of other wildlife in both
freshwater and marine ecosystems
across the country.28 The State of
New Jersey estimates that more
than one-third of the state’s smog-
forming pollution, fine particulate
pollution, and mercury deposition
originate from upwind, out-of-state
coal and dirty-energy production
facilities.29
� The extraction of fossil fuels causes
a range of direct water pollution
discharges from mining,
mountaintop removal, drilling, and,
more recently, the environmentally
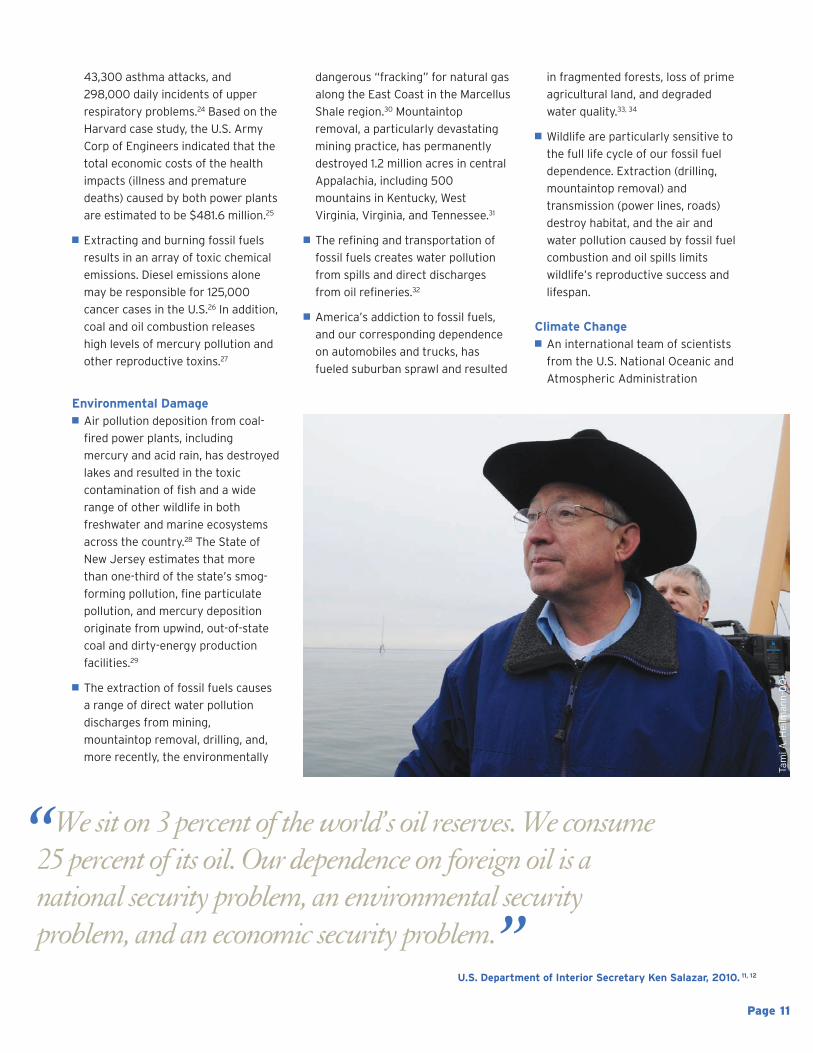
We sit on 3 percent of the world’s oil reserves. We consume25 percent of its oil. Our dependence on foreign oil is anational security problem, an environmental securityproblem, and an economic security problem.
“
U.S. Department of Interior Secretary Ken Salazar, 2010. 11, 12”
Tami A
. Heilm
ann-DOI
dangerous “fracking” for natural gas
along the East Coast in the Marcellus
Shale region.30 Mountaintop
removal, a particularly devastating
mining practice, has permanently
destroyed 1.2 million acres in central
Appalachia, including 500
mountains in Kentucky, West
Virginia, Virginia, and Tennessee.31
� The refining and transportation of
fossil fuels creates water pollution
from spills and direct discharges
from oil refineries.32
� America’s addiction to fossil fuels,
and our corresponding dependence
on automobiles and trucks, has
fueled suburban sprawl and resulted
in fragmented forests, loss of prime
agricultural land, and degraded
water quality.33, 34
� Wildlife are particularly sensitive to
the full life cycle of our fossil fuel
dependence. Extraction (drilling,
mountaintop removal) and
transmission (power lines, roads)
destroy habitat, and the air and
water pollution caused by fossil fuel
combustion and oil spills limits
wildlife’s reproductive success and
lifespan.
Climate Change� An international team of scientists
from the U.S. National Oceanic and
Atmospheric Administration
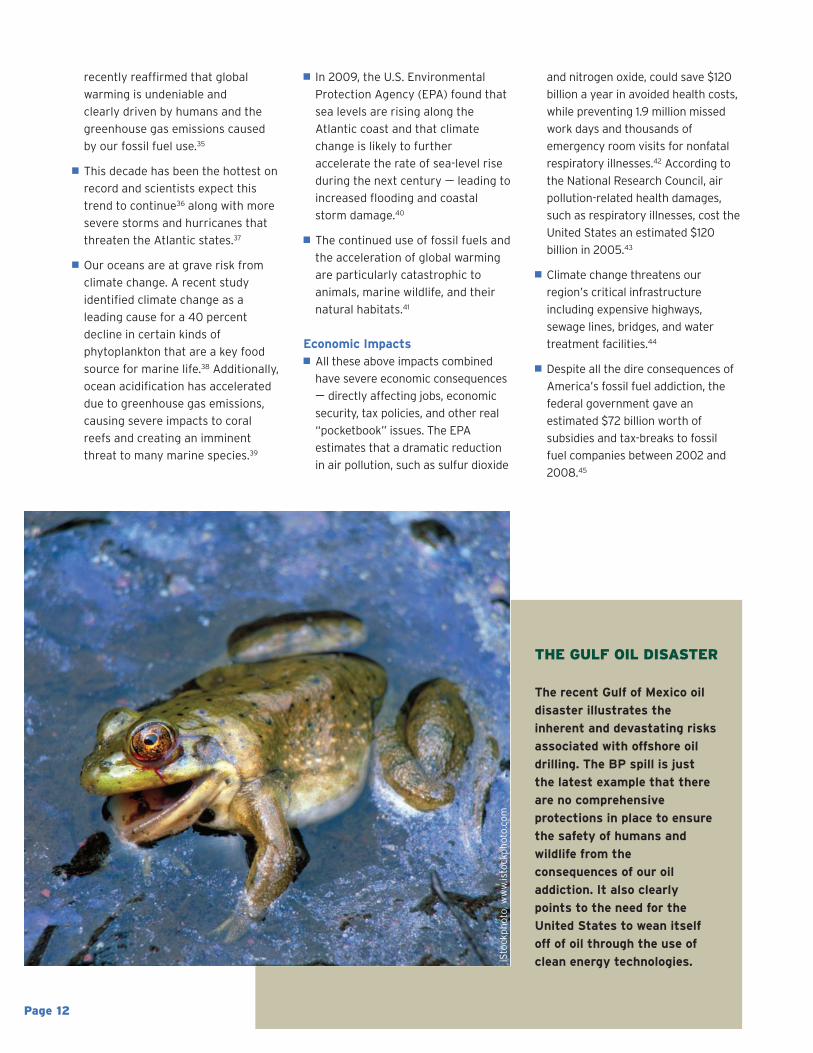
THE GULF OIL DISASTER
The recent Gulf of Mexico oil
disaster illustrates the
inherent and devastating risks
associated with offshore oil
drilling. The BP spill is just
the latest example that there
are no comprehensive
protections in place to ensure
the safety of humans and
wildlife from the
consequences of our oil
addiction. It also clearly
points to the need for the
United States to wean itself
off of oil through the use of
clean energy technologies. iStockphoto, w
ww.istockphoto.com
Page 12
recently reaffirmed that global
warming is undeniable and
clearly driven by humans and the
greenhouse gas emissions caused
by our fossil fuel use.35
� This decade has been the hottest on
record and scientists expect this
trend to continue36 along with more
severe storms and hurricanes that
threaten the Atlantic states.37
� Our oceans are at grave risk from
climate change. A recent study
identified climate change as a
leading cause for a 40 percent
decline in certain kinds of
phytoplankton that are a key food
source for marine life.38 Additionally,
ocean acidification has accelerated
due to greenhouse gas emissions,
causing severe impacts to coral
reefs and creating an imminent
threat to many marine species.39
� In 2009, the U.S. Environmental
Protection Agency (EPA) found that
sea levels are rising along the
Atlantic coast and that climate
change is likely to further
accelerate the rate of sea-level rise
during the next century —– leading to
increased flooding and coastal
storm damage.40
� The continued use of fossil fuels and
the acceleration of global warming
are particularly catastrophic to
animals, marine wildlife, and their
natural habitats.41
Economic Impacts� All these above impacts combined
have severe economic consequences
—– directly affecting jobs, economic
security, tax policies, and other real
“pocketbook” issues. The EPA
estimates that a dramatic reduction
in air pollution, such as sulfur dioxide
and nitrogen oxide, could save $120
billion a year in avoided health costs,
while preventing 1.9 million missed
work days and thousands of
emergency room visits for nonfatal
respiratory illnesses.42 According to
the National Research Council, air
pollution-related health damages,
such as respiratory illnesses, cost the
United States an estimated $120
billion in 2005.43
� Climate change threatens our
region’s critical infrastructure
including expensive highways,
sewage lines, bridges, and water
treatment facilities.44
� Despite all the dire consequences of
America’s fossil fuel addiction, the
federal government gave an
estimated $72 billion worth of
subsidies and tax-breaks to fossil
fuel companies between 2002 and
2008.45
Page 13
The Atlantic states have access to a
unique, home-grown resource that has
the potential to meet a significant
portion of the region’s energy needs.
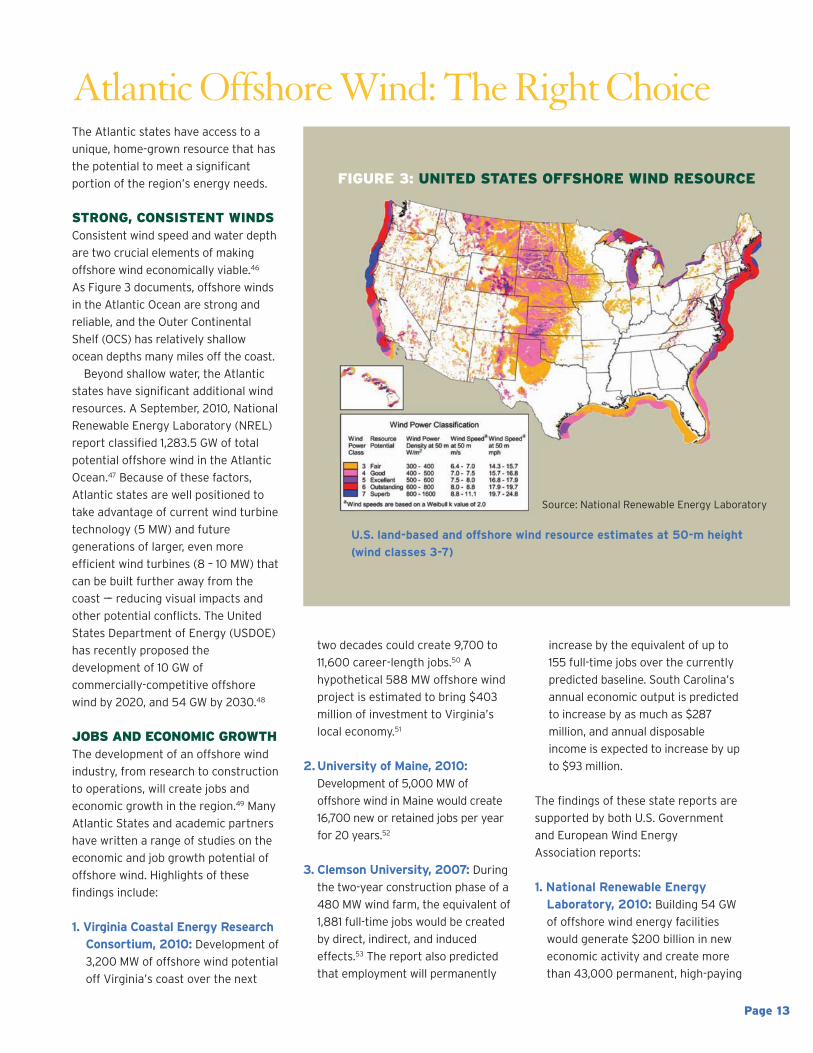
STRONG, CONSISTENT WINDSConsistent wind speed and water depth
are two crucial elements of making
offshore wind economically viable.46
As Figure 3 documents, offshore winds
in the Atlantic Ocean are strong and
reliable, and the Outer Continental
Shelf (OCS) has relatively shallow
ocean depths many miles off the coast.
Beyond shallow water, the Atlantic
states have significant additional wind
resources. A September, 2010, National
Renewable Energy Laboratory (NREL)
report classified 1,283.5 GW of total
potential offshore wind in the Atlantic
Ocean.47 Because of these factors,
Atlantic states are well positioned to
take advantage of current wind turbine
technology (5 MW) and future
generations of larger, even more
efficient wind turbines (8 – 10 MW) that
can be built further away from the
coast —– reducing visual impacts and
other potential conflicts. The United
States Department of Energy (USDOE)
has recently proposed the
development of 10 GW of
commercially-competitive offshore
wind by 2020, and 54 GW by 2030.48
JOBS AND ECONOMIC GROWTHThe development of an offshore wind
industry, from research to construction
to operations, will create jobs and
economic growth in the region.49 Many
Atlantic States and academic partners
have written a range of studies on the
economic and job growth potential of
offshore wind. Highlights of these
findings include:
1. Virginia Coastal Energy ResearchConsortium, 2010: Development of
3,200 MW of offshore wind potential
off Virginia’s coast over the next
two decades could create 9,700 to
11,600 career-length jobs.50 A
hypothetical 588 MW offshore wind
project is estimated to bring $403
million of investment to Virginia’s
local economy.51
2.University of Maine, 2010:Development of 5,000 MW of
offshore wind in Maine would create
16,700 new or retained jobs per year
for 20 years.52
3. Clemson University, 2007: Duringthe two-year construction phase of a
480 MW wind farm, the equivalent of
1,881 full-time jobs would be created
by direct, indirect, and induced
effects.53 The report also predicted
that employment will permanently
increase by the equivalent of up to
155 full-time jobs over the currently
predicted baseline. South Carolina’s
annual economic output is predicted
to increase by as much as $287
million, and annual disposable
income is expected to increase by up
to $93 million.
The findings of these state reports are
supported by both U.S. Government
and European Wind Energy
Association reports:
1. National Renewable EnergyLaboratory, 2010: Building 54 GWof offshore wind energy facilities
would generate $200 billion in new
economic activity and create more
than 43,000 permanent, high-paying
FIGURE 3: UNITED STATES OFFSHORE WIND RESOURCE
Atlantic Offshore Wind: The Right Choice
U.S. land-based and offshore wind resource estimates at 50-m height
(wind classes 3-7)
Source: National Renewable Energy Laboratory
Page 14
jobs in manufacturing, construction,
engineering, operations, and
maintenance.54 To maximize job
growth, it will be critical to grow the
offshore wind manufacturing sector
here in the United States, which
currently lags behind other nations
in this field.55
2. European Wind EnergyAssociation, 2009: Over 15 jobsare created in the European Union
for every MW of installed wind
capacity.56 More jobs are created by
installing, operating, and
maintaining offshore wind turbines
than onshore wind projects.57
Currently 41,396 European
individuals are employed with
offshore wind jobs in 2010.58 By
2030, the European Union expects
to host 215,000 offshore wind jobs.59
The largest costs of offshore wind
energy are from labor-intensive and
high paying job sectors, such as
research and development, wind
turbine and platform construction,
marine transport vessel construction
and operation, and overall
maintenance. These are quality jobs
that cannot be easily exported to
foreign countries. Growth in these
sectors also builds off of existing
strengths of the Atlantic coastal
economy and infrastructure, including
shipbuilding, fishing, port operations,
and other industries.
A BETTER INVESTMENT THANNEW FOSSIL FUEL PLANTSThe Atlantic states have a tremendous
opportunity to replace a fleet of aging
and dirty electric power plants with
offshore wind farms. According to a
recent industry analysis, “The long-
term economic viability of much of the
coal-fired generation facilities across
the U.S. is at risk … over the last
decade, less than 30 GW of power
plants have been retired in North
America, mostly representing old gas
and oil-fired steam generators. Over
the next 10 years, retirements could
double to 60 GW, mainly from coal
plants.”61
Despite current high initial capital
costs, offshore wind energy has no fuel
costs and is not subject to price
fluctuations that many states have
witnessed over the last five years due
to unpredictable natural gas and coal
prices. Offshore wind would also
diversify the region’s energy portfolio
—– which is necessary to ensure energy
security, price stability, and pollution
reductions.
The draft 2010 U.S. Department of
Energy strategic offshore wind plan
seeks to build 10 GW of offshore wind
by 2020 at a price of 13 cents/kWh and
54 GW by 2030 at 7 – 9 cents/kWh.62
The average price for electricity in the
New England region is 15 cents/kWh,
and 14.78 cents/kWh for the Middle
Atlantic region.63 These high prices
make offshore wind competitive.
iStockphoto, w
ww.istockphoto.com
iStockphoto, w
ww.istockphoto.com
Page 15
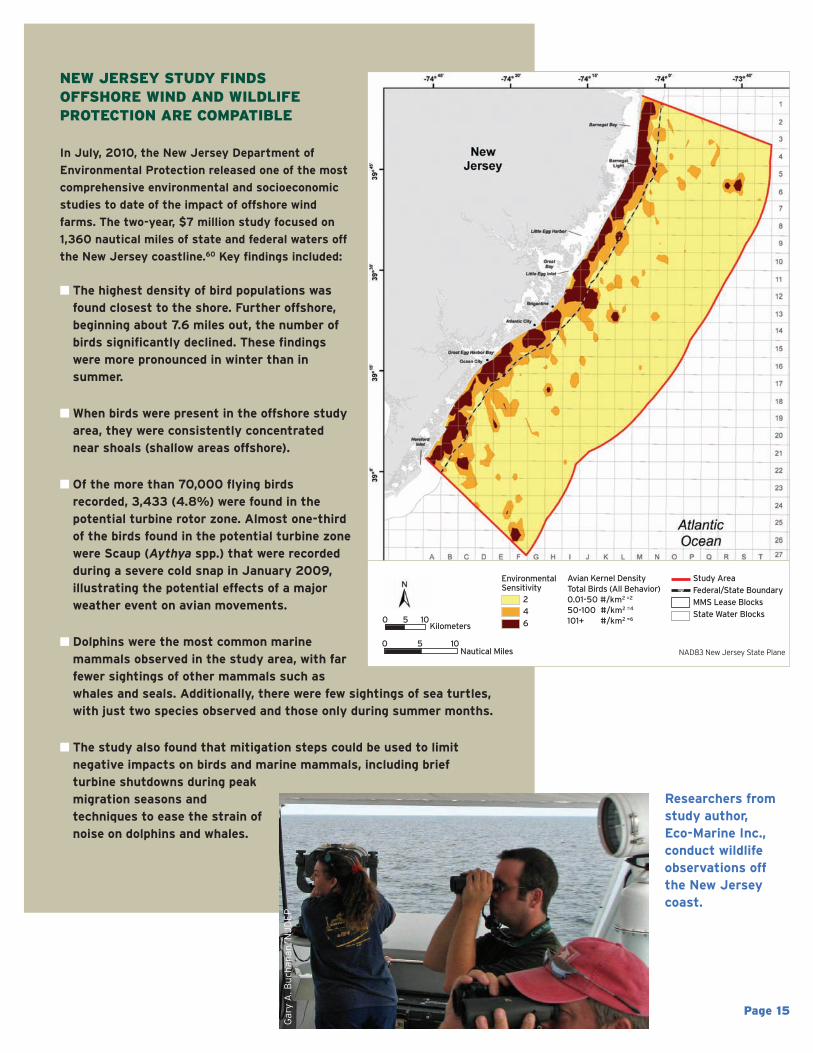
NEW JERSEY STUDY FINDS OFFSHORE WIND AND WILDLIFE PROTECTION ARE COMPATIBLE
In July, 2010, the New Jersey Department of
Environmental Protection released one of the most
comprehensive environmental and socioeconomic
studies to date of the impact of offshore wind
farms. The two-year, $7 million study focused on
1,360 nautical miles of state and federal waters off
the New Jersey coastline.60 Key findings included:
� The highest density of bird populations wasfound closest to the shore. Further offshore,beginning about 7.6 miles out, the number ofbirds significantly declined. These findingswere more pronounced in winter than insummer.
� When birds were present in the offshore studyarea, they were consistently concentratednear shoals (shallow areas offshore).
� Of the more than 70,000 flying birdsrecorded, 3,433 (4.8%) were found in thepotential turbine rotor zone. Almost one-thirdof the birds found in the potential turbine zonewere Scaup (Aythya spp.) that were recordedduring a severe cold snap in January 2009,illustrating the potential effects of a majorweather event on avian movements.
� Dolphins were the most common marinemammals observed in the study area, with farfewer sightings of other mammals such aswhales and seals. Additionally, there were few sightings of sea turtles,with just two species observed and those only during summer months.
� The study also found that mitigation steps could be used to limitnegative impacts on birds and marine mammals, including briefturbine shutdowns during peakmigration seasons andtechniques to ease the strain ofnoise on dolphins and whales.
Researchers fromstudy author, Eco-Marine Inc.,conduct wildlifeobservations offthe New Jerseycoast.
EnvironmentalSensitivity
NAD83 New Jersey State Plane
0 5 10
Avian Kernel Density Total Birds (All Behavior)0.01-50 #/km2 =2
50-100 #/km2 =4
101+ #/km2 =6
2
4
6
Study Area
Federal/State Boundary
MMS Lease Blocks
State Water Blocks
Kilometers
0 5 10Nautical Miles
Gary A. B
uchan
an, N
JDEP
Page 16
NICK RIGAS
Diversifying our nation’s energy portfolio to include clean,indigenous energy resources like offshore wind is not only aninvestment for today but for future generations. Our future, our
economy, our nation’ssecurity, and the health ofour environment can nolonger be held hostage byfossil fuel resources. Thisemerging industry needssupportive public policiesand new innovation torealize its full potential.
At Clemson University, weare committed to workingwith industry andgovernment leaders toaccelerate the introductionof new cutting-edgeoffshore wind technologiesinto the market throughour new wind turbine
testing facility — currently under construction. Our goal is tofacilitate the development of innovative offshore windtechnologies that can maximize energy generation and bringdown costs. As a university whose mission is educating the leadersof tomorrow, we are being proactive to help address thechallenges of offshore wind power. Offshore wind power is aclean, vital resource that can play a large role in our country’ssustainable future. Now we must capture this opportunity.
Nicholas C. Rigas, Ph.D. is Director of the renewable energy focus area of
Clemson University's Restoration Institute (CURI). Dr. Rigas also serves as the
Vice President of Project Development for EcoEnergy where he is responsible
for the development of more than 3,000 MW of wind power projects throughout
the Midwest and Arizona. He works at CURI to promote the development of
South Carolina’s indigenous clean energy resources for economic development,
energy security, improving the environment, and increasing the quality of life
for the state’s citizens.
Page 17
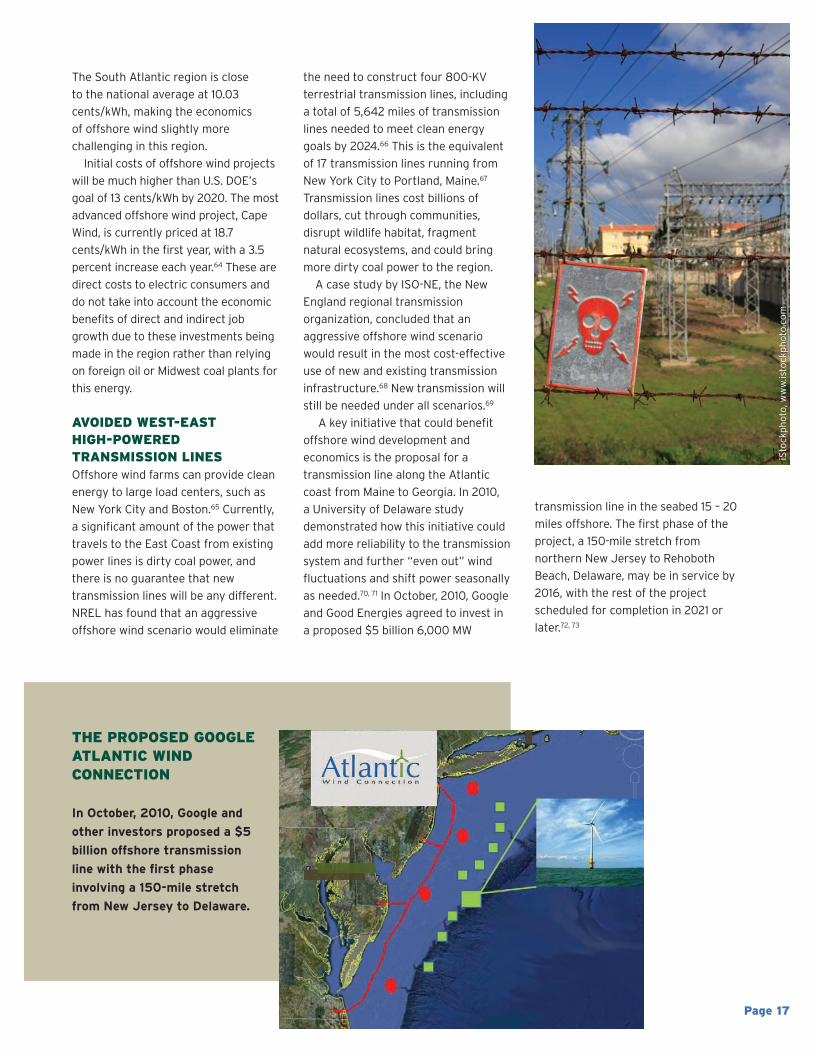
THE PROPOSED GOOGLEATLANTIC WIND CONNECTION
In October, 2010, Google and
other investors proposed a $5
billion offshore transmission
line with the first phase
involving a 150-mile stretch
from New Jersey to Delaware.
The South Atlantic region is close
to the national average at 10.03
cents/kWh, making the economics
of offshore wind slightly more
challenging in this region.
Initial costs of offshore wind projects
will be much higher than U.S. DOE’s
goal of 13 cents/kWh by 2020. The most
advanced offshore wind project, Cape
Wind, is currently priced at 18.7
cents/kWh in the first year, with a 3.5
percent increase each year.64 These are
direct costs to electric consumers and
do not take into account the economic
benefits of direct and indirect job
growth due to these investments being
made in the region rather than relying
on foreign oil or Midwest coal plants for
this energy.
AVOIDED WEST-EAST HIGH-POWEREDTRANSMISSION LINESOffshore wind farms can provide clean
energy to large load centers, such as
New York City and Boston.65 Currently,
a significant amount of the power that
travels to the East Coast from existing
power lines is dirty coal power, and
there is no guarantee that new
transmission lines will be any different.
NREL has found that an aggressive
offshore wind scenario would eliminate
the need to construct four 800-KV
terrestrial transmission lines, including
a total of 5,642 miles of transmission
lines needed to meet clean energy
goals by 2024.66 This is the equivalent
of 17 transmission lines running from
New York City to Portland, Maine.67
Transmission lines cost billions of
dollars, cut through communities,
disrupt wildlife habitat, fragment
natural ecosystems, and could bring
more dirty coal power to the region.
A case study by ISO-NE, the New
England regional transmission
organization, concluded that an
aggressive offshore wind scenario
would result in the most cost-effective
use of new and existing transmission
infrastructure.68 New transmission will
still be needed under all scenarios.69
A key initiative that could benefit
offshore wind development and
economics is the proposal for a
transmission line along the Atlantic
coast from Maine to Georgia. In 2010,
a University of Delaware study
demonstrated how this initiative could
add more reliability to the transmission
system and further “even out” wind
fluctuations and shift power seasonally
as needed.70, 71 In October, 2010, Google
and Good Energies agreed to invest in
a proposed $5 billion 6,000 MW
transmission line in the seabed 15 – 20
miles offshore. The first phase of the
project, a 150-mile stretch from
northern New Jersey to Rehoboth
Beach, Delaware, may be in service by
2016, with the rest of the project
scheduled for completion in 2021 or
later.72, 73
iStockphoto, w
ww.istockphoto.com
Page 18
PUBLIC ANDENVIRONMENTAL HEALTHBENEFITSWind produces energy with almost no
pollution, reducing a range of harmful
emissions such as mercury, smog-
forming pollution, and greenhouse
gases. As described earlier, fossil fuels
have significant negative public health
and environmental impacts. Renewable
energy, such as offshore wind, reduces
these impacts with substantial
economic benefits.
Based on federal government
calculations, installing 54 GW of
offshore wind energy would yield
enormous benefits, including
generating 172.8 million mWh of
electricity annually,74 enough energy to
replace 52 coal-fired plants.75
Generating an equivalent amount of
electricity from fossil fuels would emit
97.2 million metric tons of carbon
dioxide annually —– the equivalent
amount of carbon dioxide emitted by
almost 17.7 million cars annually76 and
by 14.5 million average households.77
REPOWERINGTRANSPORTATIONTo truly kick our oil addiction, America
must electrify the transportation sector.
Cars and trucks account for more than
60 percent of U.S. oil consumption.78
Offshore wind can play a critical role in
transitioning our fossil fuel-based
transportation system to clean energy.
Large scale adoption of electric vehicles
will increase our national demand for
electricity, particularly at night, but
offshore winds can help ensure that the
power that fuels our cars is the cleanest
possible. Projects across the United
States and overseas are installing and
testing “smart grid” and “vehicle to
grid” technologies that enable the grid
to “talk” with vehicle batteries when
they’re plugged in.79 These technologies
will help ensure vehicles are charged at
the cleanest and lowest-cost times.
Technology is also being tested to
assess the potential of wind power to
keep electric cars recharged, and to
maximize the potential of electric cars
to store wind and other renewable
energy for electric sector use.
MANY ATLANTIC STATES AREALREADY CLEAN ENERGYLEADERSMany Atlantic States have laid the
groundwork for a clean energy
economy by prioritizing pollution
limits, energy efficiency, and various
sources of renewable energy.
Highlights of these important
initiatives include:
� The Regional Greenhouse Gas
Initiative (RGGI), the first successful
mandatory market-based cap and
trade emissions reduction program
for carbon dioxide in the country;80
� New agreements to develop a Low
Carbon Fuel Standard and a
Transportation and Climate Initiative
to reduce emissions from
transportation;81
� State-mandated renewable energy
portfolio standards;82
� Energy efficiency program
advancements, where five of the
Northeast states rank in the top 10
nationally;83
� Major incentives for solar energy,
especially in New Jersey which has
been called “the Solar Capital of the
East;”84
� An expanding regional onshore wind
market, particularly in New York
which has 1,369 MW of onshore wind
energy operating or under
construction;85 and
� A wide range of biomass energy
projects, especially in Florida,
Georgia, and South Carolina.86
These forward-thinking energy
policies and programs provide a critical
foundation for dramatically increasing
offshore wind deployment in the
Atlantic states, diversifying the
region’s energy portfolio and moving
away from fossil fuel dependence.87
Siel via flickr.com
Page 19
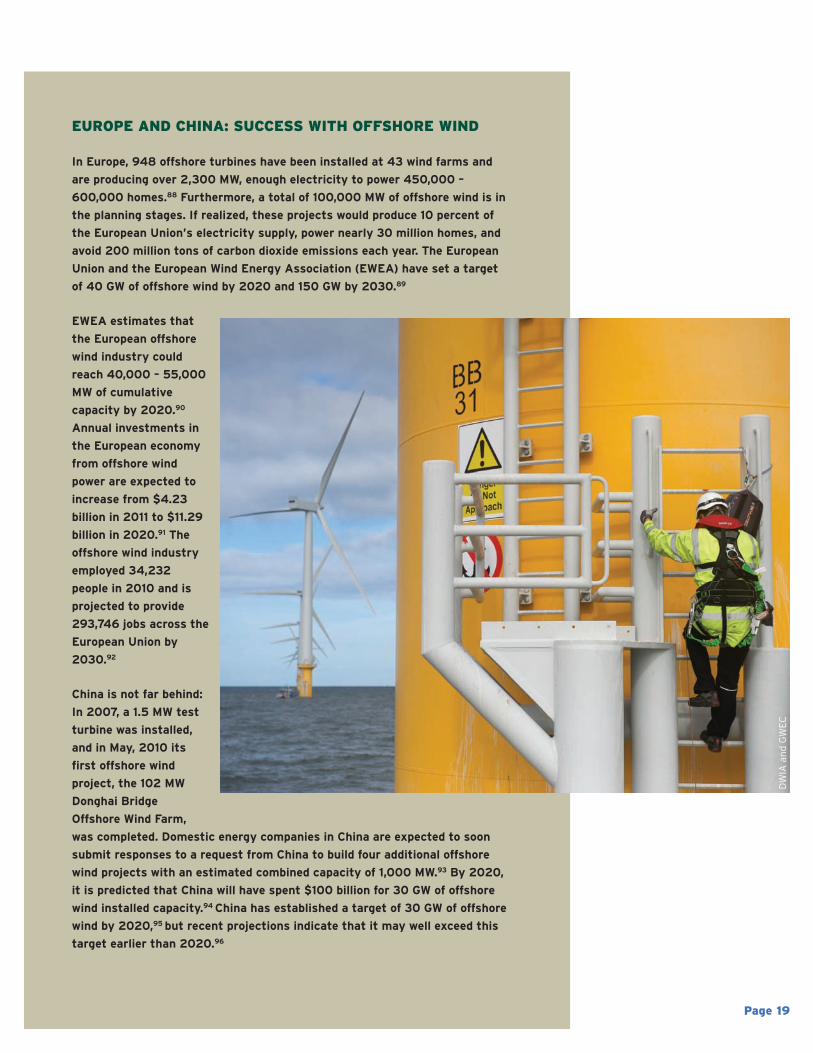
EUROPE AND CHINA: SUCCESS WITH OFFSHORE WIND
In Europe, 948 offshore turbines have been installed at 43 wind farms and
are producing over 2,300 MW, enough electricity to power 450,000 –
600,000 homes.88 Furthermore, a total of 100,000 MW of offshore wind is in
the planning stages. If realized, these projects would produce 10 percent of
the European Union’s electricity supply, power nearly 30 million homes, and
avoid 200 million tons of carbon dioxide emissions each year. The European
Union and the European Wind Energy Association (EWEA) have set a target
of 40 GW of offshore wind by 2020 and 150 GW by 2030.89
EWEA estimates that
the European offshore
wind industry could
reach 40,000 – 55,000
MW of cumulative
capacity by 2020.90
Annual investments in
the European economy
from offshore wind
power are expected to
increase from $4.23
billion in 2011 to $11.29
billion in 2020.91 The
offshore wind industry
employed 34,232
people in 2010 and is
projected to provide
293,746 jobs across the
European Union by
2030.92
China is not far behind:
In 2007, a 1.5 MW test
turbine was installed,
and in May, 2010 its
first offshore wind
project, the 102 MW
Donghai Bridge
Offshore Wind Farm,
was completed. Domestic energy companies in China are expected to soon
submit responses to a request from China to build four additional offshore
wind projects with an estimated combined capacity of 1,000 MW.93 By 2020,
it is predicted that China will have spent $100 billion for 30 GW of offshore
wind installed capacity.94 China has established a target of 30 GW of offshore
wind by 2020,95 but recent projections indicate that it may well exceed this
target earlier than 2020.96
DWIA and GWEC
Page 20
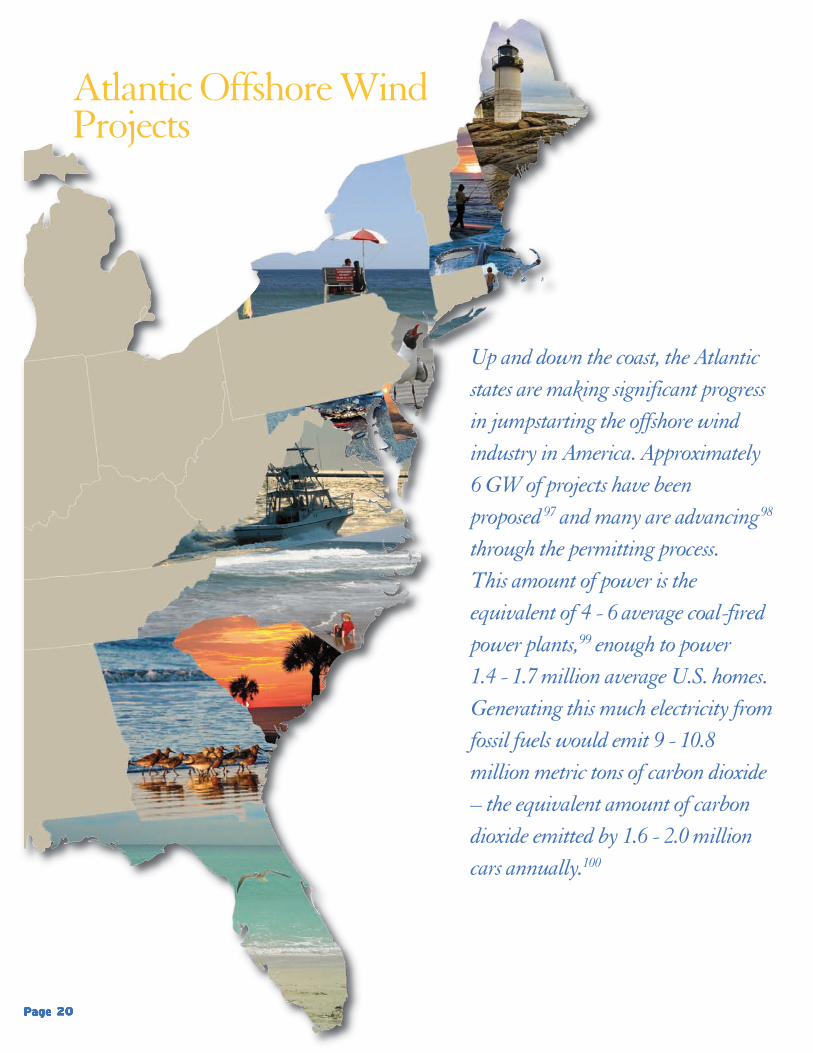
Atlantic Offshore WindProjects
Up and down the coast, the Atlanticstates are making significant progressin jumpstarting the offshore windindustry in America. Approximately6 GW of projects have beenproposed97 and many are advancing98
through the permitting process. This amount of power is theequivalent of 4 - 6 average coal-firedpower plants,99 enough to power 1.4 - 1.7 million average U.S. homes.Generating this much electricity fromfossil fuels would emit 9 - 10.8million metric tons of carbon dioxide– the equivalent amount of carbondioxide emitted by 1.6 - 2.0 millioncars annually.100
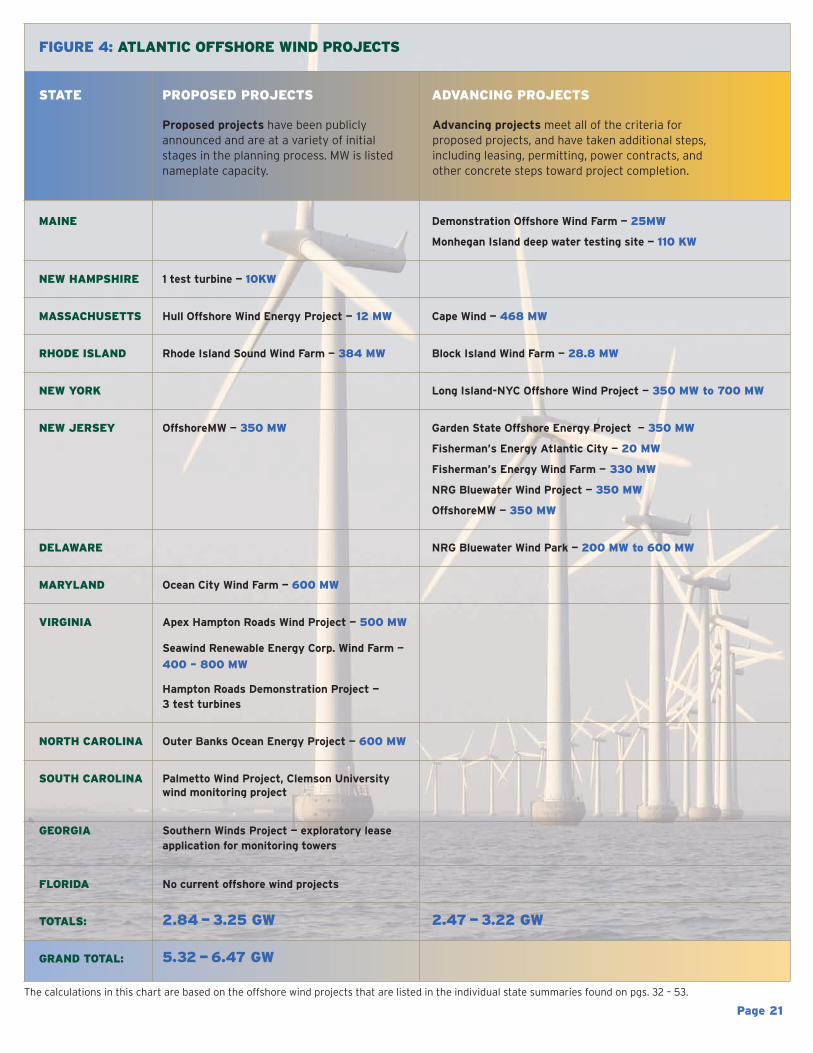
STATE PROPOSED PROJECTS ADVANCING PROJECTS
MAINE Demonstration Offshore Wind Farm — 25MW
Monhegan Island deep water testing site — 110 KW
NEW HAMPSHIRE 1 test turbine — 10KW
MASSACHUSETTS Hull Offshore Wind Energy Project — 12 MW Cape Wind — 468 MW
RHODE ISLAND Rhode Island Sound Wind Farm — 384 MW Block Island Wind Farm — 28.8 MW
NEW YORK Long Island-NYC Offshore Wind Project — 350 MW to 700 MW
NEW JERSEY OffshoreMW — 350 MW Garden State Offshore Energy Project — 350 MW
Fisherman’s Energy Atlantic City — 20 MW
Fisherman’s Energy Wind Farm — 330 MW
NRG Bluewater Wind Project — 350 MW
OffshoreMW — 350 MW
DELAWARE NRG Bluewater Wind Park — 200 MW to 600 MW
MARYLAND Ocean City Wind Farm — 600 MW
VIRGINIA Apex Hampton Roads Wind Project — 500 MW
Seawind Renewable Energy Corp. Wind Farm —
400 – 800 MW
Hampton Roads Demonstration Project — 3 test turbines
NORTH CAROLINA Outer Banks Ocean Energy Project — 600 MW
SOUTH CAROLINA Palmetto Wind Project, Clemson University wind monitoring project
GEORGIA Southern Winds Project — exploratory lease application for monitoring towers
FLORIDA No current offshore wind projects
TOTALS: 2.84—3.25 GW 2.47—3.22 GW
GRAND TOTAL: 5.32—6.47 GW
Page 21
FIGURE 4: ATLANTIC OFFSHORE WIND PROJECTS
Proposed projects have been publiclyannounced and are at a variety of initialstages in the planning process. MW is listednameplate capacity.
Advancing projects meet all of the criteria forproposed projects, and have taken additional steps,including leasing, permitting, power contracts, andother concrete steps toward project completion.
The calculations in this chart are based on the offshore wind projects that are listed in the individual state summaries found on pgs. 32 – 53.
Page 22
Federal and Regional Initiatives and PoliciesFEDERAL INITIATIVESThe Obama Administration has taken
several important steps to advance
offshore wind in the Atlantic Ocean,
including:
� Dramatically increasing investments
in clean energy, including funding
for offshore wind initiatives and
research.101
� Providing leadership by offering a
strategic vision on how the offshore
wind industry can become a major
U.S. industry, and setting goals for
wind development in general and
offshore wind specifically.102
� Fostering regional coordination,
including the establishment of the
Atlantic Offshore Wind Energy
Consortium, to coordinate the
efforts of coastal states and the
federal government to develop
offshore wind energy. The
Administration has also pledged to
establish a new Atlantic offshore
wind office to help states coordinate
and expedite offshore wind projects
off the Atlantic Coast and encourage
increased regional cooperation.103
� Working to improve the offshore
wind permitting process. In the wake
of the BP oil disaster, the Department
of the Interior tasked the new Bureau
of Ocean Energy Management,
Regulation, and Enforcement
(BOEMRE) to oversee the
development of energy and minerals
on the Outer Continental Shelf.104, 105
In November, 2010, Secretary Salazar
announced a series of steps that will
be pursued in the next year to
shorten the project permitting
timeline while ensuring thorough
environmental review. A federal and
state collaborative effort will identify
high priority offshore wind areas in
federal waters off of 6 – 8 Atlantic
states, with a new inter-agency
working group focused on ensuring
that sensitive resources are
considered and protected. The
administration will then lease these
high-potential, low-conflict areas to
wind developers through a quicker
process, shaving potentially a year or
two off the current timeline. Projects
will still require a full Environmental
Impact Statement and other permits
for final approval.106
� Approval of key leases, including
Cape Wind and wind monitoring
towers.107
� Issuing an Executive Order
establishing the National Ocean
Council (NOC), which is dedicated to
overseeing and implementing Task
Force recommendations to protect,
maintain, and restore the health and
biodiversity of the oceans, coast, and
Great Lakes. The NOC will facilitate
the development of ecosystem-
based coastal and marine spatial
plans, which are intended to broaden
the scope of considerations involved
in existing permitting for competing
offshore uses.108
� Establishing the Department of
Energy’s Offshore Wind Innovation
and Demonstration (OSWInD)
Initiative —- a set of planned
activities, subject to appropriations,
that will promote and accelerate
responsible commercial offshore
wind development in the U.S. by
addressing two critical objectives:
lowering the cost of energy
produced by offshore wind turbines
and reducing the timeline for
deploying wind turbines.
Shutterstock Im
ages, w
ww.shutterstock.com
REGIONAL INITIATIVESThe Atlantic States have formed
various regional offshore wind and
related initiatives, including:
� Atlantic Offshore Wind Energy
Consortium: In June, 2010,
Secretary Salazar signed a
Memorandum of Understanding with
10 Atlantic Governors to create the
Atlantic Offshore Wind Energy
Consortium, a formal partnership to
advance the region’s offshore wind
efforts by facilitating cooperation on
critical issues such as transmission,
improving market demand for
offshore wind, and creating local job
opportunities.113
� The U.S. Offshore Wind
Collaborative: A nonprofit working
to bring states, federal agencies,
industry, and the environmental
community to the table to advance
a sustainable offshore wind industry
in America.114
� The American Wind Energy
Association (AWEA) Offshore Wind
Working Group: An AWEA
subcommittee that coordinates
information exchange among AWEA
members and stakeholders.115
� Offshore Wind Development
Coalition: In July, 2010,
OffshoreWindDC was founded in
cooperation with AWEA and a group
of seven U.S. offshore wind
developers to promote offshore wind
energy through advocacy and
education.116
� Regional Ocean Councils:
Three regional councils exist to
collaboratively address the region’s
priority ocean issues, such as
offshore wind development, including:
Northeast Regional Ocean Council;
Mid-Atlantic Regional Ocean Council;
and the South Atlantic Alliance.117
�Regional Ocean Observing
Systems: The Northeastern
Regional Association of Coastal
Ocean Observing Systems
(NERACOOS), Mid-Atlantic Coastal
Ocean Observing Regional
Association (MACOORA), and the
Southeast Coastal Ocean Observing
Regional Association (SECOORA)
provide the primary framework to
coordinate ocean observing
activities and are responsible for the
design and coordinated operation of
sub-regional coastal ocean
observing systems within their
respective regions.118
� Governors’ Wind Energy Coalition:
A bipartisan coalition of 29
governors, which offers
recommendations to Congress on
offshore wind development issues,
including permitting processes and
transmission infrastructure.119
Page 23
Dong Energy
In 2010, Congress considered but did
not take final action on several
offshore energy initiatives, including:
� The Program for Offshore Wind
Energy Research and Development
(POWERED) Act of 2010:
Introduced in April, 2010, by a group
of bipartisan U.S. Senators, the act
would provide grants to conduct
research and analysis on
implementation of offshore wind
power projects, expand incentives
for offshore wind development, and
require the U.S. DOE to develop a
comprehensive roadmap to
overcome the technical and
regulatory barriers to deployment
of offshore wind.109
� Carper-Snowe-Brown-Collins
Offshore Wind Bill: Introduced in
the Senate in May, 2010, this
bipartisan bill would provide the
offshore wind industry with
enhanced stability by extending
production and investment tax
credits for offshore wind until
2020.110
� House amendments to the “Spill
Bill”: In response to the BP oil
disaster, the House passed the
Consolidated Land, Energy and
Aquatic Resources (CLEAR) Act (H.R.
3534), which addresses oil drilling
directly but also amends existing
Outer Continental Shelf (OCS)
leasing regulations, requiring “a
more balanced approach to energy
development that acknowledges the
other resources of the OCS, and to
emphasize that energy-related
activities should be conducted in a
manner that minimizes impacts to
the marine, coastal, and human
environments.”111 A companion
Senate bill was drafted in August,
2010 and awaits action by the
Senate.112
The Atlantic Ocean and its estuaries
and coastal areas are home to a rich
array of fish and wildlife species.
While extensive research in Europe
reveals that offshore wind projects do
not appear to have long-term or
large-scale impacts,120 major data gaps
for the Atlantic Ocean still exist and
site-specific impacts need to be
evaluated. A coordinated,
comprehensive, and well-funded effort
is needed to address these gaps and
improve the permitting process. Such
an effort would better inform the
public and decision-makers on the
extent of potential environmental
impacts, reduce research costs and
environmental requirements for
project developers, increase
community acceptance, and reduce
risks to financial investors. Currently,
the burden for this research has
unfairly fallen on the first generation
of individual project developers.121
The U.S. Department of Energy’s
“20% Wind Energy By 2030” report
discusses Europe’s major scientific
effort to study the environmental and
human effects from installed offshore
wind facilities, including over 280
research studies and assessments
currently underway. The report
concludes:
Denmark has conducted themost extensive before-after-control-impact study in theworld. The most recentenvironmental monitoringprogram from this study,spanning more than five years,concluded that none of thepotential ecological risks appearto have long-term or large-scaleimpacts (DEA 2006).122
European studies are useful, but
different conditions do exist in the
Atlantic. As with any major
construction activity, sound science
should guide the development of siting
standards to help developers avoid,
minimize, and mitigate direct and
indirect impacts of wind energy on our
ocean resources. Atlantic Coast
habitats and environmental resources
that may be directly or indirectly
impacted by offshore wind include
seafloor habitats, coastal habitats,
fishery resources, marine mammals,
marine and coastal birds, and bats.123
Fishery resources can be impacted
by offshore space-use conflicts,
artificial reef effects, habitat
alteration, noise from pile driving, and
effects from electromagnetic fields.124
Benthic studies have found that the
addition of hard structures associated
with wind turbine monopoles in the
North Sea actually increase local
aquatic diversity.125 The artificial reef
effect from offshore wind is likely to
change localized fisheries, making
them more or less productive for
fishermen.126 While more studies are
needed, certain approaches to mitigate
impacts on fishery resources can be
utilized. Bubble-curtains, air gaps, and
the quietest equipment and techniques
can potentially reduce the temporary
and localized noise impacts from pile
driving. Habitat alteration from power
cables could be avoided through
alternative routes or minimized
through horizontal directional drilling,
while burying cables and properly
shielding them could help reduce
electromagnetic fields.127
Baseline information that would help
predict the presence and absence of
certain marine mammals off the
Atlantic Coast remains limited, and
increasing our understanding of key
species’ life history traits and critical
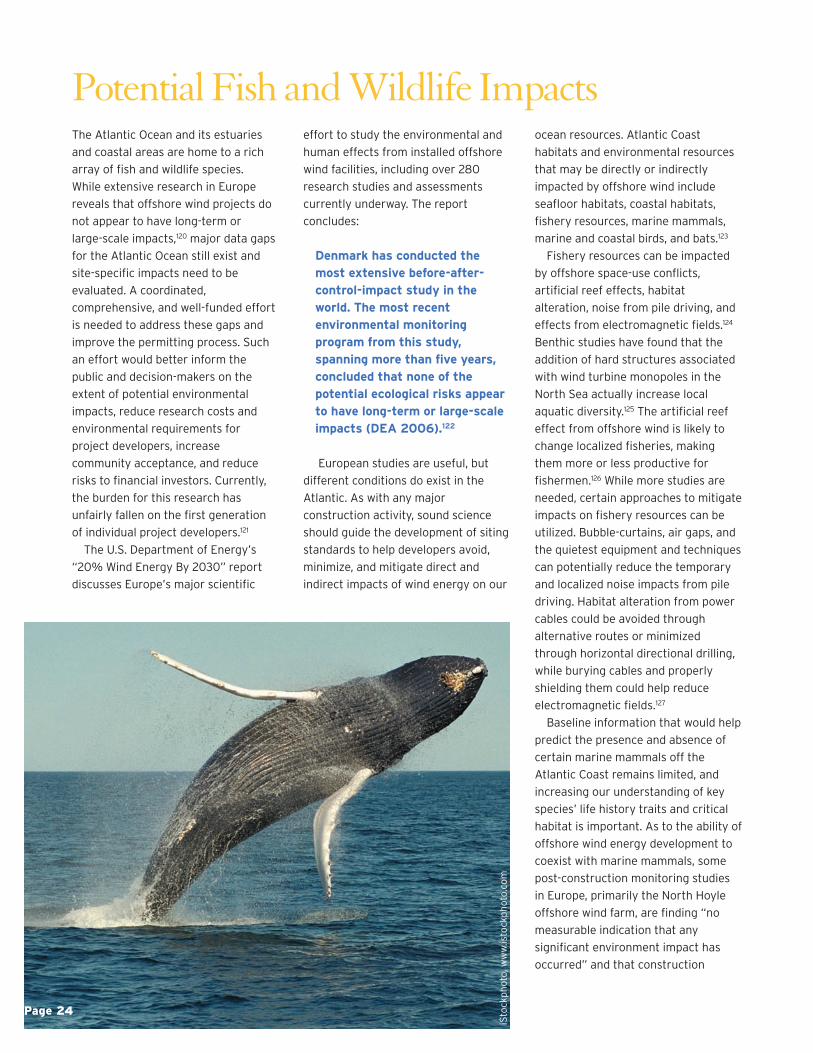
habitat is important. As to the ability of
offshore wind energy development to
coexist with marine mammals, some
post-construction monitoring studies
in Europe, primarily the North Hoyle
offshore wind farm, are finding “no
measurable indication that any
significant environment impact has
occurred” and that construction
Potential Fish and Wildlife Impacts
iStockphoto, w
ww.istockphoto.com
Page 24
Page 25
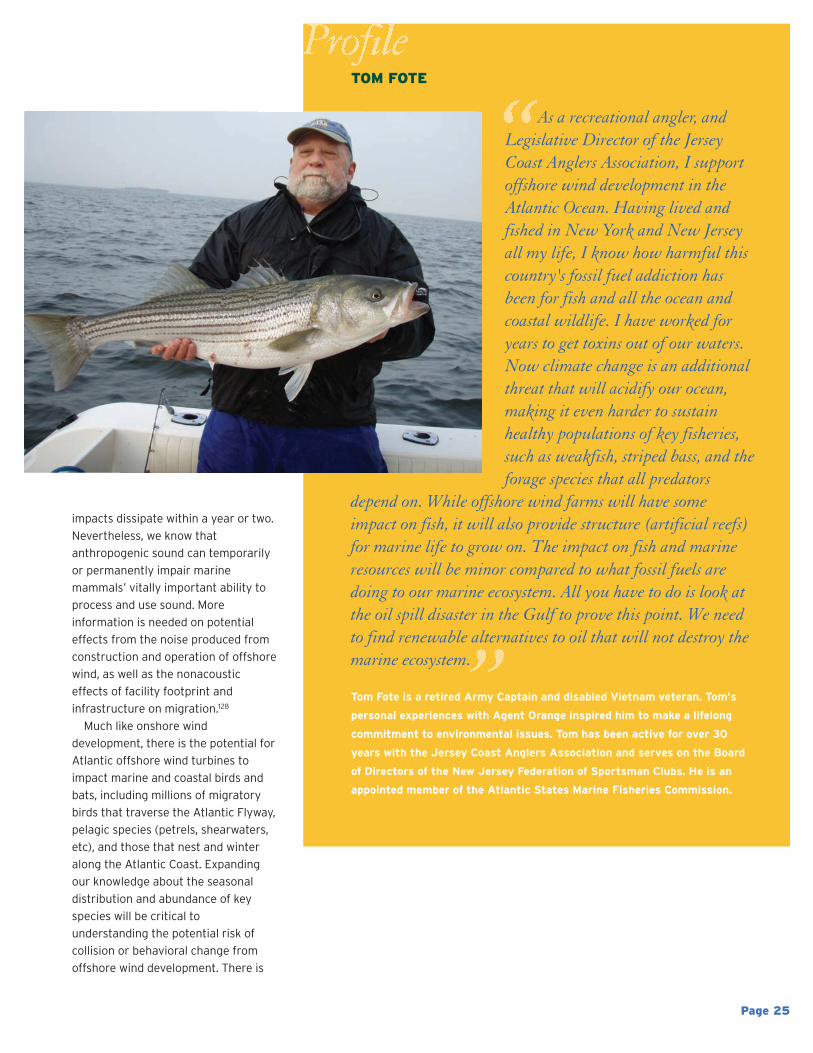
TOM FOTE
As a recreational angler, andLegislative Director of the JerseyCoast Anglers Association, I supportoffshore wind development in theAtlantic Ocean. Having lived andfished in New York and New Jerseyall my life, I know how harmful thiscountry's fossil fuel addiction hasbeen for fish and all the ocean andcoastal wildlife. I have worked foryears to get toxins out of our waters.Now climate change is an additionalthreat that will acidify our ocean,making it even harder to sustainhealthy populations of key fisheries,such as weakfish, striped bass, and theforage species that all predators
depend on. While offshore wind farms will have someimpact on fish, it will also provide structure (artificial reefs)for marine life to grow on. The impact on fish and marineresources will be minor compared to what fossil fuels aredoing to our marine ecosystem. All you have to do is look atthe oil spill disaster in the Gulf to prove this point. We needto find renewable alternatives to oil that will not destroy themarine ecosystem.
Tom Fote is a retired Army Captain and disabled Vietnam veteran. Tom’s
personal experiences with Agent Orange inspired him to make a lifelong
commitment to environmental issues. Tom has been active for over 30
years with the Jersey Coast Anglers Association and serves on the Board
of Directors of the New Jersey Federation of Sportsman Clubs. He is an
appointed member of the Atlantic States Marine Fisheries Commission.
impacts dissipate within a year or two.
Nevertheless, we know that
anthropogenic sound can temporarily
or permanently impair marine
mammals’ vitally important ability to
process and use sound. More
information is needed on potential
effects from the noise produced from
construction and operation of offshore
wind, as well as the nonacoustic
effects of facility footprint and
infrastructure on migration.128
Much like onshore wind
development, there is the potential for
Atlantic offshore wind turbines to
impact marine and coastal birds and
bats, including millions of migratory
birds that traverse the Atlantic Flyway,
pelagic species (petrels, shearwaters,
etc), and those that nest and winter
along the Atlantic Coast. Expanding
our knowledge about the seasonal
distribution and abundance of key
species will be critical to
understanding the potential risk of
collision or behavioral change from
offshore wind development. There is
Page 26
o threatened or endangered
species habitats; and
o areas critical to migration,
breeding, wintering, or other
sensitive life stages needed to
sustain healthy populations of
wildlife.
� Steer projects further offshore, thus
helping avoid environmental and
other potential conflicts, such as
military needs and navigation.
In general, avian species abundance
and diversity declines further from
the shoreline.129
� Utilize best management practices
and mitigation strategies to
minimize project risks.
� Establish comprehensive monitoring
programs that facilitate an adaptive
management approach to projects
and support continuous
improvement in project
development.
� Ensure that funds are available to
address unavoidable impacts on fish
and wildlife, including cumulative
impacts.
� Consider future shifts in wildlife
geographic ranges and other
ecological changes that will result
from climate change.
� Gather information on cumulative
impacts and integrate such
information into decision-making
processes.
� Address potential impacts on
commercial and recreation fisheries,
transportation routes and vessel
traffic safety, scenic resources,
coastal communities, historic and
cultural resources (including
shipwrecks), radar, military
readiness, and other technical
challenges.
� Ensure a meaningful opportunity for
stakeholders to comment and shape
proposals.
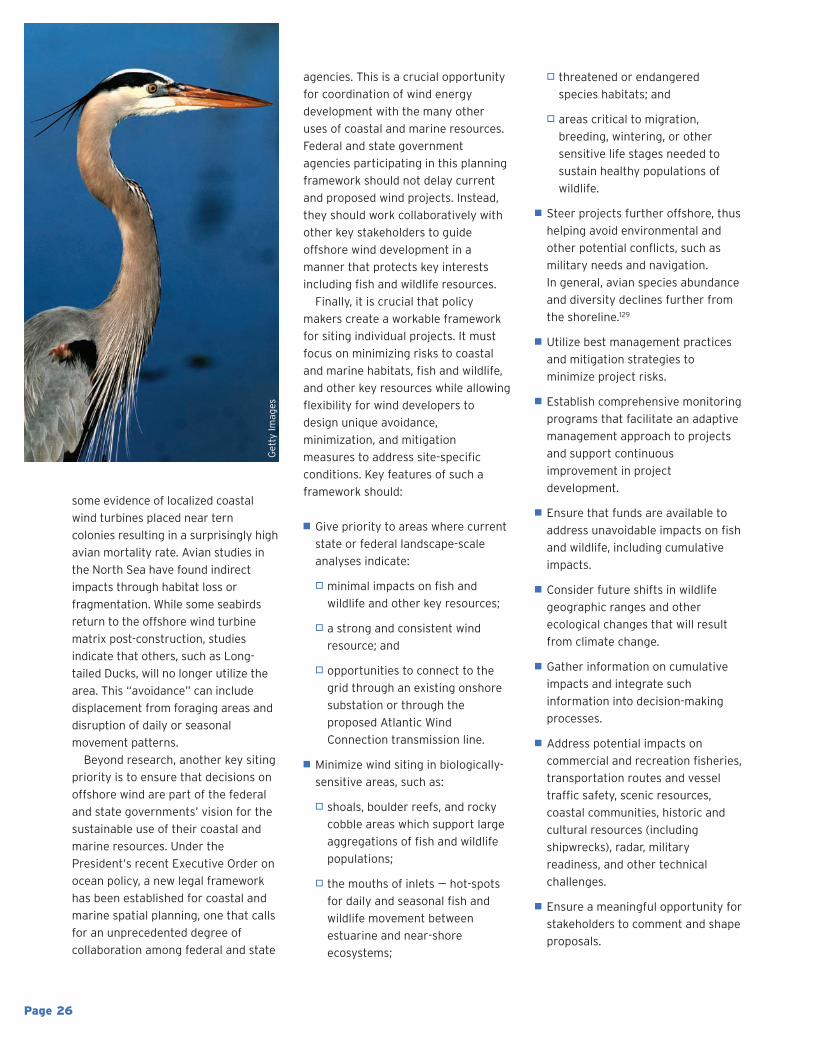
some evidence of localized coastal
wind turbines placed near tern
colonies resulting in a surprisingly high
avian mortality rate. Avian studies in
the North Sea have found indirect
impacts through habitat loss or
fragmentation. While some seabirds
return to the offshore wind turbine
matrix post-construction, studies
indicate that others, such as Long-
tailed Ducks, will no longer utilize the
area. This “avoidance” can include
displacement from foraging areas and
disruption of daily or seasonal
movement patterns.
Beyond research, another key siting
priority is to ensure that decisions on
offshore wind are part of the federal
and state governments’ vision for the
sustainable use of their coastal and
marine resources. Under the
President’s recent Executive Order on
ocean policy, a new legal framework
has been established for coastal and
marine spatial planning, one that calls
for an unprecedented degree of
collaboration among federal and state
agencies. This is a crucial opportunity
for coordination of wind energy
development with the many other
uses of coastal and marine resources.
Federal and state government
agencies participating in this planning
framework should not delay current
and proposed wind projects. Instead,
they should work collaboratively with
other key stakeholders to guide
offshore wind development in a
manner that protects key interests
including fish and wildlife resources.
Finally, it is crucial that policy
makers create a workable framework
for siting individual projects. It must
focus on minimizing risks to coastal
and marine habitats, fish and wildlife,
and other key resources while allowing
flexibility for wind developers to
design unique avoidance,
minimization, and mitigation
measures to address site-specific
conditions. Key features of such a
framework should:
� Give priority to areas where current
state or federal landscape-scale
analyses indicate:
o minimal impacts on fish and
wildlife and other key resources;
o a strong and consistent wind
resource; and
o opportunities to connect to the
grid through an existing onshore
substation or through the
proposed Atlantic Wind
Connection transmission line.
� Minimize wind siting in biologically-
sensitive areas, such as:
o shoals, boulder reefs, and rocky
cobble areas which support large
aggregations of fish and wildlife
populations;
o the mouths of inlets —– hot-spots
for daily and seasonal fish and
wildlife movement between
estuarine and near-shore
ecosystems;
Getty Im
ages
Page 27
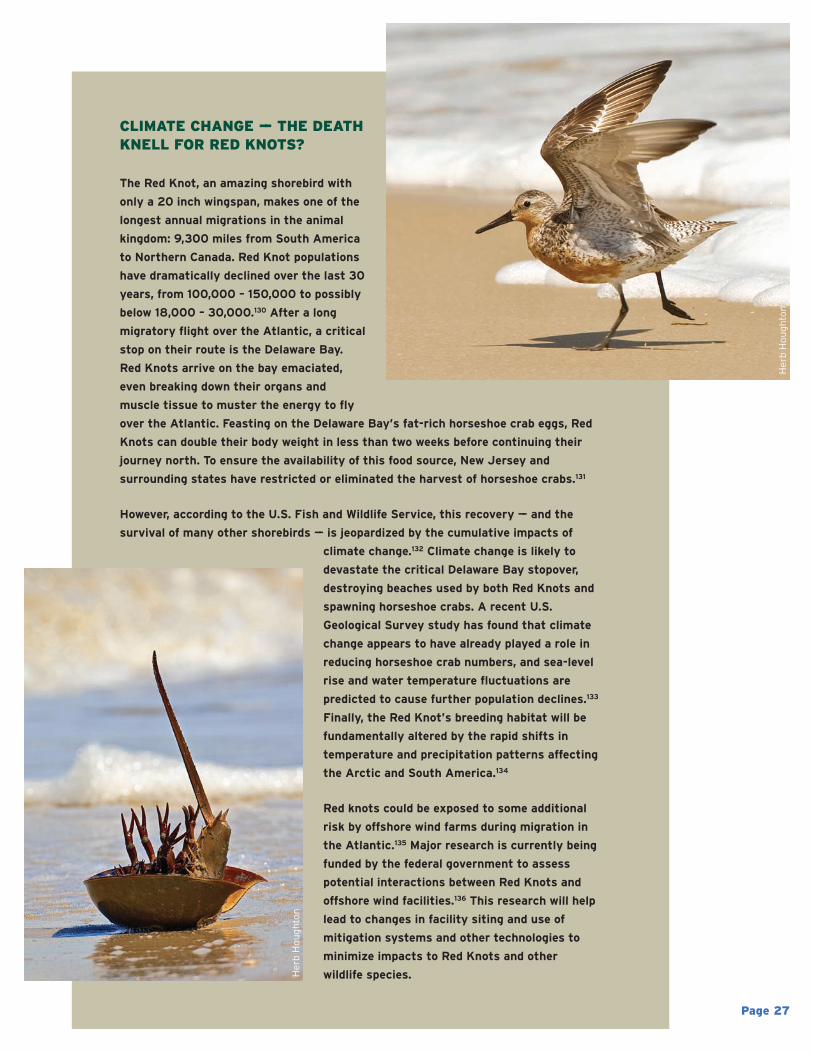
CLIMATE CHANGE —– THE DEATHKNELL FOR RED KNOTS?
The Red Knot, an amazing shorebird with
only a 20 inch wingspan, makes one of the
longest annual migrations in the animal
kingdom: 9,300 miles from South America
to Northern Canada. Red Knot populations
have dramatically declined over the last 30
years, from 100,000 – 150,000 to possibly
below 18,000 – 30,000.130 After a long
migratory flight over the Atlantic, a critical
stop on their route is the Delaware Bay.
Red Knots arrive on the bay emaciated,
even breaking down their organs and
muscle tissue to muster the energy to fly
over the Atlantic. Feasting on the Delaware Bay’s fat-rich horseshoe crab eggs, Red
Knots can double their body weight in less than two weeks before continuing their
journey north. To ensure the availability of this food source, New Jersey and
surrounding states have restricted or eliminated the harvest of horseshoe crabs.131
However, according to the U.S. Fish and Wildlife Service, this recovery —– and the
survival of many other shorebirds —– is jeopardized by the cumulative impacts of
climate change.132 Climate change is likely to
devastate the critical Delaware Bay stopover,
destroying beaches used by both Red Knots and
spawning horseshoe crabs. A recent U.S.
Geological Survey study has found that climate
change appears to have already played a role in
reducing horseshoe crab numbers, and sea-level
rise and water temperature fluctuations are
predicted to cause further population declines.133
Finally, the Red Knot’s breeding habitat will be
fundamentally altered by the rapid shifts in
temperature and precipitation patterns affecting
the Arctic and South America.134
Red knots could be exposed to some additional
risk by offshore wind farms during migration in
the Atlantic.135 Major research is currently being
funded by the federal government to assess
potential interactions between Red Knots and
offshore wind facilities.136 This research will help
lead to changes in facility siting and use of
mitigation systems and other technologies to
minimize impacts to Red Knots and other
wildlife species.
Herb Houghton
Herb Houghton
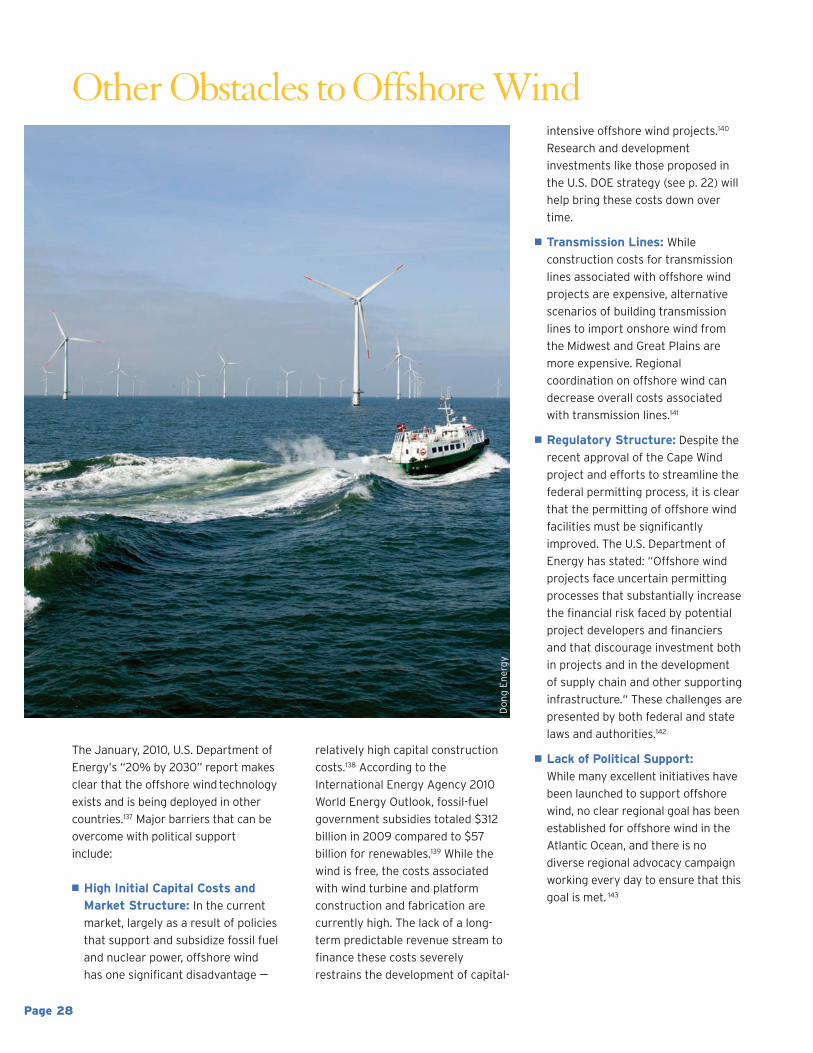
The January, 2010, U.S. Department of
Energy’s “20% by 2030” report makes
clear that the offshore wind technology
exists and is being deployed in other
countries.137 Major barriers that can be
overcome with political support
include:
� High Initial Capital Costs andMarket Structure: In the currentmarket, largely as a result of policies
that support and subsidize fossil fuel
and nuclear power, offshore wind
has one significant disadvantage —–
relatively high capital construction
costs.138 According to the
International Energy Agency 2010
World Energy Outlook, fossil-fuel
government subsidies totaled $312
billion in 2009 compared to $57
billion for renewables.139 While the
wind is free, the costs associated
with wind turbine and platform
construction and fabrication are
currently high. The lack of a long-
term predictable revenue stream to
finance these costs severely
restrains the development of capital-
intensive offshore wind projects.140
Research and development
investments like those proposed in
the U.S. DOE strategy (see p. 22) will
help bring these costs down over
time.
� Transmission Lines: While
construction costs for transmission
lines associated with offshore wind
projects are expensive, alternative
scenarios of building transmission
lines to import onshore wind from
the Midwest and Great Plains are
more expensive. Regional
coordination on offshore wind can
decrease overall costs associated
with transmission lines.141
� Regulatory Structure: Despite therecent approval of the Cape Wind
project and efforts to streamline the
federal permitting process, it is clear
that the permitting of offshore wind
facilities must be significantly
improved. The U.S. Department of
Energy has stated: “Offshore wind
projects face uncertain permitting
processes that substantially increase
the financial risk faced by potential
project developers and financiers
and that discourage investment both
in projects and in the development
of supply chain and other supporting
infrastructure.“ These challenges are
presented by both federal and state
laws and authorities.142
� Lack of Political Support: While many excellent initiatives have
been launched to support offshore
wind, no clear regional goal has been
established for offshore wind in the
Atlantic Ocean, and there is no
diverse regional advocacy campaign
working every day to ensure that this
goal is met. 143
Page 28
Other Obstacles to Offshore Wind
Dong Energy
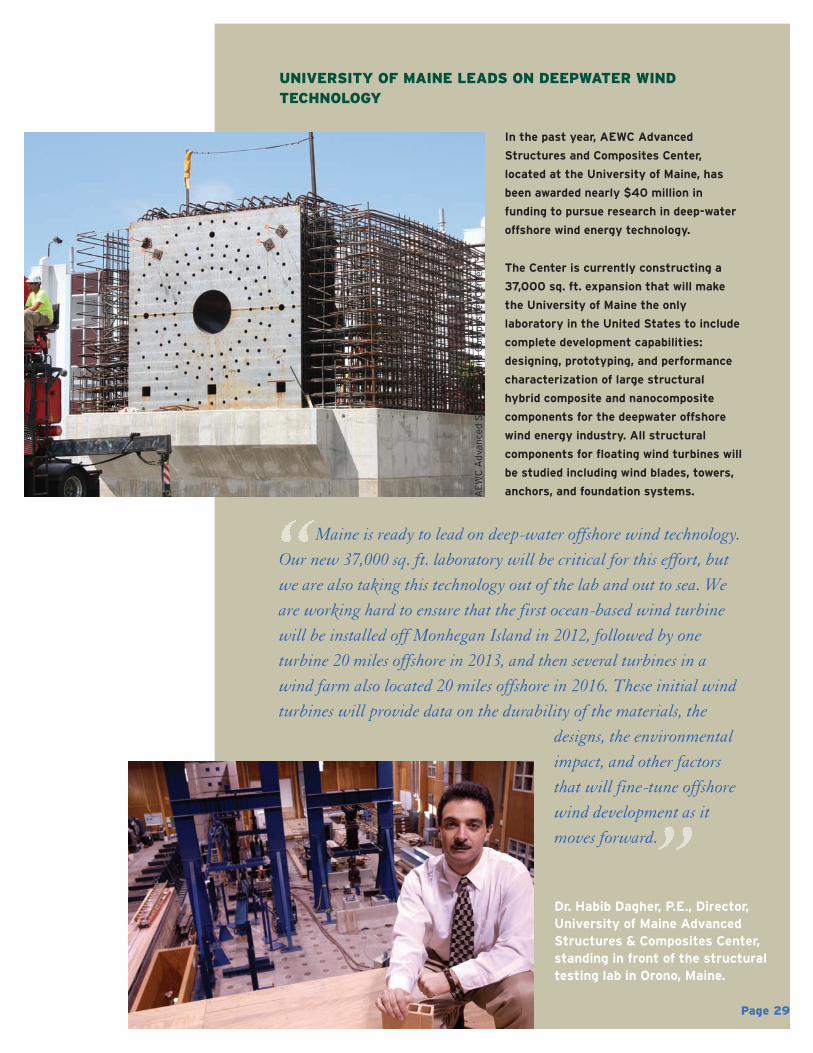
UNIVERSITY OF MAINE LEADS ON DEEPWATER WIND TECHNOLOGY
In the past year, AEWC Advanced
Structures and Composites Center,
located at the University of Maine, has
been awarded nearly $40 million in
funding to pursue research in deep-water
offshore wind energy technology.
The Center is currently constructing a
37,000 sq. ft. expansion that will make
the University of Maine the only
laboratory in the United States to include
complete development capabilities:
designing, prototyping, and performance
characterization of large structural
hybrid composite and nanocomposite
components for the deepwater offshore
wind energy industry. All structural
components for floating wind turbines will
be studied including wind blades, towers,
anchors, and foundation systems.
Maine is ready to lead on deep-water offshore wind technology.Our new 37,000 sq. ft. laboratory will be critical for this effort, butwe are also taking this technology out of the lab and out to sea. Weare working hard to ensure that the first ocean-based wind turbinewill be installed off Monhegan Island in 2012, followed by oneturbine 20 miles offshore in 2013, and then several turbines in awind farm also located 20 miles offshore in 2016. These initial windturbines will provide data on the durability of the materials, the
designs, the environmentalimpact, and other factorsthat will fine-tune offshorewind development as itmoves forward.
AEWC Advanced Structures an
d Composites Cen
ter
Dr. Habib Dagher, P.E., Director,University of Maine AdvancedStructures & Composites Center,standing in front of the structuraltesting lab in Orono, Maine.
Page 29
A man goes out on the beach andsees that it is covered with starfishthat have washed up in the tide. A little boy is walking along, pickingthem up and throwing them backinto the water.
‘What are you doing, son?’ the manasks.‘You see how many starfish thereare? You’ll never make a difference.’
The boy paused thoughtfully, pickedup another starfish,and threw it into the ocean.
‘It sure made adifference to that one,’ he said.
Next Steps: Realizing the Potentialof Offshore Wind
You may delay, but time will not.“ Benjamin Franklin144”In the race to become a world leader in
offshore wind, Atlantic states already
lag behind Europe and China. The race,
however, is far from over. As
documented in this report, states up
and down the Atlantic coast have just
joined the race: wind monitoring buoys
are being deployed in South Carolina;
Cape Wind in Massachusetts has its
critical federal approvals; and Maine
has broken ground on a deepwater
testing facility.
Just like the boy in the parable, we
must start somewhere on this long
journey.
Offshore wind is a unique resource
that holds the potential to
fundamentally alter the way Atlantic
state residents power their homes and
businesses and fuel their cars —–
creating jobs, energy independence,
less pollution, economic growth, and
stable energy prices well into the
future.
Hawaiian parable145
Page 30
iStockphoto, w
ww.istockphoto.com
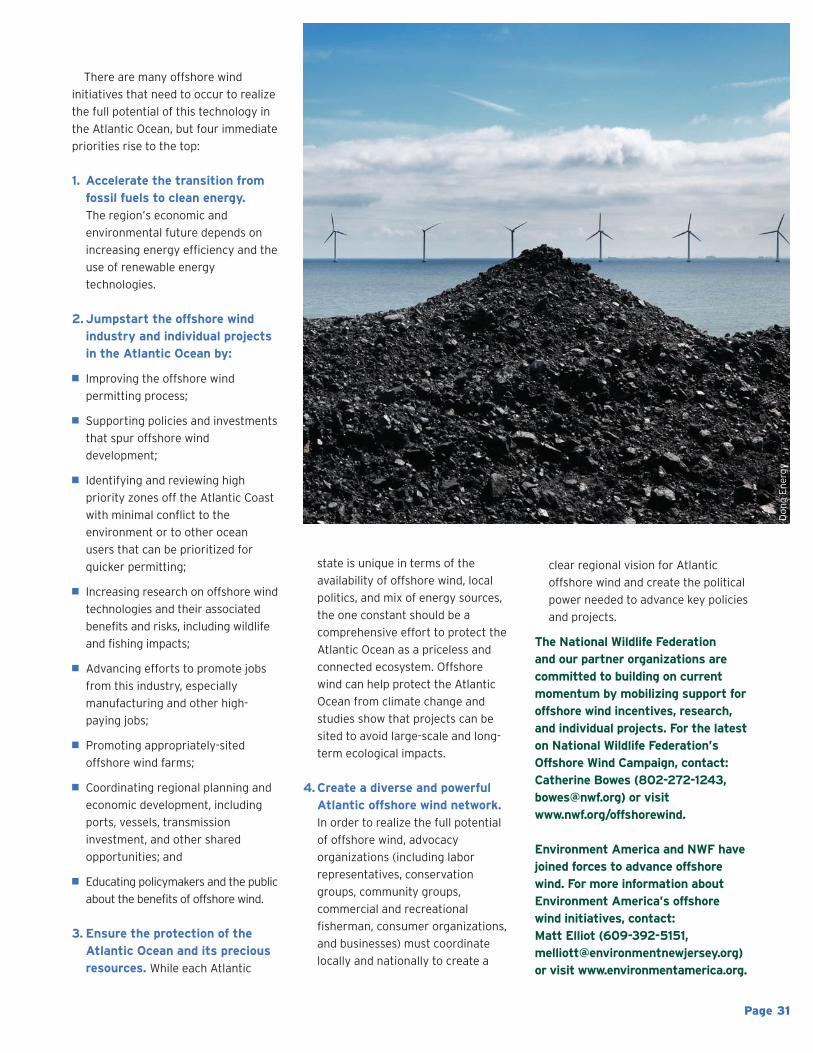
Page 31
There are many offshore wind
initiatives that need to occur to realize
the full potential of this technology in
the Atlantic Ocean, but four immediate
priorities rise to the top:
1. Accelerate the transition fromfossil fuels to clean energy. The region’s economic and
environmental future depends on
increasing energy efficiency and the
use of renewable energy
technologies.
2.Jumpstart the offshore windindustry and individual projectsin the Atlantic Ocean by:
� Improving the offshore wind
permitting process;
� Supporting policies and investments
that spur offshore wind
development;
� Identifying and reviewing high
priority zones off the Atlantic Coast
with minimal conflict to the
environment or to other ocean
users that can be prioritized for
quicker permitting;
� Increasing research on offshore wind
technologies and their associated
benefits and risks, including wildlife
and fishing impacts;
� Advancing efforts to promote jobs
from this industry, especially
manufacturing and other high-
paying jobs;
� Promoting appropriately-sited
offshore wind farms;
� Coordinating regional planning and
economic development, including
ports, vessels, transmission
investment, and other shared
opportunities; and
� Educating policymakers and the public
about the benefits of offshore wind.
3. Ensure the protection of theAtlantic Ocean and its preciousresources. While each Atlantic
state is unique in terms of the
availability of offshore wind, local
politics, and mix of energy sources,
the one constant should be a
comprehensive effort to protect the
Atlantic Ocean as a priceless and
connected ecosystem. Offshore
wind can help protect the Atlantic
Ocean from climate change and
studies show that projects can be
sited to avoid large-scale and long-
term ecological impacts.
4.Create a diverse and powerfulAtlantic offshore wind network.In order to realize the full potential
of offshore wind, advocacy
organizations (including labor
representatives, conservation
groups, community groups,
commercial and recreational
fisherman, consumer organizations,
and businesses) must coordinate
locally and nationally to create a
clear regional vision for Atlantic
offshore wind and create the political
power needed to advance key policies
and projects.
The National Wildlife Federation and our partner organizations arecommitted to building on currentmomentum by mobilizing support foroffshore wind incentives, research,and individual projects. For the lateston National Wildlife Federation’sOffshore Wind Campaign, contact:Catherine Bowes (802-272-1243,[email protected]) or visitwww.nwf.org/offshorewind.
Environment America and NWF havejoined forces to advance offshorewind. For more information aboutEnvironment America’s offshore wind initiatives, contact: Matt Elliot (609-392-5151,[email protected])or visit www.environmentamerica.org.
Dong Energy
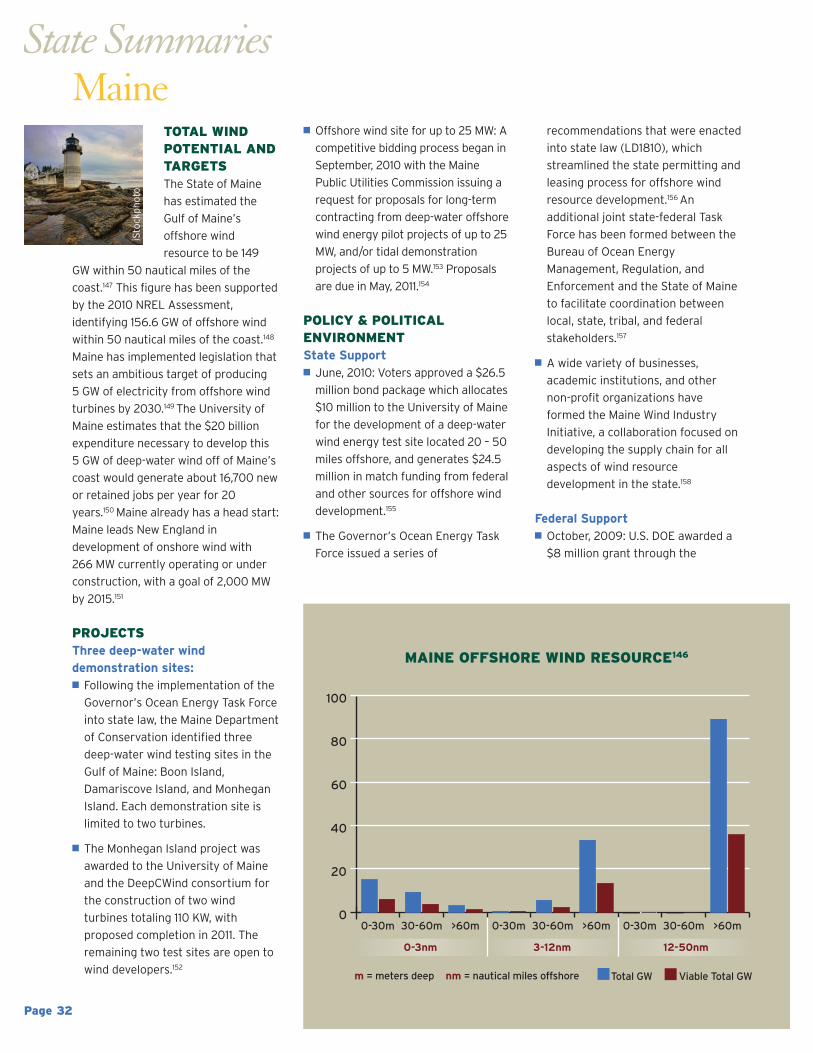
0
20
40
60
80
100
>60m30-60m0-30m>60m30-60m0-30m>60m30-60m0-30m0
MAINE OFFSHORE WIND RESOURCE146
Total GW Viable Total GW
TOTAL WINDPOTENTIAL ANDTARGETSThe State of Maine
has estimated the
Gulf of Maine’s
offshore wind
resource to be 149
GW within 50 nautical miles of the
coast.147 This figure has been supported
by the 2010 NREL Assessment,
identifying 156.6 GW of offshore wind
within 50 nautical miles of the coast.148
Maine has implemented legislation that
sets an ambitious target of producing
5 GW of electricity from offshore wind
turbines by 2030.149 The University of
Maine estimates that the $20 billion
expenditure necessary to develop this
5 GW of deep-water wind off of Maine’s
coast would generate about 16,700 new
or retained jobs per year for 20
years.150 Maine already has a head start:
Maine leads New England in
development of onshore wind with
266 MW currently operating or under
construction, with a goal of 2,000 MW
by 2015.151
PROJECTSThree deep-water winddemonstration sites:� Following the implementation of the
Governor’s Ocean Energy Task Force
into state law, the Maine Department
of Conservation identified three
deep-water wind testing sites in the
Gulf of Maine: Boon Island,
Damariscove Island, and Monhegan
Island. Each demonstration site is
limited to two turbines.
� The Monhegan Island project was
awarded to the University of Maine
and the DeepCWind consortium for
the construction of two wind
turbines totaling 110 KW, with
proposed completion in 2011. The
remaining two test sites are open to
wind developers.152
� Offshore wind site for up to 25 MW: A
competitive bidding process began in
September, 2010 with the Maine
Public Utilities Commission issuing a
request for proposals for long-term
contracting from deep-water offshore
wind energy pilot projects of up to 25
MW, and/or tidal demonstration
projects of up to 5 MW.153 Proposals
are due in May, 2011.154
POLICY & POLITICALENVIRONMENTState Support� June, 2010: Voters approved a $26.5
million bond package which allocates
$10 million to the University of Maine
for the development of a deep-water
wind energy test site located 20 – 50
miles offshore, and generates $24.5
million in match funding from federal
and other sources for offshore wind
development.155
� The Governor’s Ocean Energy Task
Force issued a series of
recommendations that were enacted
into state law (LD1810), which
streamlined the state permitting and
leasing process for offshore wind
resource development.156 An
additional joint state-federal Task
Force has been formed between the
Bureau of Ocean Energy
Management, Regulation, and
Enforcement and the State of Maine
to facilitate coordination between
local, state, tribal, and federal
stakeholders.157
� A wide variety of businesses,
academic institutions, and other
non-profit organizations have
formed the Maine Wind Industry
Initiative, a collaboration focused on
developing the supply chain for all
aspects of wind resource
development in the state.158
Federal Support� October, 2009: U.S. DOE awarded a
$8 million grant through the
State SummariesMaine
0-3nm 3-12nm 12-50nm
Page 32
iStockphoto
m = meters deep nm = nautical miles offshore
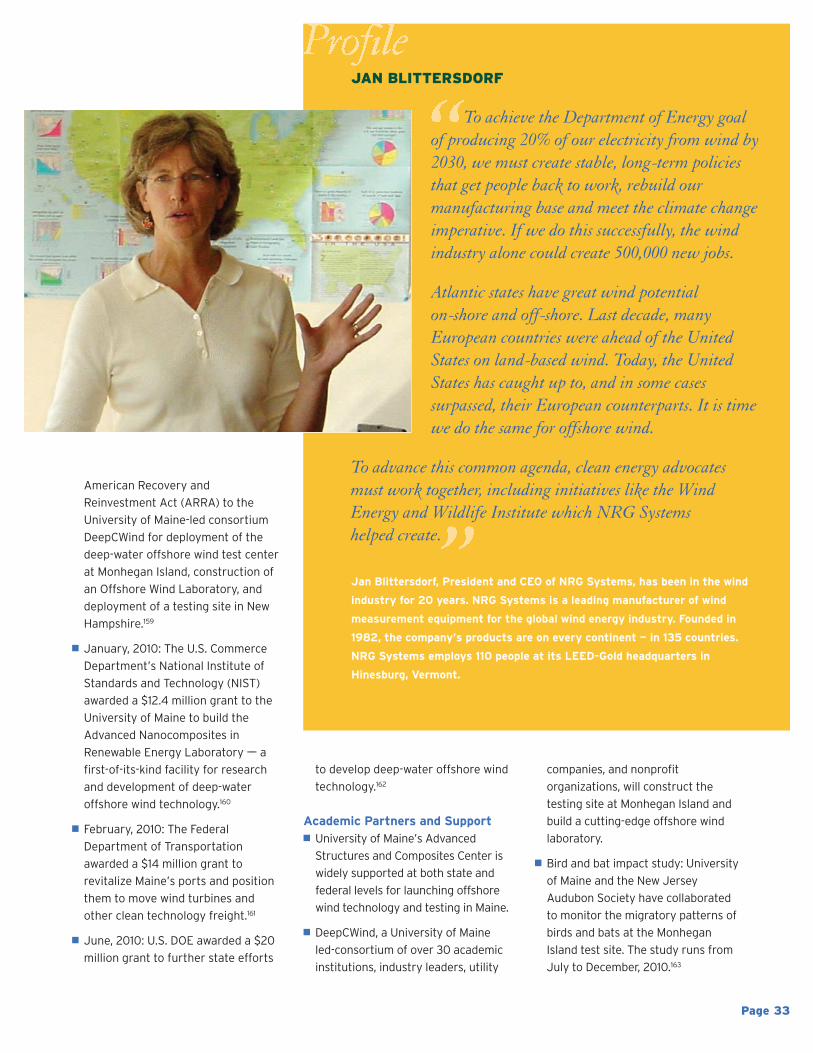
American Recovery and
Reinvestment Act (ARRA) to the
University of Maine-led consortium
DeepCWind for deployment of the
deep-water offshore wind test center
at Monhegan Island, construction of
an Offshore Wind Laboratory, and
deployment of a testing site in New
Hampshire.159
� January, 2010: The U.S. Commerce
Department’s National Institute of
Standards and Technology (NIST)
awarded a $12.4 million grant to the
University of Maine to build the
Advanced Nanocomposites in
Renewable Energy Laboratory —– a
first-of-its-kind facility for research
and development of deep-water
offshore wind technology.160
� February, 2010: The Federal
Department of Transportation
awarded a $14 million grant to
revitalize Maine’s ports and position
them to move wind turbines and
other clean technology freight.161
� June, 2010: U.S. DOE awarded a $20
million grant to further state efforts
to develop deep-water offshore wind
technology.162
Academic Partners and Support� University of Maine’s Advanced
Structures and Composites Center is
widely supported at both state and
federal levels for launching offshore
wind technology and testing in Maine.
� DeepCWind, a University of Maine
led-consortium of over 30 academic
institutions, industry leaders, utility
companies, and nonprofit
organizations, will construct the
testing site at Monhegan Island and
build a cutting-edge offshore wind
laboratory.
� Bird and bat impact study: University
of Maine and the New Jersey
Audubon Society have collaborated
to monitor the migratory patterns of
birds and bats at the Monhegan
Island test site. The study runs from
July to December, 2010.163
Page 33
JAN BLITTERSDORF
To achieve the Department of Energy goalof producing 20% of our electricity from wind by2030, we must create stable, long-term policiesthat get people back to work, rebuild ourmanufacturing base and meet the climate changeimperative. If we do this successfully, the windindustry alone could create 500,000 new jobs.
Atlantic states have great wind potential on-shore and off-shore. Last decade, manyEuropean countries were ahead of the UnitedStates on land-based wind. Today, the UnitedStates has caught up to, and in some casessurpassed, their European counterparts. It is timewe do the same for offshore wind.
To advance this common agenda, clean energy advocatesmust work together, including initiatives like the WindEnergy and Wildlife Institute which NRG Systems helped create.
Jan Blittersdorf, President and CEO of NRG Systems, has been in the wind
industry for 20 years. NRG Systems is a leading manufacturer of wind
measurement equipment for the global wind energy industry. Founded in
1982, the company’s products are on every continent — in 135 countries.
NRG Systems employs 110 people at its LEED-Gold headquarters in
Hinesburg, Vermont.
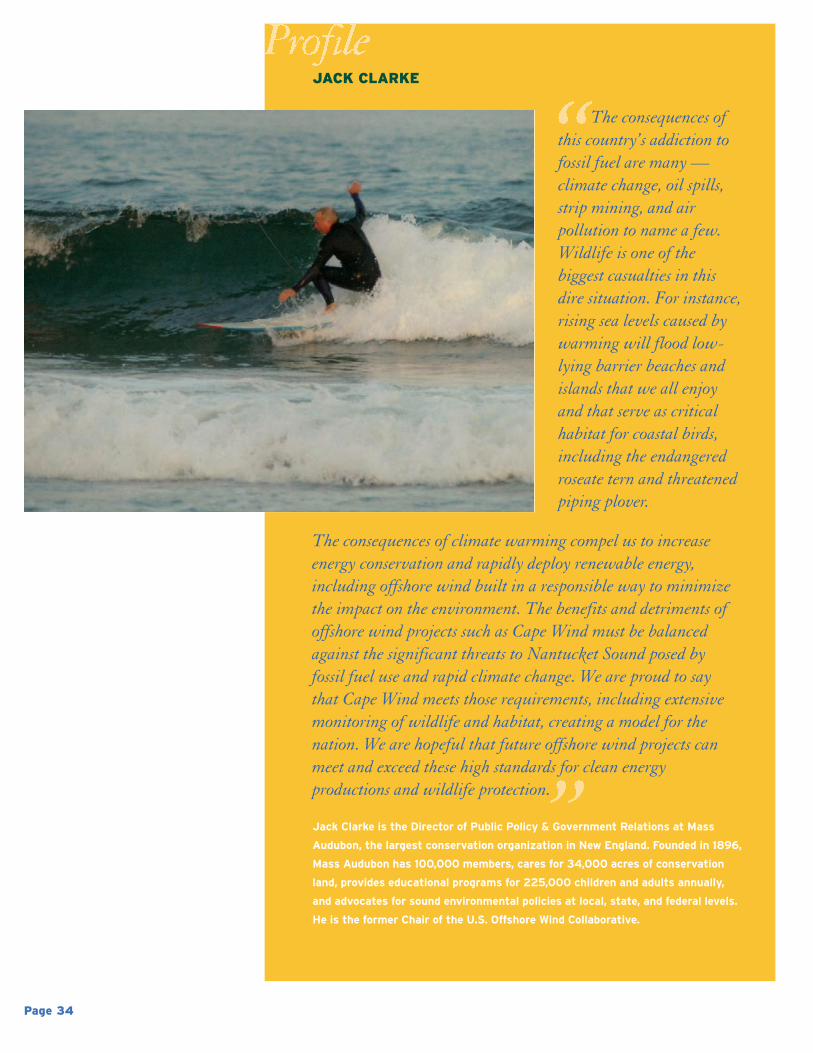
Page 34
JACK CLARKE
The consequences ofthis country’s addiction tofossil fuel are many —climate change, oil spills,strip mining, and airpollution to name a few.Wildlife is one of thebiggest casualties in thisdire situation. For instance,rising sea levels caused bywarming will flood low-lying barrier beaches andislands that we all enjoyand that serve as criticalhabitat for coastal birds,including the endangeredroseate tern and threatenedpiping plover.
The consequences of climate warming compel us to increaseenergy conservation and rapidly deploy renewable energy,including offshore wind built in a responsible way to minimizethe impact on the environment. The benefits and detriments ofoffshore wind projects such as Cape Wind must be balancedagainst the significant threats to Nantucket Sound posed byfossil fuel use and rapid climate change. We are proud to saythat Cape Wind meets those requirements, including extensivemonitoring of wildlife and habitat, creating a model for thenation. We are hopeful that future offshore wind projects canmeet and exceed these high standards for clean energyproductions and wildlife protection.
Jack Clarke is the Director of Public Policy & Government Relations at Mass
Audubon, the largest conservation organization in New England. Founded in 1896,
Mass Audubon has 100,000 members, cares for 34,000 acres of conservation
land, provides educational programs for 225,000 children and adults annually,
and advocates for sound environmental policies at local, state, and federal levels.
He is the former Chair of the U.S. Offshore Wind Collaborative.
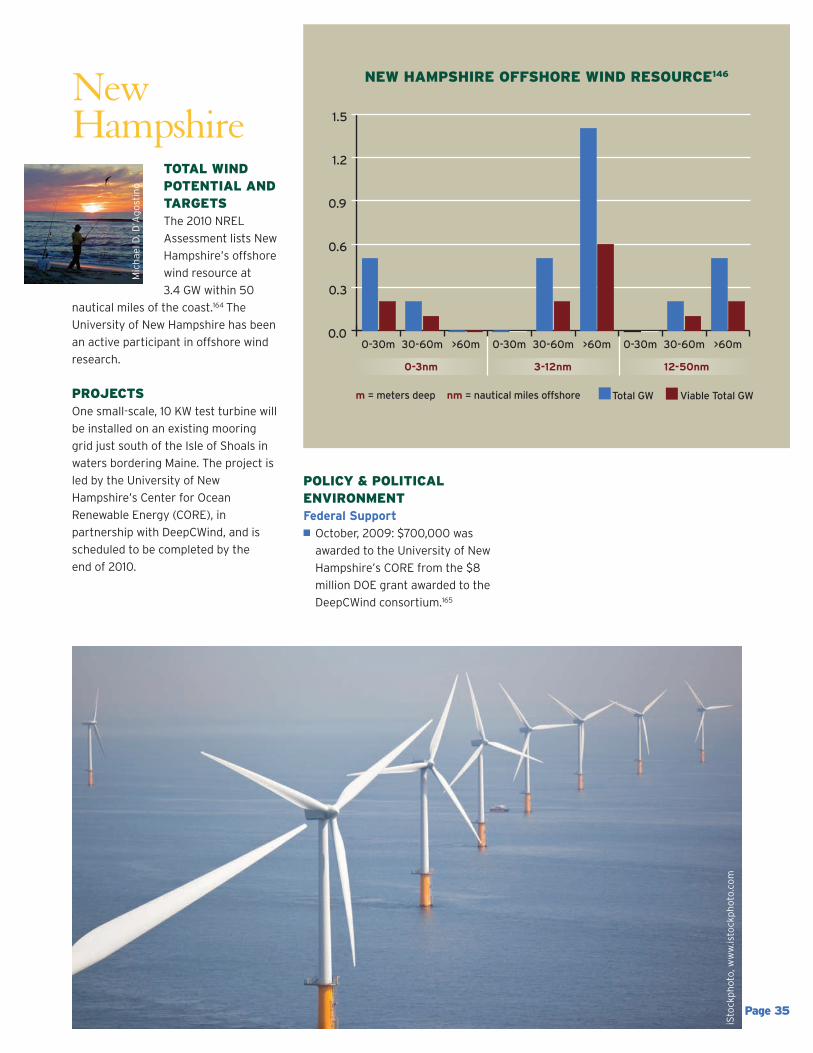
TOTAL WINDPOTENTIAL ANDTARGETSThe 2010 NREL
Assessment lists New
Hampshire’s offshore
wind resource at
3.4 GW within 50
nautical miles of the coast.164 The
University of New Hampshire has been
an active participant in offshore wind
research.
PROJECTSOne small-scale, 10 KW test turbine will
be installed on an existing mooring
grid just south of the Isle of Shoals in
waters bordering Maine. The project is
led by the University of New
Hampshire’s Center for Ocean
Renewable Energy (CORE), in
partnership with DeepCWind, and is
scheduled to be completed by the
end of 2010.
POLICY & POLITICALENVIRONMENTFederal Support� October, 2009: $700,000 was
awarded to the University of New
Hampshire’s CORE from the $8
million DOE grant awarded to the
DeepCWind consortium.165
New Hampshire
NEW HAMPSHIRE OFFSHORE WIND RESOURCE146
iStockphoto, w
ww.istockphoto.com
Page 35
0.0
0.3
0.6
0.9
1.2
1.5
>60m30-60m0-30m>60m30-60m0-30m>60m30-60m0-30m00-3nm 3-12nm 12-50nm
Michael D
. D’Agostino
Total GW Viable Total GWm = meters deep nm = nautical miles offshore
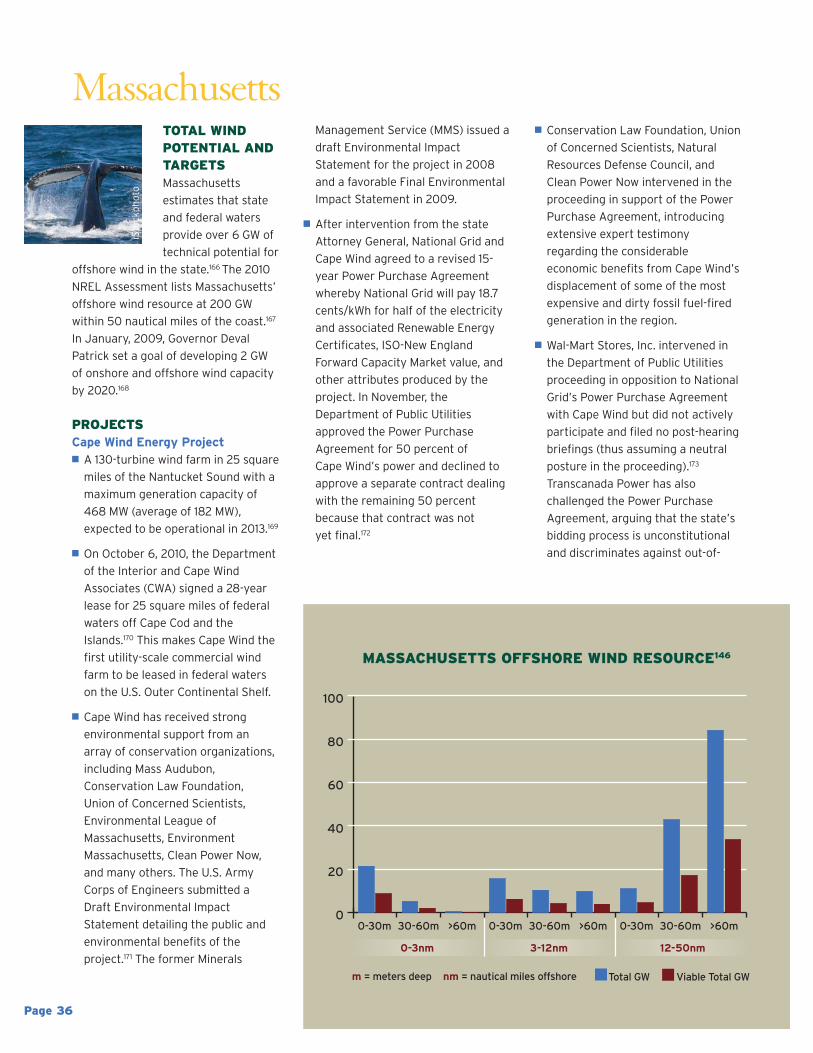
TOTAL WINDPOTENTIAL ANDTARGETSMassachusetts
estimates that state
and federal waters
provide over 6 GW of
technical potential for
offshore wind in the state.166 The 2010
NREL Assessment lists Massachusetts’
offshore wind resource at 200 GW
within 50 nautical miles of the coast.167
In January, 2009, Governor Deval
Patrick set a goal of developing 2 GW
of onshore and offshore wind capacity
by 2020.168
PROJECTSCape Wind Energy Project� A 130-turbine wind farm in 25 square
miles of the Nantucket Sound with a
maximum generation capacity of
468 MW (average of 182 MW),
expected to be operational in 2013.169
� On October 6, 2010, the Department
of the Interior and Cape Wind
Associates (CWA) signed a 28-year
lease for 25 square miles of federal
waters off Cape Cod and the
Islands.170 This makes Cape Wind the
first utility-scale commercial wind
farm to be leased in federal waters
on the U.S. Outer Continental Shelf.
� Cape Wind has received strong
environmental support from an
array of conservation organizations,
including Mass Audubon,
Conservation Law Foundation,
Union of Concerned Scientists,
Environmental League of
Massachusetts, Environment
Massachusetts, Clean Power Now,
and many others. The U.S. Army
Corps of Engineers submitted a
Draft Environmental Impact
Statement detailing the public and
environmental benefits of the
project.171 The former Minerals
Management Service (MMS) issued a
draft Environmental Impact
Statement for the project in 2008
and a favorable Final Environmental
Impact Statement in 2009.
� After intervention from the state
Attorney General, National Grid and
Cape Wind agreed to a revised 15-
year Power Purchase Agreement
whereby National Grid will pay 18.7
cents/kWh for half of the electricity
and associated Renewable Energy
Certificates, ISO-New England
Forward Capacity Market value, and
other attributes produced by the
project. In November, the
Department of Public Utilities
approved the Power Purchase
Agreement for 50 percent of
Cape Wind’s power and declined to
approve a separate contract dealing
with the remaining 50 percent
because that contract was not
yet final.172
� Conservation Law Foundation, Union
of Concerned Scientists, Natural
Resources Defense Council, and
Clean Power Now intervened in the
proceeding in support of the Power
Purchase Agreement, introducing
extensive expert testimony
regarding the considerable
economic benefits from Cape Wind’s
displacement of some of the most
expensive and dirty fossil fuel-fired
generation in the region.
� Wal-Mart Stores, Inc. intervened in
the Department of Public Utilities
proceeding in opposition to National
Grid’s Power Purchase Agreement
with Cape Wind but did not actively
participate and filed no post-hearing
briefings (thus assuming a neutral
posture in the proceeding).173
Transcanada Power has also
challenged the Power Purchase
Agreement, arguing that the state’s
bidding process is unconstitutional
and discriminates against out-of-
Massachusetts
MASSACHUSETTS OFFSHORE WIND RESOURCE146
0
20
40
60
80
100
>60m30-60m0-30m>60m30-60m0-30m>60m30-60m0-30m00-3nm 3-12nm 12-50nm
Page 36
iStockphoto
Total GW Viable Total GWm = meters deep nm = nautical miles offshore
Page 37
state energy suppliers.174
The Associated Industries of
Massachusetts and the Alliance to
Protect Nantucket Sound have also
objected to the Power Purchase
Agreement and have threatened
legal proceedings pending the
decision by the Department of
Public Utilities.175
� Some citizen groups, individuals, and
the Town of Barnstable also have
launched federal lawsuits against
the project, citing negative impacts
to environmental and historic
resources.176 These lawsuits have
been consolidated before the U.S.
District Court for the District of
Columbia.
Hull Offshore Wind Energy Project � Four offshore turbines proposed
with a total generation capacity of
12 MW, led by the Town of Hull
Municipal Light Plant.
� Project began with $1.8 million from
the Massachusetts Technology
Collaborative for a feasibility study.
In March 2009, the project received
$951,000 from a federal spending
bill to support ongoing
environmental and economic
studies.177
� Project is currently delayed,
primarily due to cost concerns.
POLICY & POLITICALENVIRONMENTState & Federal Support� Massachusetts Ocean
Management Plan (January, 2010):
Developed pursuant to the
Massachusetts Oceans Act of 2008,
the plan establishes siting and
performance standards and new
environmental protections to be
associated with future offshore
energy facilities, including deep-
water wind projects that primarily
would be located in adjacent federal
waters.178 The plan designated only
two wind energy areas suitable for
commercial scale development in
MA state waters: (1) a site off
Cuttyhunk Island and part of the
town of Gosnold (Gosnold Wind
Energy Area); and (2) a site south of
Nomans Land and part of Chilmark
(Martha’s Vineyard Wind Energy
Area).179
� Wind Technology Testing Center:
The U.S. DOE awarded a $25 million
grant, to be combined with $15
million in state funds, for the
construction of the nation’s first
large wind turbine blade testing
facility and further offshore wind
technology. Completion is expected
by February, 2011, and over 300 jobs
will be created.180
� Federal draft ‘Request for
Interest’: The federal Bureau of
Ocean Energy Management,
Regulation, and Enforcement’s
(BOEMRE) Massachusetts
Renewable Energy Task Force has
issued a draft ‘Request for Interest’
to gauge specific interest in
commercial development of wind
energy resources on the state’s
outer continental shelf in federal
waters. BOEMRE has identified an
area for federal offshore leasing
near Massachusetts that begins 12
miles offshore and covers 2,542
square nautical miles. A final
Request for Interest is expected to
be released by the end of 2010.181
� Rhode Island-Massachusetts
Collaborative Project: In 2010,
Rhode Island and Massachusetts
signed a Memorandum of
Understanding as stakeholders on
equal terms to develop offshore
wind projects in a 400 square mile
area of mutual interest in the Rhode
Island Sound and adjoining federal
waters.182 The Rhode Island Coastal
Resources Management Council is
finalizing a Special Area
Management Plan (SAMP) that will
act as the governing assessment
and planning document for the
project. In September, 2010, both
states held stakeholder outreach
meetings and are currently in the
process of formally identifying a site
for the project. Rhode Island is in the
process of finalizing the SAMP and
will seek its formal approval under
the Coastal Zone Management Plan
process.183
Academic and Partner Support� UMass-Dartmouth’s Marine
Renewable Energy Center (MREC):
MREC has proposed the
development of the National
Offshore Renewable Energy
Innovation Zone, an ocean-based
laboratory to be located southwest
of Nantucket that would conduct
wind and tidal resource assessments
and eventually support full-scale
testing of offshore technologies. In
support of the innovation zone,
MREC has received $1.5 million in
federal grants and federal officials
have set aside several potential
leasing blocks for the development
of the zone.184
� Massachusetts Ocean Partnership:
A nonprofit group working in
collaboration with state agencies on
a $2.5 million, five-year research
plan that will further investigate the
impacts of offshore wind facilities as
part of the Massachusetts Ocean
Management Plan.
� Massachusetts Technology
Collaborative (MTC): The MTC
conducted a six-month stakeholder
process with over 40 groups to
review the Cape Wind project
proposal and its potential impact on
various stakeholders, the
environment, and the local
economy.185 Until recently, the MTC
administered the Massachusetts
Renewable Energy Trust Fund that
allocates approximately $25 million
per year toward renewable energy
projects. Oversight was moved in
2009 to the newly-established
Massachusetts Clean Energy Center.
TOTAL WINDPOTENTIAL ANDTARGETSA 2008 study
commissioned by the
State of Rhode Island
determined that 15
percent, or
approximately 150 MW, or more of
Rhode Island’s electricity requirement
could be supplied by offshore wind
farms and that 10 specific areas were
suitable for consideration as wind farm
locations.186 The report further
concluded that “the total offshore
resource, if fully developed using
technology available today and without
any additional siting constraints, could
supply as much as five times the 15
percent goal.”187 The 2010 NREL
Assessment lists Rhode Island’s
offshore wind resource at 25.6 GW
within 50 nautical miles of the coast.188
PROJECTSBlock Island Wind Farm� Proposed construction by
Deepwater Wind LLC of an 8 turbine
demonstration project
approximately 3 miles off of Block
Island in state waters. The project
has a nameplate generation capacity
of 28.8 MW and is expected to cost
approximately $200 million.189
� In response to the Rhode Island
Public Utility Commission’s (PUC)
rejection of a Power Purchase
Agreement between Deepwater
Wind and National Grid, which
effectively cancelled the project by
deeming it to be ‘commercially
unreasonable,’ the state legislature
enacted a law in June, 2010 that
dramatically narrows the PUC’s
window to assess the agreement and
its grounds for rejection.190 The
Conservation Law Foundation,
Environmental Council of Rhode
Island, and other environmental
groups opposed this legislation.
� In August, 2010, the PUC agreed to a
20 year Power Purchase Agreement
that calls for National Grid to buy
energy from Deepwater Wind at 24.4
cents/kWh for the first year, with 3.5
percent annual increases. The
project is expected to be fully
operational by 2012 or 2013.191
� Attorney General Patrick Lynch and
the Conservation Law Foundation
have appealed the Power Purchase
Agreement to the state Supreme
Court, calling it unconstitutional and
a ‘sweetheart deal’ for Deepwater
Wind.192 The state Supreme Court
has not yet set a date for the
hearing.193
Rhode Island Sound Wind Farm� The Rhode Island Sound Wind Farm
involves the construction of more
than 100 turbines in federal waters
approximately 15 – 20 miles from the
coast, creating a 384 MW, utility-
scale project that will generate 15
percent of the state’s electricity.
� The project’s zoning will depend on
the conclusions of the Ocean Special
Area Management Plan described
below.194 Federal permits need to be
acquired as well, setting the project’s
target completion date in 2014.
� July, 2010: Advisory opinion from the
Rhode Island Economic Development
Corporation estimated that the
overall economic benefits
attributable to the phase 1 Block
Island Wind Farm would be $92
million in net present value; for the
phase 2 Rhode Island Sound Farm,
the overall economic benefits are
Rhode Island
RHODE ISLAND OFFSHORE WIND RESOURCE146
0
1
2
3
4
5
6
7
8
>60m30-60m0-30m>60m30-60m0-30m>60m30-60m0-30m00-3nm 3-12nm 12-50nm
Page 38
Ann Marie Jakubielski
Total GW Viable Total GWm = meters deep nm = nautical miles offshore
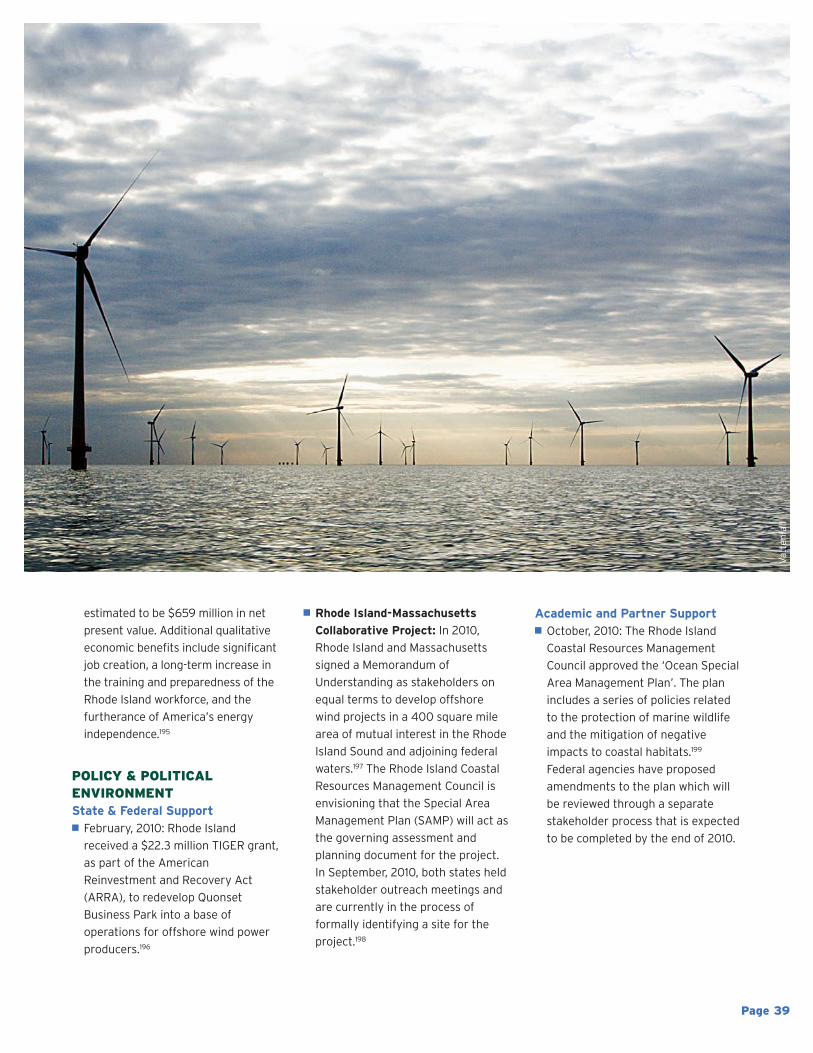
Page 39
estimated to be $659 million in net
present value. Additional qualitative
economic benefits include significant
job creation, a long-term increase in
the training and preparedness of the
Rhode Island workforce, and the
furtherance of America’s energy
independence.195
POLICY & POLITICALENVIRONMENTState & Federal Support� February, 2010: Rhode Island
received a $22.3 million TIGER grant,
as part of the American
Reinvestment and Recovery Act
(ARRA), to redevelop Quonset
Business Park into a base of
operations for offshore wind power
producers.196
� Rhode Island-Massachusetts
Collaborative Project: In 2010,
Rhode Island and Massachusetts
signed a Memorandum of
Understanding as stakeholders on
equal terms to develop offshore
wind projects in a 400 square mile
area of mutual interest in the Rhode
Island Sound and adjoining federal
waters.197 The Rhode Island Coastal
Resources Management Council is
envisioning that the Special Area
Management Plan (SAMP) will act as
the governing assessment and
planning document for the project.
In September, 2010, both states held
stakeholder outreach meetings and
are currently in the process of
formally identifying a site for the
project.198
Academic and Partner Support� October, 2010: The Rhode Island
Coastal Resources Management
Council approved the ‘Ocean Special
Area Management Plan’. The plan
includes a series of policies related
to the protection of marine wildlife
and the mitigation of negative
impacts to coastal habitats.199
Federal agencies have proposed
amendments to the plan which will
be reviewed through a separate
stakeholder process that is expected
to be completed by the end of 2010.
Vattenfall
Page 40
New YorkTOTAL WINDPOTENTIAL ANDTARGETSThe 2010 NREL
Assessment lists New
York’s combined
Atlantic and Great
Lakes offshore wind
resource at 147.2 GW within 50 nautical
miles of the coast.200 The State of New
York has established a goal of meeting
45 percent of its electricity needs
through improved energy efficiency
and renewable sources by 2015.201
While the state has considerable
onshore wind development, a state
Renewable Energy Assessment found
that offshore wind production is even
better correlated with the region’s
peak demand than onshore
sources.202, 203
PROJECTSLong Island-NYC Offshore WindProject� Public-private collaborative for the
development of an offshore wind
site 13 – 15 miles emanating off the
Rockaway Peninsula in federal
waters with generation capacity of
350 MW, with the potential for
expansion to 700 MW.204
� Members of the Long Island-New
York City Offshore Wind
Collaborative are the Long Island
Power Authority (LIPA), Con Edison,
New York Power Authority (NYPA),
New York City Economic
Development Corporation, New York
State Energy Research Development
Authority (NYSERDA), Metropolitan
Transportation Authority, and the
NY/NJ Port Authority.
� On behalf of the Collaborative, NYPA
is filing a request for a lease from
BOEMRE for 64,500 acres of land
beneath the Atlantic Ocean about
13 – 15 miles off of the Long Island
coast for development of the Long
Island-New York City Offshore Wind
Project.205
� The Collaborative expects to issue a
Request for Proposals in 2011,
inviting bids from private
development firms to build the
project and enter into agreements to
sell the clean energy it produces. It is
also conducting feasibility studies
covering transmission, water-to-land
interconnections, geophysical,
economic, public support, and the
environment. 206
POLICY & POLITICALENVIRONMENT State & Federal Support� November, 2010: The New York State
Climate Action Interim report was
released, calling for a doubling of the
state’s renewable energy sources by
2030.207
� New York’s 2009 State Energy Plan
recommends improved offshore
wind siting guidance and increased
state and regional coordination on
offshore wind, including the
development of a New York offshore
ocean plan.208
� The New York State Department of
State is in the process of amending
its Coastal Management Program
(CMP) to develop specific criteria
and analyze resource and use
information for the siting of offshore
wind projects, and to enhance
protection of important offshore
habitats (Atlantic Ocean
Amendment).209 A state with an
approved Coastal Management
Program has the authority to
approve or deny a proposed federal
action if it may affect the state’s
coastal resources.210
� NYSERDA administers a program of
production incentives for wholesale
renewable energy generators under
the Renewable Portfolio Standard
which could include offshore wind
turbines in addition to onshore wind
turbines.211
� The Bloomberg Administration in
New York City has identified offshore
wind potential as a key element of
NEW YORK OFFSHORE WIND RESOURCE146
0
5
10
15
20
25
30
35
40
>60m30-60m0-30m>60m30-60m0-30m>60m30-60m0-30m00-3nm 3-12nm 12-50nm
Van
essa M. D
obre
Total GW Viable Total GWm = meters deep nm = nautical miles offshore
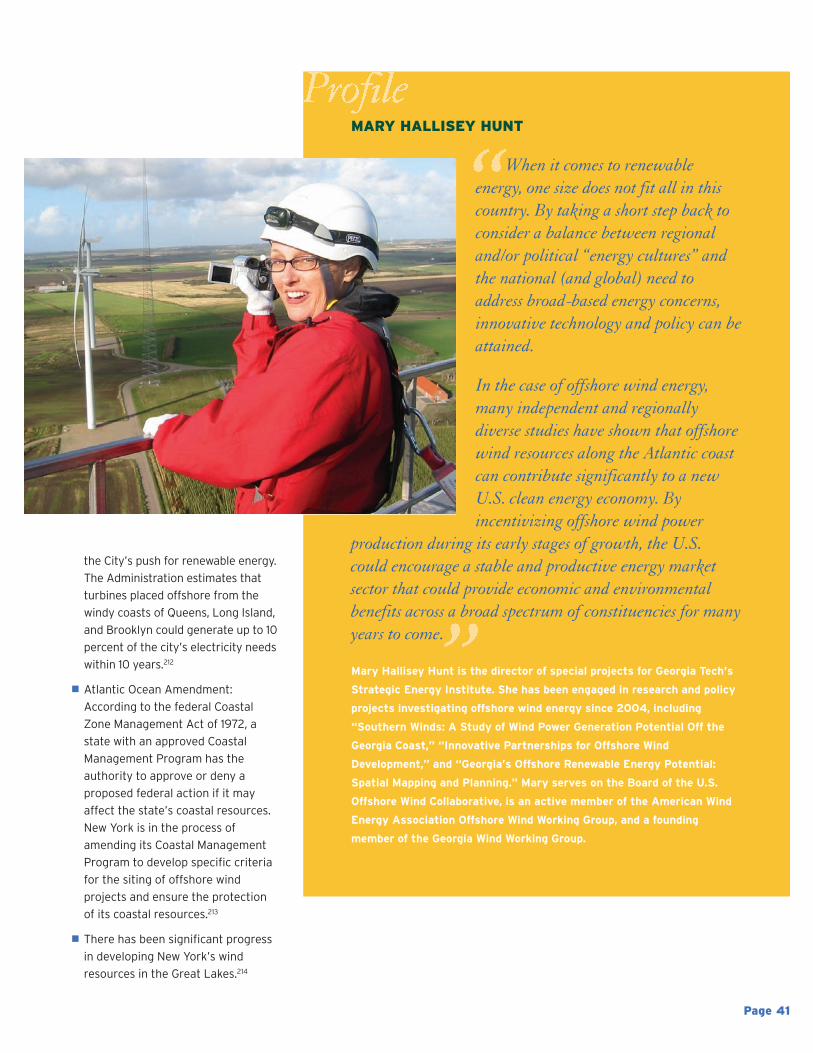
Page 41
the City’s push for renewable energy.
The Administration estimates that
turbines placed offshore from the
windy coasts of Queens, Long Island,
and Brooklyn could generate up to 10
percent of the city’s electricity needs
within 10 years.212
� Atlantic Ocean Amendment:
According to the federal Coastal
Zone Management Act of 1972, a
state with an approved Coastal
Management Program has the
authority to approve or deny a
proposed federal action if it may
affect the state’s coastal resources.
New York is in the process of
amending its Coastal Management
Program to develop specific criteria
for the siting of offshore wind
projects and ensure the protection
of its coastal resources.213
� There has been significant progress
in developing New York’s wind
resources in the Great Lakes.214
MARY HALLISEY HUNT
When it comes to renewableenergy, one size does not fit all in thiscountry. By taking a short step back toconsider a balance between regionaland/or political “energy cultures” andthe national (and global) need toaddress broad-based energy concerns,innovative technology and policy can beattained.
In the case of offshore wind energy,many independent and regionallydiverse studies have shown that offshorewind resources along the Atlantic coastcan contribute significantly to a newU.S. clean energy economy. Byincentivizing offshore wind power
production during its early stages of growth, the U.S.could encourage a stable and productive energy marketsector that could provide economic and environmentalbenefits across a broad spectrum of constituencies for manyyears to come.
Mary Hallisey Hunt is the director of special projects for Georgia Tech’s
Strategic Energy Institute. She has been engaged in research and policy
projects investigating offshore wind energy since 2004, including
“Southern Winds: A Study of Wind Power Generation Potential Off the
Georgia Coast,” “Innovative Partnerships for Offshore Wind
Development,” and “Georgia’s Offshore Renewable Energy Potential:
Spatial Mapping and Planning.” Mary serves on the Board of the U.S.
Offshore Wind Collaborative, is an active member of the American Wind
Energy Association Offshore Wind Working Group, and a founding
member of the Georgia Wind Working Group.
Page 42
New JerseyTOTAL WINDPOTENTIAL ANDTARGETSIn April, 2010,
Governor Chris
Christie outlined an
energy policy that
included an emphasis
on the development of offshore
wind.215 The 2010 NREL Assessment
lists New Jersey’s offshore wind
resource at 99.7 GW within 50 nautical
miles of the coast.216 In October, 2008,
then-Governor Jon Corzine issued an
Energy Master Plan that called for the
construction of 3 GW of offshore wind
energy facilities by 2020, with at least
1 GW installed by the end of 2012.217
PROJECTSGarden State Offshore Energy(GSOE)� Collaborative project between
Deepwater Wind and PSEG
Renewable Generation for the
construction of a 350 MW project,
consisting of 96 wind turbines
located 16 – 20 miles off the New
Jersey shore in federal waters, with a
projected cost of $1.5 billion. Project
was selected by the New Jersey
Board of Public Utilities (NJBPU) in
October, 2008 and awarded a
$4 million grant for the completion
of baseline studies and permitting
applications.218
� In December, 2008, GSOE was
awarded $4 million by the NJBPU for
the installation of a deep ocean
meteorological tower to gather
essential data.219 In June, 2009, the
federal government awarded
Deepwater Wind two federal
exploratory leases: one for 12 – 15
miles from the New Jersey coast, and
the other 15 – 18 miles out. The leases
will enable Deepwater Wind to
construct meteorological towers in
federal waters and collect data in
support of the project.220
� Upon completion of baseline studies
and zoning recommendations from
the New Jersey Department of
Environmental Protection (NJDEP),
GSOE will be eligible to apply for
state and federal permits. Project is
expected to be fully operational by
2013.
� In October, 2010, the NJBPU
approved a permit for the
deployment of an advanced wind
resource assessment buoy, signaling
key support for the project’s
advancement. The buoy is expected
to be installed by the end of 2010
pending receipt of federal permits.221
Fisherman’s Energy (2 Phases)� Phase 1 involves a 20 MW, 6 – 8
turbine demonstration project 2.8
miles off the coast of Atlantic City in
state waters with the ability to power
an estimated 6,000 homes in South
Jersey. Depending on state
permitting approval, the project can
be operational by the end of 2011 or
in early 2012. In April 2010, an
environmental monitoring buoy was
launched in support of Phase 1.222
� Phase 2 is a 330 MW utility-scale
project, with 66 offshore turbines
located 7 miles off the New Jersey
coast in federal waters. Like GSOE,
Phase 2 of this project was awarded
$4 million by the NJBPU for the
construction of a meteorological
tower and awarded a 5-year
exploratory lease for environmental
studies and data collection.
� The project must procure permits
from state and federal agencies in
order to proceed with construction.
NRG-Bluewater Wind� Proposal for a 350 MW utility-scale
project with 80 – 100 turbines,
located more than 13 miles from the
coastline in federal waters.223
NEW JERSEY OFFSHORE WIND RESOURCE146
0
10
20
30
40
50
60
>60m30-60m0-30m>60m30-60m0-30m>60m30-60m0-30m0
0-3nm 3-12nm 12-50nm
iStockphoto
Total GW Viable Total GWm = meters deep nm = nautical miles offshore
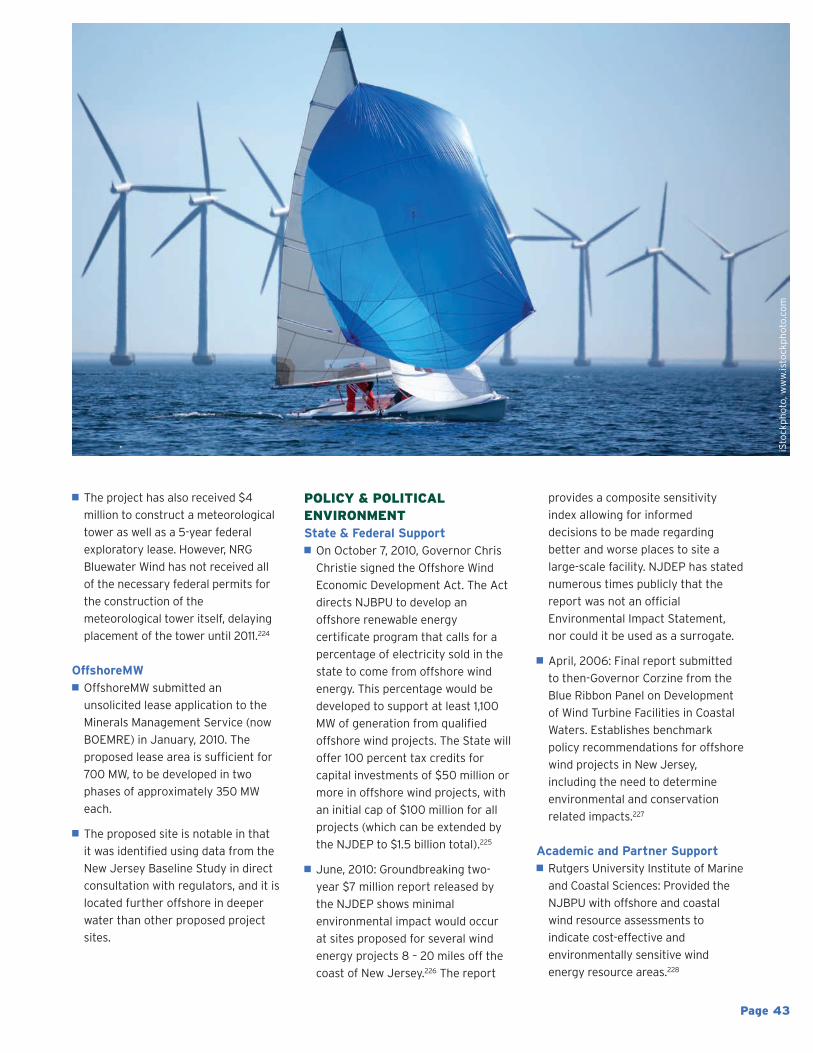
� The project has also received $4
million to construct a meteorological
tower as well as a 5-year federal
exploratory lease. However, NRG
Bluewater Wind has not received all
of the necessary federal permits for
the construction of the
meteorological tower itself, delaying
placement of the tower until 2011.224
OffshoreMW� OffshoreMW submitted an
unsolicited lease application to the
Minerals Management Service (now
BOEMRE) in January, 2010. The
proposed lease area is sufficient for
700 MW, to be developed in two
phases of approximately 350 MW
each.
� The proposed site is notable in that
it was identified using data from the
New Jersey Baseline Study in direct
consultation with regulators, and it is
located further offshore in deeper
water than other proposed project
sites.
POLICY & POLITICALENVIRONMENTState & Federal Support� On October 7, 2010, Governor Chris
Christie signed the Offshore Wind
Economic Development Act. The Act
directs NJBPU to develop an
offshore renewable energy
certificate program that calls for a
percentage of electricity sold in the
state to come from offshore wind
energy. This percentage would be
developed to support at least 1,100
MW of generation from qualified
offshore wind projects. The State will
offer 100 percent tax credits for
capital investments of $50 million or
more in offshore wind projects, with
an initial cap of $100 million for all
projects (which can be extended by
the NJDEP to $1.5 billion total).225
� June, 2010: Groundbreaking two-
year $7 million report released by
the NJDEP shows minimal
environmental impact would occur
at sites proposed for several wind
energy projects 8 – 20 miles off the
coast of New Jersey.226 The report
provides a composite sensitivity
index allowing for informed
decisions to be made regarding
better and worse places to site a
large-scale facility. NJDEP has stated
numerous times publicly that the
report was not an official
Environmental Impact Statement,
nor could it be used as a surrogate.
� April, 2006: Final report submitted
to then-Governor Corzine from the
Blue Ribbon Panel on Development
of Wind Turbine Facilities in Coastal
Waters. Establishes benchmark
policy recommendations for offshore
wind projects in New Jersey,
including the need to determine
environmental and conservation
related impacts.227
Academic and Partner Support� Rutgers University Institute of Marine
and Coastal Sciences: Provided the
NJBPU with offshore and coastal
wind resource assessments to
indicate cost-effective and
environmentally sensitive wind
energy resource areas.228
iStockphoto, w
ww.istockphoto.com
Page 43
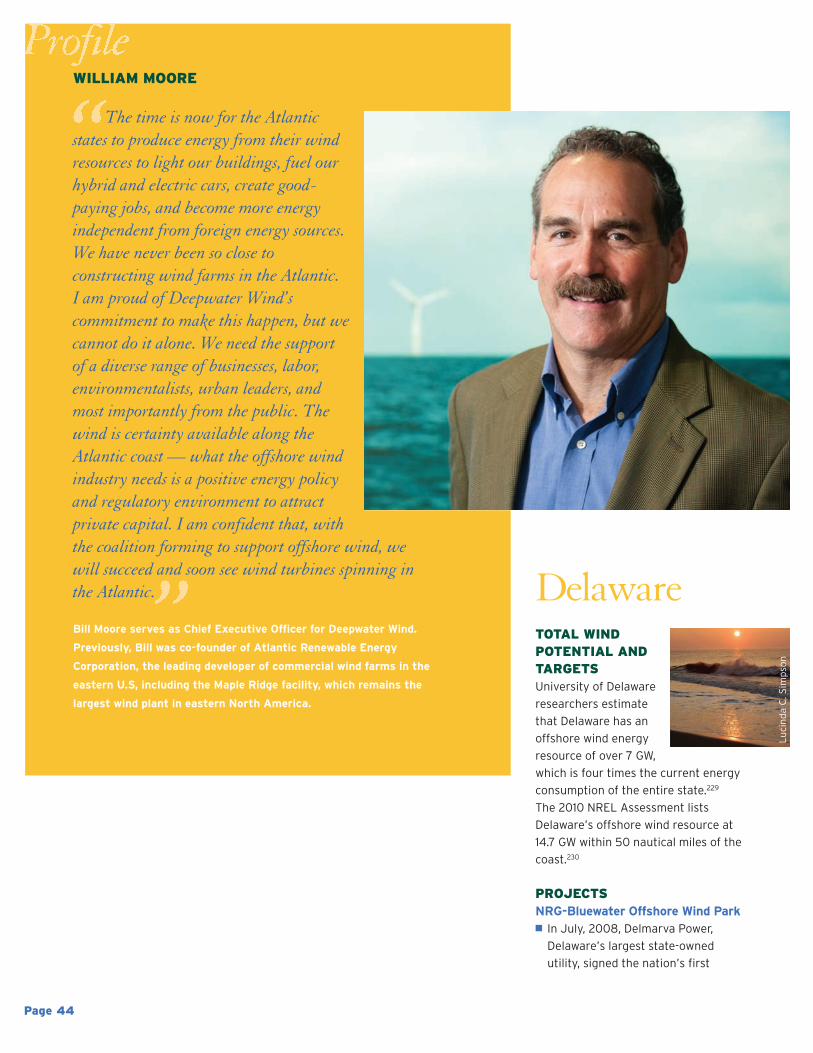
TOTAL WINDPOTENTIAL ANDTARGETSUniversity of Delaware
researchers estimate
that Delaware has an
offshore wind energy
resource of over 7 GW,
which is four times the current energy
consumption of the entire state.229
The 2010 NREL Assessment lists
Delaware’s offshore wind resource at
14.7 GW within 50 nautical miles of the
coast.230
PROJECTSNRG-Bluewater Offshore Wind Park� In July, 2008, Delmarva Power,
Delaware’s largest state-owned
utility, signed the nation’s first
Delaware
WILLIAM MOORE
The time is now for the Atlanticstates to produce energy from their windresources to light our buildings, fuel ourhybrid and electric cars, create good-paying jobs, and become more energyindependent from foreign energy sources.We have never been so close toconstructing wind farms in the Atlantic. I am proud of Deepwater Wind’scommitment to make this happen, but wecannot do it alone. We need the supportof a diverse range of businesses, labor,environmentalists, urban leaders, andmost importantly from the public. Thewind is certainty available along theAtlantic coast — what the offshore windindustry needs is a positive energy policyand regulatory environment to attractprivate capital. I am confident that, withthe coalition forming to support offshore wind, we will succeed and soon see wind turbines spinning inthe Atlantic.
Bill Moore serves as Chief Executive Officer for Deepwater Wind.
Previously, Bill was co-founder of Atlantic Renewable Energy
Corporation, the leading developer of commercial wind farms in the
eastern U.S, including the Maple Ridge facility, which remains the
largest wind plant in eastern North America.
Page 44
Lucinda C. Sim
pson
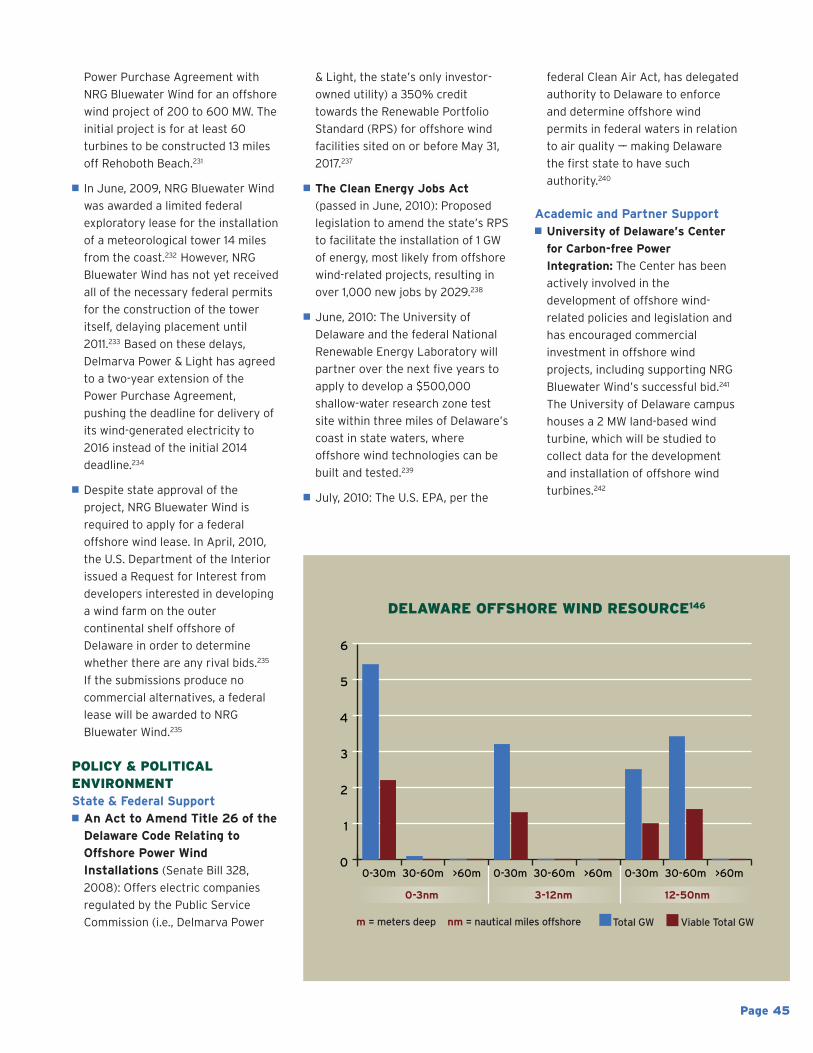
& Light, the state’s only investor-
owned utility) a 350% credit
towards the Renewable Portfolio
Standard (RPS) for offshore wind
facilities sited on or before May 31,
2017.237
� The Clean Energy Jobs Act
(passed in June, 2010): Proposed
legislation to amend the state’s RPS
to facilitate the installation of 1 GW
of energy, most likely from offshore
wind-related projects, resulting in
over 1,000 new jobs by 2029.238
� June, 2010: The University of
Delaware and the federal National
Renewable Energy Laboratory will
partner over the next five years to
apply to develop a $500,000
shallow-water research zone test
site within three miles of Delaware’s
coast in state waters, where
offshore wind technologies can be
built and tested.239
� July, 2010: The U.S. EPA, per the
federal Clean Air Act, has delegated
authority to Delaware to enforce
and determine offshore wind
permits in federal waters in relation
to air quality —– making Delaware
the first state to have such
authority.240
Academic and Partner Support� University of Delaware’s Center
for Carbon-free Power
Integration: The Center has been
actively involved in the
development of offshore wind-
related policies and legislation and
has encouraged commercial
investment in offshore wind
projects, including supporting NRG
Bluewater Wind’s successful bid.241
The University of Delaware campus
houses a 2 MW land-based wind
turbine, which will be studied to
collect data for the development
and installation of offshore wind
turbines.242
DELAWARE OFFSHORE WIND RESOURCE146
0
1
2
3
4
5
6
>60m30-60m0-30m>60m30-60m0-30m>60m30-60m0-30m00-3nm 3-12nm 12-50nm
Power Purchase Agreement with
NRG Bluewater Wind for an offshore
wind project of 200 to 600 MW. The
initial project is for at least 60
turbines to be constructed 13 miles
off Rehoboth Beach.231
� In June, 2009, NRG Bluewater Wind
was awarded a limited federal
exploratory lease for the installation
of a meteorological tower 14 miles
from the coast.232 However, NRG
Bluewater Wind has not yet received
all of the necessary federal permits
for the construction of the tower
itself, delaying placement until
2011.233 Based on these delays,
Delmarva Power & Light has agreed
to a two-year extension of the
Power Purchase Agreement,
pushing the deadline for delivery of
its wind-generated electricity to
2016 instead of the initial 2014
deadline.234
� Despite state approval of the
project, NRG Bluewater Wind is
required to apply for a federal
offshore wind lease. In April, 2010,
the U.S. Department of the Interior
issued a Request for Interest from
developers interested in developing
a wind farm on the outer
continental shelf offshore of
Delaware in order to determine
whether there are any rival bids.235
If the submissions produce no
commercial alternatives, a federal
lease will be awarded to NRG
Bluewater Wind.235
POLICY & POLITICALENVIRONMENTState & Federal Support� An Act to Amend Title 26 of theDelaware Code Relating toOffshore Power WindInstallations (Senate Bill 328,2008): Offers electric companies
regulated by the Public Service
Commission (i.e., Delmarva Power
Page 45
Total GW Viable Total GWm = meters deep nm = nautical miles offshore
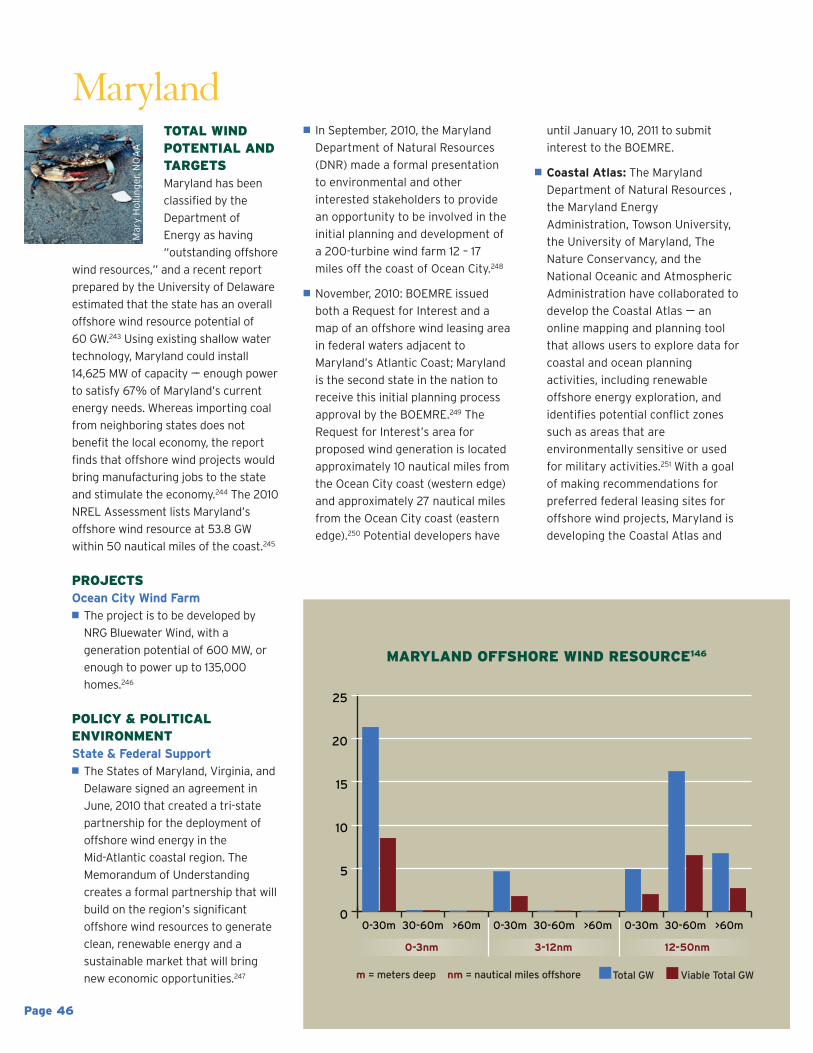
Page 46
TOTAL WINDPOTENTIAL ANDTARGETSMaryland has been
classified by the
Department of
Energy as having
“outstanding offshore
wind resources,” and a recent report
prepared by the University of Delaware
estimated that the state has an overall
offshore wind resource potential of
60 GW.243 Using existing shallow water
technology, Maryland could install
14,625 MW of capacity —– enough power
to satisfy 67% of Maryland’s current
energy needs. Whereas importing coal
from neighboring states does not
benefit the local economy, the report
finds that offshore wind projects would
bring manufacturing jobs to the state
and stimulate the economy.244 The 2010
NREL Assessment lists Maryland’s
offshore wind resource at 53.8 GW
within 50 nautical miles of the coast.245
PROJECTSOcean City Wind Farm � The project is to be developed by
NRG Bluewater Wind, with a
generation potential of 600 MW, or
enough to power up to 135,000
homes.246
POLICY & POLITICALENVIRONMENTState & Federal Support� The States of Maryland, Virginia, and
Delaware signed an agreement in
June, 2010 that created a tri-state
partnership for the deployment of
offshore wind energy in the
Mid-Atlantic coastal region. The
Memorandum of Understanding
creates a formal partnership that will
build on the region’s significant
offshore wind resources to generate
clean, renewable energy and a
sustainable market that will bring
new economic opportunities.247
Maryland� In September, 2010, the Maryland
Department of Natural Resources
(DNR) made a formal presentation
to environmental and other
interested stakeholders to provide
an opportunity to be involved in the
initial planning and development of
a 200-turbine wind farm 12 – 17
miles off the coast of Ocean City.248
� November, 2010: BOEMRE issued
both a Request for Interest and a
map of an offshore wind leasing area
in federal waters adjacent to
Maryland’s Atlantic Coast; Maryland
is the second state in the nation to
receive this initial planning process
approval by the BOEMRE.249 The
Request for Interest’s area for
proposed wind generation is located
approximately 10 nautical miles from
the Ocean City coast (western edge)
and approximately 27 nautical miles
from the Ocean City coast (eastern
edge).250 Potential developers have
until January 10, 2011 to submit
interest to the BOEMRE.
� Coastal Atlas: The Maryland
Department of Natural Resources ,
the Maryland Energy
Administration, Towson University,
the University of Maryland, The
Nature Conservancy, and the
National Oceanic and Atmospheric
Administration have collaborated to
develop the Coastal Atlas —– an
online mapping and planning tool
that allows users to explore data for
coastal and ocean planning
activities, including renewable
offshore energy exploration, and
identifies potential conflict zones
such as areas that are
environmentally sensitive or used
for military activities.251 With a goal
of making recommendations for
preferred federal leasing sites for
offshore wind projects, Maryland is
developing the Coastal Atlas and
MARYLAND OFFSHORE WIND RESOURCE146
0
5
10
15
20
25
>60m30-60m0-30m>60m30-60m0-30m>60m30-60m0-30m00-3nm 3-12nm 12-50nm
Mary Hollinger, N
OAA
Total GW Viable Total GWm = meters deep nm = nautical miles offshore
Page 47
JONATHAN GENSLER
As an Iraq War veteran and amember of Operation Free, add meto the growing chorus of offshorewind supporters. I was raised inHuntington, West Virginia, wherethe permanent devastation caused bymountaintop removal mining andthe recent Upper Big Branch minetragedy are deadly reminders of thetrue costs of coal and other fossilfuels. But my primary concerns arewith the tremendous nationalsecurity threats posed by ouraddiction to fossil fuels and thedestabilizing factor of unmitigatedclimate change. While the
Department of Defense is moving full steam ahead onadopting new clean energy technologies, the private sectorremains mired in the 19th century. Developing Americanwind resources, both offshore and on the ridge-lines ofAppalachia, will help transform this equation and provideall Americans with a better and safer future.
Jonathan Gensler is a West Point graduate and a former Army captain
who served in Iraq from 2003-2004 as a tank officer leading a 30 man
infantry mortar platoon. Jon is currently studying for dual master’s
degree at the Harvard Kennedy School and MIT Sloan School of
Management. In 2009, Gensler participated in the international climate
talks in Copenhagen with OperationFree —– a coalition of leading veterans
and national security organizations who recognize that climate change is
a major national security threat. He is also a Fellow with the Truman
National Security Project.
inviting feedback from offshore
wind developers252 and federal
agencies,253 and engaging targeted
stakeholders and the public.254
Based on collected information and
feedback, Maryland will issue
guidelines concerning the
development of offshore projects.
� Maryland Offshore Energy
Framework: The Environmental Law
Institute compiled a report for the
Maryland Department of Natural
Resources identifying a streamlined
regulatory framework and a new set
of environmental protections to be
implemented in response to the
development of offshore wind
projects.255
� October, 2010: Governor Martin
O’Malley highlighted the job
creation potential of offshore wind
in Maryland by publicly stating that
“A proposed 1 GW wind farm in the
waters off of the Delmarva coast
could generate as many as 4,000
manufacturing and construction
jobs during the five-year
development period, with an
additional 800 permanent jobs once
the turbines are spinning, while
securing our energy future and
producing sustainable energy
solutions for consumers.”256
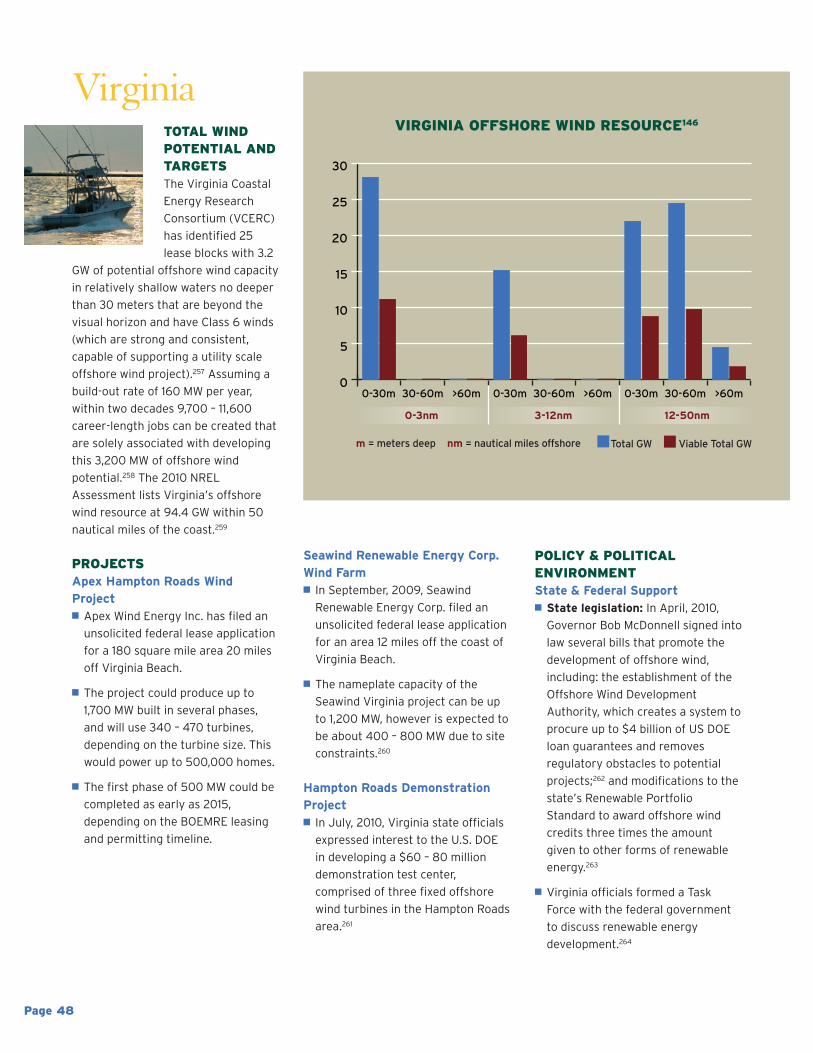
TOTAL WINDPOTENTIAL ANDTARGETSThe Virginia Coastal
Energy Research
Consortium (VCERC)
has identified 25
lease blocks with 3.2
GW of potential offshore wind capacity
in relatively shallow waters no deeper
than 30 meters that are beyond the
visual horizon and have Class 6 winds
(which are strong and consistent,
capable of supporting a utility scale
offshore wind project).257 Assuming a
build-out rate of 160 MW per year,
within two decades 9,700 – 11,600
career-length jobs can be created that
are solely associated with developing
this 3,200 MW of offshore wind
potential.258 The 2010 NREL
Assessment lists Virginia’s offshore
wind resource at 94.4 GW within 50
nautical miles of the coast.259
PROJECTSApex Hampton Roads WindProject � Apex Wind Energy Inc. has filed an
unsolicited federal lease application
for a 180 square mile area 20 miles
off Virginia Beach.
� The project could produce up to
1,700 MW built in several phases,
and will use 340 – 470 turbines,
depending on the turbine size. This
would power up to 500,000 homes.
� The first phase of 500 MW could be
completed as early as 2015,
depending on the BOEMRE leasing
and permitting timeline.
Virginia
Seawind Renewable Energy Corp.Wind Farm� In September, 2009, Seawind
Renewable Energy Corp. filed an
unsolicited federal lease application
for an area 12 miles off the coast of
Virginia Beach.
� The nameplate capacity of the
Seawind Virginia project can be up
to 1,200 MW, however is expected to
be about 400 – 800 MW due to site
constraints.260
Hampton Roads DemonstrationProject� In July, 2010, Virginia state officials
expressed interest to the U.S. DOE
in developing a $60 – 80 million
demonstration test center,
comprised of three fixed offshore
wind turbines in the Hampton Roads
area.261
POLICY & POLITICALENVIRONMENTState & Federal Support� State legislation: In April, 2010,
Governor Bob McDonnell signed into
law several bills that promote the
development of offshore wind,
including: the establishment of the
Offshore Wind Development
Authority, which creates a system to
procure up to $4 billion of US DOE
loan guarantees and removes
regulatory obstacles to potential
projects;262 and modifications to the
state’s Renewable Portfolio
Standard to award offshore wind
credits three times the amount
given to other forms of renewable
energy.263
� Virginia officials formed a Task
Force with the federal government
to discuss renewable energy
development.264
VIRGINIA OFFSHORE WIND RESOURCE146
0
5
10
15
20
25
30
>60m30-60m0-30m>60m30-60m0-30m>60m30-60m0-30m0
Page 48
0-3nm 3-12nm 12-50nm
iStockphoto
Total GW Viable Total GWm = meters deep nm = nautical miles offshore
Page 49
� An assessment by the Department
of Defense concluded that wind
turbines could co-exist with military
activities off Virginia’s coast
depending on their locations.265
Academic and Partner SupportIn addition to VCERC, several
organizations have released reports
examining Virginia’s offshore wind
resource potential: the Virginia Marine
Resources Commission has evaluated
whether sufficient subaqueous land
exists in state territorial waters to
support offshore wind resource
generation, concluding the best
potential exists on the Outer
Continental Shelf.266 The
Environmental Law Institute,
commissioned by the Virginia Coastal
Zone Management Program, issued
two reports detailing recommended
changes to Virginia environmental and
regulatory policies in light of offshore
wind development.267 The Virginia
Offshore Wind Coalition —– a network
of developers, manufacturers, utilities,
localities, businesses, environmental
groups, and other organizations and
individuals who have an interest in
offshore wind —– was formed in
January, 2010.268
iStockphoto, w
ww.istockphoto.com
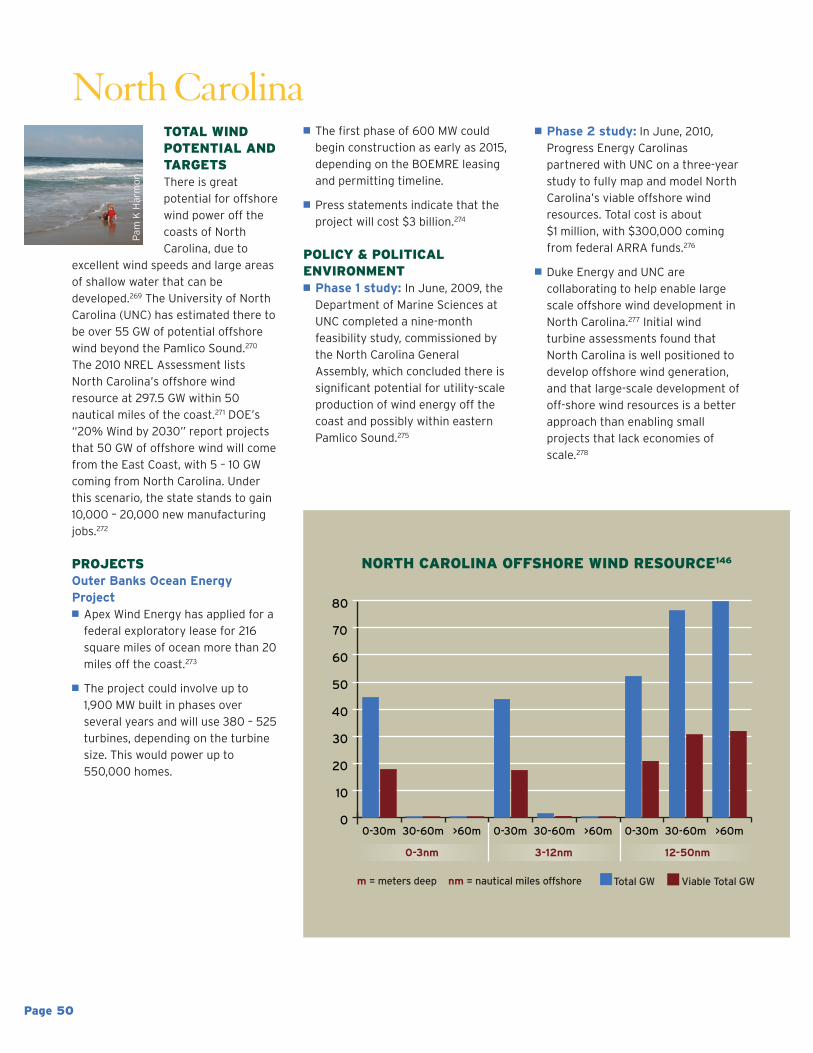
Page 50
TOTAL WINDPOTENTIAL ANDTARGETSThere is great
potential for offshore
wind power off the
coasts of North
Carolina, due to
excellent wind speeds and large areas
of shallow water that can be
developed.269 The University of North
Carolina (UNC) has estimated there to
be over 55 GW of potential offshore
wind beyond the Pamlico Sound.270
The 2010 NREL Assessment lists
North Carolina’s offshore wind
resource at 297.5 GW within 50
nautical miles of the coast.271 DOE’s
“20% Wind by 2030” report projects
that 50 GW of offshore wind will come
from the East Coast, with 5 – 10 GW
coming from North Carolina. Under
this scenario, the state stands to gain
10,000 – 20,000 new manufacturing
jobs.272
PROJECTSOuter Banks Ocean EnergyProject� Apex Wind Energy has applied for a
federal exploratory lease for 216
square miles of ocean more than 20
miles off the coast.273
� The project could involve up to
1,900 MW built in phases over
several years and will use 380 – 525
turbines, depending on the turbine
size. This would power up to
550,000 homes.
North Carolina� The first phase of 600 MW could
begin construction as early as 2015,
depending on the BOEMRE leasing
and permitting timeline.
� Press statements indicate that the
project will cost $3 billion.274
POLICY & POLITICALENVIRONMENT � Phase 1 study: In June, 2009, theDepartment of Marine Sciences at
UNC completed a nine-month
feasibility study, commissioned by
the North Carolina General
Assembly, which concluded there is
significant potential for utility-scale
production of wind energy off the
coast and possibly within eastern
Pamlico Sound.275
� Phase 2 study: In June, 2010,Progress Energy Carolinas
partnered with UNC on a three-year
study to fully map and model North
Carolina’s viable offshore wind
resources. Total cost is about
$1 million, with $300,000 coming
from federal ARRA funds.276
� Duke Energy and UNC are
collaborating to help enable large
scale offshore wind development in
North Carolina.277 Initial wind
turbine assessments found that
North Carolina is well positioned to
develop offshore wind generation,
and that large-scale development of
off-shore wind resources is a better
approach than enabling small
projects that lack economies of
scale.278
NORTH CAROLINA OFFSHORE WIND RESOURCE146
0
10
20
30
40
50
60
70
80
>60m30-60m0-30m>60m30-60m0-30m>60m30-60m0-30m00-3nm 3-12nm 12-50nm
Pam
K Harmon
Total GW Viable Total GWm = meters deep nm = nautical miles offshore
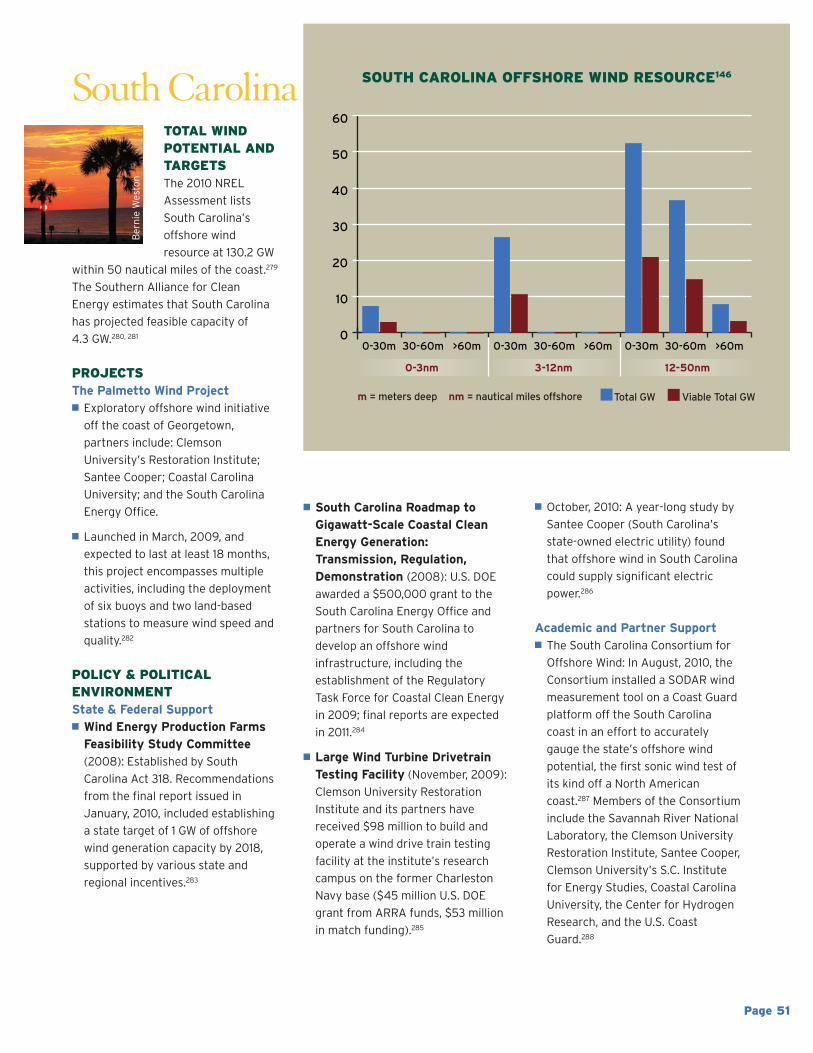
Page 51
TOTAL WINDPOTENTIAL ANDTARGETSThe 2010 NREL
Assessment lists
South Carolina’s
offshore wind
resource at 130.2 GW
within 50 nautical miles of the coast.279
The Southern Alliance for Clean
Energy estimates that South Carolina
has projected feasible capacity of
4.3 GW.280, 281
PROJECTSThe Palmetto Wind Project� Exploratory offshore wind initiative
off the coast of Georgetown,
partners include: Clemson
University’s Restoration Institute;
Santee Cooper; Coastal Carolina
University; and the South Carolina
Energy Office.
� Launched in March, 2009, and
expected to last at least 18 months,
this project encompasses multiple
activities, including the deployment
of six buoys and two land-based
stations to measure wind speed and
quality.282
POLICY & POLITICALENVIRONMENTState & Federal Support� Wind Energy Production FarmsFeasibility Study Committee(2008): Established by South
Carolina Act 318. Recommendations
from the final report issued in
January, 2010, included establishing
a state target of 1 GW of offshore
wind generation capacity by 2018,
supported by various state and
regional incentives.283
South Carolina
� South Carolina Roadmap toGigawatt-Scale Coastal CleanEnergy Generation:Transmission, Regulation,Demonstration (2008): U.S. DOEawarded a $500,000 grant to the
South Carolina Energy Office and
partners for South Carolina to
develop an offshore wind
infrastructure, including the
establishment of the Regulatory
Task Force for Coastal Clean Energy
in 2009; final reports are expected
in 2011.284
� Large Wind Turbine DrivetrainTesting Facility (November, 2009):
Clemson University Restoration
Institute and its partners have
received $98 million to build and
operate a wind drive train testing
facility at the institute’s research
campus on the former Charleston
Navy base ($45 million U.S. DOE
grant from ARRA funds, $53 million
in match funding).285
� October, 2010: A year-long study by
Santee Cooper (South Carolina’s
state-owned electric utility) found
that offshore wind in South Carolina
could supply significant electric
power.286
Academic and Partner Support� The South Carolina Consortium for
Offshore Wind: In August, 2010, the
Consortium installed a SODAR wind
measurement tool on a Coast Guard
platform off the South Carolina
coast in an effort to accurately
gauge the state’s offshore wind
potential, the first sonic wind test of
its kind off a North American
coast.287 Members of the Consortium
include the Savannah River National
Laboratory, the Clemson University
Restoration Institute, Santee Cooper,
Clemson University’s S.C. Institute
for Energy Studies, Coastal Carolina
University, the Center for Hydrogen
Research, and the U.S. Coast
Guard.288
SOUTH CAROLINA OFFSHORE WIND RESOURCE146
0
10
20
30
40
50
60
>60m30-60m0-30m>60m30-60m0-30m>60m30-60m0-30m00-3nm 3-12nm 12-50nm
Bernie Weston
Total GW Viable Total GWm = meters deep nm = nautical miles offshore
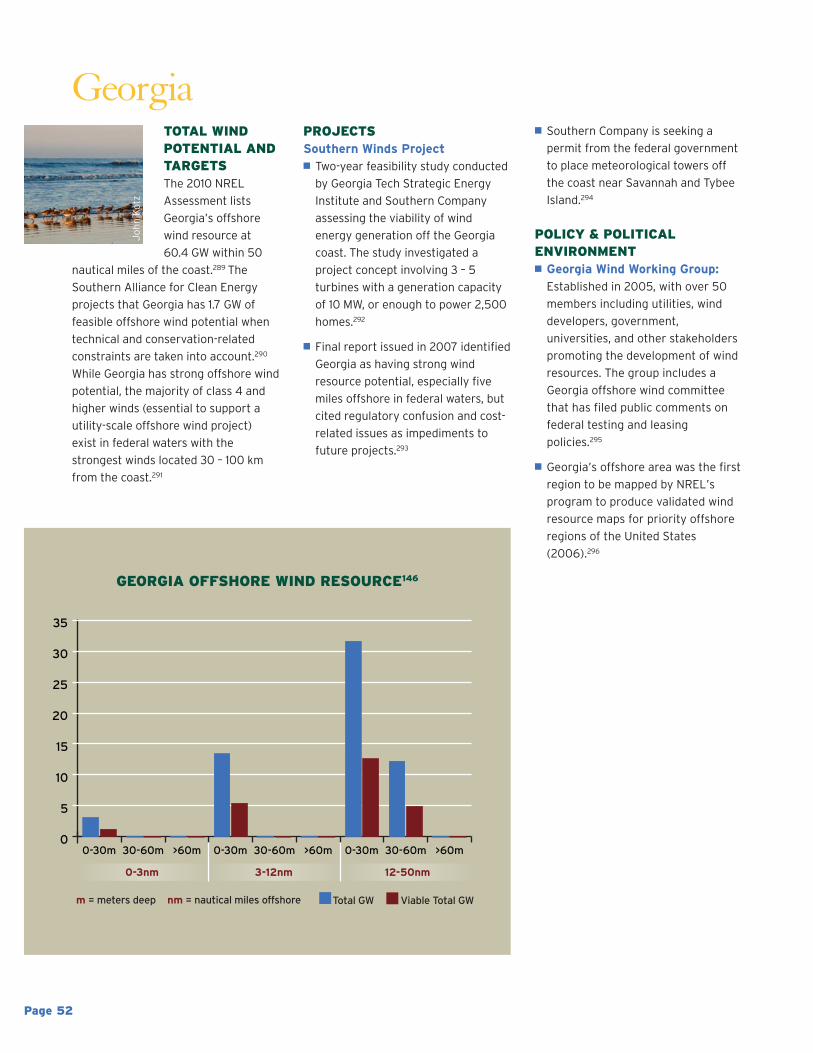
Page 52
GeorgiaTOTAL WINDPOTENTIAL ANDTARGETSThe 2010 NREL
Assessment lists
Georgia’s offshore
wind resource at
60.4 GW within 50
nautical miles of the coast.289 The
Southern Alliance for Clean Energy
projects that Georgia has 1.7 GW of
feasible offshore wind potential when
technical and conservation-related
constraints are taken into account.290
While Georgia has strong offshore wind
potential, the majority of class 4 and
higher winds (essential to support a
utility-scale offshore wind project)
exist in federal waters with the
strongest winds located 30 – 100 km
from the coast.291
PROJECTS Southern Winds Project � Two-year feasibility study conducted
by Georgia Tech Strategic Energy
Institute and Southern Company
assessing the viability of wind
energy generation off the Georgia
coast. The study investigated a
project concept involving 3 – 5
turbines with a generation capacity
of 10 MW, or enough to power 2,500
homes.292
� Final report issued in 2007 identified
Georgia as having strong wind
resource potential, especially five
miles offshore in federal waters, but
cited regulatory confusion and cost-
related issues as impediments to
future projects.293
GEORGIA OFFSHORE WIND RESOURCE146
� Southern Company is seeking a
permit from the federal government
to place meteorological towers off
the coast near Savannah and Tybee
Island.294
POLICY & POLITICALENVIRONMENT� Georgia Wind Working Group:Established in 2005, with over 50
members including utilities, wind
developers, government,
universities, and other stakeholders
promoting the development of wind
resources. The group includes a
Georgia offshore wind committee
that has filed public comments on
federal testing and leasing
policies.295
� Georgia’s offshore area was the first
region to be mapped by NREL’s
program to produce validated wind
resource maps for priority offshore
regions of the United States
(2006).296
0
5
10
15
20
25
30
35
>60m30-60m0-30m>60m30-60m0-30m>60m30-60m0-30m00-3nm 3-12nm 12-50nm
John Kotz
Total GW Viable Total GWm = meters deep nm = nautical miles offshore
Page 53
TOTAL WINDPOTENTIAL ANDTARGETSA November, 2008
report prepared for
the Florida Public
Service Commission
estimated that
Florida has an offshore wind resource
potential of 40 GW in waters less than
30 meters in depth and 88 GW in
waters 30 – 60 meters in depth.297
The 2010 NREL Assessment did not
analyze Florida’s offshore wind
resource;298 such an assessment is
needed to accurately assess the state’s
offshore wind potential.
POLICY & POLITICALENVIRONMENTDespite this potential, Florida has
many special circumstances that have
delayed the discussion around offshore
wind, including the potential for severe
hurricanes, military and NASA
operations, and the availability of
lower-cost solar installations.299 As the
capital cost for wind continues to
decrease, Florida’s offshore winds will
become a more viable energy
resource. Some discussions are
underway between the U.S.
Department of the Interior and the
State of Florida to work through some
of these barriers.300
Academic and Partner SupportIn 2009, Florida Atlantic University’s
Center for Ocean Energy Technology
(COET) deployed four current profilers
in the Atlantic Ocean to evaluate the
state’s ocean energy resources in the
Gulf Stream, with a focus primarily on
tidal energy and hydrokinetic
resources.301
Florida
1 Avro, S. (April 6, 2009). U.S. Interior Secretary: East Coast Wind Turbines canReplace 3,000 Coal Plants. Consumer Energy Report; available at:http://www.consumerenergyreport.com/2009/04/06/us-interior-secretary-east-coast-wind-turbines-can-replace-3000-coal-plants/ (accessed October 26,2010).2 Energyjustice.net (April 2007). Fact Sheet: “Clean Coal” Power Plans (IGCC);pg. 1; available at: http://www.energyjustice.net/files/coal/igcc/factsheet-long.pdf (accessed October 26, 2010). This source is citing the 2005 data setfrom: U.S. Energy Information Administration, Form EIA-860 Database AnnualElectric Generator Report; available at:http://www.eia.doe.gov/cneaf/electricity/page/eia860.html (accessed October26, 2010).3 See: Musial, W. and Ram, B. (September 2010), page 6. Large-Scale OffshoreWind Power in the United States: Assessment of Opportunities and Barriers.National Renewable Energy Laboratory. NREL-TP-500-40745; available at:http://www.nrel.gov/docs/fy10osti/40745.pdf (accessed October 26, 2010),hereinafter referred to as “Musial W. and Ram, B.”4 Musial, W. and Ram, B. (September 2010); pp. 3, 59 (using data from Table 4-2)5 See discussion of University of Maine’s deepwater offshore wind research6 See: Musial, W. and Ram, B. (September 2010), pp 2, 16. To get a moreaccurate estimate of the actual wind resources available, NREL reduces totalgross wind resources by 60% to account for environmental andsocioeconomic constraints. Individual site specific constraints are notconsidered in this calculation.7 Many factors will ultimately determine the likely available offshore windresources. Larger wind turbines, such as 10 MW turbines, could double thesefigures since they are calculated utilizing a 5 MW turbine assumption. Whilemany factors, such as wildlife impacts, were factored in the exclusion of 60%for environmentally or socially constraints, these figures could potentiallyincrease due to site specific issues. See: Musial, W. and Ram, B. (September2010); p. 4 8 Musial, W. and Ram, B. (September 2010); p. 39 Musial, W. and Ram, B. (September 2010); pp. 56-57. See also footnote 63.10 Vice Admiral McGinn, D. (July 30, 2009). Statement before the U.S. SenateEnvironment and Public Works Committee Hearing on “Climate Change andNational Security”; p. 4; available at:http://epw.senate.gov/public/index.cfm?FuseAction=Files.View&FileStore_id=1909f092-e750-4b29-b526-378ee5db1423 (accessed October 26, 2010)11 Salazar, Ken (April 2, 2009). Secretary Salazar: U.S. offshore wind resourcescan lead America’s clean-energy revolution (Press Release). Department of theInterior; available at:http://www.doi.gov/news/pressreleases/2009_04_02_release.cfm (accessed atOctober 26, 2010)
12 In 2008, a total of 4,950,000 barrels/day of crude oil was produced in theUnited States, of which only less than 1% or 21,000 barrels/day were producedby the Atlantic States. See: U.S. Energy Information Administration. Oil: Crudeand Petroleum Products Explained; Data and Statistics tab; PetroleumStatistics (2008 data) & see data pertaining to state ranking of oil production;available at:http://www.eia.doe.gov/energyexplained/index.cfm?page=oil_home#tab2(accessed on October 26, 2010).13 News Release (August 11, 2010). Consumers Set Electricity Use Records inPJM Region. PJM News; available at: http://pjm.com/~/media/about-pjm/newsroom/2010-releases/20100811-consumers-set-energy-record.ashx(accessed October 26, 2010)14 Winkelman, S. (November 21, 2008). Transportation and Climate Change:What is VMT and why should you care? Presentation at the Moving CoolerSummit; p. 10; available at: http://www.ccap.org/docs/resources/559/Winkelman%20-%20Moving%20Cooler%20Summit%20(11.21.08).pdf(accessed October 26, 2010)15 U.S. Energy Information Administration (April 2010). Annual Energy Outlook2010: With projections to 2035. DOE/EIA-0383(2010); pp. 3, 56; available at:http://www.eia.doe.gov/oiaf/aeo/pdf/0383%282010%29.pdf (accessed October26, 2010)16 Vice Admiral McGinn, D. (July 30, 2009). Statement before the U.S. SenateEnvironment and Public Works Committee Hearing on “Climate Change andNational Security”; p. 4; available at:http://epw.senate.gov/public/index.cfm?FuseAction=Files.View&FileStore_id=1909f092-e750-4b29-b526-378ee5db1423 (accessed October 26, 2010)17 Quadrennial Defense Review Report (February 2010). United StatesDepartment of Defense; p. 84; available at:http://www.defense.gov/qdr/images/QDR_as_of_12Feb10_1000.pdf (accessedOctober 26, 2010)18 Maher, K. (December 15, 2009). Black Lung on Rise, Reversing Trends. WallStreet Journal; available at:http://online.wsj.com/article/SB126083871040391327.html (accessed October26, 2010)19 From 2000 to 2010, the oil and gas industry accounted for hundreds ofdeaths, explosions, fires, seeps, and spills as well as habitat and wildlifedestruction in the United States. See: National Wildlife Federation (2010).Assault on America: A decade of petroleum company disaster, pollution andprofit; pp. 2-3, 16-17; available at: http://www.nwf.org/News-and-Magazines/Media-Center/News-by-Topic/Global-Warming/2010/~/media/PDFs/Global%20Warming/Reports/Assault-on-America-A-Decade-of-Petroleum-Company-Disaster.ashx (accessed October 26, 2010).20 Sumner, S. & Layde, P., (August 2009). Expansion of Renewable EnergyIndustries and Implications for Occupational Health. Journal of the AmericanMedical Association. 2009;302(7): pp. 787-789. For a review of these findings,see: Renewable energies will benefit US workers’ health, expert predicts(August 19, 2009). Science Daily; available at:http://www.sciencedaily.com/releases/2009/08/090818182004.htm (accessedOctober 26, 2010)
Endnotes
Katie M. H
ughes
Page 54
21 Clearly, coal is the largest source of many air pollutants; however, all fossilfuels release dangerous pollution. See: National Research Council, et al.(2009). Hidden Costs of Energy: Unpriced Consequences of Energy Productionand Use. National Academy of Sciences; available at:http://www.nap.edu/catalog.php?record_id=12794 (accessed November 18,2010). See also: Wald, M. (October 19, 2009). Fossil Fuels' Hidden Costs is inBillions, Study Says. New York Times; available at: http://www.nap.edu/catalog.php?record_id=12794 (accessed November 18, 2010)22 American Lung Association (Spring 2005). State of the Air 2005: Protectthe Air you Breathe; pp. 5, 53; available at:http://www.lungusa.org/assets/documents/publications/state-of-the-air/state-of-the-air-report-2005.pdf (accessed October 26, 2010)23 American Lung Association (Spring 2005); pp. 53-56.24 Levy, J. et al (May 2000). Estimated Public Health Impacts of CriteriaPollutant Air Emissions from the Salem Harbor and Brayton Point PowerPlants. Harvard School of Public Health and Sullivan Environmental Consulting,Inc.; also available at: http://www.airimpacts.org/documents/local/plant.pdf(accessed October 26, 2010)25 U.S. Army Corps of Engineers, New England District (last updated April2006). Cape Wind Energy Project Draft Environmental Impact Statement; pp.5-260 – 5-261; available at:http://www.nae.usace.army.mil/projects/ma/ccwf/deis.htm (accessed October26, 2010)26 The national association of state and local air quality control officersconducted a screening-level health risk assessment of diesel emissions in thefollowing report: State and Territorial Air Pollution Program Administratorsand Association of Local Air Pollution Control Officials (March 15, 2000).Cancer Risk from Diesel Particulate: National and Metropolitan Area Estimatesfor the United States; available at:http://www.4cleanair.org/comments/Cancerriskreport.PDF (accessed October26, 2010)27 U.S. Environmental Protection Agency (June 2009). 2002 National-Scale AirToxics Assessment; available at: http://www.epa.gov/ttn/atw/nata2002/(accessed October 26, 2010)28 The following report by the NWF is a compilation of over 65 publishedstudies finding elevated levels of mercury in a wide range of wildlife species:National Wildlife Federation (September 2006). Poisoning Wildlife: The Realityof Mercury Pollution; available at: http://www.nrcm.org/bv.asp?blob=91(accessed October 26, 2010)29 State of New Jersey: Blue Ribbon Panel on Development of Wind TurbineFacilities in Coastal Waters (April 2006). Final Report to Governor John S.Corzine; p. 4; available at:http://www.state.nj.us/njwindpanel/docs/finalwindpanelreport.pdf (accessedOctober 26, 2010)30 Marcellus Shale, natural gas trapped deep underground mostly inPennsylvania and New York is likely to be the largest source of potential fossilfuel in the region. However, the gas has not been tapped before because theextraction process is highly polluting and costly. So-called “hydrologicfracking” is the preferred method by gas companies that requires enormousamounts of water to be piped deep underground with potentially dangerouschemicals. The U.S. EPA has recently expressed serious concerns about thewater impacts of this process. See: U.S. EPA (March 18, 2010). EPA InitiatesHydraulic Fracturing Study: Agency seeks input from Science Advisory Board;available at:http://yosemite.epa.gov/opa/admpress.nsf/0/BA591EE790C58D30852576EA004EE3AD (accessed October 26, 2010). Furthermore, Cornell Universityprofessor of ecology and environmental biology, Robert Howarth, Ph.D., told anews conference that natural gas extracted from shale is nearly as dirty ascoal or perhaps even dirtier in terms of greenhouse gas footprint due tomethane leaks and venting into the atmosphere. See: Howarth, R.W. (March 17,2010). Preliminary Assessment of the Greenhouse Gas Emissions from NaturalGas obtained by Hydraulic Fracturing. Cornell University; available at:http://www.eeb.cornell.edu/howarth/GHG%20emissions%20from%20Marcellus%20Shale%20—%20with%20figure%20—%203.17.2010%20draft.doc.pdf(accessed October 26, 2010)31 Geredien. R. (December 7, 2009). Post-Mountaintop Removal Reclamation ofMountain Summits for Economic Development in Appalachia. Prepared for theNatural Resources Defense Fund; p. 2; available at:http://www.ilovemountains.org/reclamation-fail/mining-reclamation-2010/MTR_Economic_Reclamation_Report_for_NRDC_V7.pdf (accessedOctober 26, 2010)32 May, J. (April 2009). The Increasing Burden of Oil Refineries and Fossil Fuelsin Wilmington, CA. Communities for a Better Environment; pp. 4-5, 9-13;available at: http://www.cbecal.org/pdf/Wilmington_Refineries_report_final.pdf(accessed October 26, 2010).33 Rees, W. and Roseland, M. (June 25, 1993). From Urban Sprawl toSustainable Human Communities. PCD Forum Column #54; available at:http://www.pcdf.org/1993/54rees.htm (accessed October 26, 2010)34 U.S. EPA, Water Office (August 1995). Controlling Nonpoint Source RunoffPollution from Roads, Highways and Bridges. EPA-841-F-95-008a; available at:http://water.epa.gov/polwaste/nps/roads.cfm (accessed October 26, 2010)35 Arndt, D.S., Baringer, M.O. and Johnson, M.R., Eds. (July 2010). State of theClimate in 2009. Bull. Amer. Meteor. Soc., 91(6), S1-S224; also available at:
http://www.ncdc.noaa.gov/bams-state-of-the-climate/2009.php (accessedOctober 26, 2010)36 National Oceanic and Atmospheric Association (July 28, 2010). NOAA: PastDecade Warmest on Record According to Scientists in 48 Countries; availableat:http://www.noaanews.noaa.gov/stories2010/20100728_stateoftheclimate.html(accessed October 26, 2010)37 National Wildlife Federation (2010). Odd-ball Winter Weather: GlobalWarming’s Wakeup Call for the Northern United States; p. 3; also available at:http://www.nwf.org/News-and-Magazines/Media-Center/News-by-Topic/Global-Warming/2010/~/media/PDFs/Global%20Warming/Reports/NWF_WinterWeather_Optimized.ashx (accessed October 26, 2010)38 Boyce, D.G., Lewis, M.R., and Worm, B. (July 29, 2010). Global phytoplanktondecline over the past century. Nature 466:591-96; also available at:http://www.nature.com/nature/journal/v466/n7306/abs/nature09268.html(accessed October 26, 2010)39 Hood, M. and Broadgate W., Eds. (2009). Ocean Acidification: A summary forpolicymakers from the Second Symposium on the Ocean in a High-CO2 World;pp. 3, 5; available at: http://www.ocean-acidification.net/OAdocs/SPM-hirez2b.pdf (accessed October 26, 2010). Furthermore, the Rhode Island OceanSpecial Area Management Plan (RI SAMP) indicates: “Acidification is a concernfor marine animals, many of whom are valuable to the food chain, that haveshells or skeletons made of calcium carbonate (such as quahogs, foraminifera,slippershell snails, sea stars, and coral). It is also a concern for corrosion ofmetals on vessels and infrastructure associated with marine transportation,navigation, ports and harbors. Increased acidification may also cause morerapid deterioration of historic and cultural assets on the seafloor (such aswrecks).” Further acidification impacts are discussed in Chapter 3, Sections330 and 340 of the RI SAMP. See: RI Ocean SAMP (2010); available at:http://seagrant.gso.uri.edu/oceansamp/documents.html (accessed October 26,2010)40 Coastal Sensitivity to Sea-Level Rise: A Focus on the Mid-Atlantic Region(January 2009). U.S. Climate Change Science Program: Synthesis andAssessment Product 4.1; see the Executive Summary; also available at:http://www.epa.gov/climatechange/effects/coastal/pdfs/SAP_4-1_SynthesisandAssessmentProduct.pdf (accessed October 26, 2010). See alsoa U.S. EPA’s staffer’s analysis that sea levels are rising and projectionsestimate that a three-foot rise in sea level will push back east coast shorelinesby an average of 300 to 600 feet over the next 90 years, threatening tosubmerge high density population centers like New York City, Philadelphia andWashington D.C.; available at: http://papers.risingsea.net/index.html (accessedOctober 26, 2010)41 National Wildlife Federation webpage. Effects on Wildlife and Habitat.Available at: http://www.nwf.org/Global-Warming/Effects-on-Wildlife-and-Habitat.aspx (accessed October 26, 2010)42 These figures are based on the adoption of the EPA’s new “Clean AirInterstate Rule” proposed in July 2010, which aims to cut sulfur dioxideemissions by 71% and nitrogen oxide emissions by 52% from 2005 levels by2014. See the U.S. EPA’s webpage detailing the proposed rule:http://www.epa.gov/airquality/transport/basic.html (accessed October 26,2010)43 The figure is based almost entirely on damages resulting from air pollution-related sickness and premature death, and does not include damages fromclimate change, harm to ecosystems, effects of certain air pollutants such asmercury and risks to national security. See: National Research Council (2010).The Hidden Costs of Energy: Unpriced Consequences of Energy Productionand Use. National Academies Press; available at:http://www.nap.edu/catalog.php?record_id=12794 (accessed October 26,2010). For a report summary, see: The National Academies Press Office(October 19, 2009). Report examines hidden health and environmental costs ofenergy production and consumption in the U.S.; available at:http://www8.nationalacademies.org/onpinews/newsitem.aspx?RecordID=12794 (accessed October 26, 2010)44 Center for Integrative Environmental Research (October 2007). The U.S.Impacts of Climate Change and the Costs of Inaction (Regional highlight:Northeast and Mid-Atlantic). University of Maryland; available at:http://www.cier.umd.edu/documents/Northeast-Economic%20Impacts%20of%20Climate%20Change.pdf (accessed October26, 2010)45 Environmental Law Institute (September 2009). Estimating U.S.Government Subsidies to Energy Sources: 2002 – 2008; pp. 3, 6; available at:http://www.elistore.org/Data/products/d19_07.pdf (accessed October 26, 2010)46 “For example, currently available mounting technology (monopole) for windturbines is only suited for projects in water up to about 30 meters in depth.Projects at depths beyond 30 meters require stiffer, more substantialtechnologies that are just starting to be deployed today but are likely tobecome more prevalent within the next 5 to 10 years. For depths of greaterthan 60 meters, floating structures and advanced technologies may berequired, and are not likely to be widely used for at least 10 years.” SeeTierney, S.F., with Okie, A., and Carpenter, S. (December 2009). StrategicOptions for Investment in Transmission in Support of Offshore WindDevelopment in Massachusetts. Analysis Group; pp. 3-4; available at:http://www.analysisgroup.com/uploadedFiles/Publishing/Articles/Strategic_Options_Offshore_Wind_12-01-09.pdf (accessed October 26, 2010)
Page 55
47 Schwartz, M., Heimiller D., Haymes S., and Musial W. (June 2010).Assessment of Offshore Wind Energy Resources for the United States.National Renewable Energy Laboratory. Technical Report NREL/TP-500-45889; pp. 2-4 (Table 1); available at:http://www.nrel.gov/docs/fy10osti/45889.pdf (accessed October 26, 2010)48 The United States Department of Energy (US DOE) target is a national goal,though focused on the Atlantic and the Great Lakes. See: US DOE (September22, 2010). Creating an Offshore Wind Industry in the United States: A StrategicWork Plan for the United States Department of Energy (Predecisional Draft); p.7; available at:http://www.windpoweringamerica.gov/pdfs/offshore/offshore_wind_strategic_plan.pdf (accessed October 26, 2010) 49 A University of Massachusetts at Amherst study found investments in windprojects provide 157 percent higher direct and indirect job creation than in theoil and natural gas production sectors. See R. Pollin, J., Heintz, and Garrett-Peltier, H. (June 2009). The Economic Benefits of Investing in Clean Energy:How the economic stimulus program and new legislation can boost U.S.economic growth and employment, Department of Economics and PoliticalEconomy Research Institute (PERI), University of Massachusetts, Amherst; p.28; available at:http://www.americanprogress.org/issues/2009/06/pdf/peri_report.pdf(accessed October 26, 2010)50 Virginia Coastal Energy Research Consortium (April 2010). Virginia OffshoreWind Studies, July 2007 to March 2010: Final Report; pp. 28-29; available at:http://www.vcerc.org/VCERC_Final_Report_Offshore_Wind_Studies_Full_Report_new.pdf (accessed October 26, 2010).51 Virginia Coastal Energy Research Consortium (April 2010); p. 28. The U.S.DOE estimated that the cumulative economic impact from just 1,000 MW ofwind power in the State of Massachusetts would amount to $1.4 billion ineconomic benefit, annual CO2 reductions of 2.6 million tons, annual watersavings of 1.3 billion gallons, 3,251 new local jobs added during construction,and 462 new local long-term jobs added. See: NREL (March 2009).Massachusetts Wind Benefits Factsheet. U.S. Department of Energy; availableat:http://www.windpoweringamerica.gov/pdfs/economic_development/2009/ma_wind_benefits_factsheet.pdf (accessed October 26, 2010) 52 Maine Ocean Energy Task Force (December 2009). Final Report of theOcean Energy Task Force to Governor John E. Baldacci; pp. 9-10; available at:http://www.maine.gov/spo/specialprojects/OETF/Documents/finalreport_123109.pdf (accessed October 26, 2010) 53 Flynn, R.J., and Carey R.T. (February 2007). The Potential Economic Impactof an Off-shore Wind Farm to the State of South Carolina. The StromThurmond Institute, Clemson University; pp. 3,9; available at:http://www.clemson.edu/scies/wind/Paper-Flynn.pdf (accessed October 26,2010)54 Musial, W. and Ram, B. (September 2010); pp. 2, 4, 17. NREL reduces grosswind resources by 60% to account for environmental and socioeconomicconstraints. 55 Asmus, P. (October 20, 2010). U.S. Offshore Wind Industry Gets Not One, butTwo Major Boosts. Renewable Energy World; available at:http://www.renewableenergyworld.com/rea/news/article/2010/10/u-s-off-shore-wind-industry-gets-not-one-but-two-major-boosts?cmpid=WindNL-Wednesday-October20-2010 (accessed October 26, 2010)56 European Wind Energy Association (January 2009). Wind at Work: WindEnergy and Job Creation in the EU; pp. 8; available at:http://ewea.org/fileadmin/ewea_documents/documents/publications/Wind_at_work_FINAL.pdf (accessed October 26, 2010)57 European Wind Energy Association (January 2009); p. 22.58 Pude, S. and Garratt-Reed, G. (February-March 2010). Beyond Power: Willoffshore wind development bring jobs? The Working Waterfront; available at:http://www.workingwaterfront.com/articles/Beyond-power-Will-offshore-wind-development-bring-jobs/13695/ (accessed October 26, 2010)59 European Wind Energy Association (January 2009); pp. 7-9. 60 Specifically, the study focused on 75 miles of coastal area from Seaside Parkto North Wildwood and explored 1,360 nautical miles. The study assessed theabundance, distribution and migratory patterns of birds, fish, marinemammals and sea turtles. It also examined shipping lanes, pipelines, tug andbarge transit routes and undersea utility lines, while mapping artificial reefs,commercial and recreational fishing areas, and marine protected areas. See:New Jersey Department of Environmental Protection (July 2010). Ocean/WindPower Ecological Baseline Studies: January 2008-December 2009. Preparedby Geo-Marine Inc.; available at: http://www.nj.gov/dep/dsr/ocean-wind/report.htm (accessed October 26, 2010)61 Wood Mackenzie (September 17, 2010). Long-term viability of many U.S. coalplants at risk (Press Release); available at:http://www.woodmacresearch.com/cgi-bin/corp/portal/corp/corpPressDetail.jsp?oid=2178098 (accessed October 26,2010)62 US DOE (September 22, 2010). Creating an Offshore Wind Industry in theUnited States: A Strategic Work Plan for the United States Department ofEnergy (Predecisional Draft); p. 7; available at:http://www.windpoweringamerica.gov/pdfs/offshore/offshore_wind_strategic_
plan.pdf (accessed October 26, 2010)63 U.S. Energy Information Administration (October 14, 2010). Average RetailPrice of Electricity to Ultimate Customers by End-Use Sector, by State;available at: http://www.eia.doe.gov/cneaf/electricity/epm/table5_6_a.html(accessed October 26, 2010). Figures are based on the average price forelectricity for all sectors in July 2010.64 Daley, B. (October 10, 2010). Cape Wind backers blew right by cost.Boston.com; available at:http://www.boston.com/news/science/articles/2010/10/10/cape_wind_backers_blew_right__by_cost/ (accessed October 26, 2010)65 78% of the country’s energy is consumed by coastal states, with only one-fifth of those states being able to meet 20% or more of their energy demandsthrough land-based wind generation. See: Musial, W. (Fall, 2007). OffshoreWind Electricity: A Viable Energy Option for the Coastal United States. MarineTechnology Society Journal, 42 (3); pp. 32-43.66 NREL (January 2010). Eastern Wind Integration and Transmission Study.Prepared by the EnerNex Corporation; pp. 114-15; available at:http://www.nrel.gov/wind/systemsintegration/pdfs/2010/ewits_final_report.pdf(accessed October 26, 2010). When comparing Scenarios 1 and 3, see inparticular Table 4.4 of the NREL report.67 See a letter dated 4 May 2009 sent by 10 Northeast Governors to Congressagainst transmitting energy from the Midwest. A copy of the letter is availableat: http://www.pecva.org/anx/ass/library/96/east-coast-govs-transmission-ltr.pdf (accessed October 26, 2010). See also: Yang, Chi-Jen (August 2009).Electrical Transmission: Barriers and Policy Solutions. Climate Change PolicyPartnership: Duke University; available at:http://nicholas.duke.edu/ccpp/ccpp_pdfs/transmission.pdf (accessed October26, 2010). 68 A case study by ISO-NE on the effective integration of renewable resourcesinto the New England power grid by 2030 concluded that a scenario with themost offshore wind resource integration results in the most cost-effective useof new and existing transmission infrastructure. Similarly, the US DOE hasindicated that offshore wind projects would not face the expensivetransmission line-related challenges that are inherent to projects that importonshore wind from the Midwest to the Northeast and Atlantic States. See: ISONew-England, Inc. (February 2010). New England Power System Study 2030:Report to New England Governors; pp. 1-4, pp. 14-15 (Table 05); available at:http://www.newengland-rto.com/committees/comm_wkgrps/prtcpnts_comm/pac/reports/2010/economicstudyreportfinal_022610.pdf (accessed October 26, 2010). See also: U.S.DOE/MA Technology Colloborative/General Electric (September 2005). AFramework for Offshore Wind Energy Development in the United States; p. 10;available at: http://www.masstech.org/offshore/final_09_20.pdf (accessedOctober 26, 2010)69 NREL (January 2010); pp. 114-15.70 Kempton, W.; Archer, C.L.; Dhanju, A.; Garvine, R.W.; and Jacobson, M.Z.(2007). Large CO2 reductions via offshore wind power matched to inherentstorage in energy end-uses. Geophys. Res. Lett. Vol 34; article proof; availableat: http://www.ceoe.udel.edu/windpower/docs/KemptonEtAl-MAB-PROOF.pdf(accessed October 26, 2010) 71 Kempton, W.; Pimenta, F.P.; Veron, D.E.; and Colle, B.A. (2010). Electric powerfrom offshore wind via synoptic-scale interconnection. PNAS DirectSubmission; available at:http://www.pnas.org/content/early/2010/03/29/0909075107.full.pdf (accessedOctober 26, 2010)72 Wald, M. (October 12, 2010). Offshore wind power line wins backing. NewYork Times; available at:http://www.nytimes.com/2010/10/12/science/earth/12wind.html (accessedOctober 26, 2010)73 Eilperin, J. (October 12, 2010). Google helps finance ‘superhighway’ for windpower. The Washington Post; available at: http://www.washingtonpost.com/wp-dyn/content/article/2010/10/12/AR2010101202271.html (accessed October 26,2010)74 1 GW of installed wind power capacity can generate 3.2 million MW/h ofelectricity annually; the same amount of electricity generated by fossil fuelswould emit 1.8 million metric tons of carbon dioxide. See: US DOE (September22, 2010). Creating an Offshore Wind Industry in the United States: A StrategicWork Plan for the United States Department of Energy (Predecisional Draft); p.10; available at:http://www.windpoweringamerica.gov/pdfs/offshore/offshore_wind_strategic_plan.pdf (accessed October 26, 2010)75 According to data for 2008 from the US EIA, the net energy generation ofthe coal industry in the United States was 1,986 million MW/h. Assuming thatthere are 614 coal plants, this means that on average a single coal plantproduces 3.32 million MW/h. Accordingly, it would take 52 coal plants togenerate the equivalent energy produced by 54 GW of wind power (and itsgeneration potential of 172.8 million MW/h annually). See the 2008 data setfrom: U.S. Energy Information Administration. Table 2.1. Net Generation byEnergy Source by Type of Producer, 1997 through 2008 (ThousandMegawatthours). Net Generation by Energy Source by Type of Producer;available at: http://www.eia.doe.gov/cneaf/electricity/epa/epat2p1.html(accessed October 26, 2010)
Page 56
76 According to the US EPA, annual emissions from a typical passenger vehicleshould be equatedto 5.5 metric tons of carbon dioxide equivalent. See: U.S.EPA (February 2005). Emission Facts: Greenhouse Gas Emissions from aTypical Passenger Vehicle; p. 2; available at:http://www.epa.gov/oms/climate/420f05004.pdf (accessed October 26, 2010)77 The U.S. EPA estimates that “typical” annual carbon dioxide emissions are14,796 pounds per household (which converts to 6.71 metric tons). See: U.S.EPA (last updated March 3, 2010). Household Emissions CalculatorAssumptions and References; available at:http://www.epa.gov/climatechange/emissions/ind_assumptions.html (accessedOctober 26, 2010)78 Crawley, J. (May 21, 2010). U.S. unveils new push for more efficient cars,trucks. Reuters; available at:http://www.reuters.com/article/idUSTRE64K4JK20100521 (accessed October26, 2010)79 Wald, M. (July 27, 2010). Wind drives growing use of batteries. New YorkTimes; available at: http://www.nytimes.com/2010/07/28/business/energy-environment/28storage.html?_r=1 (accessed October 26, 2010); see also TheEdison Project: Electric vehicles in a Distributed and Integrated market usingSustainable energy and Open Networks, information on the project is availableat: http://www.dtu.dk/centre/cet/English/research/projects/22_The_EDISON_project.aspx (accessed October 26, 2010); see also: Parsons, S. (March 31,2010). University of Delaware’s electric vehicles give power back to the grid.Inhabitat; available at: http://www.inhabitat.com/2010/03/31/university-of-delawares-electric-vehicles-give-power-back-to-the-grid/ (accessed October26, 2010); see also Austinenergy.com’s webpage on “Getting Ready for Plug-inElectric Vehicles”:http://www.austinenergy.com/About%20Us/Environmental%20Initiatives/Plug-in%20Hybrid%20Vehicles/index.htm (accessed October 26, 2010); see alsoPG&E’s webpage on “Electric Vehicle Charging Rate and Economics”:http://www.pge.com/about/environment/pge/electricvehicles/fuelrates/index.shtml (accessed October 26, 2010)80 The program will reduce CO2 emissions from power plants by 10 percent by2018. See http://www.rggi.org/home (accessed October 26, 2010)81 For information on various transportation emission-related agreements, seeGeorgetown Climate Center’s online resource at:http://www.georgetownclimate.org/transportation/index.php (accessedOctober 26, 2010)82 U.S. Energy Information Administration (May 2009); available at:http://apps1.eere.energy.gov/states/maps/renewable_portfolio_states.cfm#chart (accessed October 26, 2010)83 The 2009 State Energy Efficiency Scorecard (October 2009). AmericanCouncil for an Energy-Efficient Economy, Report Number E097; available at:http://www.aceee.org/research-report/e097 (accessed October 26, 2010)84 See the “New Jersey Clean Energy Program”: www.njcleanenergy.com(accessed October 26, 2010).85 For details on state wind energy projects, including wind-energy rankings,see the website of the “American Wind Energy Association”:http://www.awea.org/projects/default.aspx (accessed October 26, 2010)86 For state-by-state profiles on biomass projects and profiles, see informationcompiled by the U.S. Energy Information Administration, available at:http://www.afdc.energy.gov/afdc/sabre/index.php (accessed October 26, 2010)87 The challenge is far greater for southern Atlantic states, which have notadvanced as aggressive energy efficiency and renewable energy initiatives.North Carolina’s Renewable Energy Portfolio Standard, while mandatory, setsa low bar of only 12.5% by 2021, compared with New York’s 29% by 2015 andNew Jersey’s 22.5 by 2021. For information on state energy initiatives, see theU.S. DOE’s ‘Database of State Incentives for Renewables & Efficiency (DSIRE):http://www.dsireusa.org/ (accessed October 26, 2010)88 Wind Power Engineering (August 10, 2010). In Europe, 118 offshore windturbines connect to grid in first half of 2010; available at:http://www.windpowerengineering.com/featured/business-news-projects/in-europe-118-offshore-wind-turbines-connect-to-grid-in-first-half-of-2010/(accessed November 9, 2010). This is based on the American Wind EnergyAssociation’s projection that 1 MW of wind energy supplies electricity for 225to 300 homes per year: http://www.awea.org/faq/wwt_basics.html (accessedOctober 26, 2010)89 US DOE (September 22, 2010); p. 10.90 European Wind Energy Association (January 2010). The European OffshoreWind Industry: Key Trends and Statistics, 2009; p. 6; available at:http://www.ewea.org/fileadmin/emag/statistics/2009offshore (accessedOctober 26, 2010). 91 European Wind Energy Association (September 2009). Oceans ofOpportunity: Harnessing Europe’s largest domestic energy resource; p. 13;available at: http://www.ewea.org/fileadmin/ewea_documents/documents/publications/reports/Offshore_Report_2009.pdf (accessed October 26, 2010) 92 European Wind Energy Association (2010). Factsheet: Employment. WindEnergy Factsheets; available at:http://www.ewea.org/fileadmin/swf/factsheet/8_employment.pdf (accessedOctober 26, 2010)93 OffshoreWind.biz (May 7, 2010). China finishes its first offshore wind farm;available at: http://www.offshorewind.biz/2010/05/07/china-finishes-its-first-offshore-wind-farm/ (accessed October 26, 2010)
94 Fairley, P. (April 5, 2010). Chinese Wind Power Heads Offshore. MITTechnology Review; available at:http://www.technologyreview.com/energy/24978/?ref=rss (accessedNovember 1, 2010)95 Adams, M. (October 29, 2010). China: Beijing in the running to take crown forwind turbines. The Financial Times; available at:http://www.ft.com/cms/s/0/972a7b8e-e2e8-11df-9735-00144feabdc0.html(accessed November 1, 2010).96 According to plans prepared by the Chinese coastal provinces, the installedcapacity of offshore wind power is planned to reach 32,800 MW by 2020. See:Junfeng, L. et al (October 2010). China Wind Power Outlook 2010. Reportprepared by Chinese Renewable Energy Industries Association, Global WindEnergy Association and Greenpeace; pp. 7, 21; available at:http://www.greenpeace.org/raw/content/china/en/press/reports/wind-power-report-english-2010.pdf (accessed November 1, 2010)97 Proposed projects have been publicly announced and are at a variety ofinitial stages in the planning process. MW is list nameplate capacity.98 Advancing projects meet all of the criteria for proposed projects, and havetaken additional steps, including leasing, permitting, power contracts andother concrete steps toward project completion.99 1 GW of installed wind power capacity can generate 3.2 million MW/h ofelectricity annually; the same amount of electricity generated by fossil fuelswould emit 1.8 million metric tons of carbon dioxide. See: US DOE (September22, 2010). Creating an Offshore Wind Industry in the United States: A StrategicWork Plan for the United States Department of Energy (Predecisional Draft); p.10; available at: http://www.windpoweringamerica.gov/pdfs/offshore/offshore_wind_strategic_plan.pdf (accessed October 26, 2010). According to data for2008 from the US EIA, the net energy generation of the coal industry in theUnited States was 1,986 million MW/h. Assuming that there are 614 coal plants,this means that on average a single coal plant produces 3.32 million MW/h.Accordingly, it would take 52 coal plants to generate the equivalent energyproduced by 54 GW of wind power (and its generation potential of 172.8 millionMW/h annually). See the 2008 data set from: U.S. Energy InformationAdministration. Table 2.1. Net Generation by Energy Source by Type ofProducer, 1997 through 2008 (Thousand Megawatthours). Net Generation byEnergy Source by Type of Producer; available at:http://www.eia.doe.gov/cneaf/electricity/epa/epat2p1.html (accessed October26, 2010)100 According to the US EPA, annual emissions from a typical passenger vehicleshould be equated to 5.5 metric tons of carbon dioxide equivalent. See: U.S.EPA (February 2005). Emission Facts: Greenhouse Gas Emissions from aTypical Passenger Vehicle; p. 2; available at:http://www.epa.gov/oms/climate/420f05004.pdf (accessed October 26, 2010)101 President Obama’s Fiscal Year 2011 budget designates $2.36 billion to theDOE Office of Energy Efficiency and Renewable Energy (EERE), which is a 5percent increase from last year and does not include ARRA grants. The EERE’sbudget for wind power programs in FY2011 has increased by 53 percent fromFY2010. The budget proposal eliminates more than $2.7 billion in tax subsidiesfor oil, coal and gas industries, which is estimated to save the federalgovernment $38.8 billion dollars in revenue over the next 10 years. Similarly,the DOI New Energy Frontier initiative includes $73.3 million for renewableenergy programs, a 24% increase above FY2010 funding levels, with $34.9million allocated to the MMS for energy activities on the OCS. See: Eber, K. andTucker, E. (February 8, 2010). U.S. Government Budget Proposals IncreaseClean Energy Funding. Reprinted on RenewableEnergyWorld.com; available at:http://www.renewableenergyworld.com/rea/news/article/2010/02/us-government-budget-proposals-increase-clean-energy-funding (accessedOctober 26, 2010). The American Recovery and Reinvestment Act of 2009 hasawarded $16.8 billion to EERE clean energy programs and initiatives. From thatamount, at least $116.8 million has been awarded to wind energy projectsacross the country and an additional $104.7 million to NREL-related windprojects, not including funding for energy efficiency programs that benefitwind projects. For a list of projects that have received funding, see:http://www1.eere.energy.gov/recovery/ (accessed October 26, 2010).102 See US DOE (September 22, 2010); p. 15. Also see the various NREL reportsmentioned in this report; in particular, see: Musial, W. and Ram, B. (September2010).103 The following 10 states have signed to the Consortium: Maine, NewHampshire, Massachusetts, Rhode Island, New York, New Jersey, Delaware,Maryland, Virginia and North Carolina. A copy of the signed Memorandum ofUnderstanding establishing the Consortium can be found at:http://www.governor.virginia.gov/tempContent/Atlantic_Consortium_MOU-6_08_10.pdf (accessed October 26, 2010)104 In April 2009, the US Department of the Interior (DOI) and the FederalEnergy Regulatory Commission (FERC) signed a Memorandum ofUnderstanding (MOU) that gave the DOI’s Mineral and Management Service(MMS) exclusive jurisdiction over leasing, licensing, and conducting necessaryenvironmental reviews related to non-hydrokinetic projects on the OCS (i.e.offshore wind projects):http://www.ferc.gov/legal/maj-ord-reg/mou/mou-doi.pdf (accessed October 26, 2010). Providing further clarification, the MMSadopted a ‘Final Rule’ effective June 29, 2009, which established a frameworkfor granting leases for the siting and construction of offshore wind farms onthe OCS. Key provisions include: a method for sharing revenues generatedfrom OCS projects with adjacent coastal states; enhanced partnershipsbetween Federal, state and local agencies and tribal governments on ensuring
Page 57
the cost-effectiveness and environmental sensitivity of projects; and placingresponsibility on the MMS to ensure project compliance with relevant federalregulations, such as the National Environmental Policy Act, the EndangeredSpecies Act of 1973, the Coastal Zone Management Act, the Rivers andHarbors Appropriations Act of 1899, among others. See the Rule at:http://www.mms.gov/offshore/RenewableEnergy/PDF/FinalRenewableEnergyRule.pdf (accessed October 26, 2010) 105 Straub, N. (May 20, 2010). Interior unveils plans to split MMS into 3agencies. New York Times; available at:http://www.nytimes.com/gwire/2010/05/20/20greenwire-interior-unveils-plan-to-split-mms-into-3-agen-72654.html (accessed October 26, 2010)106 U.S. Department of the Interior (November 23, 2010) Press Releaseavailable at: http://www.boemre.gov/offshore/RenewableEnergy/index.htm107 As a result of the streamlined regulations, the MMS has issued severalleases for the development of offshore projects on the OCS, including: aRequest for Interest for renewable energy development off the coast ofDelaware (April 2010), five limited exploratory leases for the construction ofmeteorological towers off the shores of New Jersey and Delaware to gatherdata that will assist in determining the optimal sites for wind farms (June2009), and the approval of a commercial lease for the construction andoperation of the Cape Wind Energy Project (April 2010). For the historic‘Record of Decision’ by the MMS in regards to the Cape Wind Project, see:http://www.mms.gov/offshore/RenewableEnergy/PDFs/CapeWindROD.pdf(accessed October 26, 2010). See also: U.S. Department of the Interior(October 6, 2010). Press Release: Salazar signs first U.S. offshore commercialwind energy lease with Cape Wind Associates, LLC; available at:http://www.doi.gov/news/pressreleases/Salazar-Signs-First-US-Offshore-Commercial-Wind-Energy-Lease-with-Cape-Wind-Associates-LLC.cfm(accessed October 26, 2010)108 The White House Council on Environmental Quality (July 19, 2010). FinalRecommendations of the Interagency Ocean Policy Task Force; available at:http://www.whitehouse.gov/files/documents/OPTF_FinalRecs.pdf (accessedOctober 26, 2010)109 OffshoreWind.biz (April 20, 2010). U.S.: Brown introduces new bill to helpmake clean energy production a reality; available at:http://www.offshorewind.biz/2010/04/20/us-brown-introduces-new-bill-to-help-make-clean-energy-production-a-reality/ (accessed October 26, 2010)110 Bradbury, D. (March 15, 2010). Senators prepare bill to bolster nascent deep-water sector. BusinessGreen; available at:http://www.businessgreen.com/business-green/news/2259477/senators-prepare-bill-bolster (accessed October 26, 2010)111 U.S. Committee on Natural Resources (July 26, 2010). Summary and Section-by-Section of Chairman Rahall’s CLEAR Act (H.R. 3534); available at:http://resourcescommittee.house.gov/index.php?option=com_content&task=view&id=641&Itemid=27 (accessed October 26, 2010)112 The Clean Energy Jobs and Oil Company Accountability Act of 2010 (S. 3663);http://democrats.senate.gov/pdfs/The_Clean_Energy_Jobs_and_Oil_Company_Accountability_Act_of_2010.pdf (accessed October 26, 2010)113 Office of Governor Martin O’Malley (November 10, 2009). Mid-Atlanticgovernors commit to offshore wind partnership. Maryland.gov; available at:http://www.governor.maryland.gov/pressreleases/091110.asp (accessedOctober 26, 2010)114 U.S. Offshore Wind Collaborative: http://www.usowc.org (accessed October26, 2010)115 AWEA Offshore Wind Working Group:http://www.awea.org/faq/wwt_offshore.html (accessed October 26, 2010)116 OffshoreWind.biz (July 16, 2010). AWEA announces new offshore windcoalition (USA); available at: http://www.offshorewind.biz/2010/07/16/awea-announces-new-offshore-wind-coalition-usa/ (accessed October 26, 2010)117 Winter, A. (February 5, 2010). NOAA grant proposal could launch marinezoning. New York Times; available at:http://www.nytimes.com/gwire/2010/02/05/05greenwire-noaa-grant-proposal-could-launch-marine-zoning-54858.html (accessed October 26, 2010)118 http://www.ioos.gov/partners/regional.html (accessed November 18, 2010)119 Governors’ Wind Energy Coalition (March 2010). Great Expectation: U.S.Wind Energy Development. 2010 Wind Energy Recommendations; available at:http://www.governorswindenergycoalition.org/assets/files/GWC%202010%20Recommendations%20%28FINAL%203-16-10%29.pdf (accessed October 26,2010)120 US DOE (July 2008). 20% Wind Energy by 2030: Increasing Wind Energy’sContribution to U.S. Electricity Supply. DOE/GO-102008-2567; p. 124; availableat: http://www.nrel.gov/docs/fy08osti/41869.pdf (accessed October 26, 2010) 121 The needs are clear: identification of data gaps and associated baselinedata; reaching U.S.-applicable conclusions from European fish and wildlifestudies; developing publicly-available fish and wildlife databases; undertakingsite specific fish and wildlife studies; researching and developing better pre-construction and post-construction tools, methods, and metrics for offshorewind; and reaching stakeholder consensus on fish and wildlife risk assessmentstrategies. See: US DOE (September 22, 2010); pp. 34-5.122 US DOE (July 2008); p. 124. The Danish study can be found athttp://193.88.185.141/Graphics/Publikationer/Havvindmoeller/index.htm. Foradditional information on European studies, http://www.wind-energy-the-
facts.org/en/environment/chapter-2-environmental-impacts/impacts-on-marine-mammals-and-sea-birds.html. (accessed November 18, 2010)123 Fox, T.; Desholm, M.; Kahlert, J.; Petersen, I.K.; and Christensen, T.K.(November 2006). Assessing effects of the Horns Rev and Nysted offshorewind farms on birds — conclusions from 6 years’ monitoring. Final ResultsConference, November 27-29, 2006, National Environmental ResearchInstitute; available at:http://www.bluewaterwind.com/pdfs/Horns_Rev_and_Nysted_six_years.pdf(accessed October 26, 2010)124 MMS (2009), Survey of Available Data on OCS Resources and Identificationof Data Gaps, MMS Report to the Secretary of the Interior. OCS Report MMS2009-015; pp 8-9; available at:http://www.doi.gov/whatwedo/energy/ocs/loader.cfm?csModule=security/getfile&PageID=37041 (accessed October 26, 2010)125 Boehlert, G.W. and Gill, A.B. (2010). Environmental and Ecological Effects ofOcean Renewable Energy Development: a current synthesis. Oceanography.Vol. 23(2). pp. 76-77; available at:http://www.tos.org/oceanography/issues/issue_archive/issue_pdfs/23_2/23-2_boehlert.pdf (accessed November 13, 2010). See also: Brandt, M.J.;Diederichs, A.; and Nehls, G. (2009). Harbour Porpoise Responses to PileDriving at the Horns Rev II Offshore Wind Farm in the Danish North Sea.BioConsultSH Final Report to DONG Energy; available at:http://www.dongenergy.com/SiteCollectionDocuments/NEW%20Corporate/HR2/Marsvins_reaktionsmonstre.pdf (accessed November 12, 2010)126 MMS (2009); pp. 9, III-36.127 MMS (2009); p. III-36. See also: Michel, J. et al. (2007). Worldwide Synthesisand Analysis of Existing Information Regarding Environmental Effects ofAlternative Energy Uses on the Outer Continental Shelf. Prepared for andpublished by the U.S. MMS. OCS Report MMS 2007-038; pp. 5-38, 5-72, 5-73, 5-81; available at: http://www.boemre.gov/itd/pubs/2007/2007-038.pdf(accessed November 12, 2010)128 See: Lemming, J.; Morthorst, P.E.; and Clausen, N.E. (January 2008).Offshore Wind Power Experiences, Potential and Key Issues for Deployment.Riso National Laboratory for Sustainable Energy, Technical University ofDenmark; available at:http://www.dtu.dk/Service/Telefonbog.aspx?lg=showcommon&id=244344(accessed October 26, 2010); see also: Everaert, J. and Stienen, E.W.M. (2007).Impact of wind turbines on birds in Zeebrugge (Belgium) - Significant effect onbreeding tern colony due to collisions. Biodivers Conserv 16:3345-3359;available at: www.vliz.be/imisdocs/publications/129846.pdf (accessed October26, 2010)129 Bird density is much more decreased in offshore environments than in land-based environments. See: Gordon, C. (December 2009). Integrating WildlifeRisk Considerations into Offshore Wind Permitting Processes: Challenges andOpportunities,” Pandion Systems, Inc., Presentation given at the AWEAOffshore Wind Project Workshop; slide 6; available at:http://www.pandionsystems.com/LinkClick.aspx?fileticket=sbvFUCq06zQ%3d&tabid=149 (accessed October 26, 2010)130 New Jersey Department of Environmental Protection (May 2007). Status ofthe Red Knot (Calidris canutus rufa) in the Western Hemisphere. Prepared forthe U.S. Fish and Wildlife Service, Ecological Services, Region 5; pp. iii, 3, 139-140; available at:http://www.fws.gov/northeast/PDF/RedKnotAssessmentMay2007.pdf(accessed October 26, 2010)131 Cape May County Herald (March 25, 2008). Corzine pens moratorium onHorseshoe Crab harvesting; available at:http://www.capemaycountyherald.com/article/26311-corzine-pens-moratorium-horseshoe-crab-harvesting (accessed October 26, 2010); see also:Environment News Service (March 17, 2010). Maryland limits Horseshoe Crabharvest to feed Red Knots; available at: http://www.ens-newswire.com/ens/mar2009/2009-03-17-091.html (accessed October 26,2010); see also: Delaware Department of Natural Resources and EnvironmentalControl (June 11, 2007). In Re: Adoption of emergency regulations, HorseshoeCrab Annual Harvest Limit and Season; available at:http://www.dnrec.delaware.gov/SiteCollectionDocuments/DNREC%20Portal/SecOrders/HorseshoeCrabEmergencyOrder.pdf (accessed October 26, 2010; seealso: PBS Nature’s television episode relating to Red Knots and HorseshoeCrabs; the episode aired in February 2008 and is available at:http://www.pbs.org/wnet/nature/episodes/crash-a-tale-of-two-species/introduction/592/ (accessed October 26, 2010).132 Red knots could be particularly affected by global climate change, whichmay be greatest at the latitudes where this species breeds and winters. See:U.S. Fish and Wildlife Services, Northeast Region webpage on Red Knots (lastupdated June 9, 2010); available at: http://www.fws.gov/northeast/redknot/(accessed October 26, 2010); See also: Shelton, S. (last updated October 4,2010). Red Knots, Horseshoe Crabs and Climate Change. U.S. Fish and WildlifeService; available at:http://www.fws.gov/home/climatechange/stories/redknotshoreshoecrabs.html(accessed October 26, 2010)133 A new 2010 study “indicates that horseshoe crabs numbers may continue todecline in the future because of predicted climate change,” said Tim King, ascientist with the U.S. Geological Survey. See: U.S. Geological Survey (August30, 2010). Climate change implicated in decline of horseshoe crabs; availableat: http://www.usgs.gov/newsroom/article.asp?ID=2576 (accessed October 26,2010)
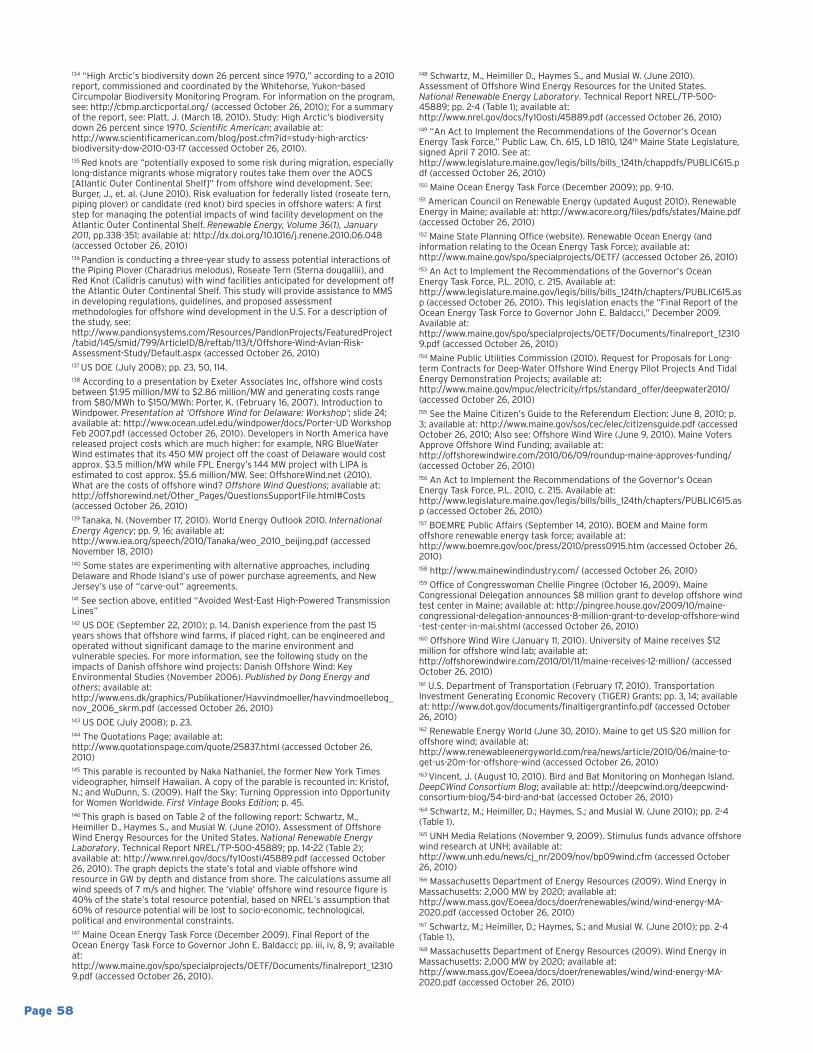
Page 58
134 “High Arctic’s biodiversity down 26 percent since 1970,” according to a 2010report, commissioned and coordinated by the Whitehorse, Yukon–basedCircumpolar Biodiversity Monitoring Program. For information on the program,see: http://cbmp.arcticportal.org/ (accessed October 26, 2010); For a summaryof the report, see: Platt, J. (March 18, 2010). Study: High Arctic’s biodiversitydown 26 percent since 1970. Scientific American; available at:http://www.scientificamerican.com/blog/post.cfm?id=study-high-arctics-biodiversity-dow-2010-03-17 (accessed October 26, 2010).135 Red knots are “potentially exposed to some risk during migration, especiallylong-distance migrants whose migratory routes take them over the AOCS[Atlantic Outer Continental Shelf]” from offshore wind development. See:Burger, J., et. al. (June 2010). Risk evaluation for federally listed (roseate tern,piping plover) or candidate (red knot) bird species in offshore waters: A firststep for managing the potential impacts of wind facility development on theAtlantic Outer Continental Shelf. Renewable Energy, Volume 36(1), January2011, pp.338-351; available at: http://dx.doi.org/10.1016/j.renene.2010.06.048(accessed October 26, 2010)136 Pandion is conducting a three-year study to assess potential interactions ofthe Piping Plover (Charadrius melodus), Roseate Tern (Sterna dougallii), andRed Knot (Calidris canutus) with wind facilities anticipated for development offthe Atlantic Outer Continental Shelf. This study will provide assistance to MMSin developing regulations, guidelines, and proposed assessmentmethodologies for offshore wind development in the U.S. For a description ofthe study, see:http://www.pandionsystems.com/Resources/PandionProjects/FeaturedProject/tabid/145/smid/799/ArticleID/8/reftab/113/t/Offshore-Wind-Avian-Risk-Assessment-Study/Default.aspx (accessed October 26, 2010) 137 US DOE (July 2008); pp. 23, 50, 114.138 According to a presentation by Exeter Associates Inc, offshore wind costsbetween $1.95 million/MW to $2.86 million/MW and generating costs rangefrom $80/MWh to $150/MWh: Porter, K. (February 16, 2007). Introduction toWindpower. Presentation at ‘Offshore Wind for Delaware: Workshop’; slide 24;available at: http://www.ocean.udel.edu/windpower/docs/Porter-UD WorkshopFeb 2007.pdf (accessed October 26, 2010). Developers in North America havereleased project costs which are much higher: for example, NRG BlueWaterWind estimates that its 450 MW project off the coast of Delaware would costapprox. $3.5 million/MW while FPL Energy’s 144 MW project with LIPA isestimated to cost approx. $5.6 million/MW. See: OffshoreWind.net (2010).What are the costs of offshore wind? Offshore Wind Questions; available at:http://offshorewind.net/Other_Pages/QuestionsSupportFile.html#Costs(accessed October 26, 2010)139 Tanaka, N. (November 17, 2010). World Energy Outlook 2010. InternationalEnergy Agency; pp. 9, 16; available at:http://www.iea.org/speech/2010/Tanaka/weo_2010_beijing.pdf (accessedNovember 18, 2010)140 Some states are experimenting with alternative approaches, includingDelaware and Rhode Island’s use of power purchase agreements, and NewJersey’s use of “carve-out” agreements.141 See section above, entitled “Avoided West-East High-Powered TransmissionLines”142 US DOE (September 22, 2010); p. 14. Danish experience from the past 15years shows that offshore wind farms, if placed right, can be engineered andoperated without significant damage to the marine environment andvulnerable species. For more information, see the following study on theimpacts of Danish offshore wind projects: Danish Offshore Wind: KeyEnvironmental Studies (November 2006). Published by Dong Energy andothers; available at:http://www.ens.dk/graphics/Publikationer/Havvindmoeller/havvindmoellebog_nov_2006_skrm.pdf (accessed October 26, 2010)143 US DOE (July 2008); p. 23.144 The Quotations Page; available at:http://www.quotationspage.com/quote/25837.html (accessed October 26,2010)145 This parable is recounted by Naka Nathaniel, the former New York Timesvideographer, himself Hawaiian. A copy of the parable is recounted in: Kristof,N.; and WuDunn, S. (2009). Half the Sky: Turning Oppression into Opportunityfor Women Worldwide. First Vintage Books Edition; p. 45.146 This graph is based on Table 2 of the following report: Schwartz, M.,Heimiller D., Haymes S., and Musial W. (June 2010). Assessment of OffshoreWind Energy Resources for the United States. National Renewable EnergyLaboratory. Technical Report NREL/TP-500-45889; pp. 14-22 (Table 2);available at: http://www.nrel.gov/docs/fy10osti/45889.pdf (accessed October26, 2010). The graph depicts the state’s total and viable offshore windresource in GW by depth and distance from shore. The calculations assume allwind speeds of 7 m/s and higher. The ‘viable’ offshore wind resource figure is40% of the state’s total resource potential, based on NREL’s assumption that60% of resource potential will be lost to socio-economic, technological,political and environmental constraints. 147 Maine Ocean Energy Task Force (December 2009). Final Report of theOcean Energy Task Force to Governor John E. Baldacci; pp. iii, iv, 8, 9; availableat:http://www.maine.gov/spo/specialprojects/OETF/Documents/finalreport_123109.pdf (accessed October 26, 2010).
148 Schwartz, M., Heimiller D., Haymes S., and Musial W. (June 2010).Assessment of Offshore Wind Energy Resources for the United States.National Renewable Energy Laboratory. Technical Report NREL/TP-500-45889; pp. 2-4 (Table 1); available at:http://www.nrel.gov/docs/fy10osti/45889.pdf (accessed October 26, 2010)149 “An Act to Implement the Recommendations of the Governor’s OceanEnergy Task Force,” Public Law, Ch. 615, LD 1810, 124th Maine State Legislature,signed April 7 2010. See at:http://www.legislature.maine.gov/legis/bills/bills_124th/chappdfs/PUBLIC615.pdf (accessed October 26, 2010)150 Maine Ocean Energy Task Force (December 2009); pp. 9-10.151 American Council on Renewable Energy (updated August 2010). RenewableEnergy in Maine; available at: http://www.acore.org/files/pdfs/states/Maine.pdf(accessed October 26, 2010)152 Maine State Planning Office (website). Renewable Ocean Energy (andinformation relating to the Ocean Energy Task Force); available at:http://www.maine.gov/spo/specialprojects/OETF/ (accessed October 26, 2010)153 An Act to Implement the Recommendations of the Governor’s OceanEnergy Task Force, P.L. 2010, c. 215. Available at:http://www.legislature.maine.gov/legis/bills/bills_124th/chapters/PUBLIC615.asp (accessed October 26, 2010). This legislation enacts the “Final Report of theOcean Energy Task Force to Governor John E. Baldacci,” December 2009.Available at:http://www.maine.gov/spo/specialprojects/OETF/Documents/finalreport_123109.pdf (accessed October 26, 2010)154 Maine Public Utilities Commission (2010). Request for Proposals for Long-term Contracts for Deep-Water Offshore Wind Energy Pilot Projects And TidalEnergy Demonstration Projects; available at:http://www.maine.gov/mpuc/electricity/rfps/standard_offer/deepwater2010/(accessed October 26, 2010)155 See the Maine Citizen’s Guide to the Referendum Election: June 8, 2010; p.3; available at: http://www.maine.gov/sos/cec/elec/citizensguide.pdf (accessedOctober 26, 2010; Also see: Offshore Wind Wire (June 9, 2010). Maine VotersApprove Offshore Wind Funding; available at:http://offshorewindwire.com/2010/06/09/roundup-maine-approves-funding/(accessed October 26, 2010)156 An Act to Implement the Recommendations of the Governor’s OceanEnergy Task Force, P.L. 2010, c. 215. Available at:http://www.legislature.maine.gov/legis/bills/bills_124th/chapters/PUBLIC615.asp (accessed October 26, 2010) 157 BOEMRE Public Affairs (September 14, 2010). BOEM and Maine formoffshore renewable energy task force; available at:http://www.boemre.gov/ooc/press/2010/press0915.htm (accessed October 26,2010)158 http://www.mainewindindustry.com/ (accessed October 26, 2010)159 Office of Congresswoman Chellie Pingree (October 16, 2009). MaineCongressional Delegation announces $8 million grant to develop offshore windtest center in Maine; available at: http://pingree.house.gov/2009/10/maine-congressional-delegation-announces-8-million-grant-to-develop-offshore-wind-test-center-in-mai.shtml (accessed October 26, 2010)160 Offshore Wind Wire (January 11, 2010). University of Maine receives $12million for offshore wind lab; available at:http://offshorewindwire.com/2010/01/11/maine-receives-12-million/ (accessedOctober 26, 2010)161 U.S. Department of Transportation (February 17, 2010). TransportationInvestment Generating Economic Recovery (TIGER) Grants; pp. 3, 14; availableat: http://www.dot.gov/documents/finaltigergrantinfo.pdf (accessed October26, 2010)162 Renewable Energy World (June 30, 2010). Maine to get US $20 million foroffshore wind; available at:http://www.renewableenergyworld.com/rea/news/article/2010/06/maine-to-get-us-20m-for-offshore-wind (accessed October 26, 2010)163 Vincent, J. (August 10, 2010). Bird and Bat Monitoring on Monhegan Island.DeepCWind Consortium Blog; available at: http://deepcwind.org/deepcwind-consortium-blog/54-bird-and-bat (accessed October 26, 2010)164 Schwartz, M.; Heimiller, D.; Haymes, S.; and Musial W. (June 2010); pp. 2-4(Table 1).165 UNH Media Relations (November 9, 2009). Stimulus funds advance offshorewind research at UNH; available at:http://www.unh.edu/news/cj_nr/2009/nov/bp09wind.cfm (accessed October26, 2010)166 Massachusetts Department of Energy Resources (2009). Wind Energy inMassachusetts: 2,000 MW by 2020; available at:http://www.mass.gov/Eoeea/docs/doer/renewables/wind/wind-energy-MA-2020.pdf (accessed October 26, 2010)167 Schwartz, M.; Heimiller, D.; Haymes, S.; and Musial W. (June 2010); pp. 2-4(Table 1).168 Massachusetts Department of Energy Resources (2009). Wind Energy inMassachusetts: 2,000 MW by 2020; available at:http://www.mass.gov/Eoeea/docs/doer/renewables/wind/wind-energy-MA-2020.pdf (accessed October 26, 2010)
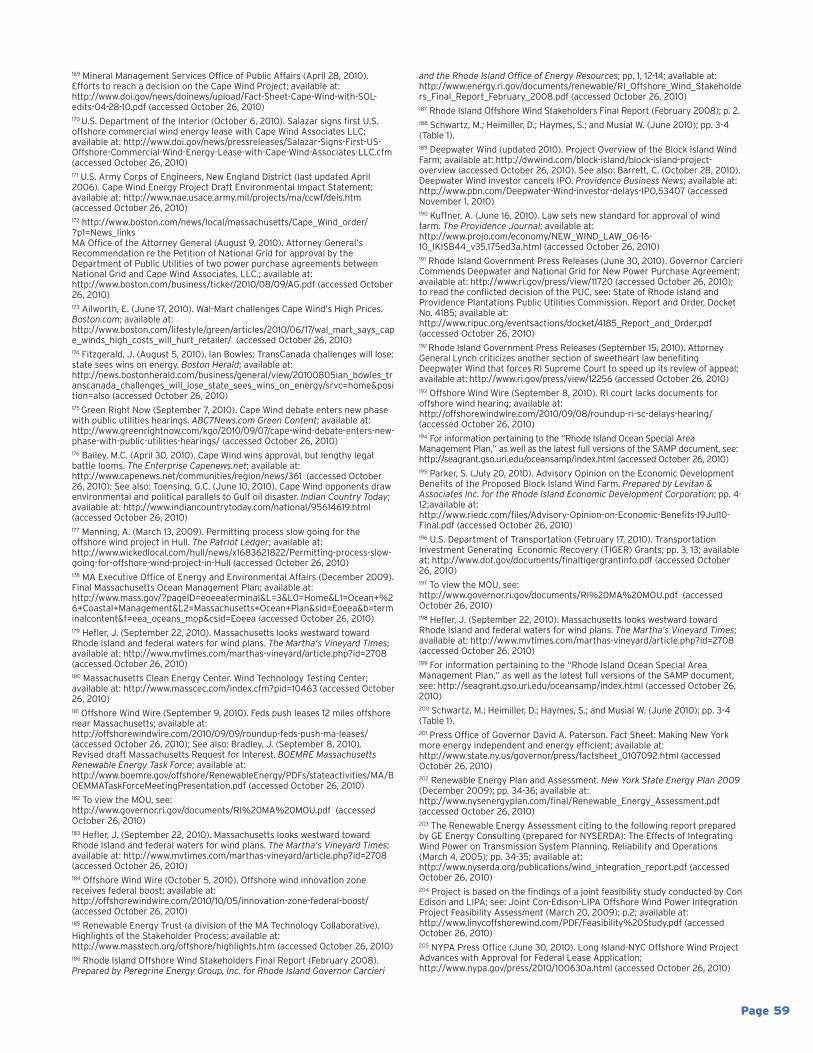
Page 59
169 Mineral Management Services Office of Public Affairs (April 28, 2010).Efforts to reach a decision on the Cape Wind Project; available at:http://www.doi.gov/news/doinews/upload/Fact-Sheet-Cape-Wind-with-SOL-edits-04-28-10.pdf (accessed October 26, 2010) 170 U.S. Department of the Interior (October 6, 2010). Salazar signs first U.S.offshore commercial wind energy lease with Cape Wind Associates LLC;available at: http://www.doi.gov/news/pressreleases/Salazar-Signs-First-US-Offshore-Commercial-Wind-Energy-Lease-with-Cape-Wind-Associates-LLC.cfm(accessed October 26, 2010)171 U.S. Army Corps of Engineers, New England District (last updated April2006). Cape Wind Energy Project Draft Environmental Impact Statement;available at: http://www.nae.usace.army.mil/projects/ma/ccwf/deis.htm(accessed October 26, 2010)172 http://www.boston.com/news/local/massachusetts/Cape_Wind_order/?p1=News_linksMA Office of the Attorney General (August 9, 2010). Attorney General’sRecommendation re the Petition of National Grid for approval by theDepartment of Public Utilities of two power purchase agreements betweenNational Grid and Cape Wind Associates, LLC.; available at: http://www.boston.com/business/ticker/2010/08/09/AG.pdf (accessed October26, 2010)173 Ailworth, E. (June 17, 2010). Wal-Mart challenges Cape Wind’s High Prices.Boston.com; available at:http://www.boston.com/lifestyle/green/articles/2010/06/17/wal_mart_says_cape_winds_high_costs_will_hurt_retailer/ (accessed October 26, 2010)174 Fitzgerald, J. (August 5, 2010). Ian Bowles: TransCanada challenges will lose:state sees wins on energy. Boston Herald; available at:http://news.bostonherald.com/business/general/view/20100805ian_bowles_transcanada_challenges_will_lose_state_sees_wins_on_energy/srvc=home&position=also (accessed October 26, 2010)175 Green Right Now (September 7, 2010). Cape Wind debate enters new phasewith public utilities hearings. ABC7News.com Green Content; available at:http://www.greenrightnow.com/kgo/2010/09/07/cape-wind-debate-enters-new-phase-with-public-utilities-hearings/ (accessed October 26, 2010)176 Bailey, M.C. (April 30, 2010). Cape Wind wins approval, but lengthy legalbattle looms. The Enterprise Capenews.net; available at:http://www.capenews.net/communities/region/news/361 (accessed October26, 2010); See also: Toensing, G.C. (June 10, 2010). Cape Wind opponents drawenvironmental and political parallels to Gulf oil disaster. Indian Country Today;available at: http://www.indiancountrytoday.com/national/95614619.html(accessed October 26, 2010)177 Manning, A. (March 13, 2009). Permitting process slow going for theoffshore wind project in Hull. The Patriot Ledger; available at:http://www.wickedlocal.com/hull/news/x1683621822/Permitting-process-slow-going-for-offshore-wind-project-in-Hull (accessed October 26, 2010)178 MA Executive Office of Energy and Environmental Affairs (December 2009).Final Massachusetts Ocean Management Plan; available at:http://www.mass.gov/?pageID=eoeeaterminal&L=3&L0=Home&L1=Ocean+%26+Coastal+Management&L2=Massachusetts+Ocean+Plan&sid=Eoeea&b=terminalcontent&f=eea_oceans_mop&csid=Eoeea (accessed October 26, 2010)179 Hefler, J. (September 22, 2010). Massachusetts looks westward towardRhode Island and federal waters for wind plans. The Martha’s Vineyard Times;available at: http://www.mvtimes.com/marthas-vineyard/article.php?id=2708(accessed October 26, 2010)180 Massachusetts Clean Energy Center. Wind Technology Testing Center;available at: http://www.masscec.com/index.cfm?pid=10463 (accessed October26, 2010)181 Offshore Wind Wire (September 9, 2010). Feds push leases 12 miles offshorenear Massachusetts; available at:http://offshorewindwire.com/2010/09/09/roundup-feds-push-ma-leases/(accessed October 26, 2010); See also: Bradley, J. (September 8, 2010).Revised draft Massachusetts Request for Interest. BOEMRE MassachusettsRenewable Energy Task Force; available at:http://www.boemre.gov/offshore/RenewableEnergy/PDFs/stateactivities/MA/BOEMMATaskForceMeetingPresentation.pdf (accessed October 26, 2010)182 To view the MOU, see:http://www.governor.ri.gov/documents/RI%20MA%20MOU.pdf (accessedOctober 26, 2010)183 Hefler, J. (September 22, 2010). Massachusetts looks westward towardRhode Island and federal waters for wind plans. The Martha’s Vineyard Times;available at: http://www.mvtimes.com/marthas-vineyard/article.php?id=2708(accessed October 26, 2010)184 Offshore Wind Wire (October 5, 2010). Offshore wind innovation zonereceives federal boost; available at:http://offshorewindwire.com/2010/10/05/innovation-zone-federal-boost/(accessed October 26, 2010)185 Renewable Energy Trust (a division of the MA Technology Collaborative).Highlights of the Stakeholder Process; available at:http://www.masstech.org/offshore/highlights.htm (accessed October 26, 2010)186 Rhode Island Offshore Wind Stakeholders Final Report (February 2008).Prepared by Peregrine Energy Group, Inc. for Rhode Island Governor Carcieri
and the Rhode Island Office of Energy Resources; pp. 1, 12-14; available at:http://www.energy.ri.gov/documents/renewable/RI_Offshore_Wind_Stakeholders_Final_Report_February_2008.pdf (accessed October 26, 2010)187 Rhode Island Offshore Wind Stakeholders Final Report (February 2008); p. 2. 188 Schwartz, M.; Heimiller, D.; Haymes, S.; and Musial W. (June 2010); pp. 3-4(Table 1).189 Deepwater Wind (updated 2010). Project Overview of the Block Island WindFarm; available at: http://dwwind.com/block-island/block-island-project-overview (accessed October 26, 2010). See also: Barrett, C. (October 28, 2010).Deepwater Wind investor cancels IPO. Providence Business News; available at:http://www.pbn.com/Deepwater-Wind-investor-delays-IPO,53407 (accessedNovember 1, 2010)190 Kuffner, A. (June 16, 2010). Law sets new standard for approval of windfarm. The Providence Journal; available at:http://www.projo.com/economy/NEW_WIND_LAW_06-16-10_IKISB44_v35.175ed3a.html (accessed October 26, 2010)191 Rhode Island Government Press Releases (June 30, 2010). Governor CarcieriCommends Deepwater and National Grid for New Power Purchase Agreement;available at: http://www.ri.gov/press/view/11720 (accessed October 26, 2010);to read the conflicted decision of the PUC, see: State of Rhode Island andProvidence Plantations Public Utilities Commission. Report and Order, DocketNo. 4185; available at:http://www.ripuc.org/eventsactions/docket/4185_Report_and_0rder.pdf(accessed October 26, 2010)192 Rhode Island Government Press Releases (September 15, 2010). AttorneyGeneral Lynch criticizes another section of sweetheart law benefitingDeepwater Wind that forces RI Supreme Court to speed up its review of appeal;available at: http://www.ri.gov/press/view/12256 (accessed October 26, 2010)193 Offshore Wind Wire (September 8, 2010). RI court lacks documents foroffshore wind hearing; available at:http://offshorewindwire.com/2010/09/08/roundup-ri-sc-delays-hearing/(accessed October 26, 2010)194 For information pertaining to the “Rhode Island Ocean Special AreaManagement Plan,” as well as the latest full versions of the SAMP document, see:http://seagrant.gso.uri.edu/oceansamp/index.html (accessed October 26, 2010)195 Parker, S. (July 20, 2010). Advisory Opinion on the Economic DevelopmentBenefits of the Proposed Block Island Wind Farm. Prepared by Levitan &Associates Inc. for the Rhode Island Economic Development Corporation; pp. 4-12;available at:http://www.riedc.com/files/Advisory-Opinion-on-Economic-Benefits-19Jul10-Final.pdf (accessed October 26, 2010)196 U.S. Department of Transportation (February 17, 2010). TransportationInvestment Generating Economic Recovery (TIGER) Grants; pp. 3, 13; availableat: http://www.dot.gov/documents/finaltigergrantinfo.pdf (accessed October26, 2010)197 To view the MOU, see:http://www.governor.ri.gov/documents/RI%20MA%20MOU.pdf (accessedOctober 26, 2010)198 Hefler, J. (September 22, 2010). Massachusetts looks westward towardRhode Island and federal waters for wind plans. The Martha’s Vineyard Times;available at: http://www.mvtimes.com/marthas-vineyard/article.php?id=2708(accessed October 26, 2010)199 For information pertaining to the “Rhode Island Ocean Special AreaManagement Plan,” as well as the latest full versions of the SAMP document,see: http://seagrant.gso.uri.edu/oceansamp/index.html (accessed October 26,2010)200 Schwartz, M.; Heimiller, D.; Haymes, S.; and Musial W. (June 2010); pp. 3-4(Table 1). 201 Press Office of Governor David A. Paterson. Fact Sheet: Making New Yorkmore energy independent and energy efficient; available at:http://www.state.ny.us/governor/press/factsheet_0107092.html (accessedOctober 26, 2010)202 Renewable Energy Plan and Assessment. New York State Energy Plan 2009(December 2009); pp. 34-36; available at:http://www.nysenergyplan.com/final/Renewable_Energy_Assessment.pdf(accessed October 26, 2010)203 The Renewable Energy Assessment citing to the following report preparedby GE Energy Consulting (prepared for NYSERDA): The Effects of IntegratingWind Power on Transmission System Planning, Reliability and Operations(March 4, 2005); pp. 34-35; available at:http://www.nyserda.org/publications/wind_integration_report.pdf (accessedOctober 26, 2010)204 Project is based on the findings of a joint feasibility study conducted by ConEdison and LIPA; see: Joint Con-Edison-LIPA Offshore Wind Power IntegrationProject Feasibility Assessment (March 20, 2009); p.2; available at:http://www.linycoffshorewind.com/PDF/Feasibility%20Study.pdf (accessedOctober 26, 2010)205 NYPA Press Office (June 30, 2010). Long Island-NYC Offshore Wind ProjectAdvances with Approval for Federal Lease Application;http://www.nypa.gov/press/2010/100630a.html (accessed October 26, 2010)
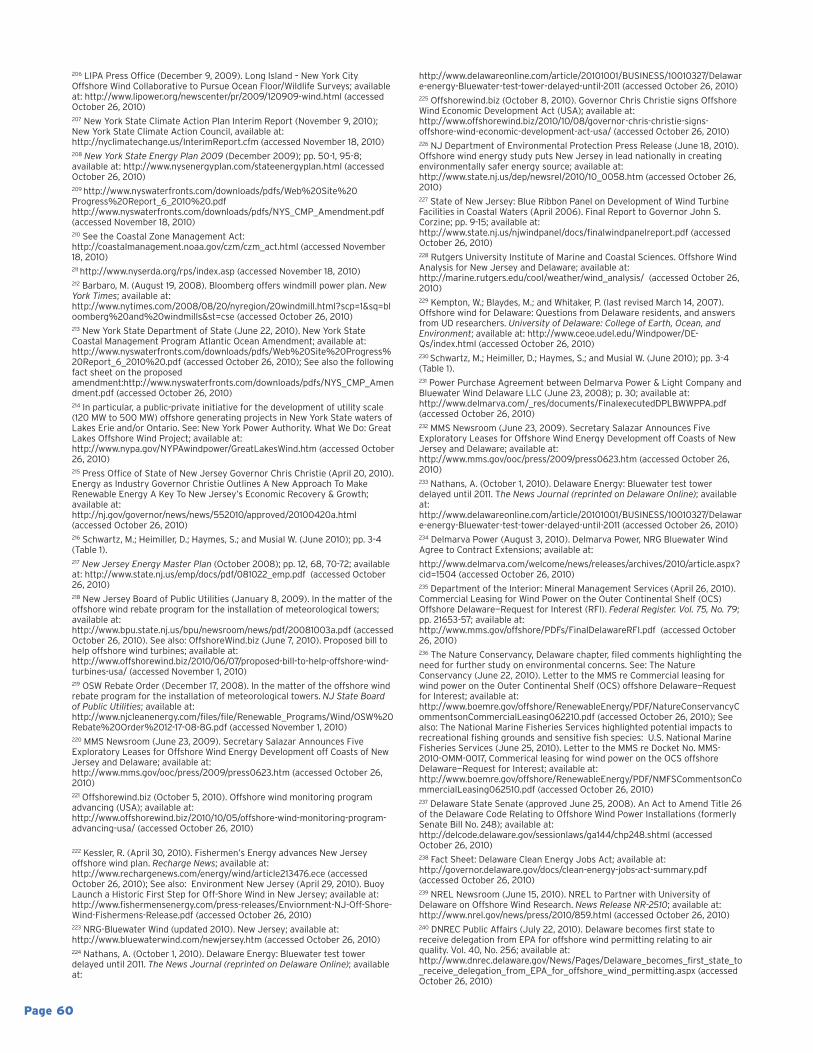
Page 60
206 LIPA Press Office (December 9, 2009). Long Island – New York CityOffshore Wind Collaborative to Pursue Ocean Floor/Wildlife Surveys; availableat: http://www.lipower.org/newscenter/pr/2009/120909-wind.html (accessedOctober 26, 2010)207 New York State Climate Action Plan Interim Report (November 9, 2010);New York State Climate Action Council, available at:http://nyclimatechange.us/InterimReport.cfm (accessed November 18, 2010) 208 New York State Energy Plan 2009 (December 2009); pp. 50-1, 95-8;available at: http://www.nysenergyplan.com/stateenergyplan.html (accessedOctober 26, 2010)209 http://www.nyswaterfronts.com/downloads/pdfs/Web%20Site%20Progress%20Report_6_2010%20.pdfhttp://www.nyswaterfronts.com/downloads/pdfs/NYS_CMP_Amendment.pdf(accessed November 18, 2010)210 See the Coastal Zone Management Act:http://coastalmanagement.noaa.gov/czm/czm_act.html (accessed November18, 2010)211 http://www.nyserda.org/rps/index.asp (accessed November 18, 2010)212 Barbaro, M. (August 19, 2008). Bloomberg offers windmill power plan. NewYork Times; available at:http://www.nytimes.com/2008/08/20/nyregion/20windmill.html?scp=1&sq=bloomberg%20and%20windmills&st=cse (accessed October 26, 2010)213 New York State Department of State (June 22, 2010). New York StateCoastal Management Program Atlantic Ocean Amendment; available at:http://www.nyswaterfronts.com/downloads/pdfs/Web%20Site%20Progress%20Report_6_2010%20.pdf (accessed October 26, 2010); See also the followingfact sheet on the proposedamendment:http://www.nyswaterfronts.com/downloads/pdfs/NYS_CMP_Amendment.pdf (accessed October 26, 2010)214 In particular, a public-private initiative for the development of utility scale(120 MW to 500 MW) offshore generating projects in New York State waters ofLakes Erie and/or Ontario. See: New York Power Authority. What We Do: GreatLakes Offshore Wind Project; available at:http://www.nypa.gov/NYPAwindpower/GreatLakesWind.htm (accessed October26, 2010)215 Press Office of State of New Jersey Governor Chris Christie (April 20, 2010).Energy as Industry Governor Christie Outlines A New Approach To MakeRenewable Energy A Key To New Jersey’s Economic Recovery & Growth;available at:http://nj.gov/governor/news/news/552010/approved/20100420a.html(accessed October 26, 2010)216 Schwartz, M.; Heimiller, D.; Haymes, S.; and Musial W. (June 2010); pp. 3-4(Table 1).217 New Jersey Energy Master Plan (October 2008); pp. 12, 68, 70-72; availableat: http://www.state.nj.us/emp/docs/pdf/081022_emp.pdf (accessed October26, 2010)218 New Jersey Board of Public Utilities (January 8, 2009). In the matter of theoffshore wind rebate program for the installation of meteorological towers;available at:http://www.bpu.state.nj.us/bpu/newsroom/news/pdf/20081003a.pdf (accessedOctober 26, 2010). See also: OffshoreWind.biz (June 7, 2010). Proposed bill tohelp offshore wind turbines; available at:http://www.offshorewind.biz/2010/06/07/proposed-bill-to-help-offshore-wind-turbines-usa/ (accessed November 1, 2010)219 OSW Rebate Order (December 17, 2008). In the matter of the offshore windrebate program for the installation of meteorological towers. NJ State Boardof Public Utilities; available at:http://www.njcleanenergy.com/files/file/Renewable_Programs/Wind/OSW%20Rebate%20Order%2012-17-08-8G.pdf (accessed November 1, 2010)220 MMS Newsroom (June 23, 2009). Secretary Salazar Announces FiveExploratory Leases for Offshore Wind Energy Development off Coasts of NewJersey and Delaware; available at:http://www.mms.gov/ooc/press/2009/press0623.htm (accessed October 26,2010)221 Offshorewind.biz (October 5, 2010). Offshore wind monitoring programadvancing (USA); available at:http://www.offshorewind.biz/2010/10/05/offshore-wind-monitoring-program-advancing-usa/ (accessed October 26, 2010)
222 Kessler, R. (April 30, 2010). Fishermen’s Energy advances New Jerseyoffshore wind plan. Recharge News; available at:http://www.rechargenews.com/energy/wind/article213476.ece (accessedOctober 26, 2010); See also: Environment New Jersey (April 29, 2010). BuoyLaunch a Historic First Step for Off-Shore Wind in New Jersey; available at:http://www.fishermensenergy.com/press-releases/Enviornment-NJ-Off-Shore-Wind-Fishermens-Release.pdf (accessed October 26, 2010)223 NRG-Bluewater Wind (updated 2010). New Jersey; available at:http://www.bluewaterwind.com/newjersey.htm (accessed October 26, 2010)224 Nathans, A. (October 1, 2010). Delaware Energy: Bluewater test towerdelayed until 2011. The News Journal (reprinted on Delaware Online); availableat:
http://www.delawareonline.com/article/20101001/BUSINESS/10010327/Delaware-energy-Bluewater-test-tower-delayed-until-2011 (accessed October 26, 2010)225 Offshorewind.biz (October 8, 2010). Governor Chris Christie signs OffshoreWind Economic Development Act (USA); available at:http://www.offshorewind.biz/2010/10/08/governor-chris-christie-signs-offshore-wind-economic-development-act-usa/ (accessed October 26, 2010)226 NJ Department of Environmental Protection Press Release (June 18, 2010).Offshore wind energy study puts New Jersey in lead nationally in creatingenvironmentally safer energy source; available at:http://www.state.nj.us/dep/newsrel/2010/10_0058.htm (accessed October 26,2010)227 State of New Jersey: Blue Ribbon Panel on Development of Wind TurbineFacilities in Coastal Waters (April 2006). Final Report to Governor John S.Corzine; pp. 9-15; available at:http://www.state.nj.us/njwindpanel/docs/finalwindpanelreport.pdf (accessedOctober 26, 2010)228 Rutgers University Institute of Marine and Coastal Sciences. Offshore WindAnalysis for New Jersey and Delaware; available at:http://marine.rutgers.edu/cool/weather/wind_analysis/ (accessed October 26,2010)229 Kempton, W.; Blaydes, M.; and Whitaker, P. (last revised March 14, 2007).Offshore wind for Delaware: Questions from Delaware residents, and answersfrom UD researchers. University of Delaware: College of Earth, Ocean, andEnvironment; available at: http://www.ceoe.udel.edu/Windpower/DE-Qs/index.html (accessed October 26, 2010)230 Schwartz, M.; Heimiller, D.; Haymes, S.; and Musial W. (June 2010); pp. 3-4(Table 1).231 Power Purchase Agreement between Delmarva Power & Light Company andBluewater Wind Delaware LLC (June 23, 2008); p. 30; available at:http://www.delmarva.com/_res/documents/FinalexecutedDPLBWWPPA.pdf(accessed October 26, 2010)232 MMS Newsroom (June 23, 2009). Secretary Salazar Announces FiveExploratory Leases for Offshore Wind Energy Development off Coasts of NewJersey and Delaware; available at:http://www.mms.gov/ooc/press/2009/press0623.htm (accessed October 26,2010)233 Nathans, A. (October 1, 2010). Delaware Energy: Bluewater test towerdelayed until 2011. The News Journal (reprinted on Delaware Online); availableat:http://www.delawareonline.com/article/20101001/BUSINESS/10010327/Delaware-energy-Bluewater-test-tower-delayed-until-2011 (accessed October 26, 2010)234 Delmarva Power (August 3, 2010). Delmarva Power, NRG Bluewater WindAgree to Contract Extensions; available at:
http://www.delmarva.com/welcome/news/releases/archives/2010/article.aspx?cid=1504 (accessed October 26, 2010)235 Department of the Interior: Mineral Management Services (April 26, 2010).Commercial Leasing for Wind Power on the Outer Continental Shelf (OCS)Offshore Delaware—Request for Interest (RFI). Federal Register. Vol. 75, No. 79;pp. 21653-57; available at:http://www.mms.gov/offshore/PDFs/FinalDelawareRFI.pdf (accessed October26, 2010)236 The Nature Conservancy, Delaware chapter, filed comments highlighting theneed for further study on environmental concerns. See: The NatureConservancy (June 22, 2010). Letter to the MMS re Commercial leasing forwind power on the Outer Continental Shelf (OCS) offshore Delaware—Requestfor Interest; available at:http://www.boemre.gov/offshore/RenewableEnergy/PDF/NatureConservancyCommentsonCommercialLeasing062210.pdf (accessed October 26, 2010); Seealso: The National Marine Fisheries Services highlighted potential impacts torecreational fishing grounds and sensitive fish species: U.S. National MarineFisheries Services (June 25, 2010). Letter to the MMS re Docket No. MMS-2010-OMM-0017, Commerical leasing for wind power on the OCS offshoreDelaware—Request for Interest; available at:http://www.boemre.gov/offshore/RenewableEnergy/PDF/NMFSCommentsonCommercialLeasing062510.pdf (accessed October 26, 2010)237 Delaware State Senate (approved June 25, 2008). An Act to Amend Title 26of the Delaware Code Relating to Offshore Wind Power Installations (formerlySenate Bill No. 248); available at:http://delcode.delaware.gov/sessionlaws/ga144/chp248.shtml (accessedOctober 26, 2010)238 Fact Sheet: Delaware Clean Energy Jobs Act; available at:http://governor.delaware.gov/docs/clean-energy-jobs-act-summary.pdf(accessed October 26, 2010)239 NREL Newsroom (June 15, 2010). NREL to Partner with University ofDelaware on Offshore Wind Research. News Release NR-2510; available at:http://www.nrel.gov/news/press/2010/859.html (accessed October 26, 2010)240 DNREC Public Affairs (July 22, 2010). Delaware becomes first state toreceive delegation from EPA for offshore wind permitting relating to airquality. Vol. 40, No. 256; available at:http://www.dnrec.delaware.gov/News/Pages/Delaware_becomes_first_state_to_receive_delegation_from_EPA_for_offshore_wind_permitting.aspx (accessedOctober 26, 2010)
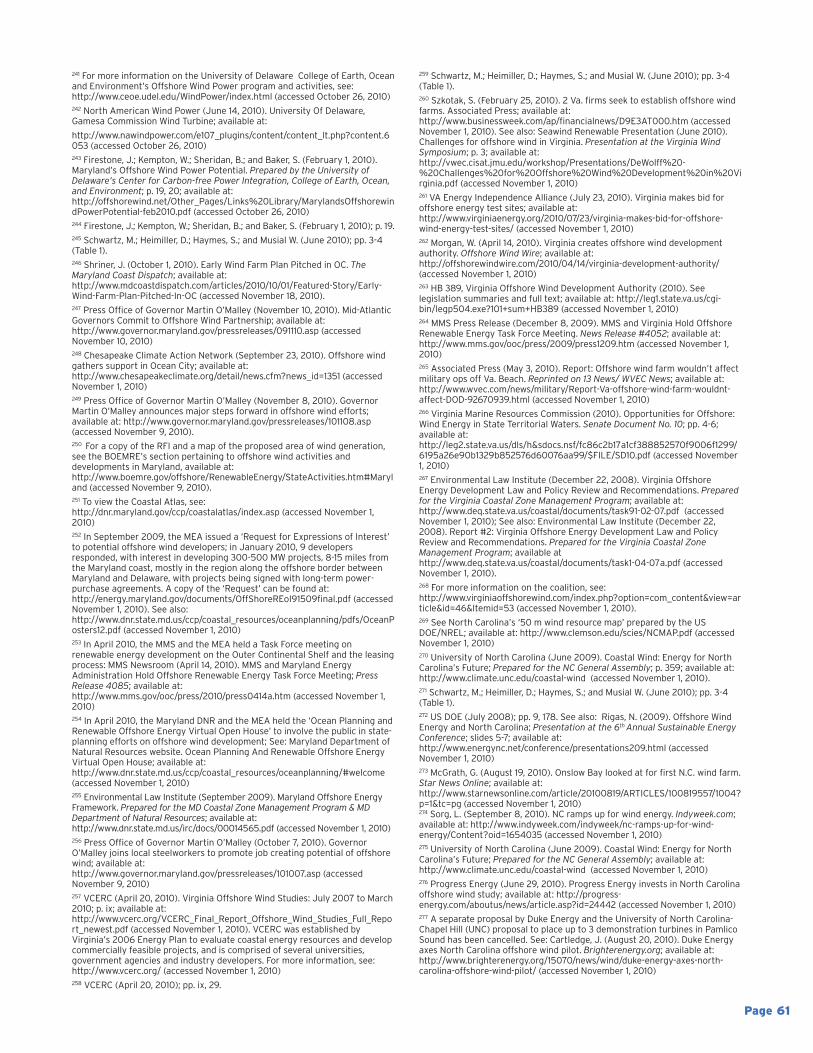
Page 61
241 For more information on the University of Delaware College of Earth, Oceanand Environment’s Offshore Wind Power program and activities, see:http://www.ceoe.udel.edu/WindPower/index.html (accessed October 26, 2010)242 North American Wind Power (June 14, 2010). University Of Delaware,Gamesa Commission Wind Turbine; available at:
http://www.nawindpower.com/e107_plugins/content/content_lt.php?content.6053 (accessed October 26, 2010)243 Firestone, J.; Kempton, W.; Sheridan, B.; and Baker, S. (February 1, 2010).Maryland’s Offshore Wind Power Potential. Prepared by the University ofDelaware’s Center for Carbon-free Power Integration, College of Earth, Ocean,and Environment; p. 19, 20; available at:http://offshorewind.net/Other_Pages/Links%20Library/MarylandsOffshorewindPowerPotential-feb2010.pdf (accessed October 26, 2010) 244 Firestone, J.; Kempton, W.; Sheridan, B.; and Baker, S. (February 1, 2010); p. 19.245 Schwartz, M.; Heimiller, D.; Haymes, S.; and Musial W. (June 2010); pp. 3-4(Table 1).246 Shriner, J. (October 1, 2010). Early Wind Farm Plan Pitched in OC. TheMaryland Coast Dispatch; available at:http://www.mdcoastdispatch.com/articles/2010/10/01/Featured-Story/Early-Wind-Farm-Plan-Pitched-In-OC (accessed November 18, 2010).247 Press Office of Governor Martin O’Malley (November 10, 2010). Mid-AtlanticGovernors Commit to Offshore Wind Partnership; available at:http://www.governor.maryland.gov/pressreleases/091110.asp (accessedNovember 10, 2010)248 Chesapeake Climate Action Network (September 23, 2010). Offshore windgathers support in Ocean City; available at:http://www.chesapeakeclimate.org/detail/news.cfm?news_id=1351 (accessedNovember 1, 2010)249 Press Office of Governor Martin O’Malley (November 8, 2010). GovernorMartin O’Malley announces major steps forward in offshore wind efforts;available at: http://www.governor.maryland.gov/pressreleases/101108.asp(accessed November 9, 2010).250 For a copy of the RFI and a map of the proposed area of wind generation,see the BOEMRE’s section pertaining to offshore wind activities anddevelopments in Maryland, available at:http://www.boemre.gov/offshore/RenewableEnergy/StateActivities.htm#Maryland (accessed November 9, 2010).251 To view the Coastal Atlas, see:http://dnr.maryland.gov/ccp/coastalatlas/index.asp (accessed November 1,2010)252 In September 2009, the MEA issued a ‘Request for Expressions of Interest’to potential offshore wind developers; in January 2010, 9 developersresponded, with interest in developing 300-500 MW projects, 8-15 miles fromthe Maryland coast, mostly in the region along the offshore border betweenMaryland and Delaware, with projects being signed with long-term power-purchase agreements. A copy of the ‘Request’ can be found at:http://energy.maryland.gov/documents/OffShoreREoI91509final.pdf (accessedNovember 1, 2010). See also:http://www.dnr.state.md.us/ccp/coastal_resources/oceanplanning/pdfs/OceanPosters12.pdf (accessed November 1, 2010) 253 In April 2010, the MMS and the MEA held a Task Force meeting onrenewable energy development on the Outer Continental Shelf and the leasingprocess: MMS Newsroom (April 14, 2010). MMS and Maryland EnergyAdministration Hold Offshore Renewable Energy Task Force Meeting; PressRelease 4085; available at:http://www.mms.gov/ooc/press/2010/press0414a.htm (accessed November 1,2010)254 In April 2010, the Maryland DNR and the MEA held the ‘Ocean Planning andRenewable Offshore Energy Virtual Open House’ to involve the public in state-planning efforts on offshore wind development; See: Maryland Department ofNatural Resources website. Ocean Planning And Renewable Offshore EnergyVirtual Open House; available at:http://www.dnr.state.md.us/ccp/coastal_resources/oceanplanning/#welcome(accessed November 1, 2010)255 Environmental Law Institute (September 2009). Maryland Offshore EnergyFramework. Prepared for the MD Coastal Zone Management Program & MDDepartment of Natural Resources; available at:http://www.dnr.state.md.us/irc/docs/00014565.pdf (accessed November 1, 2010)256 Press Office of Governor Martin O’Malley (October 7, 2010). GovernorO’Malley joins local steelworkers to promote job creating potential of offshorewind; available at:http://www.governor.maryland.gov/pressreleases/101007.asp (accessedNovember 9, 2010)257 VCERC (April 20, 2010). Virginia Offshore Wind Studies: July 2007 to March2010; p. ix; available at:http://www.vcerc.org/VCERC_Final_Report_Offshore_Wind_Studies_Full_Report_newest.pdf (accessed November 1, 2010). VCERC was established byVirginia’s 2006 Energy Plan to evaluate coastal energy resources and developcommercially feasible projects, and is comprised of several universities,government agencies and industry developers. For more information, see:http://www.vcerc.org/ (accessed November 1, 2010)258 VCERC (April 20, 2010); pp. ix, 29.
259 Schwartz, M.; Heimiller, D.; Haymes, S.; and Musial W. (June 2010); pp. 3-4(Table 1).260 Szkotak, S. (February 25, 2010). 2 Va. firms seek to establish offshore windfarms. Associated Press; available at:http://www.businessweek.com/ap/financialnews/D9E3AT000.htm (accessedNovember 1, 2010). See also: Seawind Renewable Presentation (June 2010).Challenges for offshore wind in Virginia. Presentation at the Virginia WindSymposium; p. 3; available at:http://vwec.cisat.jmu.edu/workshop/Presentations/DeWolff%20-%20Challenges%20for%20Offshore%20Wind%20Development%20in%20Virginia.pdf (accessed November 1, 2010)261 VA Energy Independence Alliance (July 23, 2010). Virginia makes bid foroffshore energy test sites; available at:http://www.virginiaenergy.org/2010/07/23/virginia-makes-bid-for-offshore-wind-energy-test-sites/ (accessed November 1, 2010)262 Morgan, W. (April 14, 2010). Virginia creates offshore wind developmentauthority. Offshore Wind Wire; available at:http://offshorewindwire.com/2010/04/14/virginia-development-authority/(accessed November 1, 2010)263 HB 389, Virginia Offshore Wind Development Authority (2010). Seelegislation summaries and full text; available at: http://leg1.state.va.us/cgi-bin/legp504.exe?101+sum+HB389 (accessed November 1, 2010)264 MMS Press Release (December 8, 2009). MMS and Virginia Hold OffshoreRenewable Energy Task Force Meeting. News Release #4052; available at:http://www.mms.gov/ooc/press/2009/press1209.htm (accessed November 1,2010)265 Associated Press (May 3, 2010). Report: Offshore wind farm wouldn’t affectmilitary ops off Va. Beach. Reprinted on 13 News/ WVEC News; available at:http://www.wvec.com/news/military/Report-Va-offshore-wind-farm-wouldnt-affect-DOD-92670939.html (accessed November 1, 2010)266 Virginia Marine Resources Commission (2010). Opportunities for Offshore:Wind Energy in State Territorial Waters. Senate Document No. 10; pp. 4-6;available at:http://leg2.state.va.us/dls/h&sdocs.nsf/fc86c2b17a1cf388852570f9006f1299/6195a26e90b1329b852576d60076aa99/$FILE/SD10.pdf (accessed November1, 2010) 267 Environmental Law Institute (December 22, 2008). Virginia OffshoreEnergy Development Law and Policy Review and Recommendations. Preparedfor the Virginia Coastal Zone Management Program; available at:http://www.deq.state.va.us/coastal/documents/task91-02-07.pdf (accessedNovember 1, 2010); See also: Environmental Law Institute (December 22,2008). Report #2: Virginia Offshore Energy Development Law and PolicyReview and Recommendations. Prepared for the Virginia Coastal ZoneManagement Program; available athttp://www.deq.state.va.us/coastal/documents/task1-04-07a.pdf (accessedNovember 1, 2010).268 For more information on the coalition, see:http://www.virginiaoffshorewind.com/index.php?option=com_content&view=article&id=46&Itemid=53 (accessed November 1, 2010).269 See North Carolina’s ‘50 m wind resource map’ prepared by the USDOE/NREL; available at: http://www.clemson.edu/scies/NCMAP.pdf (accessedNovember 1, 2010)270 University of North Carolina (June 2009). Coastal Wind: Energy for NorthCarolina’s Future; Prepared for the NC General Assembly; p. 359; available at:http://www.climate.unc.edu/coastal-wind (accessed November 1, 2010).271 Schwartz, M.; Heimiller, D.; Haymes, S.; and Musial W. (June 2010); pp. 3-4(Table 1).272 US DOE (July 2008); pp. 9, 178. See also: Rigas, N. (2009). Offshore WindEnergy and North Carolina; Presentation at the 6th Annual Sustainable EnergyConference; slides 5-7; available at:http://www.energync.net/conference/presentations209.html (accessedNovember 1, 2010)273 McGrath, G. (August 19, 2010). Onslow Bay looked at for first N.C. wind farm.Star News Online; available at:http://www.starnewsonline.com/article/20100819/ARTICLES/100819557/1004?p=1&tc=pg (accessed November 1, 2010)274 Sorg, L. (September 8, 2010). NC ramps up for wind energy. Indyweek.com;available at: http://www.indyweek.com/indyweek/nc-ramps-up-for-wind-energy/Content?oid=1654035 (accessed November 1, 2010)275 University of North Carolina (June 2009). Coastal Wind: Energy for NorthCarolina’s Future; Prepared for the NC General Assembly; available at:http://www.climate.unc.edu/coastal-wind (accessed November 1, 2010)276 Progress Energy (June 29, 2010). Progress Energy invests in North Carolinaoffshore wind study; available at: http://progress-energy.com/aboutus/news/article.asp?id=24442 (accessed November 1, 2010)277 A separate proposal by Duke Energy and the University of North Carolina-Chapel Hill (UNC) proposal to place up to 3 demonstration turbines in PamlicoSound has been cancelled. See: Cartledge, J. (August 20, 2010). Duke Energyaxes North Carolina offshore wind pilot. Brighterenergy.org; available at:http://www.brighterenergy.org/15070/news/wind/duke-energy-axes-north-carolina-offshore-wind-pilot/ (accessed November 1, 2010)
I NSP IR ING AMER ICANS TO PROTECT W ILDL IFE FOR OUR CH ILDREN ’S FUTURE .
National Wildlife Federation
11100 Wildlife Center Drive
Reston, VA 20190
703-438-6000
www.nwf.org
278 McGlinchey, D. (March 5, 2010). NC offshore wind demonstration beginsenvironmental study. Offshore Wind Wire; available at:http://offshorewindwire.com/2010/03/05/nc-demonstration-study/ (accessedNovember 1, 2010)279 Schwartz, M.; Heimiller, D.; Haymes, S.; and Musial W. (June 2010); pp. 3-4(Table 1).280 Southern Alliance for Clean Energy (February 12, 2009). Yes We Can:Southern solutions for a national renewable energy standard; p. 15; availableat: http://www.cleanenergy.org/images/files/SERenewables022309rev.pdf(accessed November 1, 2010) 281 For an excellent summary of SC’s offshore wind resource and currentstatewide efforts, see the following issue of Coastal Heritage magazinededicated to offshore wind: Offshore Wind: Testing the Water (Winter 2010).Coastal Heritage, by the SC Sea Grant Consortium, Vol. 24, No. 3; available at:http://www.scseagrant.org/pdf_files/ch_winter_10.pdf (accessed November 1,2010) 282 Clemson University Restoration Institute (2009). South Carolina’s offshorewind programs; available at:http://www.clemson.edu/restoration/focus_areas/renewable_energy/wind/scwind_programs/index.html (accessed November 1, 2010)283 SC Wind Energy Production Farms Feasibility Study Committee (December2009). South Carolina’s Role in Offshore Wind Energy Development. Reportand recommendations prepared in response to Act 318 of 2008; available at:http://www.energy.sc.gov/publications/Wind%20Energy%20Production%20Farms%20Feasibility%20Study%20Committee%20Final%20Report%2012-09%20%282%29.pdf (accessed November 1, 2010)284 Vanden Houten, C. (April 20, 2009). Regulatory Task Force for CoastalClean Energy. South Carolina Energy Office; available at:http://www.energy.sc.gov/publications/Vanden%20Houten,%20SC%20Energy%20Office.pdf (accessed November 1, 2010). See also: The Energy Connection(Winter 2009). Energy office receives $500,000 wind energy grant. SouthCarolina Energy Office; available at:http://www.energy.sc.gov/newsletters/Winter09Newsletter_FINAL.pdf(accessed November 1, 2010)285 Clemson University Newsroom (November 23, 2009). Clemson UniversityRestoration Institute lands $98 million funding to develop next-generationwind turbines; available at: http://www.clemson.edu/media-relations/article.php?article_id=2432 (accessed November 1, 2010)286 The State (October21, 2010); available at:http://www.thestate.com/2010/10/21/1522589/sc-potential-high-for-offshore.html (accessed November 9, 2010); Santee Cooper presentationavailable at:http://www.energy.sc.gov/publications/Elizabeth%20Kress,%20Santee%20Cooper.pdf (accessed November 9, 2010)287 OffshoreWind.biz (October 7, 2010). Monitoring wind to find best spots foroffshore wind turbines; available at:http://www.offshorewind.biz/2010/10/07/monitoring-wind-to-find-best-spots-for-offshore-wind-turbines-usa/ (accessed November 1, 2010)
288 Gellatly, M. (August 8, 2010). Wind energy potential tested off S.C. coast.Aiken Standard; available at: http://www.aikenstandard.com/Local/0806Wind(accessed November 1, 2010)289 Schwartz, M.; Heimiller, D.; Haymes, S.; and Musial W. (June 2010); pp. 3-4(Table 1). 290 Southern Alliance for Clean Energy (February 12, 2009); p. 15.291 See Georgia’s ‘50 m wind resource map’ prepared by the US DOE/NREL;available at: http://www.clemson.edu/scies/GAMAP.pdf (accessed November 1,2010)292 See the website of InfinitEnergy: Project and Partnership section, availableat: http://www.gtsav.gatech.edu/infinitenergy/IEprojects.html (accessedNovember 1, 2010)293 Southern Company & Georgia Institute of Technology (2007). SouthernWinds: Summary Project Report 2007; pp. 6, 8, 21-24; available at:http://www.southerncompany.com/planetpower/pdfs/WindReport.pdf(accessed November 1, 2010)294 Rodgers, P. (June 1, 2010). Winds of Change: Local efforts could bring windpower to coastal Georgia. Connect Savannah; available at:http://www.connectsavannah.com/news/article/102342/ (accessed November1, 2010)295 For more information on the group, visit their website at:http://www.gawwg.org/home.html (accessed November 1, 2010)296 Elliott, D. and Schwartz, M. (June 2006). Wind Resource Mapping for UnitedStates Offshore Areas. National Renewable Energy Laboratory, NREL/CP-500-40045; pp. 3-5; available at: http://www.nrel.gov/wind/pdfs/40045.pdf(accessed November 1, 2010)297 Navigant Consulting (November 24, 2008). Florida Renewable EnergyPotential Assessment. Prepared for FL Public Service Commission andGovernor’s Office; p. 65; available at:http://www.psc.state.fl.us/utilities/electricgas/RenewableEnergy/Full_Report_2008_11_24.pdf (accessed November 1, 2010) 298 Schwartz, M.; Heimiller, D.; Haymes, S.; and Musial W. (June 2010); pp. 3-4(Table 1).299 Cogan, J. (July 21, 2008). Big Florida Wind Provider Offers Long-WindedExcuse to Floridians for Windless Policy. The Cutting Edge; available at:http://www.thecuttingedgenews.com/index.php?article=651&pageid=21&pagename=Energy (accessed November 1, 2010)300 Darin, P. (August 5, 2010). Atlantic Offshore Wind Energy Consortiumestablished. The Epoch Times; available at:http://www.theepochtimes.com/n2/content/view/37820/ (accessed November1, 2010)301 Florida Atlantic University Press Office (April 8, 2009). FAU’s Center forOcean Energy Technology Deploys Acoustic Doppler Current Profilers toMonitor South Florida Ocean Currents; available at:http://www.fau.edu/communications/mediarelations/Releases0409/040907.php (accessed November 1, 2010)