Embed Size (px)
Citation preview
GROWING HEALTHY LOCAL FOOD: SUSTAINABILITY POTENTIAL AND HOUSEHOLD PARTICIPATION IN
HOME GARDENS
Sumita Ghosh University of Technology Sydney, Sydney, Australia
INTRODUCTION The continuing population growth, decreasing availability of productive land due to land conversion, transport emissions of food and other factors will create significant challenges for supplying future food demand and sustainability. The United Nations Development Programme (UNDP) identified that by 2050 there will be an additional 2.7 billion people in the world (UNDP, 2009). Two thirds of the world’s population will be living in urban areas by 2030 (Population Reference Bureau, 2011). Over the period of ten years, between 1982 and 1992, 18.5 hectares of prime farm land per hour were converted to urban built up areas in the USA (Heller and Keoleian, 2003:1014). In the UK, 12% of the nation's fuel consumption is food related and is spent on packaging and transporting food (Garnett, 1997). If all foods are grown within 100 km farm to plate travel distance, a 96% reduction in emissions is possible in current food transport emissions in New Zealand (Pritchard and Vale, 1999). Local food production in home, community and allotment gardens are becoming very popular all over the world as evidences show (Australian City farms and Community Gardens Network, 2011; National Gardening Association, 2009). Local food production minimises transport emissions by facilitating shorter food supply chains (SFCs); provides fresh and nutritious food for better public health; reduces prolonged refrigeration and storage requirements; reduces food wastage; improves overall carbon footprints and develops social interactions and better engagement with nature for improved sustainability performance (Gaynor, 2006; Ghosh et al., 2008; Ghosh, 2010). Home gardens exist within millions of private residential outdoor spaces in the cities and suburbs of the world. Local food production in these home gardens could work as an informal alternative local food production network; build positive connections to nature and could contribute immensely to sustainability of residential neighbourhoods (Gaynor, 2006; Kneafsey et al. 2008; Ghosh et al., 2008; Ghosh, 2010). At an individual plot scale, the domestic or home garden is commonly defined as a space other than a dwelling in a residential parcel or subdivision (Loram et al. 2008). Home gardens are different in terms of their ownership pattern, social interactions and household participation methods from the community and allotment gardens. In a home garden, the land is held under an individual ownership while in a community or allotment garden, land is held either in a collective ownership or by the local authority or by other public or private organisations. In the home gardens, personal motivations of household members and also together as a household to adopt a sustainable life style and to maintain their gardening practices over time play an important role in growing food in their own gardens spaces (Ghosh, 2010). The food grown in the home gardens is also influenced by the cultural backgrounds of the people who live in these houses (Head and Muir, 2007; Graham and Connell 2006). Growing food in the home gardens generate ‘a more transparent relationship between food, produce and consumer’ (Kneafsey et al., 2008:131) contributing to sustainability knowledge. Home gardening as an alternative local food system is less visible and is still regarded as the remnant of an older way of life related to the rural traditions of those who have migrated to the cities (WinklerPrins, 2002). Local food production in the home gardens of a developed country like Australia is not always for subsistence. However, a survey of three low income households in 2004 in South West Sydney in Australia reveals that food security as an important problem. In the south western region of Sydney, a total of 21.9% all households face food insecurity; 30% households with children and 45% of single parent households are food insecure (Sydney Food Fairness Alliance and Food Fairness Illawarra 2010). Local food production in their own home gardens could offer an alternative pathway to achieve household self sufficiency and food security. Current local food production research has focussed on community engagement and participation and social perspectives of growing food in the community gardens. A very limited research has been conducted on sustainability performance and household participation in the home gardens. This paper, firstly, aims to investigate spatially using GIS, available productive land areas of domestic gardens in a selected residential suburb in Western Sydney at a Collection District (CD) level as defined by Australian Bureau of Statistics (ABS). The morphological correlations of productive land to parcel areas, garden sizes and other land covers
such as trees, built roof areas etc. are examined spatially to classify specific garden typologies and their associated dwelling structures. Secondly, using a GIS based model and mathematical calculations, potential quantity of vegetables in equivalent food energy units that could be produced in a neighbourhood is estimated. Only vegetable production is considered as it is common and due to limited availability of local food data on the home gardens. A questionnaire survey with householders will be conducted in coming months to comprehend household participation, problems and prospects of growing food in the home gardens. This paper does not include the results of the questionnaire survey as it is not complete to date. The results could be presented in the conference. Also this paper mainly focuses on the home gardens and does not include sustainability of local food production in community and allotment gardens and smaller farms. SUSTAINABILITY POTENTIAL OF VEGETABLE PRODUCTION IN HOME GARDENS – A REVIEW Home gardens as local food production sites offer significant opportunities to contribute to enhanced sustainability potential of cities and suburbs. Martin and Marsden (1999) study emphasised importance of urban food production in smaller vacant urban spaces, backyards and even container gardening in addition to larger land areas for food production (Martin and Marsden, 1999). National Gardening Association, USA (2009) survey report indicates that on average a well maintained vegetable garden could return US$500 annually (National Gardening Association 2009). Kitchen Gardeners International study (2009) compared the price of food grown in a home garden (size 1/25th of an acre or approximately 162 m² in area) with a three different set of food prices in conventional grocery store, farmers market and organic grocery store. After subtracting the expenditure for seed or supplies, soil test, compost and water, the net prices of local food production in the home garden were equivalent to US$1914.50, US$2149.15 and US$2263.93 respectively and produced a total of 376 kg of vegetables annually (Doiron, 2009). Ghosh and Head (2009) research on retrofitting suburban gardens for sustainability in two scenarios estimated that using lawn spaces for food production (after leaving a 20 m² mandatory open space area) could increase vegetable production in the home gardens from 836 kg per household to 1119 kg per household in a traditional suburban development with larger garden spaces. Francis (2010) commented that suburban residential blocks generally range less than 500m² to 1000 m² in area and this area of land could produce nearly most of the vegetable food demand for a household and could also produce surplus fruits. Even if the suburban land once productive is currently under uses for different activities in the residential developments, could have a substantial potential to grow food. “The lawn space of the suburbs, if put into intensive food production has the potential to out-produce the yields of commercial agriculture previously practiced on that land and provide most of our fresh food needs” (Francis, 2010). Local food production in communal and individual garden spaces has been successfully incorporated in the best practice low, medium and high density residential examples of sustainable development. The Earthsong eco-neighbourhood in New Zealand has on-site provisions for individual home gardens, a common vegetable garden and edible landscaping throughout the development (Earthsong Eco-Neighbourhood, 2011). The zero-emission five earth sheltered houses in the Hockerton Housing Project in UK have an organic garden and a poly tunnel for growing vegetables all year round (Hockerton Housing Project, 2011). These examples demonstrate that sustainable community design models put significant emphasis on local food production in the community and personal gardens. Local food production in the home gardens is associated mainly with low and medium density developments as these two types of developments offer sufficient land areas and opportunities to undertake a certain proportion of food production. Smith et al. (2005) research explored land cover patterns in the garden spaces of residential developments with varying dwelling densities of 10, 20, 30, 40 dwellings per hectare using GIS. This research establishes that significant connections exist between dwelling densities, parcel sizes, land cover pattern distributions in the garden spaces (Smith et al., 2005). Ghosh and Head (2009) compared garden spaces of two: traditional and emerging/modern suburban residential developments using GIS from Illawarra region, New South Wales in Australia. The results indicate that percentage distribution of rear gardens in the traditional development is 52% of all the garden spaces which is larger than the modern or contemporary development with 35% of all the garden spaces as rear garden areas. Although their dwelling densities are very similar but the population densities vary to a considerable extent as average household and dwelling sizes were different in these two developments. The available productive land areas thus depend on the footprints of built forms on the parcels and land cover characteristics (impervious cover, features such as swimming pools, tree cover etc.) of gardens. Ghosh (2004) compared the local food production potential for sustainability considering productive land areas in five residential neighbourhood case studies varying in physical densities (low, medium and high) in
Auckland, New Zealand. This study developed a model that calculates the land area equivalents of demand, available and deficit or surplus vegetable production as land based indicators of sustainability using ecological footprint conversion methods (Ghosh, 2004; Ghosh et al., 2008). It establishes that low and medium density neighbourhoods have better potential to be sustainable in terms of producing sufficient or surplus vegetables on site compared to higher density neighbourhoods. The suburbs will continue to retain their characteristics as their rapid intensification within a short time frame is unlikely. This emphasises sustainability significance of home gardens in the low and medium density settlements. The higher density residential developments could grow their food in community and allotment gardens and other smaller urban spaces such as road verges and even could adopt container and vertical wall gardening to become sustainable. Household participation is one of the very important attributes for the success of local food production in the home gardens. The individual and household participation are shaped by lifestyle choices, preferences, motivation, knowledge and commitment to sustainability. A survey conducted by the National Gardening Association, USA (2009) indicates that out of a total of 33 million households surveyed in the USA, approximately 91% of the households have food gardens at home; 5% households’ share gardens with friends, neighbours and family and 3% have gardening spaces in community gardens (National Gardening Association 2009). This survey establishes the extent of household participation and interests in growing local food in home gardens. A study by Graham and Connell (2006) shows that the production of traditional fruits, vegetables, herbs and flowers in Vietnamese, Greek and Italian migrants’ domestic gardens in Australia links to their specific cultural identities, memories, traditional practices (Graham and Connell 2006). These cultural identities are dynamic and continuously evolving within a multicultural landscape in Australia to generate new preferences. These new identities are reflected in the second generation food production practices in the home gardens (Graham and Connell 2006). Also the participation is influenced by the food security issues and extent of contributions to household income and local economy. “The dynamic role of home gardening in family nutrition and household welfare must be assessed in the context of the wider farming system and household economy” (Marsh, 1998: 4). WinklerPrins (2002) identifies that food production in house lot gardens of Brazil, created a rural and urban connection through food exchanges and initiated critical social networks. Human interactions with nature in growing food generate positive connections and a useful platform for enhancing sustainability. DATA COLLECTION AND METHODOLOGY The quantitative data for this research are collected from aerial photographs using Geographic Information Systems (GIS) techniques at a collection district level (CD) as defined by Australian Bureau of Statistics (ABS). The selection criteria for choosing the collection district include the following two assumptions.
1. A separate house would have highest possibility to accommodate a domestic or home garden. 2. A family household would have the best opportunity to participate collectively as a household in
growing local food in an individual garden space. This research integrates spatial data with basic community profile or socio-economic data from the ABS census 2006 on separate houses and total family households across Sydney Statistical Division (SD) at a CD level. Firstly, the spatial distributions of separate houses and total family households across the Sydney Statistical Division (SD) at the CD level are mapped using ArcGIS 10. The spatial distributions of the CDs with higher total numbers of separate houses (>= total numbers of separate houses above 242 in CDs) and higher percentages of family households (>= 80% family households in CDs) in different LGAs within the Sydney Statistical Subdivision (SD) are mapped using GIS. A collection district (CD) that satisfies all the elements of the above selection criteria, contains mainly residential land use and is located in a suburban local government area (LGA) is selected as a case study site from a number of CDs identified through this process. The selected CD is further cross checked using GIS to confirm that in addition to these criteria, it also contains higher percentage of separate houses to total numbers of houses (>= 80%). A CD from the Penrith City Council with a total of 309 residential dwellings is selected as the case study for this research. The Penrith City Council is selected as it is located in the western part of Sydney and lower residential density development pattern could provide opportunities for growing food for the new resident communities. The selected residential neighbourhood is comparatively a new community as 44.5% people moved in that neighbourhood in the last five years and 96% dwellings are detached dwellings (ABS, 2006 as quoted in Penrith City Council, 2011). Only 3.3% of the total people are unemployed and median weekly household income is $1404.00. A total of 929 people live in this selected neighbourhood; 60% of all households have two or more cars and 65% own their house either with or without a mortgage according to the ABS 2006 census data. The calculated household size is 3.0 persons per occupied private dwelling. The ABS household data also indicates that there are 47.3% couples with children of ages under fifteen years,
24% couples without children, 12.1% young couples (15-44 years) without children and 2.0% older households (ABS, 2006 as quoted in Penrith City Council, 2011). Using GIS, the cadastre data on the residential parcels are matched with the aerial photo data to determine the actual usage of land on site. For this study two main garden spaces: front and rear are measured depending on their configurations, usages and relations to the houses and compared to determine their morphological correlations to residential parcels and building footprint areas. The two side garden spaces will be added in the second stage of this study. The productive land areas in the front and rear garden spaces include the areas such as lawns, flowerbeds and unpaved areas which could be potentially used for the local food production and are calculated spatially. The calculations for productive land areas in these two garden spaces do not include the land areas under tree canopy cover as it is assumed that the land area under a tree canopy cover has a limited ability to grow food due to shading. In this research, simple GIS methods are used to calculate the land cover patterns so that the results of both the current and automated methods remain comparable in future. Using the local food production model (Ghosh, 2004; Ghosh, Vale and Vale, 2008), the vegetable production in the available productive land areas and corresponding equivalent energy potential are estimated at a collection district (CD) scale for the residential neighbourhood. A questionnaire survey for which ethics approval has already been obtained is now being conducted on similar CDs within Sydney SD to understand the household participation (activities and usage of home gardens), time use patterns and gender participation for growing local food and to comprehend corresponding local food production potential. The results of the survey will be presented at the conference. RESULTS AND DISCUSSIONS Results The morphological analysis of the important elements such as parcel areas, garden spaces and building footprints of a residential neighbourhood at a collection district (CD) scale could make effective connections to various types of ABS census data available on different socio-economic characteristics of the neighbourhood.
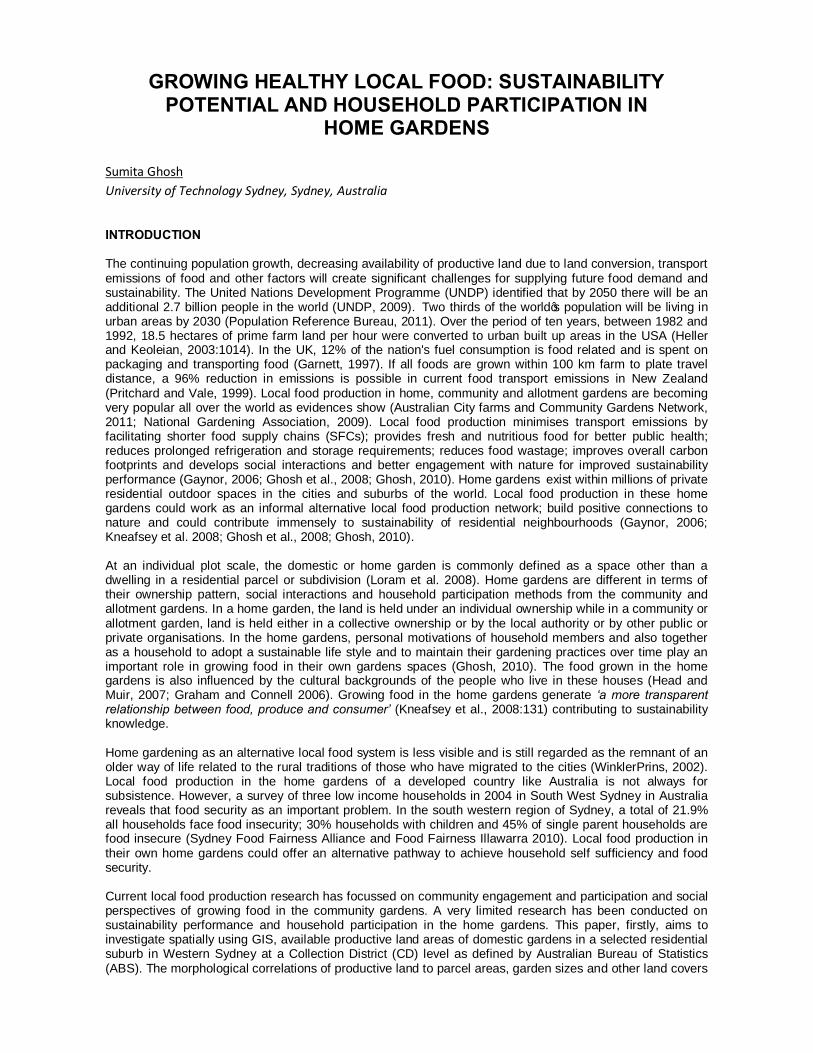
Fig 1: Spatial distributions of percentages of family households at CD levels in Sydney SD Data source: ABS 2006 Census Fig. 1 shows the percentage distributions of the CDs with family households to the total number of households (includes non-family households in addition to family households) in the Sydney Statistical Division (SD). Similarly, the distributions of total numbers of separate houses and percentages of separate houses to the total numbers of houses are also mapped for the Sydney Statistical Division (SD) (Fig. 2). As mentioned in the previous section of this paper, the spatial distributions of the CDs that satisfy the selection
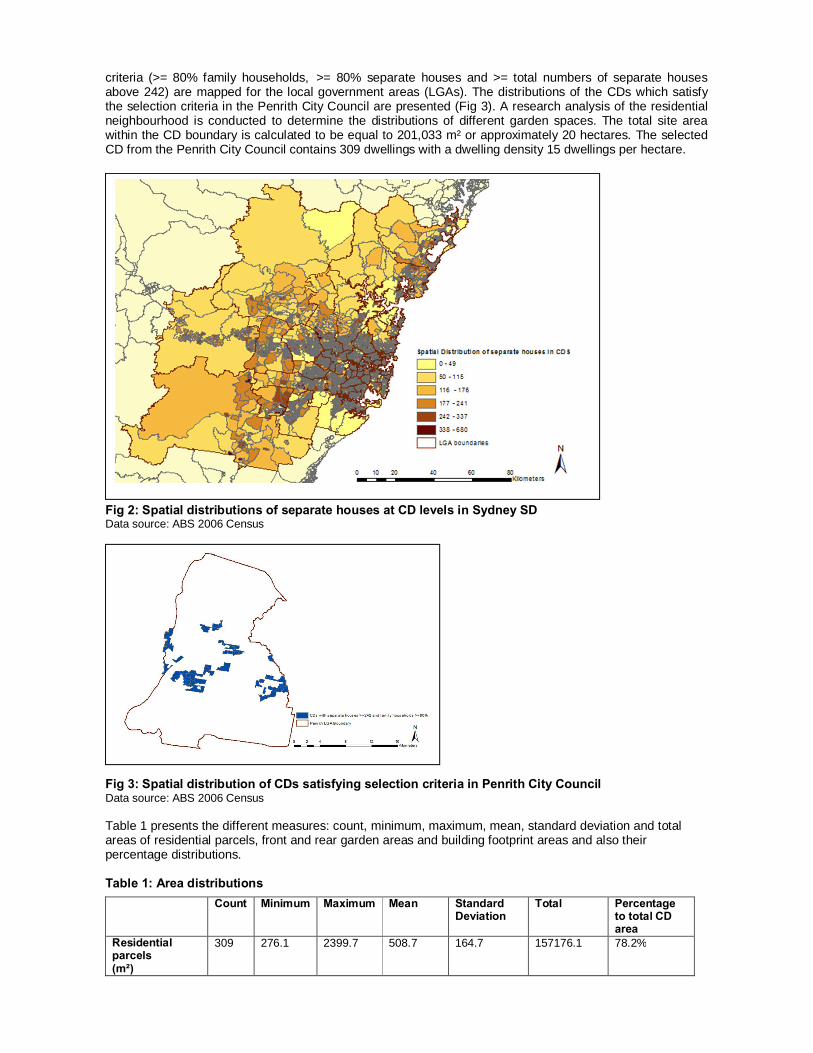
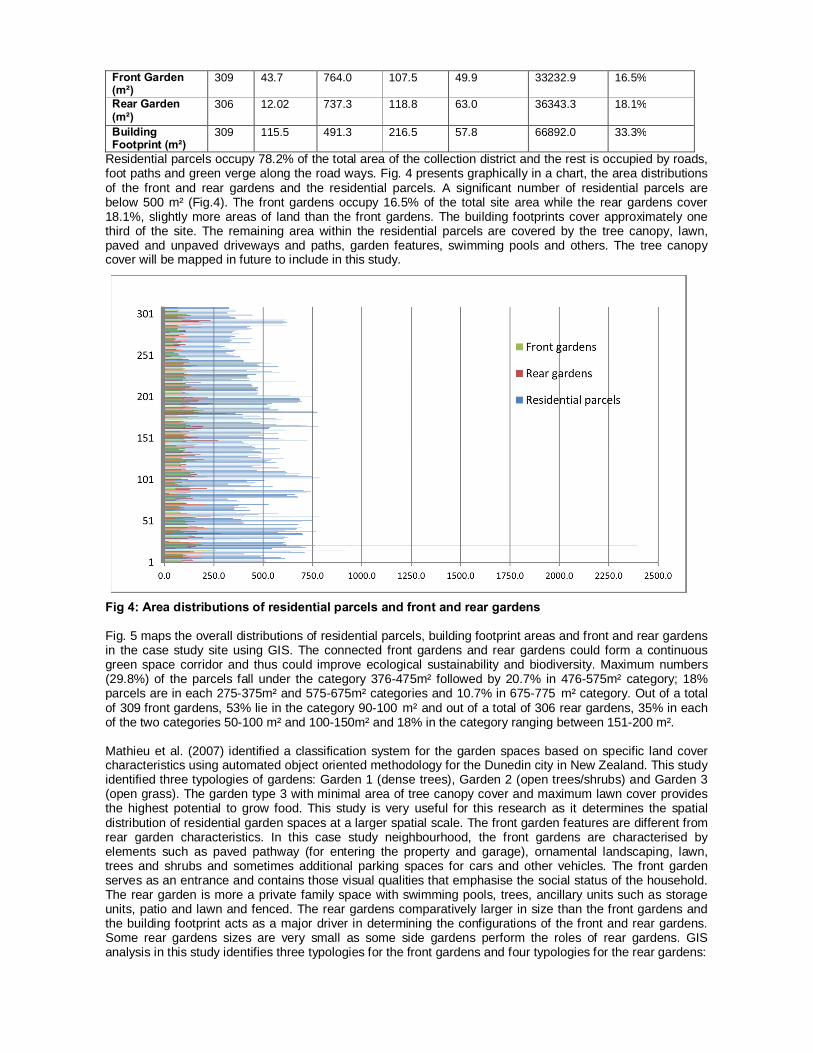
criteria (>= 80% family households, >= 80% separate houses and >= total numbers of separate houses above 242) are mapped for the local government areas (LGAs). The distributions of the CDs which satisfy the selection criteria in the Penrith City Council are presented (Fig 3). A research analysis of the residential neighbourhood is conducted to determine the distributions of different garden spaces. The total site area within the CD boundary is calculated to be equal to 201,033 m² or approximately 20 hectares. The selected CD from the Penrith City Council contains 309 dwellings with a dwelling density 15 dwellings per hectare.
Fig 2: Spatial distributions of separate houses at CD levels in Sydney SD Data source: ABS 2006 Census
Fig 3: Spatial distribution of CDs satisfying selection criteria in Penrith City Council Data source: ABS 2006 Census Table 1 presents the different measures: count, minimum, maximum, mean, standard deviation and total areas of residential parcels, front and rear garden areas and building footprint areas and also their percentage distributions. Table 1: Area distributions
Count Minimum Maximum Mean
Standard Deviation
Total
Percentage to total CD area
Residential parcels (m²)
309 276.1 2399.7 508.7 164.7 157176.1
78.2%
Residential parcels occupy 78.2% of the total area of the collection district and the rest is occupied by roads, foot paths and green verge along the road ways. Fig. 4 presents graphically in a chart, the area distributions of the front and rear gardens and the residential parcels. A significant number of residential parcels are below 500 m² (Fig.4). The front gardens occupy 16.5% of the total site area while the rear gardens cover 18.1%, slightly more areas of land than the front gardens. The building footprints cover approximately one third of the site. The remaining area within the residential parcels are covered by the tree canopy, lawn, paved and unpaved driveways and paths, garden features, swimming pools and others. The tree canopy cover will be mapped in future to include in this study. Fig 4: Area distributions of residential parcels and front and rear gardens Fig. 5 maps the overall distributions of residential parcels, building footprint areas and front and rear gardens in the case study site using GIS. The connected front gardens and rear gardens could form a continuous green space corridor and thus could improve ecological sustainability and biodiversity. Maximum numbers (29.8%) of the parcels fall under the category 376-475m² followed by 20.7% in 476-575m² category; 18% parcels are in each 275-375m² and 575-675m² categories and 10.7% in 675-775 m² category. Out of a total of 309 front gardens, 53% lie in the category 90-100 m² and out of a total of 306 rear gardens, 35% in each of the two categories 50-100 m² and 100-150m² and 18% in the category ranging between 151-200 m². Mathieu et al. (2007) identified a classification system for the garden spaces based on specific land cover characteristics using automated object oriented methodology for the Dunedin city in New Zealand. This study identified three typologies of gardens: Garden 1 (dense trees), Garden 2 (open trees/shrubs) and Garden 3 (open grass). The garden type 3 with minimal area of tree canopy cover and maximum lawn cover provides the highest potential to grow food. This study is very useful for this research as it determines the spatial distribution of residential garden spaces at a larger spatial scale. The front garden features are different from rear garden characteristics. In this case study neighbourhood, the front gardens are characterised by elements such as paved pathway (for entering the property and garage), ornamental landscaping, lawn, trees and shrubs and sometimes additional parking spaces for cars and other vehicles. The front garden serves as an entrance and contains those visual qualities that emphasise the social status of the household. The rear garden is more a private family space with swimming pools, trees, ancillary units such as storage units, patio and lawn and fenced. The rear gardens comparatively larger in size than the front gardens and the building footprint acts as a major driver in determining the configurations of the front and rear gardens. Some rear gardens sizes are very small as some side gardens perform the roles of rear gardens. GIS analysis in this study identifies three typologies for the front gardens and four typologies for the rear gardens:
Front Garden (m²)
309 43.7 764.0 107.5 49.9 33232.9
16.5%
Rear Garden (m²)
306 12.02 737.3 118.8 63.0 36343.3 18.1%
Building Footprint (m²)
309 115.5 491.3 216.5 57.8 66892.0 33.3%
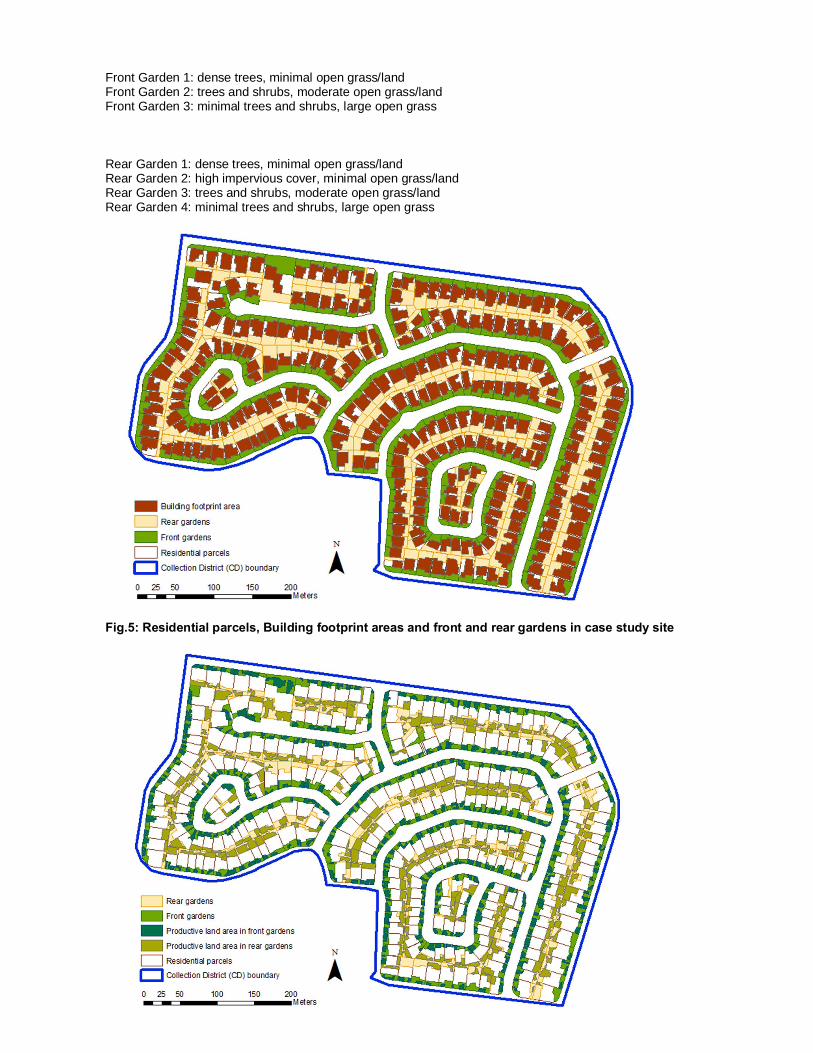
Front Garden 1: dense trees, minimal open grass/land Front Garden 2: trees and shrubs, moderate open grass/land Front Garden 3: minimal trees and shrubs, large open grass
Rear Garden 1: dense trees, minimal open grass/land Rear Garden 2: high impervious cover, minimal open grass/land Rear Garden 3: trees and shrubs, moderate open grass/land Rear Garden 4: minimal trees and shrubs, large open grass
Fig.5: Residential parcels, Building footprint areas and front and rear gardens in case study site
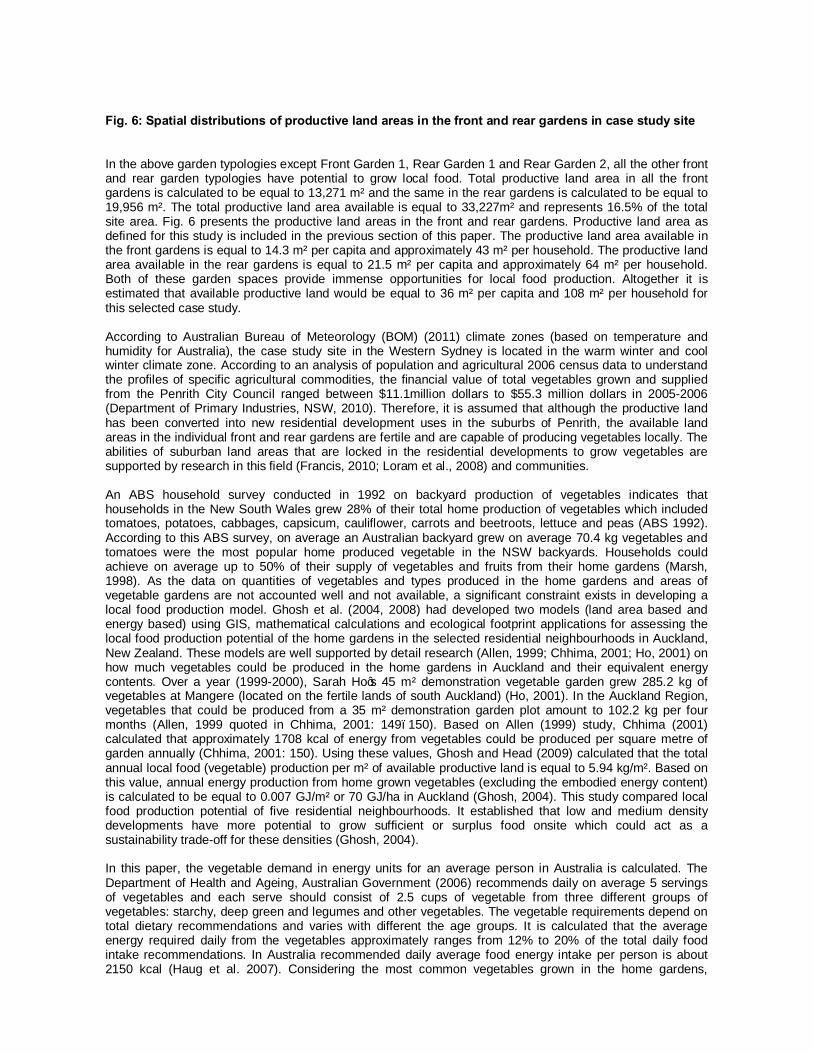
Fig. 6: Spatial distributions of productive land areas in the front and rear gardens in case study site
In the above garden typologies except Front Garden 1, Rear Garden 1 and Rear Garden 2, all the other front and rear garden typologies have potential to grow local food. Total productive land area in all the front gardens is calculated to be equal to 13,271 m² and the same in the rear gardens is calculated to be equal to 19,956 m². The total productive land area available is equal to 33,227m² and represents 16.5% of the total site area. Fig. 6 presents the productive land areas in the front and rear gardens. Productive land area as defined for this study is included in the previous section of this paper. The productive land area available in the front gardens is equal to 14.3 m² per capita and approximately 43 m² per household. The productive land area available in the rear gardens is equal to 21.5 m² per capita and approximately 64 m² per household. Both of these garden spaces provide immense opportunities for local food production. Altogether it is estimated that available productive land would be equal to 36 m² per capita and 108 m² per household for this selected case study. According to Australian Bureau of Meteorology (BOM) (2011) climate zones (based on temperature and humidity for Australia), the case study site in the Western Sydney is located in the warm winter and cool winter climate zone. According to an analysis of population and agricultural 2006 census data to understand the profiles of specific agricultural commodities, the financial value of total vegetables grown and supplied from the Penrith City Council ranged between $11.1million dollars to $55.3 million dollars in 2005-2006 (Department of Primary Industries, NSW, 2010). Therefore, it is assumed that although the productive land has been converted into new residential development uses in the suburbs of Penrith, the available land areas in the individual front and rear gardens are fertile and are capable of producing vegetables locally. The abilities of suburban land areas that are locked in the residential developments to grow vegetables are supported by research in this field (Francis, 2010; Loram et al., 2008) and communities. An ABS household survey conducted in 1992 on backyard production of vegetables indicates that households in the New South Wales grew 28% of their total home production of vegetables which included tomatoes, potatoes, cabbages, capsicum, cauliflower, carrots and beetroots, lettuce and peas (ABS 1992). According to this ABS survey, on average an Australian backyard grew on average 70.4 kg vegetables and tomatoes were the most popular home produced vegetable in the NSW backyards. Households could achieve on average up to 50% of their supply of vegetables and fruits from their home gardens (Marsh, 1998). As the data on quantities of vegetables and types produced in the home gardens and areas of vegetable gardens are not accounted well and not available, a significant constraint exists in developing a local food production model. Ghosh et al. (2004, 2008) had developed two models (land area based and energy based) using GIS, mathematical calculations and ecological footprint applications for assessing the local food production potential of the home gardens in the selected residential neighbourhoods in Auckland, New Zealand. These models are well supported by detail research (Allen, 1999; Chhima, 2001; Ho, 2001) on how much vegetables could be produced in the home gardens in Auckland and their equivalent energy contents. Over a year (1999-2000), Sarah Ho’s 45 m² demonstration vegetable garden grew 285.2 kg of vegetables at Mangere (located on the fertile lands of south Auckland) (Ho, 2001). In the Auckland Region, vegetables that could be produced from a 35 m² demonstration garden plot amount to 102.2 kg per four months (Allen, 1999 quoted in Chhima, 2001: 149–150). Based on Allen (1999) study, Chhima (2001) calculated that approximately 1708 kcal of energy from vegetables could be produced per square metre of garden annually (Chhima, 2001: 150). Using these values, Ghosh and Head (2009) calculated that the total annual local food (vegetable) production per m² of available productive land is equal to 5.94 kg/m². Based on this value, annual energy production from home grown vegetables (excluding the embodied energy content) is calculated to be equal to 0.007 GJ/m² or 70 GJ/ha in Auckland (Ghosh, 2004). This study compared local food production potential of five residential neighbourhoods. It established that low and medium density developments have more potential to grow sufficient or surplus food onsite which could act as a sustainability trade-off for these densities (Ghosh, 2004). In this paper, the vegetable demand in energy units for an average person in Australia is calculated. The Department of Health and Ageing, Australian Government (2006) recommends daily on average 5 servings of vegetables and each serve should consist of 2.5 cups of vegetable from three different groups of vegetables: starchy, deep green and legumes and other vegetables. The vegetable requirements depend on total dietary recommendations and varies with different the age groups. It is calculated that the average energy required daily from the vegetables approximately ranges from 12% to 20% of the total daily food intake recommendations. In Australia recommended daily average food energy intake per person is about 2150 kcal (Haug et al. 2007). Considering the most common vegetables grown in the home gardens,
Australian Government’s ‘Healthy Eating’ recommendations on daily vegetable servings and intake distribution in the three groups of vegetables, the energy value of daily vegetables demand kcal for an average person is calculated to vary between 425 kcal to 255 kcal. It is assumed that the total vegetable demand will be at a percentage requirement of 15% or 330 kcal of the recommended total daily diet for an average person. In energy units the daily vegetable demand for the total population living in the selected case study area is calculated to be equal to 306,570 kcal or 1.3 gigajoules (GJ) and annual demand would be 111898050 kcal or 468 GJ. A study by the North Carolina State University (1996) in the USA indicates that a home garden of a size of 97m² (7.6m X 12.8m) could produce almost all the vegetables required for two people annually. Assuming an average energy demand for vegetables 15% of the total daily diet of 2200 kcal for an average person, 330 kcal would be required from vegetables daily. It is assumed that only 80% of the vegetable requirements of the total dietary demand could be produced on the 97m² of the garden space and rest 20% would be wasted from cooking, storing, food wastage and others. Therefore, an area of 97m² of home garden would be able to produce 1986 kcal per m² of the garden area. This value calculated is similar to the vegetable production potential calculated per square metre of the demonstration vegetable garden in Auckland. In the absence of any specific Australian data on productive capacity of vegetables in energy units, based on these two values, an average value of 1847 kcal vegetable productive capacity per m² of home garden area is adopted for this calculation. It is estimated that the available productive land areas in the selected neighbourhood could potentially supply 61370269 kcal or 257 GJ energy equivalent vegetables annually. This energy equivalent of vegetables could contribute 55% of all the annual average vegetable demand for all the residents in this neighbourhood. The low and medium density settlements have potential to generate a considerable amount of vegetables due to higher availability of productive land areas. When these values of vegetable or local food potential for home gardens are added for all the collection districts at an overall local government area level, city and regional levels, it could potentially develop a major alternative local food production network and could contribute enormously towards achieving food secured sustainable settlements. This study is now conducting a questionnaire survey to understand the qualitative dimensions of this research. The results of the study when completed would provide a holistic picture of local food production potential of home gardens. The outcomes would formulate an integrated sustainability framework and would recommend important local scale spatial and land use planning policies. Discussions This study identifies the important typologies of home gardens as observed in a selected residential neighbourhood at a collection district level. This study establishes that it is possible to grow a considerable share of household annual vegetable demand in the home gardens. This could positively impact the environmental qualities and the health of the communities through improved levels of active engagement and physical exercise in the process of growing food. The percentage value of vegetable share that could be grown onsite would vary depending on the availability productive land areas, age specific vegetable requirements for adequate nutrition in the diet and other relevant factors. It could be also shaped by the socio-economic characteristics such as income, age groups and individual and household commitments to growing food. This study identifies that there is a significant research gap on how much vegetables could be grown on a defined land area of a home garden. Future research needs to explore the vital connections between energy, productive land availability and productive capacity linked to soil profiles. Essentially the local food production data needs to be well documented and modelled for measuring sustainability performance of local food potential of the home gardens in different density residential neighbourhoods. The availability of productive land areas in the home gardens of different residential neighbourhoods are influenced by the morphological characteristics such as built form patterns, road layouts, tree canopy cover and paved and unpaved surfaces. The specific characteristics of the morphologies could generate varying potential of available productive land areas in different types of residential developments. For example, low density detached houses in a traditional development can offer larger areas of productive land areas compared to a low density neighbourhood with detached houses in a contemporary or recent development. It is crucial to understand the form specific capabilities of different urban and suburban forms to become sustainable and to utilise their potential efficiently towards achieving sustainability. Although policies have been developed on the community gardens by many local councils (e.g. City of Sydney and Auckland Council Community Gardens Policy), the council policies on the home gardens are very rare. However, the values of sustainable garden practices are recognized through development of certification/rating systems such as ‘The Sustainable Sites Initiative’ (American Society of Landscape Architects et al. 2009), fact sheets/booklets for gardening advice (Sustainable Gardening Australia (SGA) 2010). There is a very limited research that focuses on the household participation, gender distribution of

labour and time in growing local food in home gardens. It is significantly important to explore how the social and cultural processes could influence the household behavioural patterns and participation for growing food in own garden spaces. Adequate training supports, involvement of women, creating interests and awareness should be incorporated in developing new processes, planning and management for growing food in the home gardens. For the uptake of local food production in the home gardens, it would be essential to generate household awareness on environmental, social and economic sustainability benefits of the home gardens. Local and state level policies would be essential to initiate the process and to create interest and motivation. The policy and opportunities should allow the householders to choose the food that would like to grow in their own gardens. The financial supports and subsidies from the local and state governments would help to make a positive difference and to continue over longer time period. Monitoring the trends would be essential and success stories should be published to encourage more and more individuals, families and communities to participate, consult and express their views for further improvement. Future research should also explore opportunities to develop a productive land information base for informed decision making. Local food production in the home gardens could be a possible pathway in achieving improved suburban sustainability and a better public health. CONCLUSIONS Unless the substantial potential of home gardens is recognized along with the community gardens, urban agriculture and organic farming, the home gardens could remain a less emphasized local food production system. Initiatives by the national and state governments and local authorities and community behaviour change would be critical for the uptake of home food gardening. Only then the usable land areas locked in the millions of private garden spaces could be put to productive uses again, which could benefit our planet enormously and could help humanity to progress towards a food efficient future. ACKNOWLEDGEMENTS The author would like to thank to all who provided help for this research. The author would also like to specially thank anonymous referees for their suggestions. REFERENCES Allen, L., (1999), “Gardening for Kitchen”, B. Arch, Thesis Elective Study, School of Architecture, University
of Auckland. New Zealand. Auckland Council, (2011), “Community gardens policy”, Auckland, New Zealand.
http://www.aucklandcity.govt.nz/council/documents/gardenpolicy/default.asp (accessed on 30 April 2011).
Australian Bureau of Statistics (ABS), (1992), “Home Production of Selected Foodstuffs, Australia”, Australian Bureau of Statistics, Canberra.
Australian Bureau of Meteorology, (2011), “Australian climatic zones (based on temperature and humidity)”, http://www.bom.gov.au/climate/environ/travel/map.shtml (accessed on 26 July 2011). Australian City Farms and Community Gardens Network, (2011), http://communitygarden.org.au/ (accessed
on 10 July, 2011). Chhima, D., (2001) “Sustainable development and compact urban form”, Masters Thesis, The University of
Auckland, New Zealand. City of Sydney, (2011), “Community Gardens Policy”,
http://www.cityofsydney.nsw.gov.au/Residents/ParksAndLeisure/CommunityGardens/CommunityGardensPolicy.asp (accessed on May 29, 2011).
Department of Health and Ageing, Australian Government, (2006), “Healthy Eating: Recommended Daily Servings”,
http://www.health.gov.au/internet/healthyactive/publishing.nsf/Content/recommended-daily-servings Department of Health and Ageing, Australian Government.
Department of Primary Industries, (2010), “Analysis of Population Census and Agricultural Census data in Sydney Statistical Division: Profiles of specific agricultural commodities”, Industry and Investment, Sydney, NSW.
Doiron, R., (2009), “What’s a home garden worth?”, Kitchen Gardeners International, http://kitchengardeners.org/blogs/roger-doiron/home-garden-worth (accessed on 10 July, 2011). Earthsong Eco-Neighbourhood, (2011), “Design and development”, http://www.earthsong.org.nz/design-
development.html (accessed on: 11 August, 2011). Francis, R., (2010), “Harvesting the Suburbs and Small-space Gardens: Micro-Eden series # 2”,
Permaculture College of Australia. http://permaculture.com.au/online/articles/harvesting-the-suburbs-and-small-space-gardens-micro-eden-
series-2 (accessed on 10 July, 2011).
Garnett, T., (1997), “Digging for change: the potential of urban food production”, Urban Nature Magazine, Vol. 3(2), pp. 62-65.
Gaston, K.J., Warren, P. H., Thompson, K. and Smith, R. M., (2005), “Urban domestic gardens (IV): the extent of the resource and associated features”, Biodiversity and Conservation, Vol. 14, pp. 3327- 3349.
Gaynor, A., (2006), “Harvest of the suburbs: An environmental history of growing food in Australian Cities” University of Western Australia Press, Crawley, WA.
Ghosh, S., (2010), “Sustainability potential of suburban gardens: review and new directions”, Australasian Journal of Environmental Management, Vol.17, pp. 49‐59.
Ghosh, S. and Head, L., (2009), “Retrofitting suburban garden: morphologies and some elements of sustainability potential of two Australian residential suburbs compared”, Australian Geographer, Vol. 40 (3), pp. 319-346.
Ghosh, S., Vale, R. J. D., and Vale. B. A., (2008), “Local Food production in home gardens: measuring onsite sustainability potential of residential development”, International Journal of Environment and Sustainable Development (IJESD), Vol. 7(4), pp. 430-451.
Ghosh, S., (2004), “Simple Sustainability Indicators for Residential Areas of Auckland, New Zealand”, Ph.D. Thesis, School of Architecture and Planning, The University of Auckland, New Zealand.
Haug, A., Brand-Miller, J.C., Christoperson, O.A., McArthur, J., Fayet, F. and Truswell, S., (2007), “A food ‘‘lifeboat’’: food nutrition considerations in the event of a pandemic or other catastrophe”, Medical Journal of Australia, Vol. 187(11/12), pp. 674- 676.
Heller, M. C. and Keoleian, G. A., (2003), “Assessing the sustainability of the US food system: a life cycle perspective”, Agricultural Systems, Vol. 76(3), pp. 1007-1041.
Head, L. and Muir, P., (2007), “Backyard”, New South Wales, Australia: University of Wollongong Press. Ho, S., (2001), “Appendix 6” in Urban Food Growing and the Sustainability of Cities, Master Thesis, The
University of Auckland, New Zealand. Hockerton Housing Project (HHP), (2011), “Hockerton Housing Project”, http://www.hockertonhousingproject.org.uk/ (accessed on: 12 February, 2011). Kisner, C., (2008), “Green Roofs for Urban Food Security and Environmental Sustainability: Urban
Agriculture Case Study: Havana, Cuba”, Climate Change Institute, Washington DC, USA. http://www.climate.org/topics/international-action/urban-agriculture/havana.htm (accessed on 11 February, 2010).
Kneafsey, M., Cox, R., Holloway, L., Venn, L., & Dowler, E., (2008), “Reconnecting consumers, producers and food: exploring alternatives”, Berg Publishers, New York, USA.
Loram, A., Warren, P. H. & Gaston, K. J., (2008), “Urban Domestic Gardens (XIV): The Characteristics of Gardens in Five Cities”, Environmental Management, Vol. 42(3), pp. 361-376.
Mathieu, R., Freeman, C., and Aryal, J., (2007), “Mapping private gardens in urban areas using object –oriented techniques and very resolution satellite imagery”, Landscape and Urban Planning, Vol. 81, pp. 179-192.
Martin, R. and Marsden, T., (1999), “Food for urban spaces: the development of urban food production in England and Wales”, International Planning Studies, Vol. 4, pp. 389-419.
National Gardening Association (NGA), (2009), “The Impact of Home and Community Gardening In America”, South Burlington, VT, National Gardening Association Inc., USA.
New South Wales Government, (2009), “Healthy Urban Development Checklist, A guide for health services when commenting on development policies, plans and proposals”, NSW Health, Sydney, Australia.
North Carolina State University, (1996), “Home Vegetable Gardening” http://www.ces.ncsu.edu/depts/hort/hil/ag-06.html (accessed on 9 August, 2011).
Penrith City Council, (2011), “Welcome to Penrith City Community Atlas”, http://atlas.id.com.au/(accessed on 9 August, 2011).
Population Reference Bureau, (2011), “World Population Highlights 2007: Urbanization”, Washington DC, Population Reference Bureau, USA.
Pritchard, M. and Vale, R., (1999), “How to save yourself (possibly the world) on 20 minutes a day”, Proceedings of the 6th Conference of the Sustainable Energy Forum, Threshold 2000, Can Our Cities Become Sustainable?. 23–25 June, 1999, Latest Version 2003. Auckland, New Zealand.
Smith, RM, Gaston, KJ, Warren, PH & Thompson, K., (2005) “Urban domestic gardens (V): relationships between land cover composition, housing and landscape”, Landscape Ecology, Vol. 20, pp. 235–253.
United Nations, (2011), “Agenda 21”, http://www.un.org/esa/dsd/agenda21/ (accessed on March 20, 2011). Wackerangel, M. and Rees, W., (1996), “Our Ecological Footprint, Reducing Human Impact on Earth”, New
Society Publishers, Gabriola Island, BC, Canada. WinklerPrins, M.G.A.A., (2002), “House-lot gardens in Santarém, Pará, Brazil: linking rural with urban”,
Urban Ecosystems, Vol. 6, pp. 43–65.


![DNV STD 2.7-3 Portable Offshore Units [Jun 2011]](https://img.pdfslide.us/doc/110x75/545d8e42af7959b9098b4dd7/dnv-std-27-3-portable-offshore-units-jun-2011.jpg)


![TOPIC: 291006 KNOWLEDGE: K1.01 [2.7/2.7] QID: B104](https://img.pdfslide.us/doc/110x75/61bd329661276e740b104f0e/topic-291006-knowledge-k101-2727-qid-b104.jpg)