Embed Size (px)
Citation preview

Investor’s update April 2013
Growing from our strengths
Strategic Plan
2012-2016
Disclaimer
ALL RIGHTS ARE RESERVED
© REPSOL, S.A. 2013
Repsol, S.A. “Repsol” is the exclusive owner of this document. No part of this document may be reproduced (including photocopying), stored, duplicated,
copied, distributed or introduced into a retrieval system of any nature or transmitted in any form or by any means without the prior written permission of
Repsol.
This document does not constitute an offer or invitation to purchase or subscribe shares, in accordance with the provisions of the Spanish Securities
Market Law (Law 24/1988, of July 28, as amended and restated) and its implementing regulations. In addition, this document does not constitute an offer
of purchase, sale or exchange, or a request for an offer of purchase, sale or exchange of securities in any other jurisdiction.
Some of the resources mentioned in this document do not constitute proved reserves and will be recognized as such when they comply with the formal
conditions required by the U. S. Securities and Exchange Commission.
This document contains statements that Repsol believes constitute forward-looking statements within the meaning of the US Private Securities Litigation
Reform Act of 1995. These forward-looking statements may include statements regarding the intent, belief, or current expectations of Repsol and its
management, including statements with respect to trends affecting Repsol’s financial condition, financial ratios, results of operations, business, strategy,
geographic concentration, production volume and reserves, as well as Repsol’s plans, expectations or objectives with respect to capital expenditures,
business, strategy, geographic concentration, costs savings, investments and dividend payout policies. These forward-looking statements may also
include assumptions regarding future economic and other conditions, such as future crude oil and other prices, refining and marketing margins and
exchange rates. These statements are not guarantees of future performance, prices, margins, exchange rates or other events and are subject to material
risks, uncertainties, changes and other factors which may be beyond Repsol’s control or may be difficult to predict.
Repsol’s future financial condition, financial ratios, results of operations, business, strategy, geographic concentration, production volumes, reserves,
capital expenditures, costs savings, investments and dividend payout policies, as well as future economic and other conditions, such as future crude oil
and other prices, refining margins and exchange rates, could differ materially from those expressed or implied in any such forward-looking statements.
Important factors that could cause such differences include, but are not limited to, oil, gas and other price fluctuations, supply and demand levels,
currency fluctuations, exploration, drilling and production results, changes in reserves estimates, success in partnering with third parties, loss of market
share, industry competition, environmental risks, physical risks, the risks of doing business in developing countries, legislative, tax, legal and regulatory
developments, economic and financial market conditions in various countries and regions, political risks, wars and acts of terrorism, natural disasters,
project delays or advancements and lack of approvals, as well as those factors described in the filings made by Repsol and its affiliates with the Comisión
Nacional del Mercado de Valores in Spain, the Comisión Nacional de Valores in Argentina, and the Securities and Exchange Commission in the United
States and with all the supervisory authorities of the markets where the securities issued by Repsol and/or its affiliates are admitted to trading. In light of
the foregoing, the forward-looking statements included in this document may not occur. Repsol does not undertake to publicly update or revise these
forward-looking statements even if experience or future changes make it clear that the projected performance, conditions or events expressed or implied
therein will not be realized.
The information contained in the document has not been verified nor revised by the External Accountant Auditors of Repsol.
2
Agenda
• Company Overview
• Repsol: A Transformation Story
• Strategic Plan 2012-2016 : Growing from our strengths
• Financial Outlook
• Environmental, Social & Governance
• Summary
3

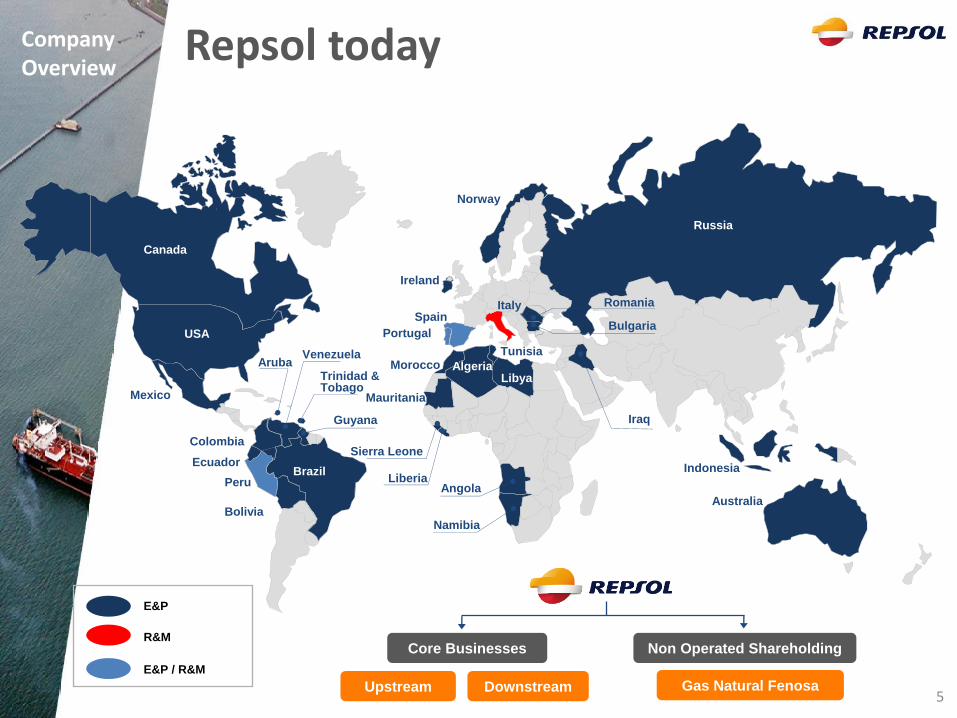
Company Overview
Mauritania
Morocco
USA
Canada
Spain
Algeria Libya
Russia
Norway
Bolivia
Peru
Ecuador
Colombia
Mexico
Angola
Indonesia Brazil
Iraq
Portugal
Ireland
Tunisia
Australia
Namibia
Sierra Leone
Liberia
Venezuela
Trinidad & Tobago
Guyana
Aruba
Bulgaria
Romania
E&P
R&M
E&P / R&M
Italy
Upstream
Core Businesses
Downstream
Non Operated Shareholding
Gas Natural Fenosa
Repsol today Company Overview
5
6
Company Overview
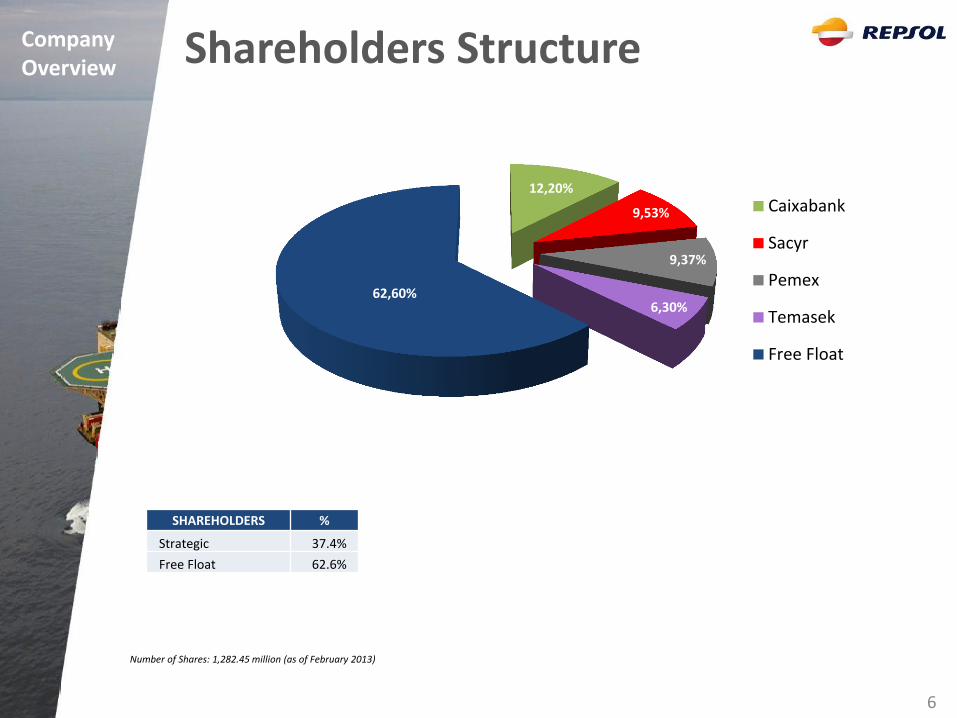
Shareholders Structure
Number of Shares: 1,282.45 million (as of February 2013)
SHAREHOLDERS %
Strategic 37.4%
Free Float 62.6%
12,20%
9,53%
9,37%
6,30% 62,60%
Caixabank
Sacyr
Pemex
Temasek
Free Float
7
Company Overview
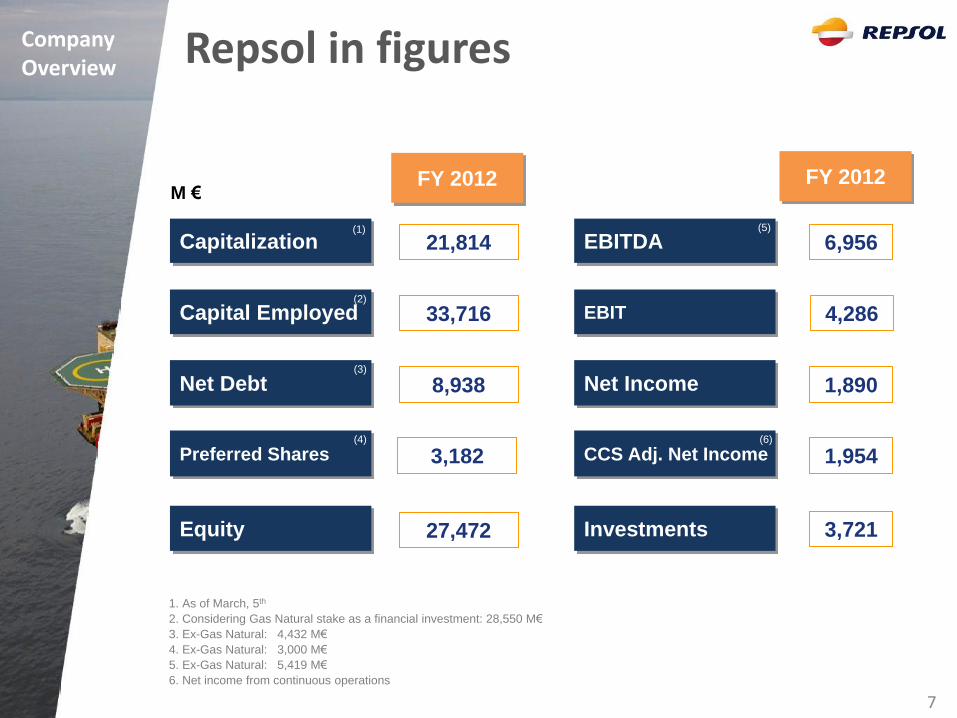
Repsol in figures
1. As of March, 5th
2. Considering Gas Natural stake as a financial investment: 28,550 M€
3. Ex-Gas Natural: 4,432 M€
4. Ex-Gas Natural: 3,000 M€
5. Ex-Gas Natural: 5,419 M€
6. Net income from continuous operations
Capitalization
Capital Employed
Net Debt
Equity
EBITDA
EBIT
Net Income
Investments
Preferred Shares CCS Adj. Net Income
FY 2012
(4)
M €
(3)
21,814
33,716
8,938
27,472
3,182
6,956
4,286
1,890
3,721
1,954
(5)
(6)
FY 2012
(1)
(2)
Repsol: A transformation story
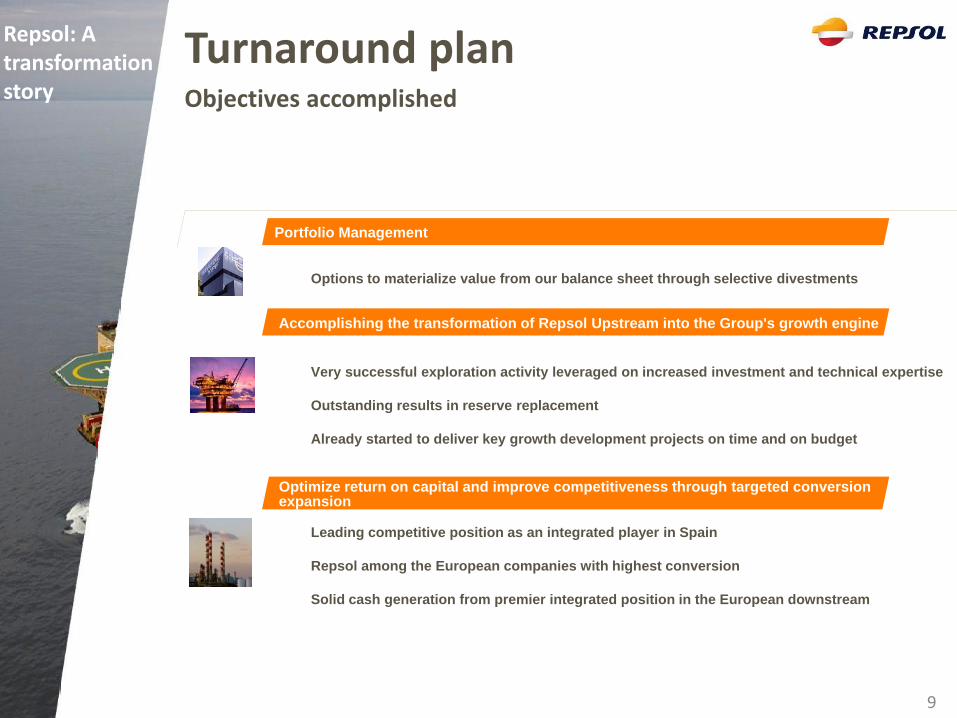
Turnaround plan Objectives accomplished
Repsol: A transformation story
9
Portfolio Management
Accomplishing the transformation of Repsol Upstream into the Group's growth engine
Optimize return on capital and improve competitiveness through targeted conversion expansion
Options to materialize value from our balance sheet through selective divestments
Very successful exploration activity leveraged on increased investment and technical expertise
Outstanding results in reserve replacement
Already started to deliver key growth development projects on time and on budget
Leading competitive position as an integrated player in Spain
Repsol among the European companies with highest conversion
Solid cash generation from premier integrated position in the European downstream
Repsol: A transformation story
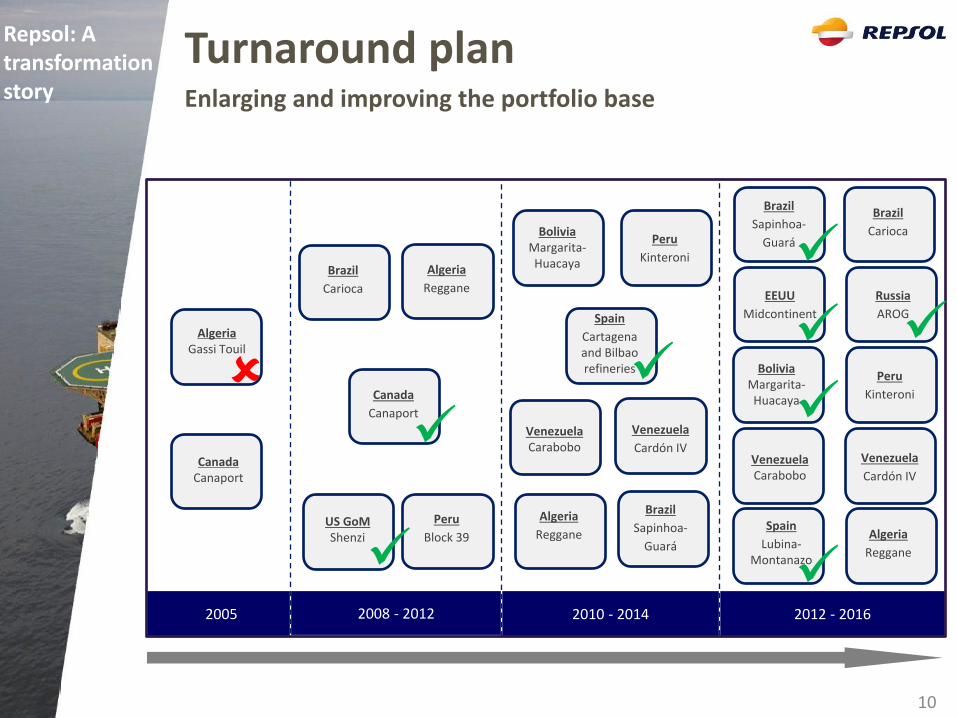
10
2005 2012 - 2016 2010 - 2014 2008 - 2012
Algeria Gassi Touil
Canada Canaport
US GoM Shenzi
Brazil
Carioca
Algeria
Reggane
Canada
Canaport
Peru
Block 39
Peru
Kinteroni
Bolivia Margarita- Huacaya
Venezuela Carabobo
Venezuela
Cardón IV
Algeria
Reggane
Brazil
Sapinhoa-
Guará
Brazil
Sapinhoa-
Guará
Brazil
Carioca
Russia
AROG
EEUU
Midcontinent
Peru
Kinteroni
Bolivia Margarita- Huacaya
Venezuela Carabobo
Venezuela
Cardón IV
Spain
Lubina-Montanazo
Algeria
Reggane
Spain
Cartagena and Bilbao refineries
Turnaround plan Enlarging and improving the portfolio base
Repsol: A transformation story
11
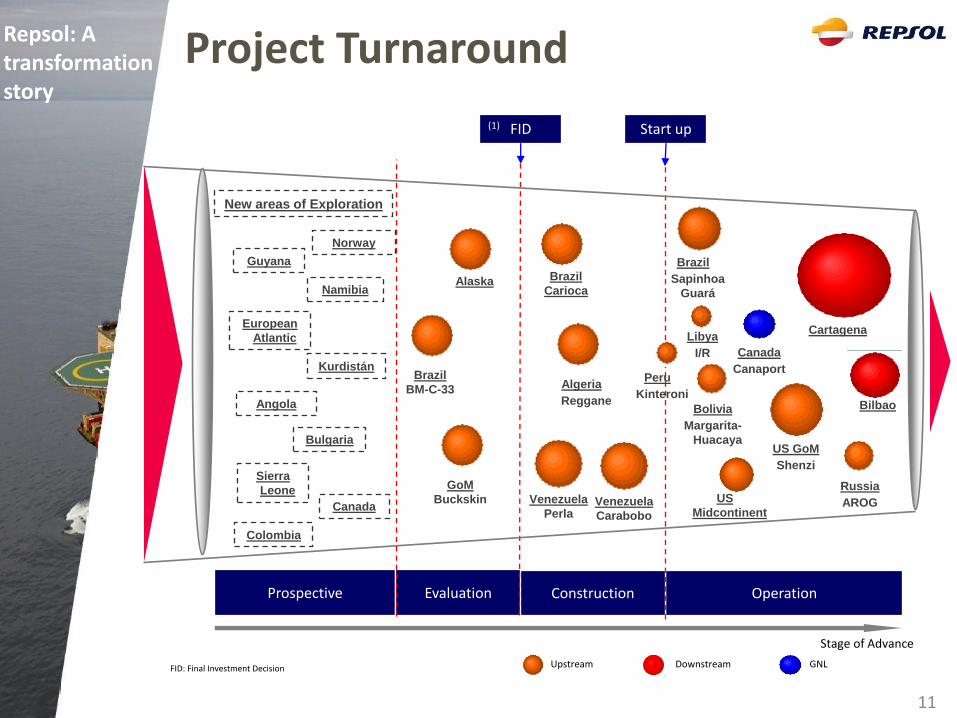
Prospective Operation Construction Evaluation
FID Start up
Brazil
Sapinhoa
Guará
Algeria
Reggane
Peru
Kinteroni
Bolivia
Margarita-
Huacaya
Alaska
Canada
Canaport
Libya
I/R
US GoM
Shenzi
Stage of Advance
Kurdistán
European
Atlantic
Brazil
BM-C-33
Upstream Downstream GNL
Namibia
Angola
New areas of Exploration
FID: Final Investment Decision
(1)
Cartagena
Bilbao
Russia
AROG Venezuela
Carabobo
Guyana
Sierra
Leone
Brazil
Carioca
Venezuela
Perla
Bulgaria
Norway
US
Midcontinent Canada
Colombia
GoM
Buckskin
Project Turnaround
Strategic Plan 2012-2016
Growing from our strengths
13
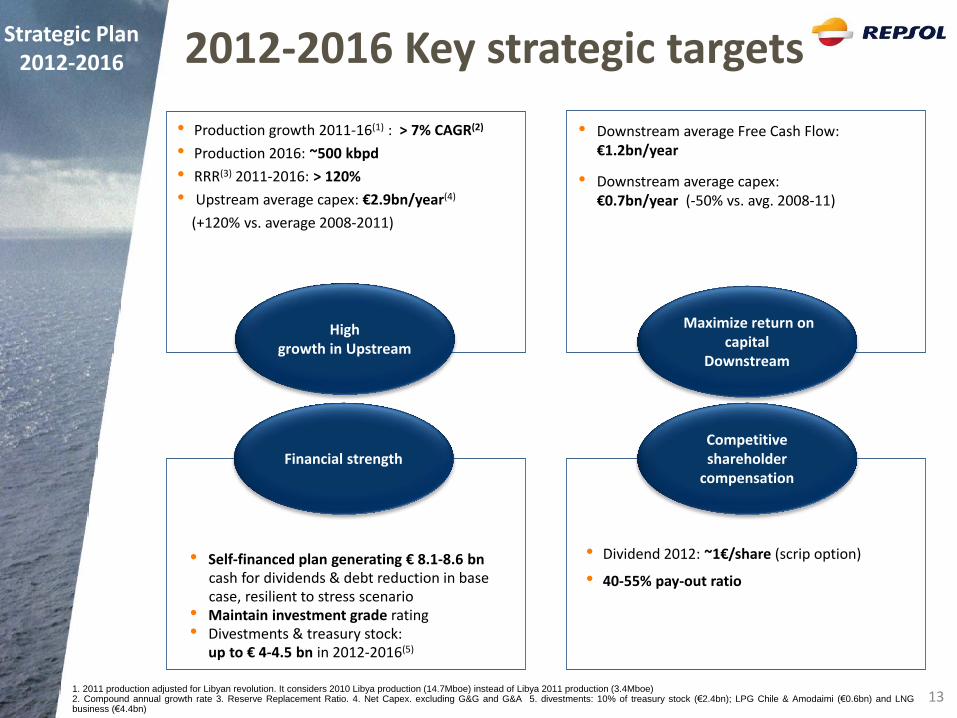
High growth in Upstream
Financial strength Competitive shareholder
compensation
Maximize return on capital
Downstream
• Dividend 2012: ~1€/share (scrip option)
• 40-55% pay-out ratio
• Production growth 2011-16(1) : > 7% CAGR(2)
• Production 2016: ~500 kbpd
• RRR(3) 2011-2016: > 120%
• Upstream average capex: €2.9bn/year(4)
(+120% vs. average 2008-2011)
• Downstream average Free Cash Flow: €1.2bn/year
• Downstream average capex: €0.7bn/year (-50% vs. avg. 2008-11)
• Self-financed plan generating € 8.1-8.6 bn cash for dividends & debt reduction in base case, resilient to stress scenario
• Maintain investment grade rating • Divestments & treasury stock:
up to € 4-4.5 bn in 2012-2016(5)
1. 2011 production adjusted for Libyan revolution. It considers 2010 Libya production (14.7Mboe) instead of Libya 2011 production (3.4Mboe) 2. Compound annual growth rate 3. Reserve Replacement Ratio. 4. Net Capex. excluding G&G and G&A 5. divestments: 10% of treasury stock (€2.4bn); LPG Chile & Amodaimi (€0.6bn) and LNG business (€4.4bn)
2012-2016 Key strategic targets Strategic Plan 2012-2016
Upstream Our businesses strategy: 2012-2016
15
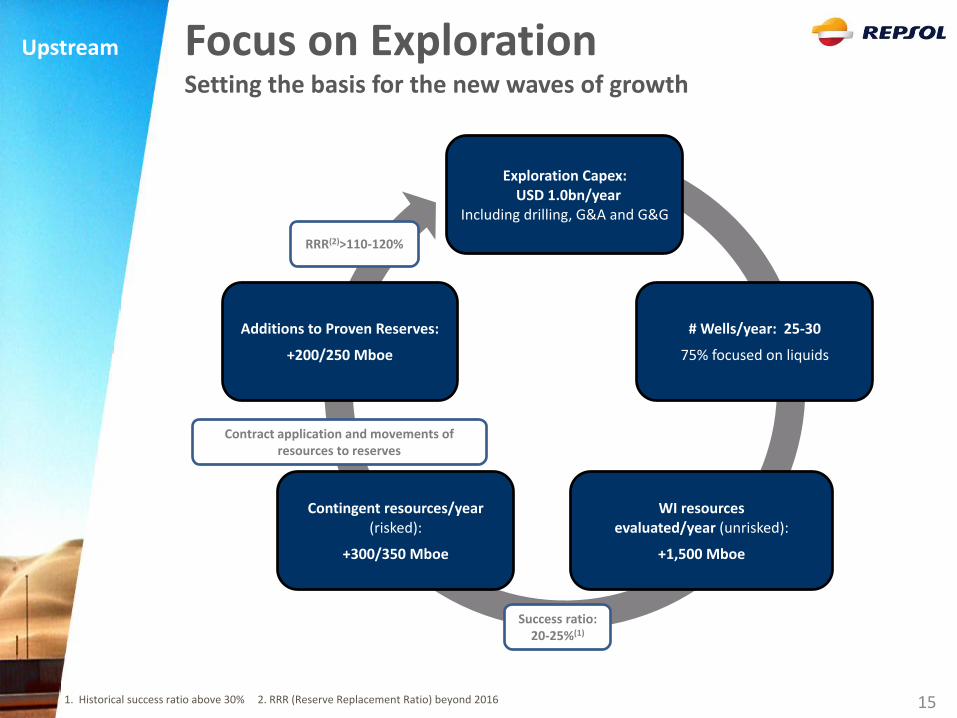
Upstream Focus on Exploration Setting the basis for the new waves of growth
Exploration Capex: USD 1.0bn/year
Including drilling, G&A and G&G
# Wells/year: 25-30
75% focused on liquids
WI resources evaluated/year (unrisked):
+1,500 Mboe
Contingent resources/year (risked):
+300/350 Mboe
Additions to Proven Reserves:
+200/250 Mboe
1. Historical success ratio above 30% 2. RRR (Reserve Replacement Ratio) beyond 2016
Success ratio: 20-25%(1)
Contract application and movements of resources to reserves
RRR(2)>110-120%
16
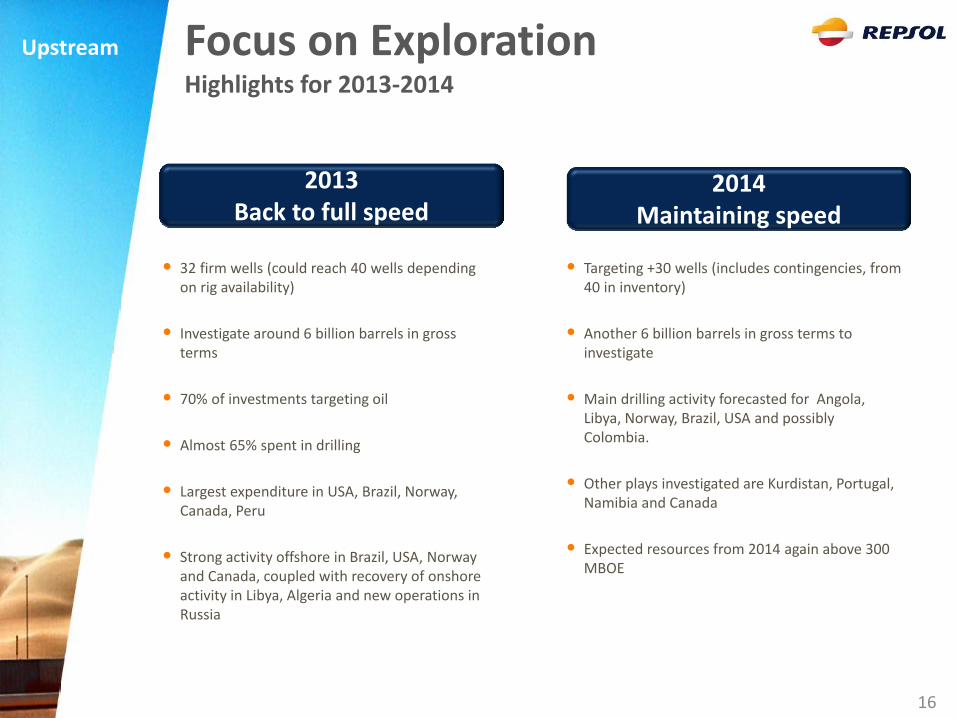
Upstream Focus on Exploration Highlights for 2013-2014
• 32 firm wells (could reach 40 wells depending on rig availability)
• Investigate around 6 billion barrels in gross terms
• 70% of investments targeting oil
• Almost 65% spent in drilling
• Largest expenditure in USA, Brazil, Norway, Canada, Peru
• Strong activity offshore in Brazil, USA, Norway and Canada, coupled with recovery of onshore activity in Libya, Algeria and new operations in Russia
• Targeting +30 wells (includes contingencies, from 40 in inventory)
• Another 6 billion barrels in gross terms to investigate
• Main drilling activity forecasted for Angola, Libya, Norway, Brazil, USA and possibly Colombia.
• Other plays investigated are Kurdistan, Portugal, Namibia and Canada
• Expected resources from 2014 again above 300 MBOE
2013 Back to full speed
2014 Maintaining speed
17
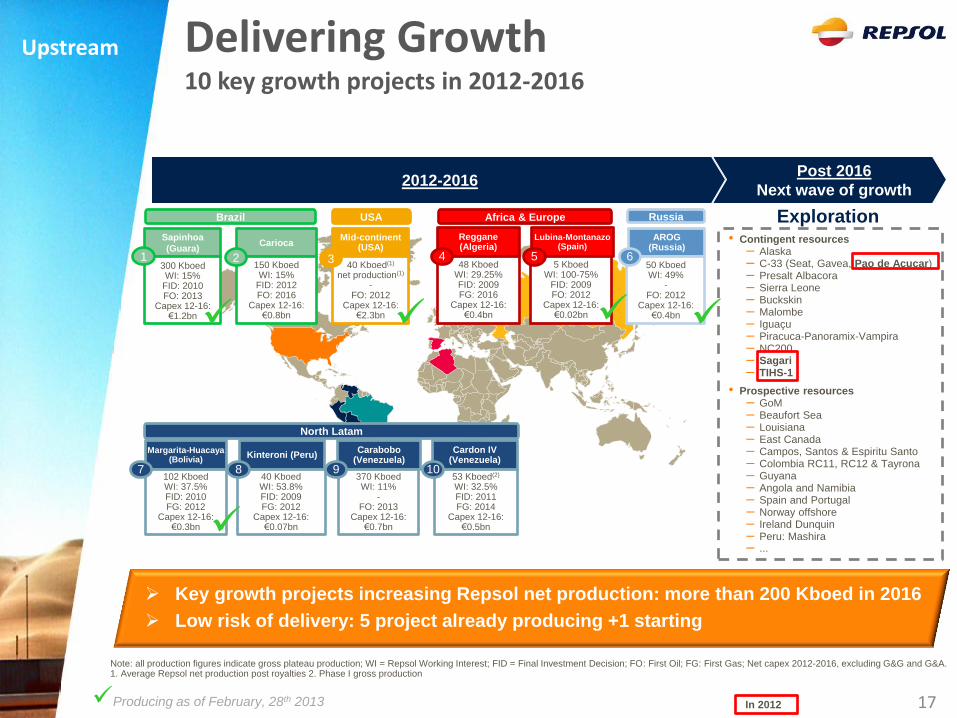
Upstream Delivering Growth 10 key growth projects in 2012-2016
Exploration Reggane (Algeria)
48 Kboed WI: 29.25% FID: 2009 FG: 2016
Capex 12-16: €0.4bn
Lubina-Montanazo (Spain)
5 Kboed WI: 100-75%
FID: 2009 FO: 2012
Capex 12-16: €0.02bn
Africa & Europe Brazil
Carioca
150 Kboed WI: 15%
FID: 2012 FO: 2016
Capex 12-16: €0.8bn
Mid-continent (USA)
40 Kboed(1)
net production(1) -
FO: 2012 Capex 12-16:
€2.3bn
Sapinhoa
(Guara)
300 Kboed WI: 15%
FID: 2010 FO: 2013
Capex 12-16: €1.2bn
USA
AROG (Russia)
50 Kboed WI: 49%
- FO: 2012
Capex 12-16: €0.4bn
Russia
1 2 4 5 3 6
North Latam
Margarita-Huacaya (Bolivia)
102 Kboed WI: 37.5% FID: 2010 FG: 2012
Capex 12-16: €0.3bn
7
Kinteroni (Peru)
40 Kboed WI: 53.8% FID: 2009 FG: 2012
Capex 12-16: €0.07bn
8
Carabobo (Venezuela)
370 Kboed WI: 11%
- FO: 2013
Capex 12-16: €0.7bn
9
Cardon IV (Venezuela)
53 Kboed(2)
WI: 32.5% FID: 2011 FG: 2014
Capex 12-16: €0.5bn
10
2012-2016 Post 2016
Next wave of growth
• Contingent resources – Alaska – C-33 (Seat, Gavea, Pao de Açucar) – Presalt Albacora – Sierra Leone – Buckskin – Malombe – Iguaçu – Piracuca-Panoramix-Vampira – NC200 – Sagari – TIHS-1
• Prospective resources – GoM – Beaufort Sea – Louisiana – East Canada – Campos, Santos & Espiritu Santo – Colombia RC11, RC12 & Tayrona – Guyana – Angola and Namibia – Spain and Portugal – Norway offshore – Ireland Dunquin – Peru: Mashira – ...
Note: all production figures indicate gross plateau production; WI = Repsol Working Interest; FID = Final Investment Decision; FO: First Oil; FG: First Gas; Net capex 2012-2016, excluding G&G and G&A. 1. Average Repsol net production post royalties 2. Phase I gross production
Key growth projects increasing Repsol net production: more than 200 Kboed in 2016
Low risk of delivery: 5 project already producing +1 starting
Producing as of February, 28th 2013
In 2012
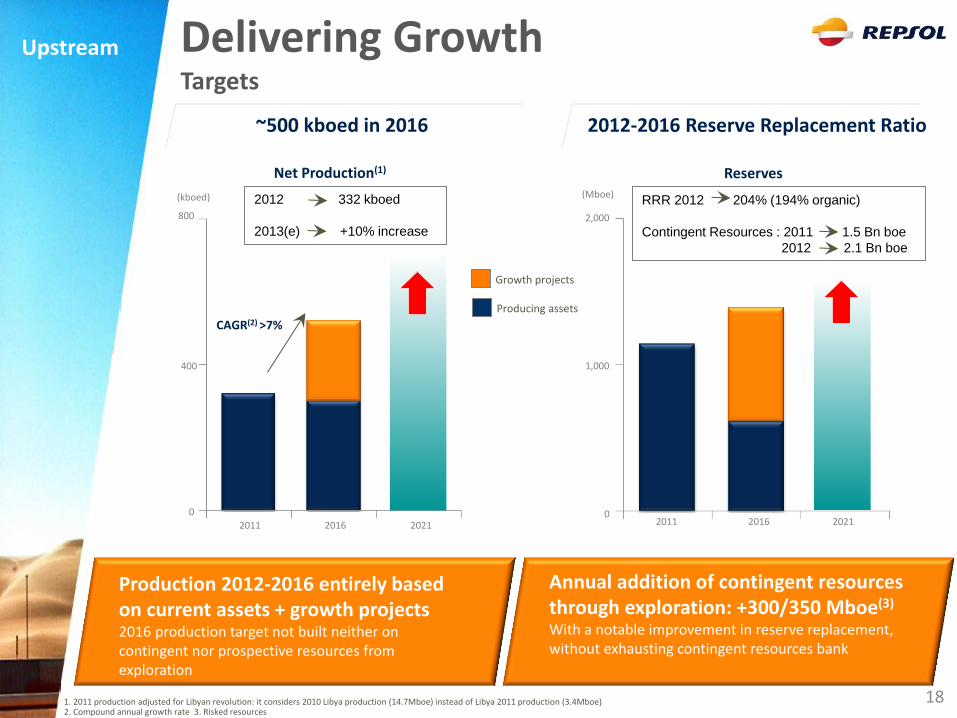
Delivering Growth Targets
Annual addition of contingent resources through exploration: +300/350 Mboe(3)
With a notable improvement in reserve replacement, without exhausting contingent resources bank
Production 2012-2016 entirely based on current assets + growth projects 2016 production target not built neither on contingent nor prospective resources from exploration
2012-2016 Reserve Replacement Ratio
~500 kboed in 2016
(kboed)
2011 2016 2021
0
400
Net Production(1)
800
(Mboe)
2021 2016 2011
2,000
1,000
0
Reserves
Producing assets
Growth projects
1. 2011 production adjusted for Libyan revolution: it considers 2010 Libya production (14.7Mboe) instead of Libya 2011 production (3.4Mboe) 2. Compound annual growth rate 3. Risked resources
CAGR(2) >7%
Upstream
RRR 2012 204% (194% organic)
Contingent Resources : 2011 1.5 Bn boe
2012 2.1 Bn boe
2012 332 kboed
2013(e) +10% increase
18
LNG Our businesses strategy: 2012-2016
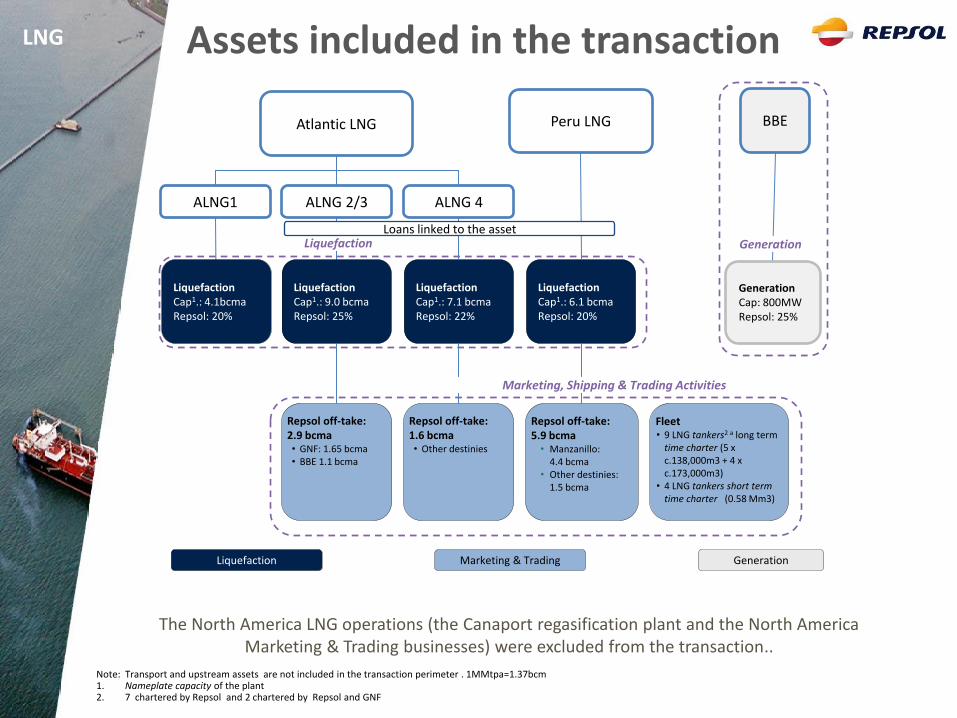
Liquefaction Marketing & Trading Generation
Atlantic LNG Peru LNG
ALNG1 ALNG 2/3 ALNG 4
Liquefaction Cap1.: 4.1bcma Repsol: 20%
Liquefaction Cap1.: 9.0 bcma Repsol: 25%
Liquefaction Cap1.: 7.1 bcma Repsol: 22%
Note: Transport and upstream assets are not included in the transaction perimeter . 1MMtpa=1.37bcm 1. Nameplate capacity of the plant 2. 7 chartered by Repsol and 2 chartered by Repsol and GNF
BBE
Generation Cap: 800MW Repsol: 25%
Generation
Liquefaction Cap1.: 6.1 bcma Repsol: 20%
Repsol off-take: 2.9 bcma • GNF: 1.65 bcma • BBE 1.1 bcma
Repsol off-take: 1.6 bcma • Other destinies
Repsol off-take: 5.9 bcma
• Manzanillo: 4.4 bcma
• Other destinies: 1.5 bcma
Fleet • 9 LNG tankers2 a long term
time charter (5 x c.138,000m3 + 4 x c.173,000m3)
• 4 LNG tankers short term time charter (0.58 Mm3)
Marketing, Shipping & Trading Activities
Liquefaction Loans linked to the asset
LNG Assets included in the transaction
The North America LNG operations (the Canaport regasification plant and the North America Marketing & Trading businesses) were excluded from the transaction..
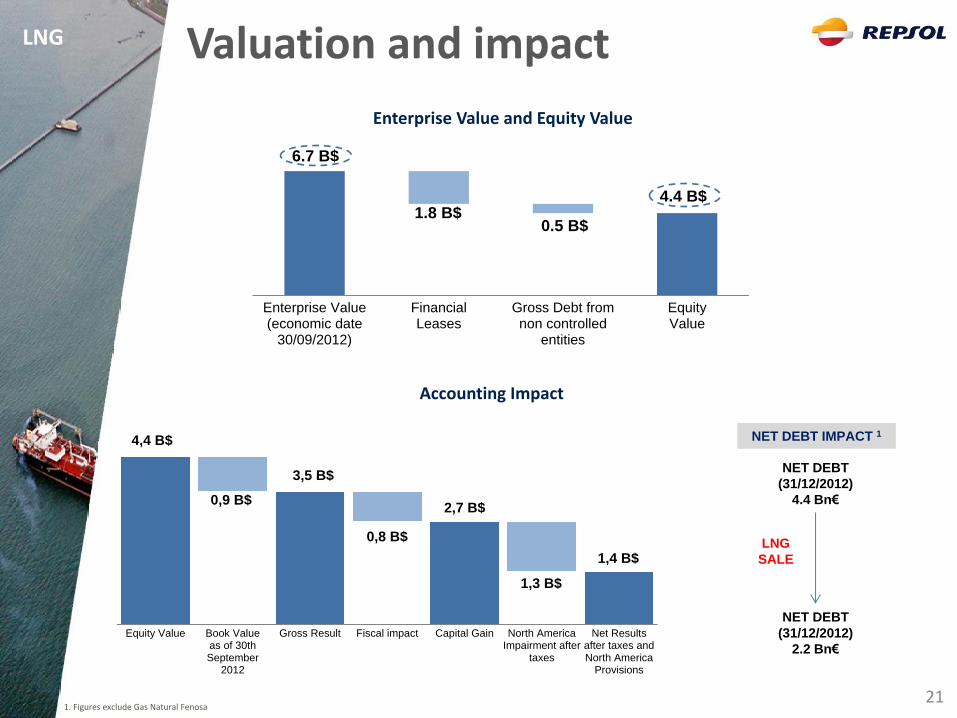
LNG Valuation and impact
6.7 B$
1.8 B$ 0.5 B$
4.4 B$
Enterprise Value(economic date
30/09/2012)
FinancialLeases
Gross Debt fromnon controlled
entities
EquityValue
4,4 B$
0,9 B$
3,5 B$
0,8 B$
2,7 B$
1,3 B$
1,4 B$
Equity Value Book Valueas of 30thSeptember
2012
Gross Result Fiscal impact Capital Gain North AmericaImpairment after
taxes
Net Resultsafter taxes andNorth America
Provisions
Accounting Impact
Enterprise Value and Equity Value
NET DEBT
(31/12/2012)
4.4 Bn€
NET DEBT
(31/12/2012)
2.2 Bn€
NET DEBT IMPACT 1
LNG
SALE
1. Figures exclude Gas Natural Fenosa 21
22
Downstream Our businesses strategy: 2012-2016
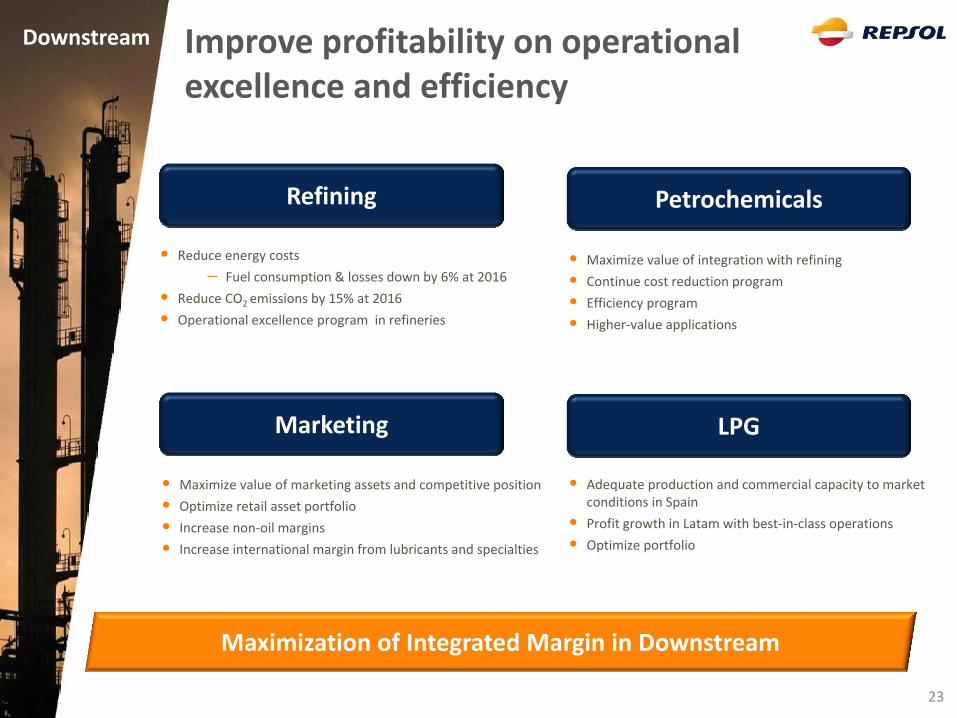
Improve profitability on operational excellence and efficiency
• Reduce energy costs
Fuel consumption & losses down by 6% at 2016
• Reduce CO2 emissions by 15% at 2016
• Operational excellence program in refineries
• Maximize value of integration with refining
• Continue cost reduction program
• Efficiency program
• Higher-value applications
• Maximize value of marketing assets and competitive position
• Optimize retail asset portfolio
• Increase non-oil margins
• Increase international margin from lubricants and specialties
• Adequate production and commercial capacity to market conditions in Spain
• Profit growth in Latam with best-in-class operations
• Optimize portfolio
Refining Petrochemicals
Marketing LPG
Maximization of Integrated Margin in Downstream
Downstream
23
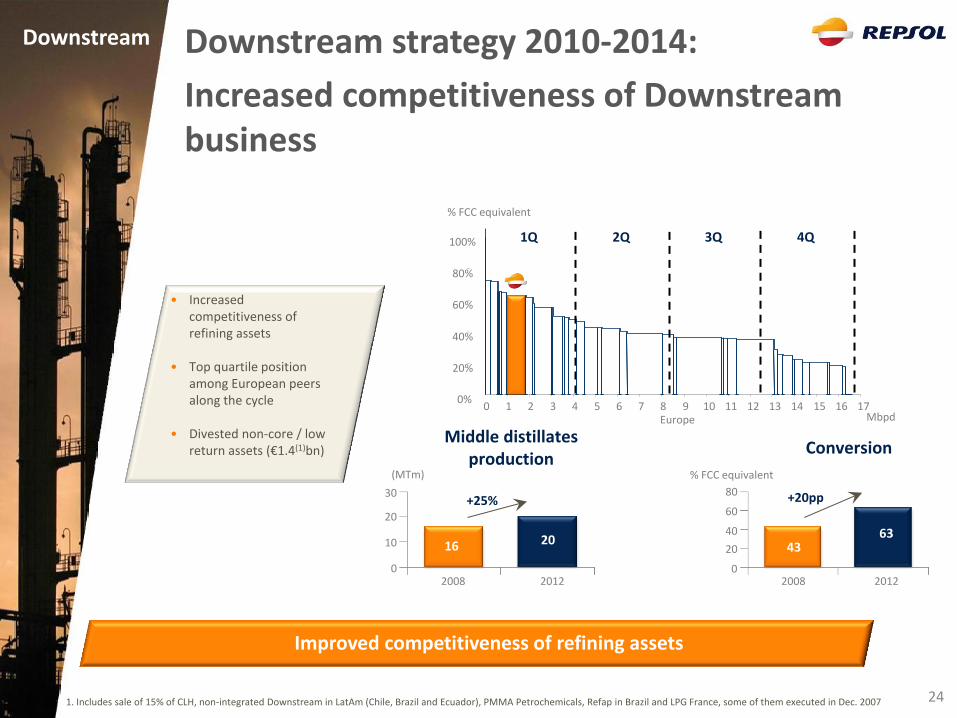
(MTm)
30
20
10
0 2012
20
2008
16
% FCC equivalent
80
60
40
20
0 2012
63
2008
43
Conversion Middle distillates
production
1. Includes sale of 15% of CLH, non-integrated Downstream in LatAm (Chile, Brazil and Ecuador), PMMA Petrochemicals, Refap in Brazil and LPG France, some of them executed in Dec. 2007
1Q 2Q 3Q 4Q
0%
20%
40%
60%
80%
100%
0 1 2 3 4 5 6 7 8 9 10 11 12 13 14 15 16 17 Mbpd
% FCC equivalent
Europe
+25% +20pp
• Increased competitiveness of refining assets
• Top quartile position among European peers along the cycle
• Divested non-core / low return assets (€1.4(1)bn)
Improved competitiveness of refining assets
Downstream strategy 2010-2014:
Increased competitiveness of Downstream business
Downstream
24
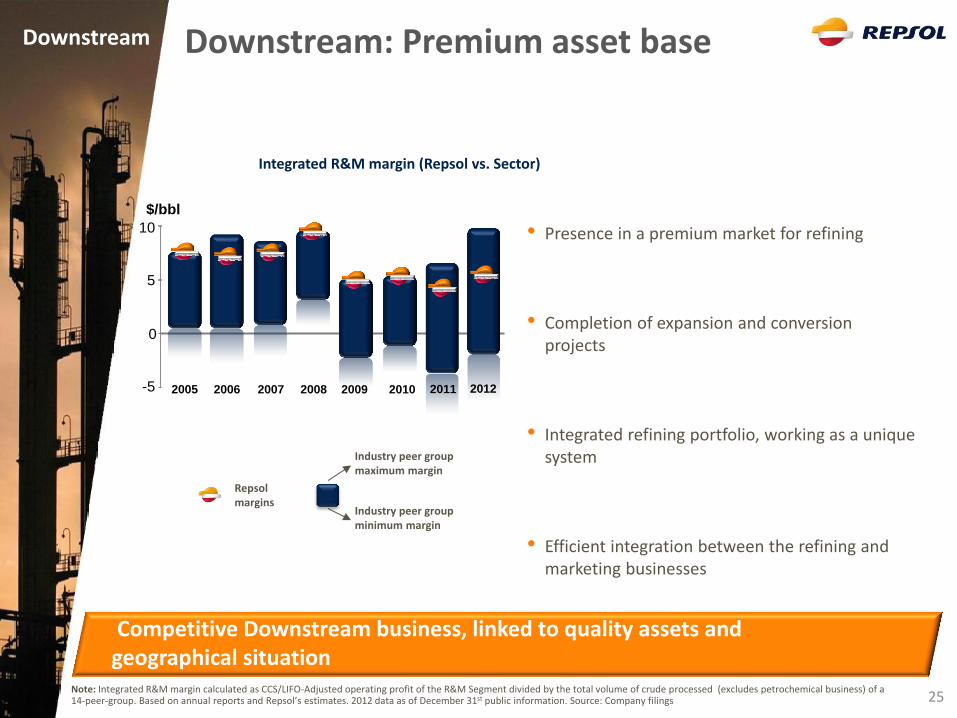
25
• Presence in a premium market for refining
• Completion of expansion and conversion projects
• Integrated refining portfolio, working as a unique
system
• Efficient integration between the refining and
marketing businesses
Note: Integrated R&M margin calculated as CCS/LIFO-Adjusted operating profit of the R&M Segment divided by the total volume of crude processed (excludes petrochemical business) of a 14-peer-group. Based on annual reports and Repsol’s estimates. 2012 data as of December 31st public information. Source: Company filings
Competitive Downstream business, linked to quality assets and geographical situation
Industry peer group maximum margin
Industry peer group minimum margin
Repsol margins
Integrated R&M margin (Repsol vs. Sector)
Downstream: Premium asset base
Downstream
2005
0
-5
5
10
2008
$/bbl
2009 2006 2007 2010 2011 2012
26
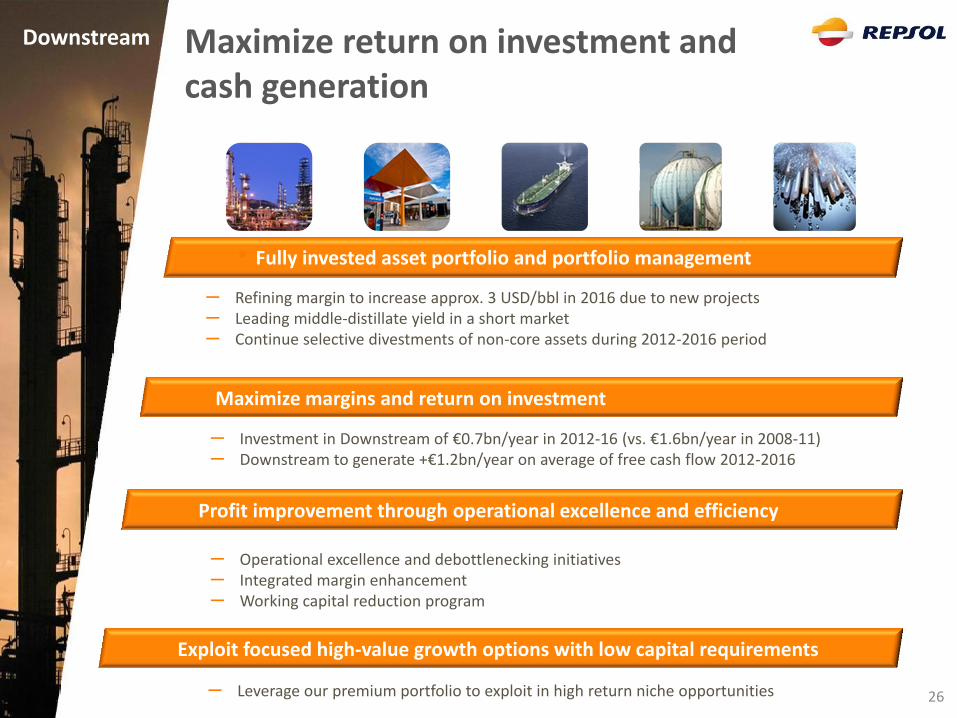
• Fully invested asset portfolio and portfolio management
Maximize margins and return on investment
Profit improvement through operational excellence and efficiency
Exploit focused high-value growth options with low capital requirements
– Refining margin to increase approx. 3 USD/bbl in 2016 due to new projects – Leading middle-distillate yield in a short market – Continue selective divestments of non-core assets during 2012-2016 period
– Leverage our premium portfolio to exploit in high return niche opportunities
– Operational excellence and debottlenecking initiatives – Integrated margin enhancement – Working capital reduction program
– Investment in Downstream of €0.7bn/year in 2012-16 (vs. €1.6bn/year in 2008-11) – Downstream to generate +€1.2bn/year on average of free cash flow 2012-2016
Maximize return on investment and cash generation
Downstream
27
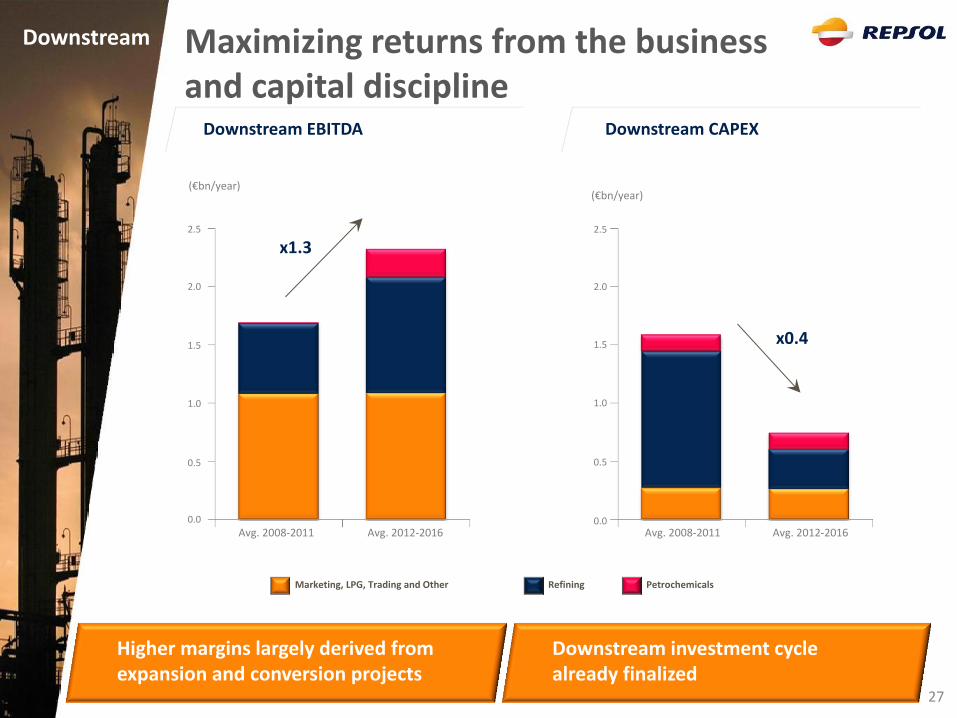
Maximizing returns from the business and capital discipline
(€bn/year)
2.5
2.0
1.5
0.0
1.0
0.5
Avg. 2012-2016 Avg. 2008-2011
(€bn/year)
2.5
2.0
1.5
0.0
1.0
0.5
x1.3
Avg. 2012-2016 Avg. 2008-2011
Marketing, LPG, Trading and Other Refining Petrochemicals
x0.4
Downstream EBITDA Downstream CAPEX
Higher margins largely derived from expansion and conversion projects
Downstream investment cycle already finalized
Downstream
Gas Natural Fenosa Our businesses strategy: 2012-2016
29
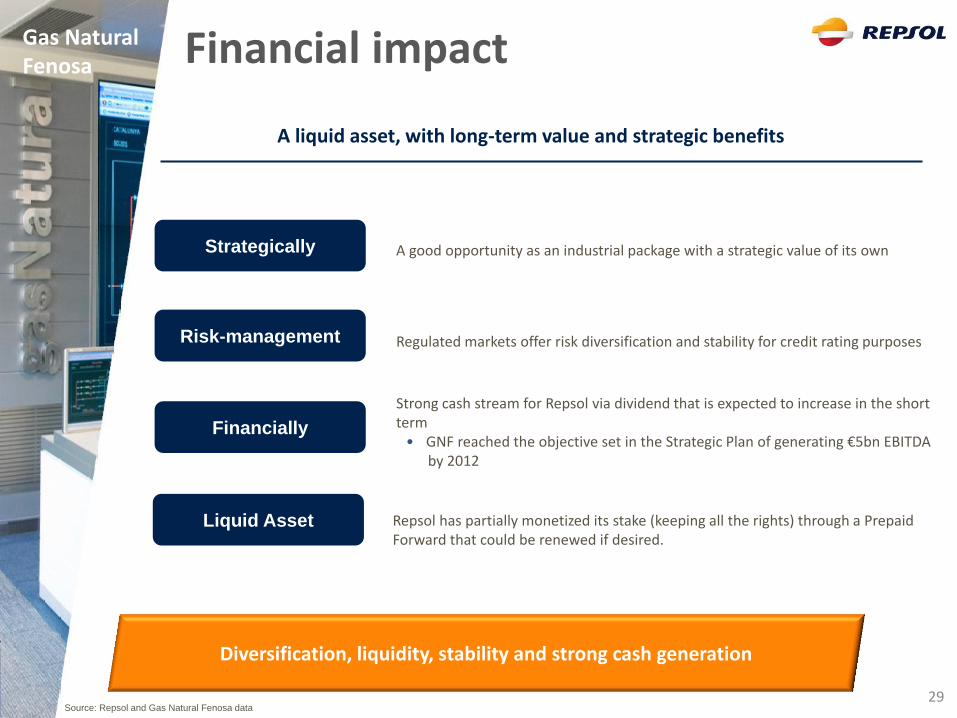
Financial impact
A liquid asset, with long-term value and strategic benefits
Diversification, liquidity, stability and strong cash generation
Source: Repsol and Gas Natural Fenosa data
Gas Natural Fenosa
Strategically
Financially
Risk-management
Liquid Asset
A good opportunity as an industrial package with a strategic value of its own
Strong cash stream for Repsol via dividend that is expected to increase in the short term
• GNF reached the objective set in the Strategic Plan of generating €5bn EBITDA by 2012
Regulated markets offer risk diversification and stability for credit rating purposes
Repsol has partially monetized its stake (keeping all the rights) through a Prepaid Forward that could be renewed if desired.
30
YPF Expropriation
31
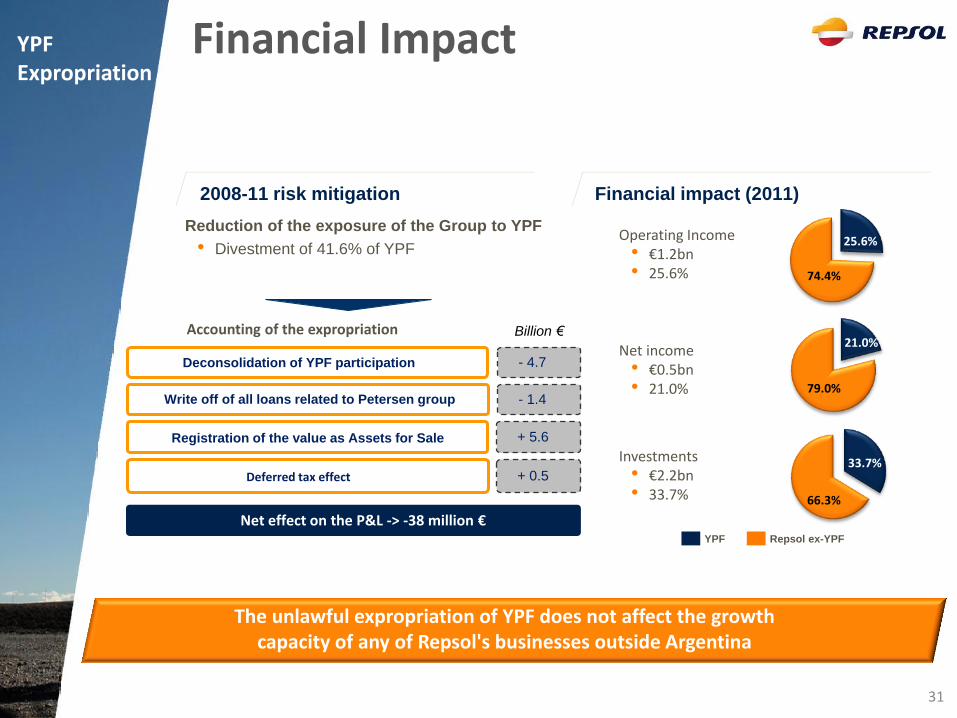
Financial impact (2011)
Operating Income • €1.2bn • 25.6%
Net income • €0.5bn • 21.0%
Investments • €2.2bn • 33.7%
25.6%
21.0%
33.7%
74.4%
79.0%
66.3%
YPF Repsol ex-YPF
2008-11 risk mitigation
Reduction of the exposure of the Group to YPF
• Divestment of 41.6% of YPF
Accounting of the expropriation
The unlawful expropriation of YPF does not affect the growth capacity of any of Repsol's businesses outside Argentina
Deconsolidation of YPF participation - 4.7
Billion €
Write off of all loans related to Petersen group - 1.4
Registration of the value as Assets for Sale + 5.6
Net effect on the P&L -> -38 million €
Deferred tax effect + 0.5
YPF Expropriation
Financial Impact
YPF Expropriation
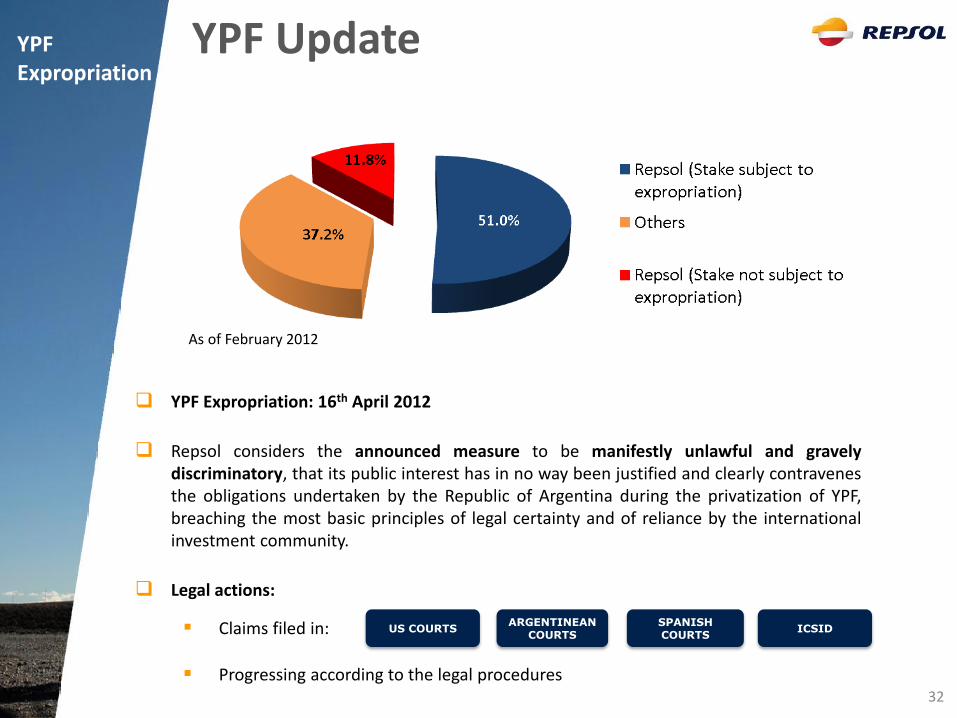
YPF Update
YPF Expropriation: 16th April 2012
Repsol considers the announced measure to be manifestly unlawful and gravely discriminatory, that its public interest has in no way been justified and clearly contravenes the obligations undertaken by the Republic of Argentina during the privatization of YPF, breaching the most basic principles of legal certainty and of reliance by the international investment community.
Legal actions:
Claims filed in:
Progressing according to the legal procedures
As of February 2012
US COURTS ARGENTINEAN
COURTS SPANISH COURTS
ICSID
32
Financial Outlook
34
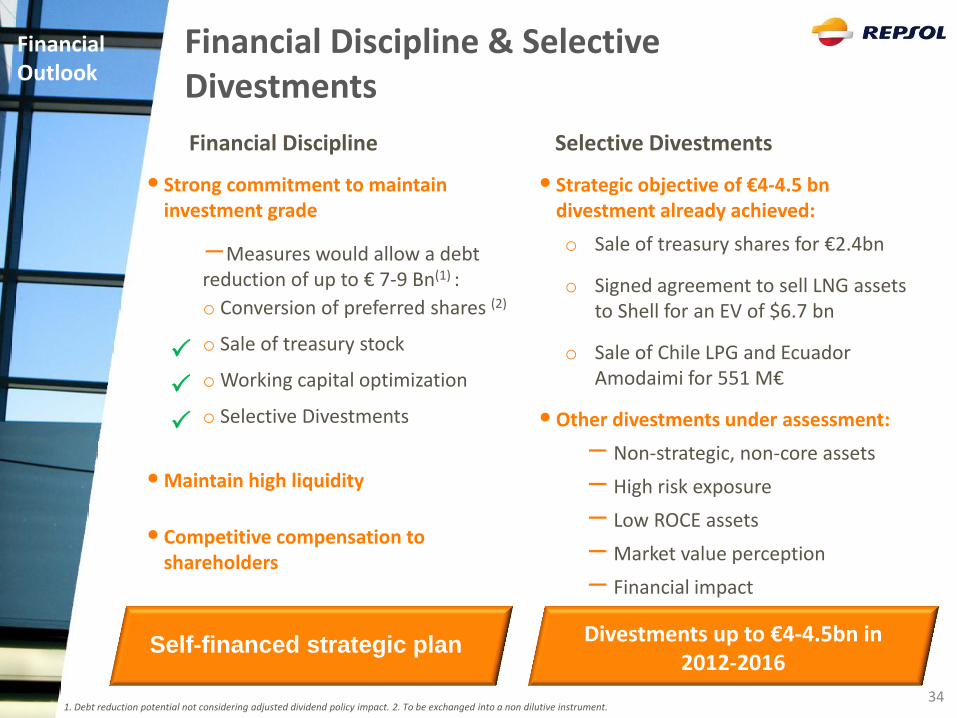
Financial Discipline & Selective Divestments
Financial Discipline
• Strategic objective of €4-4.5 bn divestment already achieved:
o Sale of treasury shares for €2.4bn
o Signed agreement to sell LNG assets to Shell for an EV of $6.7 bn
o Sale of Chile LPG and Ecuador Amodaimi for 551 M€
• Other divestments under assessment:
−Non-strategic, non-core assets
− High risk exposure
− Low ROCE assets
−Market value perception
− Financial impact
• Strong commitment to maintain investment grade
−Measures would allow a debt reduction of up to € 7-9 Bn(1) :
o Conversion of preferred shares (2)
o Sale of treasury stock
o Working capital optimization
o Selective Divestments
• Maintain high liquidity
• Competitive compensation to shareholders
Selective Divestments
Self-financed strategic plan Divestments up to €4-4.5bn in
2012-2016
1. Debt reduction potential not considering adjusted dividend policy impact. 2. To be exchanged into a non dilutive instrument.
Financial Outlook
35
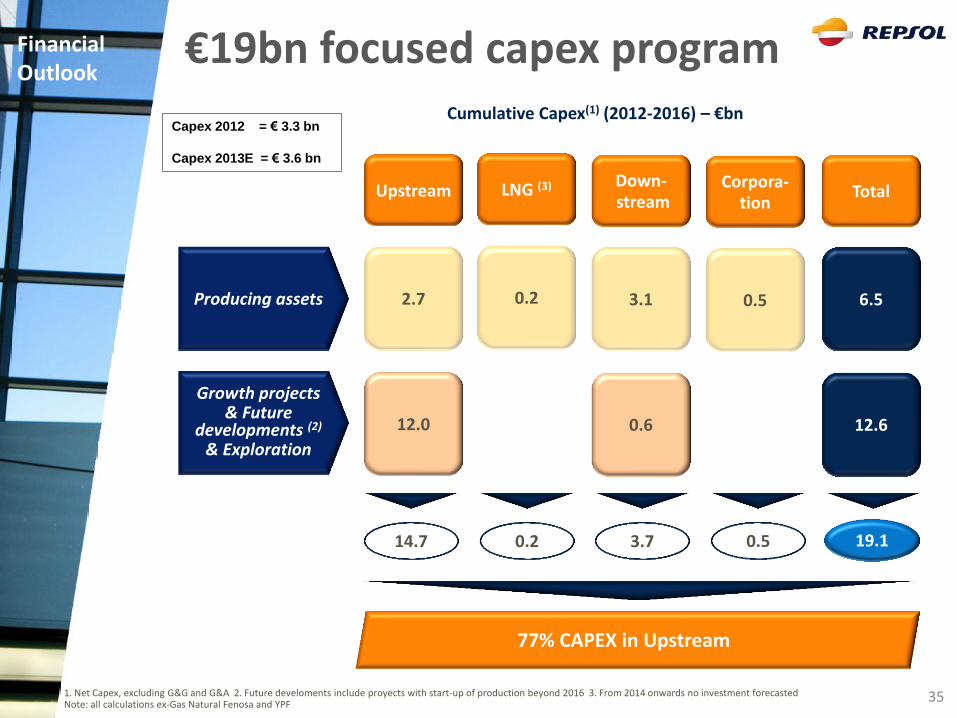
€19bn focused capex program Cumulative Capex(1) (2012-2016) – €bn
77% CAPEX in Upstream
14.7 0.5 3.7
Producing assets 2.7
Growth projects & Future
developments (2) & Exploration
12.0
Upstream
19.1 0.2
0.2
LNG (3)
3.1
0.6
Down- stream
0.5
Corpora- tion
6.5
12.6
Total
Financial Outlook
Capex 2012 = € 3.3 bn
Capex 2013E = € 3.6 bn
1. Net Capex, excluding G&G and G&A 2. Future develoments include proyects with start-up of production beyond 2016 3. From 2014 onwards no investment forecasted Note: all calculations ex-Gas Natural Fenosa and YPF
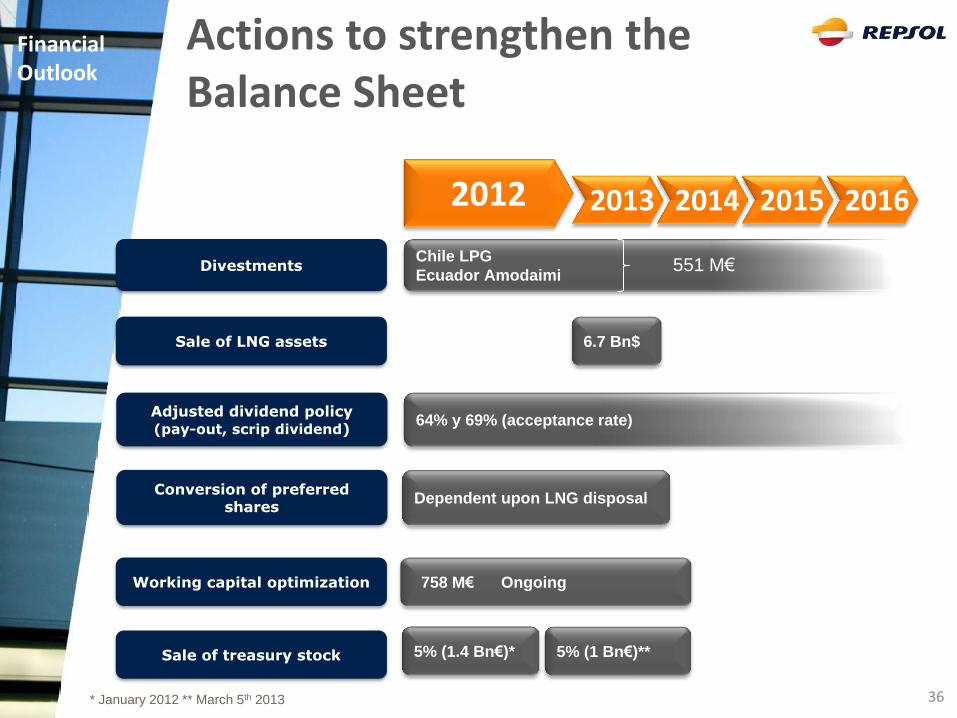
64% y 69% (acceptance rate)
Chile LPG
Ecuador Amodaimi
Dependent upon LNG disposal
758 M€ Ongoing
Sale of treasury stock
Working capital optimization
Adjusted dividend policy (pay-out, scrip dividend)
Divestments
Conversion of preferred shares
2012 2013 2014 2015 2016
551 M€
Sale of LNG assets 6.7 Bn$
5% (1.4 Bn€)* 5% (1 Bn€)**
* January 2012 ** March 5th 2013
Actions to strengthen the Balance Sheet
Financial Outlook
36
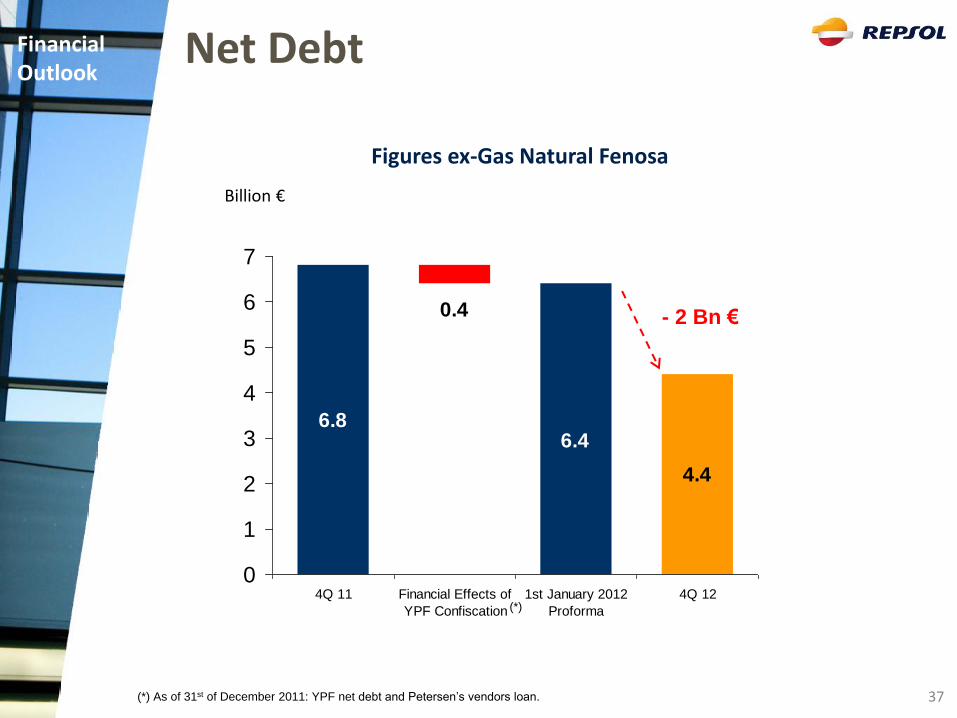
37
Billion €
4.4
6.86.4
0.4
0
1
2
3
4
5
6
7
4Q 11 Financial Effects of
YPF Confiscation
1st January 2012
Proforma
4Q 12
- 2 Bn €
(*)
(*) As of 31st of December 2011: YPF net debt and Petersen’s vendors loan.
Net Debt
Figures ex-Gas Natural Fenosa
Financial Outlook
38
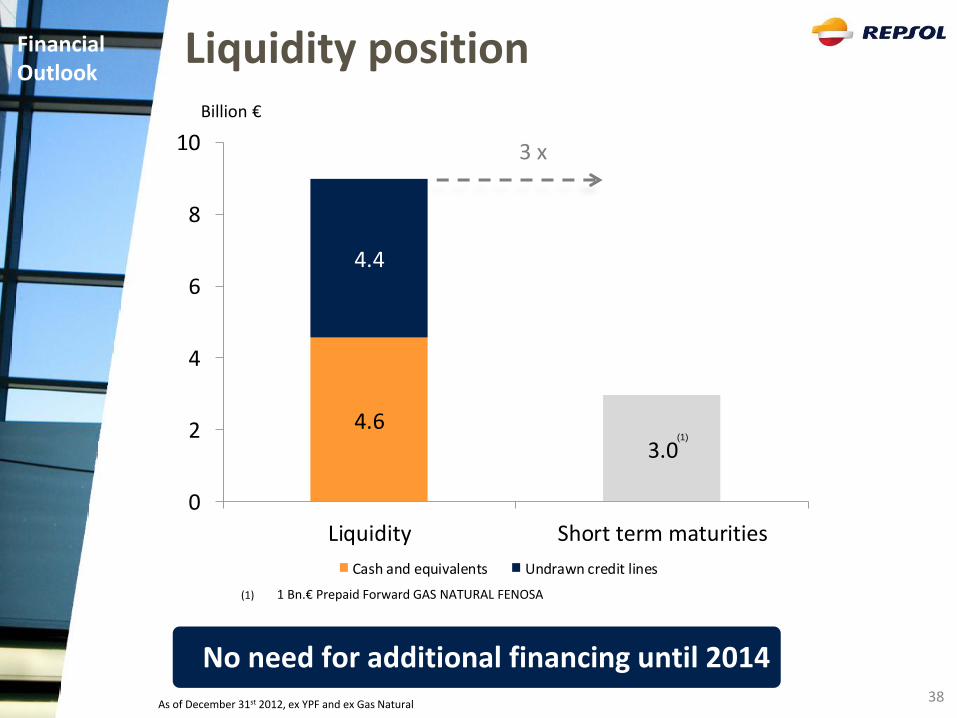
Liquidity position
As of December 31st 2012, ex YPF and ex Gas Natural
No need for additional financing until 2014
Financial Outlook
(1) 1 Bn.€ Prepaid Forward GAS NATURAL FENOSA
4.63.0
4.4
0
2
4
6
8
10
Liquidity Short term maturities
Cash and equivalents Undrawn credit lines
3 x
Billion €
(1)
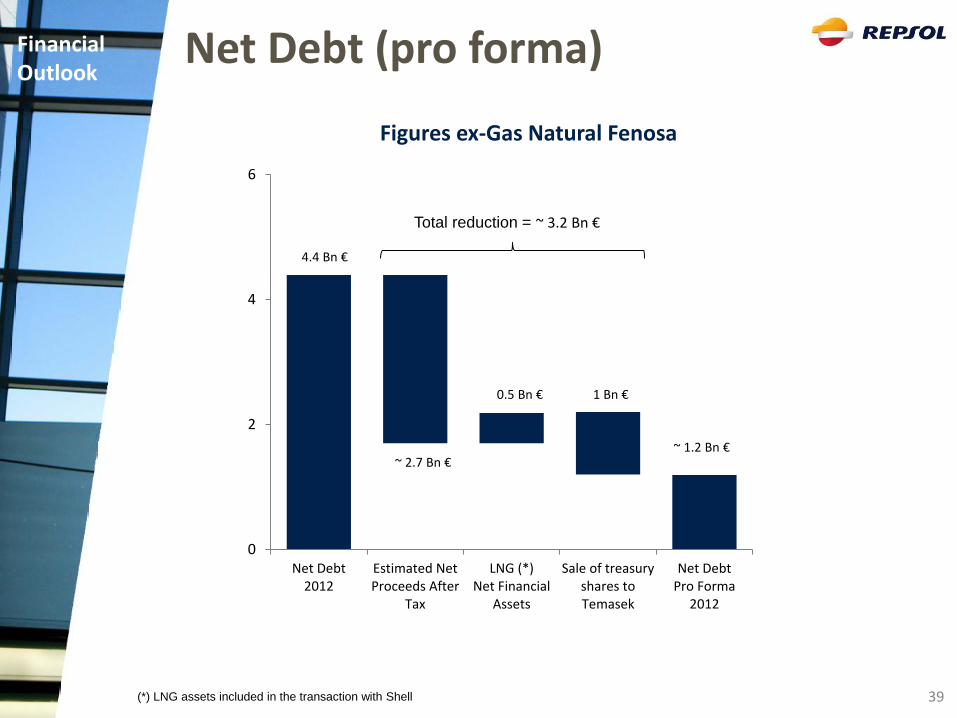
39 (*) LNG assets included in the transaction with Shell
Net Debt (pro forma)
0
2
4
6
Net Debt2012
Estimated NetProceeds After
Tax
LNG (*)Net Financial
Assets
Sale of treasuryshares toTemasek
Net DebtPro Forma
2012
4.4 Bn €
~ 2.7 Bn €
0.5 Bn €
~ 1.2 Bn €
1 Bn €
Total reduction = ~ 3.2 Bn €
Figures ex-Gas Natural Fenosa
Financial Outlook
Environmental, Social & Governance
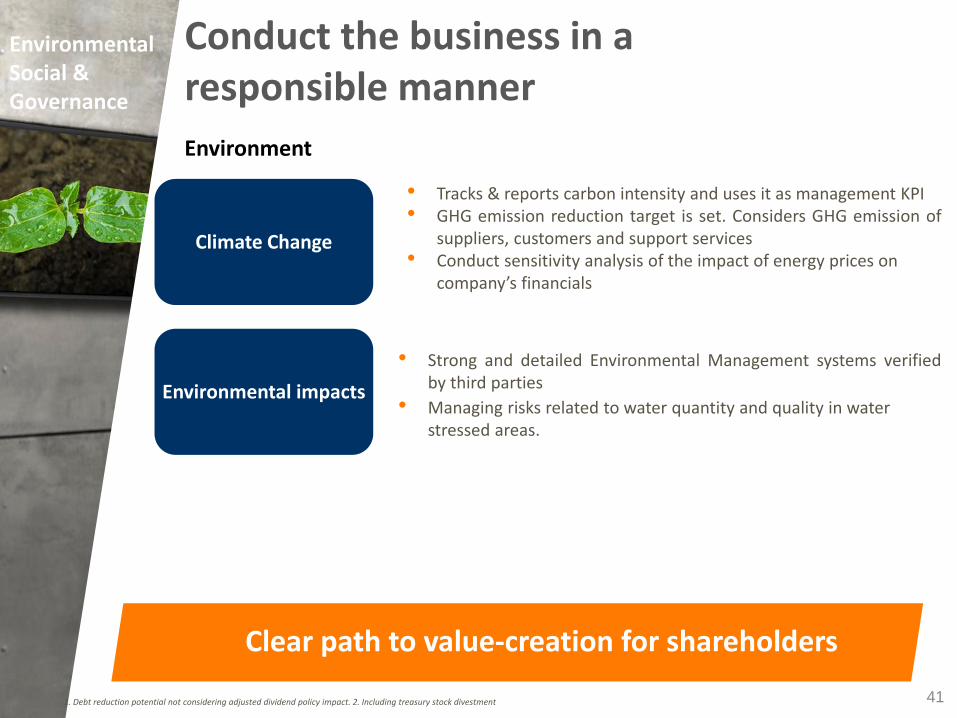
Conduct the business in a responsible manner
1. Debt reduction potential not considering adjusted dividend policy impact. 2. Including treasury stock divestment
Environmental Social & Governance
Climate Change
• Tracks & reports carbon intensity and uses it as management KPI • GHG emission reduction target is set. Considers GHG emission of
suppliers, customers and support services • Conduct sensitivity analysis of the impact of energy prices on
company’s financials
• Strong and detailed Environmental Management systems verified by third parties
• Managing risks related to water quantity and quality in water stressed areas.
Environmental impacts
Environment
Clear path to value-creation for shareholders
41
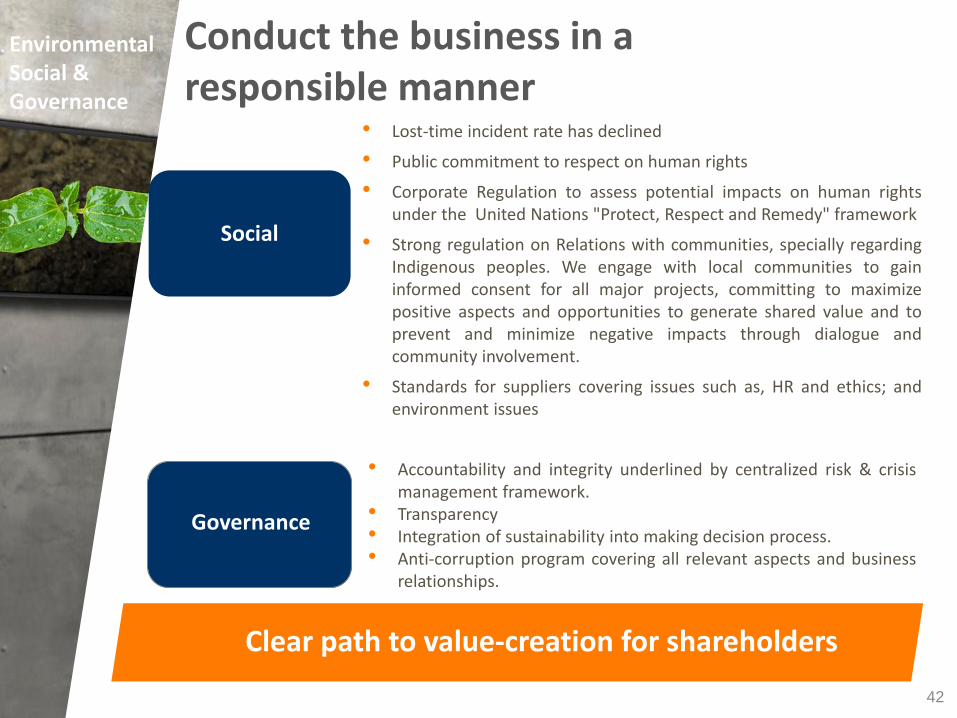
Conduct the business in a responsible manner
Clear path to value-creation for shareholders
Social
Governance
• Lost-time incident rate has declined
• Public commitment to respect on human rights
• Corporate Regulation to assess potential impacts on human rights under the United Nations "Protect, Respect and Remedy" framework
• Strong regulation on Relations with communities, specially regarding Indigenous peoples. We engage with local communities to gain informed consent for all major projects, committing to maximize positive aspects and opportunities to generate shared value and to prevent and minimize negative impacts through dialogue and community involvement.
• Standards for suppliers covering issues such as, HR and ethics; and environment issues
• Accountability and integrity underlined by centralized risk & crisis management framework.
• Transparency • Integration of sustainability into making decision process. • Anti-corruption program covering all relevant aspects and business
relationships.
Environmental Social & Governance
42
1. 2011 production adjusted for Libyan revolution. It considers 2010 Libya production (14.7Mboe) instead of Libya 2011 production (3.4Mboe) 2. Compound annual growth rate 3. Reserve Replacement Ratio. 4. Net Capex. excluding G&G and G&A 5. €1.36bn of treasury stocks already divested in 1Q 2012
77% CAPEX in Upstream
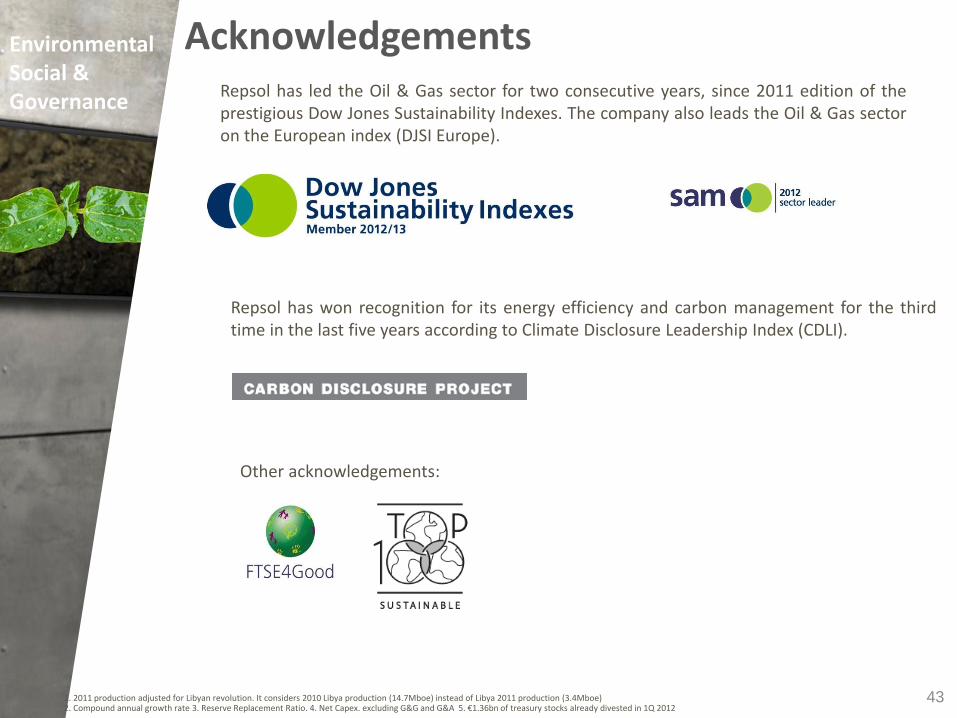
Acknowledgements Repsol has led the Oil & Gas sector for two consecutive years, since 2011 edition of the prestigious Dow Jones Sustainability Indexes. The company also leads the Oil & Gas sector on the European index (DJSI Europe).
Other acknowledgements:
Repsol has won recognition for its energy efficiency and carbon management for the third time in the last five years according to Climate Disclosure Leadership Index (CDLI).
Environmental Social & Governance
43
Summary
45
Summary
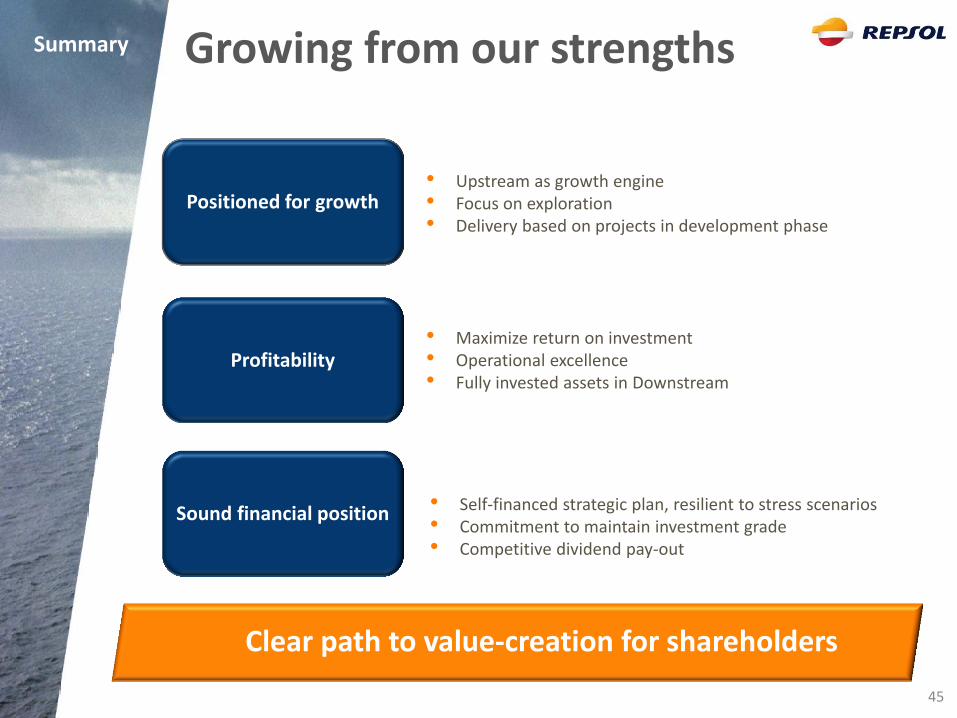
Growing from our strengths
• Upstream as growth engine • Focus on exploration • Delivery based on projects in development phase
• Maximize return on investment • Operational excellence • Fully invested assets in Downstream
• Self-financed strategic plan, resilient to stress scenarios • Commitment to maintain investment grade • Competitive dividend pay-out
Clear path to value-creation for shareholders
Profitability
Sound financial position
Positioned for growth
Investor’s update
Growing from our strengths
Strategic Plan
2012-2016
April 2013