Embed Size (px)
Citation preview
Greenhouse Gas Mitigation Through Energy Crops in the U.S.
With Implications for Asian-Pacific Countries
Uwe A. Schneider
Research Associate
Department of Economics
Center for Rural and Agricultural Development
Iowa State University
Bruce A. McCarl
Professor
Department of Agricultural Economics
Texas A&M University
Seniority of authorship is shared
November 2001

Greenhouse Gas Mitigation Through Energy Crops in the U.S.
With Implications for Asian-Pacific Countries
Demand for agricultural participation in greenhouse gas (GHG) emission
mitigation efforts has increased in recent years. While the original text of the Kyoto
Protocol only considered carbon changes from deforestation, reforestation, and
afforestation, subsequent efforts were made to determine agriculture's contribution in a
broader spectrum (Intergovernmental Panel of Climate Change meetings in Buenos
Aires, Bonn). Discussion has now focused on how to involve agriculture rather than if to
involve agriculture.
Planting energy crops is one of many agricultural options under consideration.
Crops such as switchgrass, short rotation woody trees, eucalyptus, and a variety of
ethanol generating plants can generate alternative biomass based energy and thus reduce
the amount of fossil fuel based, GHG emission intensive energy. While other agricultural
GHG mitigation options such as switching tillage systems or planting permanent trees
saturate over time, GHG emission offsets from energy crops can be supplied
continuously. Furthermore, emission offsets from energy crops are generally easier to
implement than other agricultural emission abatement strategies. For example, if a
carbon market or a government institution prices one ton of carbon emissions to be worth
$50, all fossil fuel input going into energy crop production will most likely carry this
price through increased purchasing cost and all energy output will receive revenue based
on the amount of fossil fuel energy offset. The net effect to the energy producer is the
difference between increased revenue and increased cost.
1
Substantial research has been conducted in the U.S. and Canada on energy crops
(Walsh et al., Mann and Spath, Wang, Saricks, and Santini, Samson and Duxbury).
These studies, however did not account for tradeoffs between the production of energy
crops and other agricultural mitigation strategies. This analysis estimates the economic
feasibility of energy crops in the U.S. in an environment where all major agricultural
mitigation strategies are incorporated simultaneously.
Greenhouse gas emissions constitute a global problem, which is not limited to the
U.S. but also involves countries in Asian Pacific. In contrast to the U.S. and Canada
however, research on energy crops has been very limited in many Asian-Pacific
countries. Here, the authors try to extrapolate results from the U.S. model to these
countries. To reflect Asian Pacific characteristics, a sensitivity analysis is conducted on
key parameters of the U.S. model, which might differ between the U.S. and Asian Pacific
countries.
Background
Energy crops have been explored in the U.S. since 1978 (U.S. DOE, 2001) about
20 years before the Kyoto Protocol was established. Major initial objectives involved
reducing the dependency on foreign petroleum reserves and providing cleanly burning
fuels. The potential to mitigate emissions of clean gases such as carbon dioxide was not
emphasized until the 1990s when countries started to seriously negotiate greenhouse gas
emission reduction programs.
Almost all energy crops produced in the U.S. today are still subsidized. Ethanol
suppliers receive, on average, a $0.54 per gallon subsidy, which is even greater than the
1998/1999 wholesale price of gasoline of $0.46 per gallon (Yacobucci and Womach).
2

Governmental incentives to promote biomass power include project co-funding; various
tax credits, deductions and exemptions, as well as direct subsidy payments (Badin and
Kirschner).
Greenhouse gas emission mitigation efforts could improve the economics of
energy crop production. If a market or governmental institution values carbon emission
savings, energy crops would yield additional revenues equal to carbon price times net
emission savings relative to an energy equivalent amount of fossil fuel. The question
then becomes what carbon price level is needed to make energy crops economically
feasible? In answering this question one must analyze both energy crop possibilities and
traditional agricultural production (Schneider) because:
1) Large-scale production of energy crops would substantially reduce the
amount of land devoted to traditional food and fiber crops. As a
consequence, aggregate food and fiber production would most likely fall,
causing commodity prices and land values to rise. The increased opportunity
cost as reflected by higher land values may cause a strong negative feedback
to large-scale efforts on promotion of energy crops.
2) General mitigation incentives will encourage a variety of agricultural
strategies. McCarl and Schneider (1999 and 2000) grouped agricultural GHG
mitigation options into three broad categories: a) reductions in agricultural
based emissions for example through diminished use of fossil fuels, fossil
fuel intensive inputs, or livestock herd size reductions; b) enlargements of
agricultural based sinks for example through afforestation or tillage changes,
3

and c) increased production of commodities such as energy crops which
offset emissions in other sectors of the economy.
Some agriculture mitigation strategies are mutually exclusive, some are
complementary, and most interfere with traditional agricultural production. Hence, an
independent analysis of a large-scale production of energy crops would most likely
overestimate the economic potential.
The U.S. Agricultural Sector Model
For this analysis we used a new version of the U.S. Agricultural Sector Model
(ASM, McCarl et al.). ASM was first developed in the mid-1970s and has been used in
many economic appraisals regarding environmental policies in the U.S. (see Chang et al.
for references). Schneider modified ASM to include GHG emission accounting and
mitigation possibilities. This GHG augmented version is employed for this analysis and
will hereafter be referred to as ASMGHG.
Scope of ASMGHG
ASMGHG depicts production in 63 U.S. agricultural sub-regions endogenizing
crop choice, irrigation choice, livestock numbers, and livestock management.
Commodity coverage is broad with more than 30 commodities considered including the
major U.S. feed and food grains, oilseeds, fiber, hay, silage, sweetener, cattle, sheep,
poultry, dairy and hog commodities. Production of eight major internationally traded
commodities in 28 rest-of-the-world regions is included with detailed international trade
depiction for those commodities. Trade and consumption of more than 50 other
commodities are modeled at a more aggregate level. Production is gathered together into
4

ten U.S. marketing regions and in turn shipped on to processing, consumption, or
international markets.
ASMGHG solutions provide projections of land use and commodity production
within the 63 U.S. areas, commodity production in the rest of the world, international
trade, crop and livestock commodity prices, processed commodity prices, agricultural
commodity consumption, producer income effects, consumer welfare effects, and various
environmental impacts.
Greenhouse Gas Features in ASMGHG
ASMGHG jointly incorporates all major GHG emission mitigation options
available to agriculture (McCarl and Schneider, 2001). For this study we considered only
potential strategies, which are currently feasible. There are other strategies, which may
become practical in the near future as technology advances. However, we did not want to
speculate as to when this might happen. Engineers are often overly optimistic about new
technologies not taking into account economics. Currently included strategies are listed
below. Schneider provides a detailed technical description of how these strategies are
implemented in ASMGHG.
ASMGHG mitigation strategies through the agricultural sector:
Afforestation,
Production of energy crops for use in electrical power plants,
Production of ethanol to replace fossil fuel based gasoline,
Soil carbon sequestration through crop, tillage, irrigation, and fertilization
choice or through conversion of arable land into permanent grassland,
5

Reduction in crop management emissions through alternative crop mix,
fertilizer, irrigation, tillage intensities,
Methane reductions through livestock herd size reduction, livestock,
manure system improvements, enteric fermentation changes, and rice
acreage reduction, and
Reduction in nitrous oxide emissions from livestock herd size reductions,
and alternative fertilization, crop and tillage choice.
Each individual emission and emission reduction category is individually
accounted for but also aggregated into a measure of total carbon equivalents. To place
different gases on an equal footing, methane and nitrous oxide are converted to carbon
equivalents based on the IPCC 100-year global warming potentials (GWP), which are 21
for methane, 310 for nitrous oxide, and 44/12 for carbon.
ASMGHG can examine the impact of various mitigation policies on the
agricultural sector. At each incentive level, it identifies the optimal choice of mitigation
strategy. In addition, impacts on the traditional agricultural sector are reported.
Economic Feasibility of Energy Crops in the United States
Competitive feasibility of major GHG emission mitigation strategies was
simulated by running ASMGHG under a wide range of carbon equivalent prices imposed
on net emissions from agriculture. For emissions of non-carbon GHGs, prices were
adjusted based on the GWP of the affected GHG relative to carbon. In addition, carbon
credits from soil carbon sequestration and afforestation were value-discounted to reflect
the saturating nature of these carbon sinks. McCarl and Murray provide a detailed
description along with examination of many alternative setups. We chose an average
6

setup leading to a 25 percent value discount for sequestered tree carbon and a 50 percent
value discount for sequestered soil carbon (Schneider and McCarl). Thus, at a
hypothetical carbon price of $20 per TCE, land owners would receive $20 for each ton of
offset carbon emissions, $10 for each ton of sequestered soil carbon, and $15 for each ton
of carbon sequestered through afforestation and they would pay each ton emitted with
$20 for carbon, $114.55 for methane, and $1690.91 for nitrous oxide.
Major Impacts of Agricultural GHG Emission Mitigation Incentives
Figure 1 displays the resultant levels of emission abatement from agricultural
mitigation strategies (see also Table 1). Unsubsidized energy crops as identified by
current technologies are not competitive at zero carbon prices. Economic feasibility of
biofuel crops begins at carbon prices around $40 per ton of carbon equivalent.
Furthermore, energy crops used as electrical power plant feedstock are more competitive
than crops processed into gasoline substitutes such as ethanol.
Under low carbon prices, agricultural management changes, i.e. tillage changes,
are the preferred option. Above carbon incentives of $70 per ton of carbon equivalent,
emission offsets from bioelectricity generating crops dominate all agricultural mitigation
strategies. For prices above $250 per TCE, the afforestation share increases partially at
the expense of bioelectricity generation. For extremely high carbon prices the model
favors mitigation options with the highest carbon saving potential per acre, outweighing
high operation and implementation costs of these strategies. However, the highest carbon
net emission reduction may involve different strategies in different regions.
The results (Table 1) also show that large-scale agricultural mitigation efforts
divert farmland, reduce traditional crop and livestock production and exports, increase
7

prices, and changes agricultural welfare distribution with producers likely to gain and
consumers likely to loose. In addition, GHG mitigation efforts have a mostly positive
impact on other environmental externalities related to agriculture such as erosion and
water pollution.
Economic versus Technical Potential
An important concept when regarding biofuel production involves potential to
mitigate GHG emissions. Physical scientists often quote very large estimates of potential
but these estimates typically neglect the cost of achieving that potential. We used
ASMGHG under three settings to derive alternative measures of potential. The first
represents technical potential, the second economic potential when considering biofuels
as the only mitigation option, and the third competitive economic potential when
considering all mitigation options simultaneously.
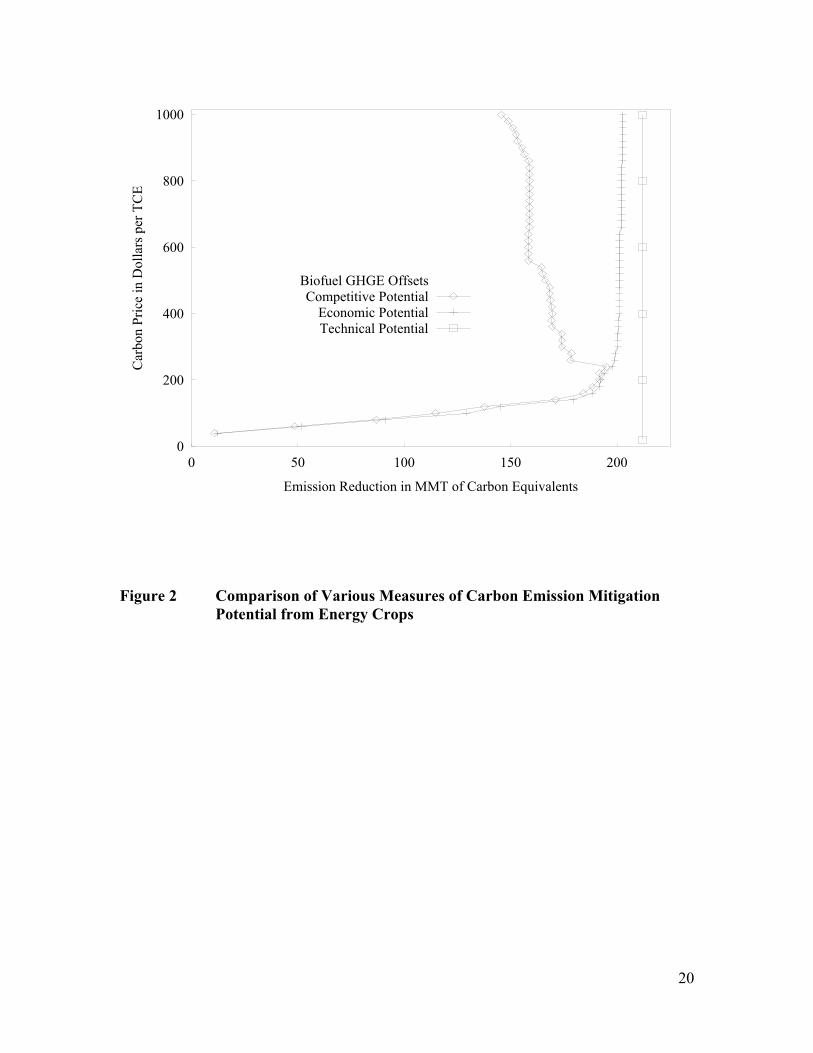
The technical potential estimate was obtained by changing ASMGHG's objective
function from maximizing total economic surplus to maximizing bioelectricity based
emission offsets thereby disregarding economics. This yields substantial emission offsets
in the amount of 212 MMTCE annually (Figure 2). The single strategy economic
potential takes into account all cost of bioelectricity generation except for the opportunity
cost related to other possible agricultural mitigation strategies. Under such setting, a
relatively high carbon price of $100 per TCE would only achieve 129 MMTCE emission
reduction or 61 percent of the technical potential. Finally, all agricultural mitigation
options were incorporated to find the competitive economic potential. This method
yields fewest emission offsets because implementation of other mitigation strategies
limits the extent to which biofuel crops can be grown. At $100 per TCE, biofuels would
8

reduce carbon emissions by 115 MMTCE, about 54 percent of biofuels' technical
potential.
The gap in the results between single strategy and competitive economic potential
is reflective of inter-strategy competition and relative advantage. Some strategies are
superior in some price ranges. The differences between the two economic measures of
potential are most notable for high carbon prices (Figure 2).
Sensitivity Analysis on Key Parameters of the U.S. Model
Agriculture in the U.S. is certainly very different from agriculture in Asian-
Pacific countries. Differences exist with respect to soil, climate, culture-based
preferences, per capita land availability, technology, and international market competition
(FAO). To illustrate these differences we conducted a sensitivity analysis on a few
decisive model parameters of the U.S. agricultural sector model.
Biomass Yield
The competitiveness of energy crops depends on many technological parameters.
We chose to examine alternative energy crop yields, ranging from 50 to 200 percent of
current U.S. yield estimates. Asian pacific biomass producers in moist tropical regions
may benefit from generally higher plant productivity compared to the U.S. but could also
experience lower productivity due to production conditions and altered input mixes.
Duke, for example, reports U.S. comparable or higher biomass yields in Asian-Pacific
countries for eucalyptus and guineagrass (hamilgrass).
Results show a strong impact of energy crop yields on supply of emission offsets
(Figure 3). In most cases, increased (decreased) yields lead to more than proportional
9

increases (decreases) in biomass emission offsets. For example, at a carbon price of $100
per TCE, energy crops offset about 115 MMTCE per year. A 50 percent yield increase
leads to a 145 percent increase in emission offsets. In interpreting Figure 3 one should
keep in mind that all yield increases were implemented without changing crop input
parameters. If higher yields were based on higher input use the effects would be less
significant.
The results from yield scenarios are not limited to crop yield differences. They
can be applied to all technological improvement from farming to generation of bio-
energy which increase the emission input / energy output ratio.
Energy Price
There are two sources of revenues for producers of energy crops: a) revenue from
selling energy, i.e. electricity and b) potential revenue from carbon emission offsets
associated with biomass energy. The potential carbon revenue could be a governmental
subsidy or an emissions market based income source. If the country is a major energy
importer, then its electricity price is determined by the international energy market price.
Many Asian Pacific countries, i.e., Japan, South Korea, the Philippines, Taiwan, and
Thailand import substantial amounts of energy (U.S. DOE). Because currency values
differ between countries, the international market price may cause different incentives to
grow biomass. For example, agricultural producers in energy importing countries with a
relatively low domestic currency value would earn a higher relative revenue from selling
electricity than would U.S. biomass producers. Similarly, revenues would be low if
conventional energy is cheap (energy exporting countries or countries with high currency
10

value). In this study we examined alternative prices for conventional electricity ranging
from 50 to 200 percent of the current U.S. market price.
The effect of energy price changes on the amount of bioelectricity emission
offsets is depicted in Figure 4. Note that a 100 percent energy price increase results in
much less additional emission offsets than does a 100 percent yield increase. This occurs
because selling electricity is only one profit source besides revenues from supplying
carbon offsets. If, for example, selling electricity contributes 25 percent to total profits,
then a 20 percent energy price increase results only in a 5 percent total profit gain1. As
the carbon price increases, the electricity revenue becomes relatively less important and
energy price changes have less effect on the amount of emission offsets supplied. For
example, a doubling of the energy price increases carbon offsets by 54 percent at $100
per TCE but only by 6 percent at $150 per TCE (Figure 4).
The results on energy price sensitivity are useful beyond extrapolation of U.S.
results to foreign countries. They indicate how energy crop's competitiveness changes as
fossil fuel prices fluctuate in general. If the recent trend of increased fossil fuel prices
continues, energy crop farming may soon be on the rise in the U.S. Furthermore, the
results also indicate how higher or lower costs of energy crop strategies would affect their
1 Suppose p=e+c, where p represents total profit, e represents energy revenue and c represents carbon
offset revenue. Suppose further that the ratio of carbon revenue to energy revenue is known, i.e. c/e=r.
Substitution yields the following identity: p=e+er=(1+r)e. If the energy revenue is increased by a factor f,
the new profit (np) can be calculated as np=te+c=te+er= (t+r)e. Thus, np/p=(t+r)/(1+r). Setting r=3, a 20
percent energy revenue increase (t=2) implies a total profit increase of 5 percent.
11

competitiveness because higher energy prices are equivalent to lower production and
processing costs.
Demand Elasticities
Energy crop production on agricultural land takes away land from traditional
agricultural operations. As discussed above, traditional agricultural food and fiber
production will decrease raising prices. The extent to which prices increase may depend
on the elasticity of demand for traditional agricultural commodities. ASMGHG explicitly
defines demand curves for 48 primary agricultural products and more than 50 processed
products. Each demand curve is specified as constant elasticity function. To assess the
effect of higher or lower elasticities we increased and decreased demand elasticities
across all primary agricultural products by a constant fraction ranging from 50 to 200
percent.
As Figure 5 shows, modifications of ASMGHG's demand elasticities have almost
no impact on the amount of emission offsets supplied from energy crops. Similar results
were obtained when altering export and import elasticities for traded agricultural
commodities. Note that elasticities were equally modified across all commodities. In
reality, elasticities in foreign countries may be higher or lower depending on the
commodity in question.
Land Availability
The U.S. has a relatively large agricultural land base relative to its population
(FAO). Taking food and fiber cropland away for the production of energy crops may
thus be cheaper in the U.S. but more expensive in densely populated countries, which
12

heavily depend on domestic food production. To illustrate such differences we modified
the available agricultural land base in the U.S. between 50 to 200 percent of its original
value.
Figure 6 shows supply of bioelectricity emission offsets for different assumptions
about the amount of available agricultural land. Not surprisingly, we find energy crops to
be very sensitive to land availability. If the U.S. agricultural land base were cut in half,
energy crops would not become profitable below carbon prices of $200 per TCE (Figure
6). Less land implies less production, higher commodity prices, and thus higher revenues
in the traditional agricultural sector. Consequently, farmers have to give up more by
growing energy crops. Limited availability of agricultural land may be a major obstacle
to grow energy crops in the Asian-Pacific area.
Conclusions
Energy crops supply fossil fuel alternatives and thereby have the potential to
reduce greenhouse gas emissions. Economic feasibility implies that the energy output
has to be greater than the energy input; otherwise growers could –in absence of
subsidies– not yield a profit. The attractiveness of energy crops relative to fossil fuels
depends on the overall net emission balance and the value of carbon offsets. In addition,
growing energy crops must be economically superior to other possible GHG mitigation
strategies.
Assessments of energy crops in the U.S. agricultural sector show that biomass
based electricity (based on switchgrass or short rotation woody crops), while expensive,
has considerable potential to offset carbon emissions. Emission offsets range between 1
to 2 metric tons per acre and year. However, a financial support of at least $40 per ton
13

carbon equivalent (about $20 per dry ton) is needed to make them economically feasible.
Paying less than $40 per ton of carbon offset induces other agricultural mitigation
options, i.e. changes in tillage or afforestation. Ethanol generating energy crops turned
out to be an inferior strategy over the whole range of analyzed carbon prices.
We also tried to generalize U.S. results through a sensitivity analysis on key
parameters and to infer to Asian-Pacific countries. Results indicate that implementation
of energy crops in the U.S. is highly sensitive to yields and land availability, sensitive to
the price of energy under low and medium carbon prices, but relatively insensitive to
demand elasticities of traditional agricultural commodities. With exception of Australia,
and Russia, most of the Asian-Pacific countries have far less arable land per capita than
has the U.S. (FAO). Allocation of currently cultivated land to energy crops in those
countries would imply less land available to produce food. Shortages in domestic food
supply, however, could only be offset through increased food imports. Thus, energy
crops in most Asian-Pacific countries may not be economically feasible unless food
imports are cheaper than energy imports.
14

Bibliography
Badin, J. and J. Kirschner. "Biomass Greens U.S. Power Production." Renewable Energy
World 1,3(November 1998):40-45.
Chang, C.C., B.A. McCarl, J.W. Mjelde, and J.W. Richardson. "Sectoral Implications of
Farm Program Modifications." American Journal of Agricultural Economics.
74(1992):38-49.
Duke, J.A. "Handbook of Energy Crops.", unpublished, [Online]. Available at
http://www.hort.purdue.edu/newcrop/duke_energy/dukeindex.html, 1983.
FAO (Food and Agriculture Organization of the United Nations). FAOSTAT Statistics
Database, [Online]. Available at http://apps.fao.org., 2000.
IPCC. Land Use, Land-use Change, and Forestry. Special Report of the
Intergovernmental Panel on Climate Change, Geneva Switzerland, Robert T.
Watson, Ian R. Noble, Bert Bolin, N. H. Ravindranath, David J. Verardo and
David J. Dokken (Eds.) Cambridge University Press, UK. pp 375, 2000.
Mann, M.K. and P.L. Spath. Life Cycle Assessment of a Biomass Gasification Combined-
Cycle Power System. National Renewable Energy Laboratory, Golden, CO, TP-
430-23076. (1997).
McCarl, B.A., C.C. Chang, J.D. Atwood, and W.I. Nayda, ‘Documentation of ASM: The
U.S. Agricultural Sector Model.’ Unpublished Report, Texas A&M University,
[Online]. Available at http://ageco.tamu.edu/faculty/mccarl/asm.htm, 2001.
15
McCarl, B.A. and B.C. Murray. "Harvesting the Greenhouse: Comparing Biological
Sequestration with Emissions Offsets", Department of Agricultural Economics,
Texas A&M University, College Station, TX, 2001, [Online]. Available HTTP:
ageco.tamu.edu/faculty/mccarl/papers/885.pdf.
McCarl, B.A. and U.A. Schneider. "Curbing Greenhouse Gases: Agriculture's Role."
Choices, First Quarter 1999:9-12.
McCarl, B.A. and U.A. Schneider. "U.S. Agriculture's Role in a Greenhouse Gas
Mitigation World: An Economic Perspective." Review of Agricultural Economics
22, No.1(2000):134-159.
McCarl, B.A. and U.A. Schneider. "The Cost of Greenhouse Gas Mitigation in U.S.
Agriculture and Forestry." Forthcoming in Science (2001).
Samson, R. and P. Duxbury. "Assessment of Pelletized Biofuels.", Resource Efficient
Agricultural Production – Canada, Quebec, [Online]. Available HTTP:
www.reap.ca/Reports/pelletaug2000.html, April 2000.
Schneider, U.A. Agricultural Sector Analysis on Greenhouse Gas Emission Mitigation in
the U.S., PhD Dissertation, Department of Agricultural Economics, Texas A&M
University, December 2000.
Schneider, U.A. and B.A. McCarl. "Economic Potential of Biomass Based Fuels for
Greenhouse Gas Emission Mitigation." Forthcoming in Special Issue of
Environmental and Resource Economics.
United Nations, Framework Convention on Climate Change. Kyoto Protocol. Climate
Change Secretariat (UNFCCC). [Online]. Available at
http://www.unfccc.de/resource/convkp.html (March 1998).
16

U.S. Department of Energy, Energy Information Administration, Office of Coal, Nuclear,
Electric and Alternate Fuels. “Renewable Energy 2000: Issues and Trends.”
[Online]. Available at http://www.eia.doe.gov/cneaf/solar.renewables/rea_issues/,
February 2001.
U.S. Department of Energy, Energy Information Administration. Annual Energy Review
1999. [Online]. Available at http://www.eia.doe.gov/emeu/aer/, September 2000.
Walsh, M.E., D. de la Torre Ugarte, S. Slinsky, R.L. Graham, H. Shapouri, and D. Ray.
"Economic Analysis of Energy Crop Production in the U.S. - Location,
Quantities, Price and Impacts on the Traditional Agricultural Crops." Bioenergy
98: Expanding Bioenergy Partnerships, Madison Wisconsin, October 4-8, vol. 2
(1998):1302-1310.
Wang, W., C. Saricks, and D. Santini. Effects of Fuel Ethanol Use on Fuel-Cycle Energy
and Greenhouse Gas Emissions. Center for Transportation Research, Argonne
National Laboratory, ANL/ESD-38, January(1999).
Yacobucci, B.D. and J. Womach. "RL30369: Fuel Ethanol: Background and Public
Policy Issues", The National Council for Science and the Environment,
Washington, D.C., [Online]. Available at: http://www.cnie.org/nle/eng-59.html,
March 2000.
17

Table 1 GHG Mitigation Policy Impact Summary from U.S. Agricultural Sector
Carbon Price in $ per TCE
Category 10 20 50 100 200 500
Net GHG Emission Reductions from Major Agricultural Mitigation Accounts (1,000 TCE) Soil Carbon Sequestration 31,540 46,316 59,945 57,105 47,520 50,291Afforestation 4,028 13,445 20,619 59,407 59,407 121,278Electricity from Energy Crops 0 0 27,037 118,979 198,591 172,093Subsidized Corn-Ethanol 2,893 2,893 2,893 2,893 2,893 2,893Agricultural Inputs 2,303 3,608 5,687 7,116 9,105 12,977Livestock CH4 + N2O 417 875 4,428 9,826 11,301 22,330Crop CH4 + N2O 1,385 1,579 1,981 3,248 4,380 5,350Total Net GHG Emission Reductions from U.S. Agriculture (MMTCE) Carbon Dioxide 37.9 63.4 112.2 237.7 306.5 349.7Methane 0.5 0.8 5.0 13.3 17.9 24.7Nitrous Oxide 1.4 1.6 2.5 4.7 5.9 9.9Total Carbon Equivalents 39.7 65.8 119.7 255.7 330.3 384.3U.S. Farmland Use (Million Acres) Traditional Crops 325.06 324.18 313.78 276.6 240.48 229.3Pasture 395.95 393.22 388.85 373.77 374.24 322.58Energy Crops 0 0 12.58 57.01 92.66 78.37Afforestation 0 3.61 5.81 13.63 13.63 37.42U.S. Agricultural Market Effects (Fisher Index) Crop Production 99.43 98.94 96.46 86.23 74.88 69.31Crop Prices 100.52 101.02 106.36 129.18 162.07 211.84Crop Net Exports 98.08 96.03 88.60 59.86 31.36 23.69Livestock Production 99.92 99.62 97.19 91.80 88.47 75.71Livestock Prices 100.18 100.19 103.77 119.86 142.10 182.87Agricultural Welfare Changes (Billion $) U.S. Farmers' Welfare 0.43 0.6 3.65 13.83 26.59 52.89U.S. Ag-Consumers' Welfare -0.39 -0.68 -4.39 -19.46 -41.23 -75.09Foreign Ag-Sector Welfare -0.14 -0.25 -1.05 -3.36 -4.81 -5.69U.S. Ag-Sector Welfare -0.11 -0.32 -1.8 -8.99 -19.45 -27.89Other Agricultural Externalities from Traditional Crop Production (% Change per Acre) Erosion -13.1 -25.5 -37.8 -44.3 -49.5 -48.2Nitrogen Percolation -8.1 -9.6 -17.0 -18.4 -21.1 -26.3Nitrogen Subsurface Flow -10.9 -11.4 -12.7 -11.2 -9.7 -12.3Phosphorous Loss in Sediment -23.0 -33.9 -45.2 -50.2 -54.3 -50.1
18

0
50
100
150
200
250
300
0 50 100 150 200
Car
bon
Pric
e in
Dol
lars
per
TC
E
Emission Reduction in MMT of Carbon Equivalents
Ag Mitigation OptionCrop CH4+N2O
Animal CH4+N2OSoil Sequestration
AfforestationBiomass Offsets
Figure 1 Role of Major Agricultural Strategies to Greenhouse Gas Mitigation at Selected Carbon Equivalent Prices
19
0
200
400
600
800
1000
0 50 100 150 200
Car
bon
Pric
e in
Dol
lars
per
TC
E
Emission Reduction in MMT of Carbon Equivalents
Biofuel GHGE OffsetsCompetitive Potential
Economic PotentialTechnical Potential
Figure 2 Comparison of Various Measures of Carbon Emission Mitigation Potential from Energy Crops
20

0
50
100
150
200
250
300
0 50 100 150 200 250 300 350 400
Car
bon
Pric
e in
Dol
lars
per
TC
E
Emission Reduction in MMT of Carbon Equivalents
Biomass YieldsU.S. Yields * 1/2U.S. Yields * 2/3
U.S. YieldsU.S. Yields * 3/2
U.S. Yields * 2
Figure 3 Changes in Amount of Emission Offsets Generated by Energy Crops When Energy Crop Yields are Altered
21

0
50
100
150
200
250
300
0 50 100 150 200
Car
bon
Pric
e in
Dol
lars
per
TC
E
Emission Reduction in MMT of Carbon Equivalents
Energy Price AssumptionU.S. Energy Price * 1/2
U.S. Energy PriceU.S. Energy Price * 2
Figure 4 Changes in Amount of Emission Offsets Generated by Energy Crops When Electricity Prices are Altered
22

0
50
100
150
200
250
300
0 50 100 150 200
Car
bon
Pric
e in
Dol
lars
per
TC
E
Emission Reduction in MMT of Carbon Equivalents
Demand Elasticity AssumptionU.S. Elasticities * 1/2
U.S. ElasticitiesU.S. Elasticities * 2
Figure 5 Changes in Amount of Emission Offsets Generated by Energy Crops When Domestic Agricultural Demand Elasticities are Altered
23

0
50
100
150
200
250
300
0 50 100 150 200 250 300 350
Car
bon
Pric
e in
Dol
lars
per
TC
E
Emission Reduction in MMT of Carbon Equivalents
Land AvailabilityU.S. Land * 1/2U.S. Land * 2/3
U.S. LandU.S. Land * 3/2
U.S. Land * 2
Figure 6 Changes in Amount of Emission Offsets Generated by Energy Crops when Land Availability is Altered
24