Embed Size (px)
Citation preview
Growing Apart? Structural Transformation and the Uneven Development of British Cities
Globalisation in Crisis? The Urban and Regional Challenges of the Great Instability. St Catharine’s College. Cambridge 13-14th July 2017
Peter Tyler, Emil Evenhuis, Ron Martin, Peter Sunley and Ben Gardiner

Acknowledgements
www.cityevolutions.org.uk @city_evolutions

Project objectives and main research questions
Aims of project
• Overall objective – to understand how city economies change, re-orientate and adapt over time, and to inform policy
• Main hypothesis – differences among cities in medium-long run growth are in part due to differences between cities in the process, nature, extent and success of structural transformation and adaptation, and how policy interventions have influenced such development
• Focus is on structural change and adaptive growth
Main themes / Research questions
How has the industrial structure of the national economy changed and evolved over time?
• The changing employment, output, productivity, export and innovation rates of individual sectors at national level
• The shift from industrial to post industrial economy
• What have become the key growth sectors, new sectors, declining sectors, and sector which exhibited ‘turn-around’?
• How should we measure ‘structure’ / ‘structural change’?
Main themes / Research questions
How have these structural transformations been distributed across British cities? How have city economic structures changed over time?
• How have cities varied in their transition to post-industrial economy?
• Do city economic structures change incrementally, or more discontinuously?
• Have cities become more or less specialised, and if so in what ways?
• Is functional structure / specialisation now more important than sectoral structure?
Main themes / Research questions
How have British cities varied in their adaptability?
• What have been the growth paths of British cities –leaders, laggards, cities that have ‘turned around’?
• How does adaptability relate to city growth?
• How path dependent are city economic structures?
• Does a city’s inherited skill and sectoral base shape the pace and direction of structural change
• How have cities varied in their innovative capacity?
Main themes / Research questions
What is the role of economic structure and structural transformation in explaining city growth paths?
• How is city growth related to economic structure and structural change over time?
• Does diversity or alternatively some type of specialisation assist economic reorientation?
• How does structure influence the economic resilience of cities to shocks?
• How do shocks influence structural change (‘creative destruction’)?
Main themes / Research questions
How have urban and national policies impacted on the structures and growth paths of British cities?
• Identifying the changing national and city / regional policy environment over recent decades.
• Assessing the impact of major policies in case study cities.
• How have local governance and institutional structures influenced structural adaptability and economic growth in the case study cities?
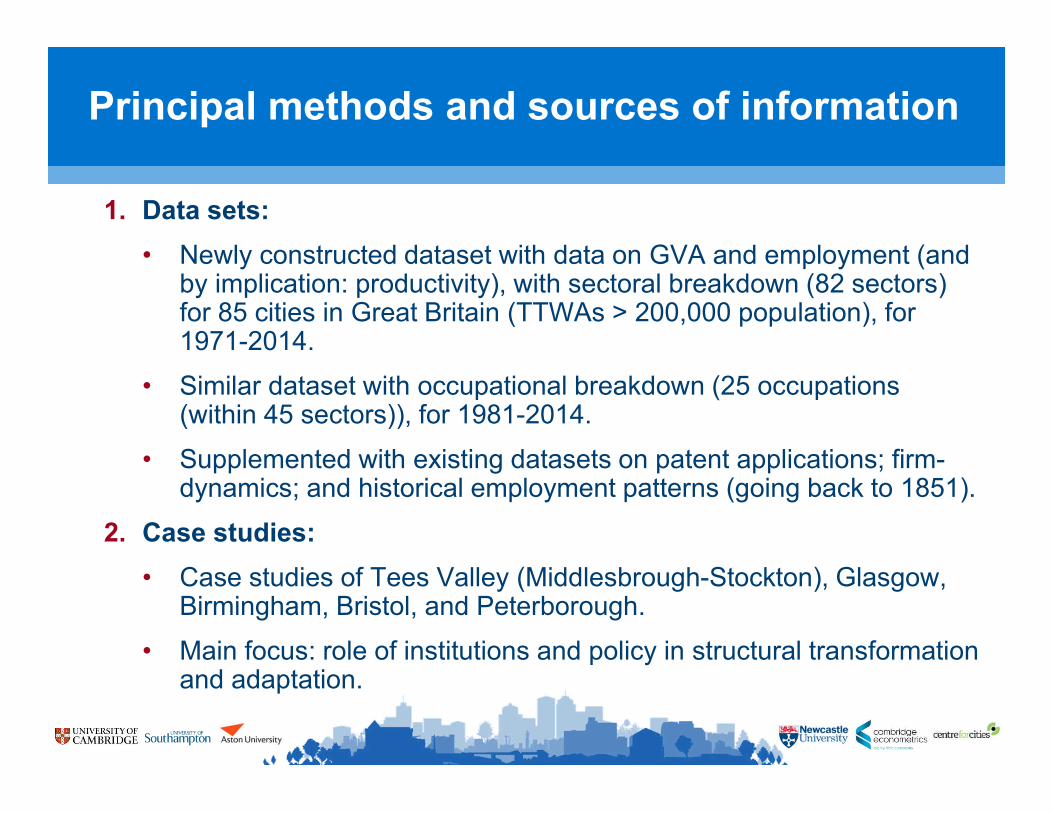
1. Data sets:
• Newly constructed dataset with data on GVA and employment (and by implication: productivity), with sectoral breakdown (82 sectors) for 85 cities in Great Britain (TTWAs > 200,000 population), for 1971-2014.
• Similar dataset with occupational breakdown (25 occupations (within 45 sectors)), for 1981-2014.
• Supplemented with existing datasets on patent applications; firm-dynamics; and historical employment patterns (going back to 1851).
2. Case studies:
• Case studies of Tees Valley (Middlesbrough-Stockton), Glasgow, Birmingham, Bristol, and Peterborough.
• Main focus: role of institutions and policy in structural transformation and adaptation.
Principal methods and sources of information
Research question examined today
To what extent can differences among cities in Great Britain in medium- to long-run growth, be
explained by differences in the process, nature and extent of structural transformation in these cities?

City Growth Evolutions
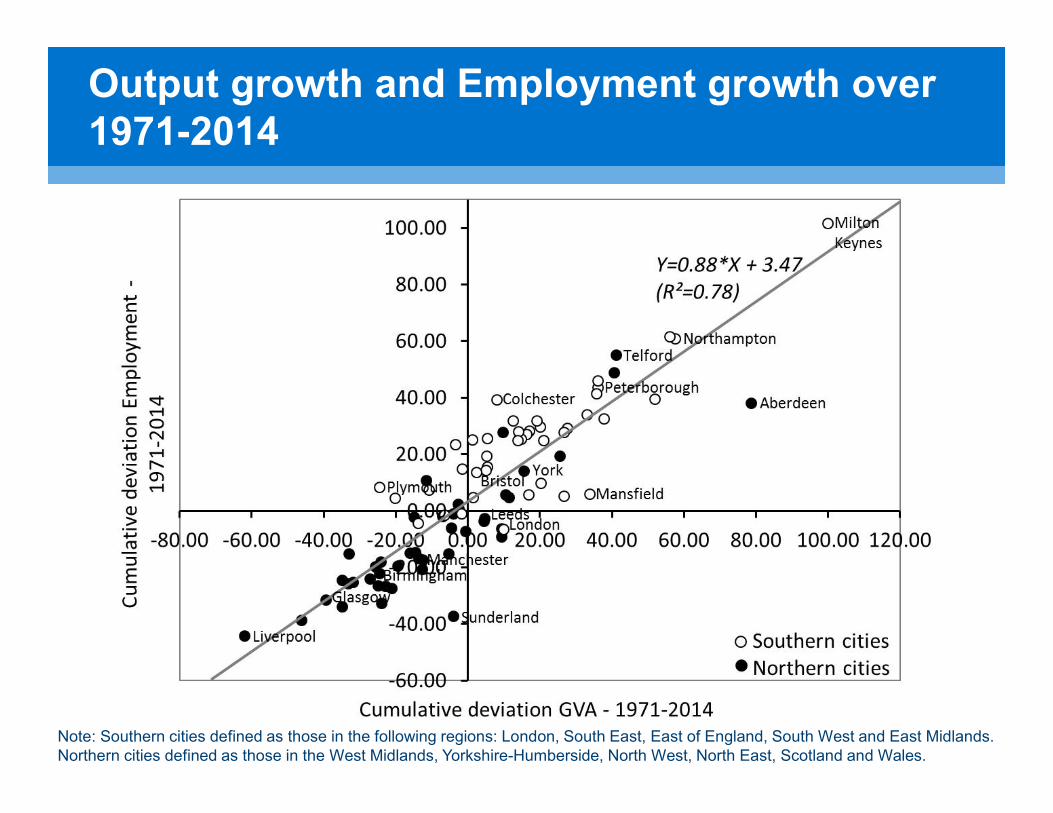
Output growth and Employment growth over 1971-2014
Note: Southern cities defined as those in the following regions: London, South East, East of England, South West and East Midlands. Northern cities defined as those in the West Midlands, Yorkshire-Humberside, North West, North East, Scotland and Wales.
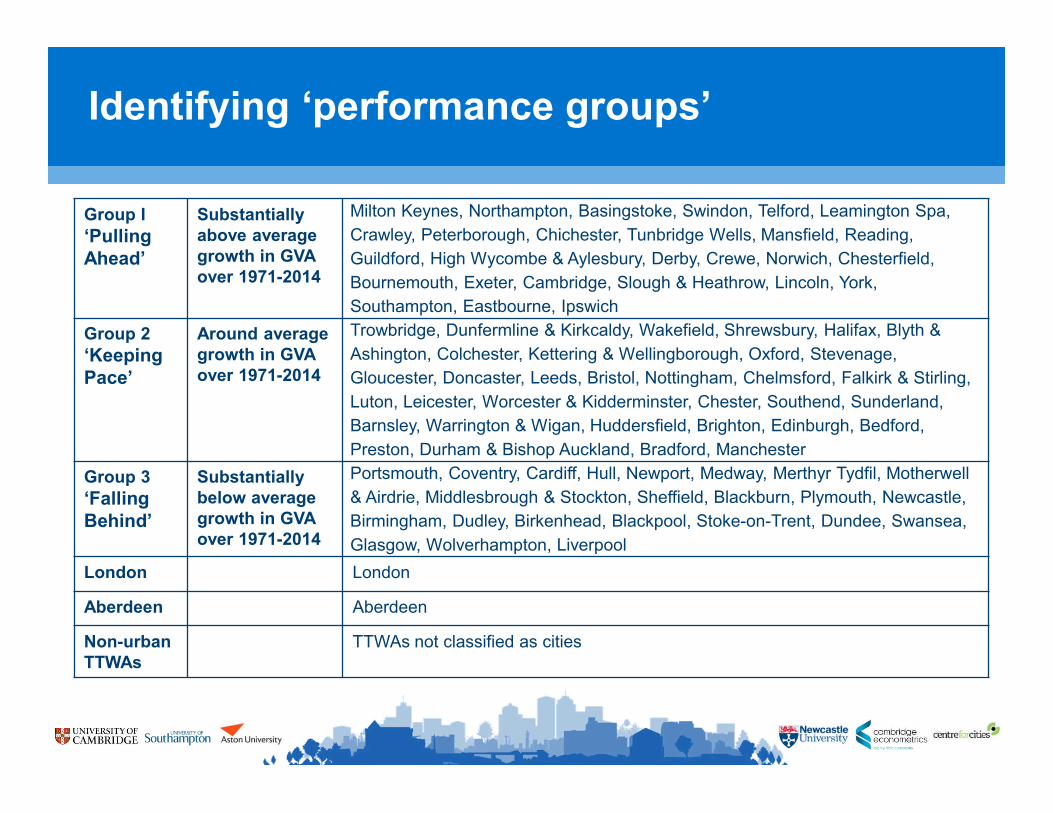
Group I
‘Pulling Ahead’
Substantially above average growth in GVA over 1971-2014
Milton Keynes, Northampton, Basingstoke, Swindon, Telford, Leamington Spa,
Crawley, Peterborough, Chichester, Tunbridge Wells, Mansfield, Reading,
Guildford, High Wycombe & Aylesbury, Derby, Crewe, Norwich, Chesterfield,
Bournemouth, Exeter, Cambridge, Slough & Heathrow, Lincoln, York,
Southampton, Eastbourne, Ipswich
Group 2
‘Keeping Pace’
Around averagegrowth in GVA over 1971-2014
Trowbridge, Dunfermline & Kirkcaldy, Wakefield, Shrewsbury, Halifax, Blyth &
Ashington, Colchester, Kettering & Wellingborough, Oxford, Stevenage,
Gloucester, Doncaster, Leeds, Bristol, Nottingham, Chelmsford, Falkirk & Stirling,
Luton, Leicester, Worcester & Kidderminster, Chester, Southend, Sunderland,
Barnsley, Warrington & Wigan, Huddersfield, Brighton, Edinburgh, Bedford,
Preston, Durham & Bishop Auckland, Bradford, Manchester
Group 3
‘Falling Behind’
Substantially below average growth in GVA over 1971-2014
Portsmouth, Coventry, Cardiff, Hull, Newport, Medway, Merthyr Tydfil, Motherwell
& Airdrie, Middlesbrough & Stockton, Sheffield, Blackburn, Plymouth, Newcastle,
Birmingham, Dudley, Birkenhead, Blackpool, Stoke-on-Trent, Dundee, Swansea,
Glasgow, Wolverhampton, Liverpool
London London
Aberdeen Aberdeen
Non-urban TTWAs
TTWAs not classified as cities
Identifying ‘performance groups’
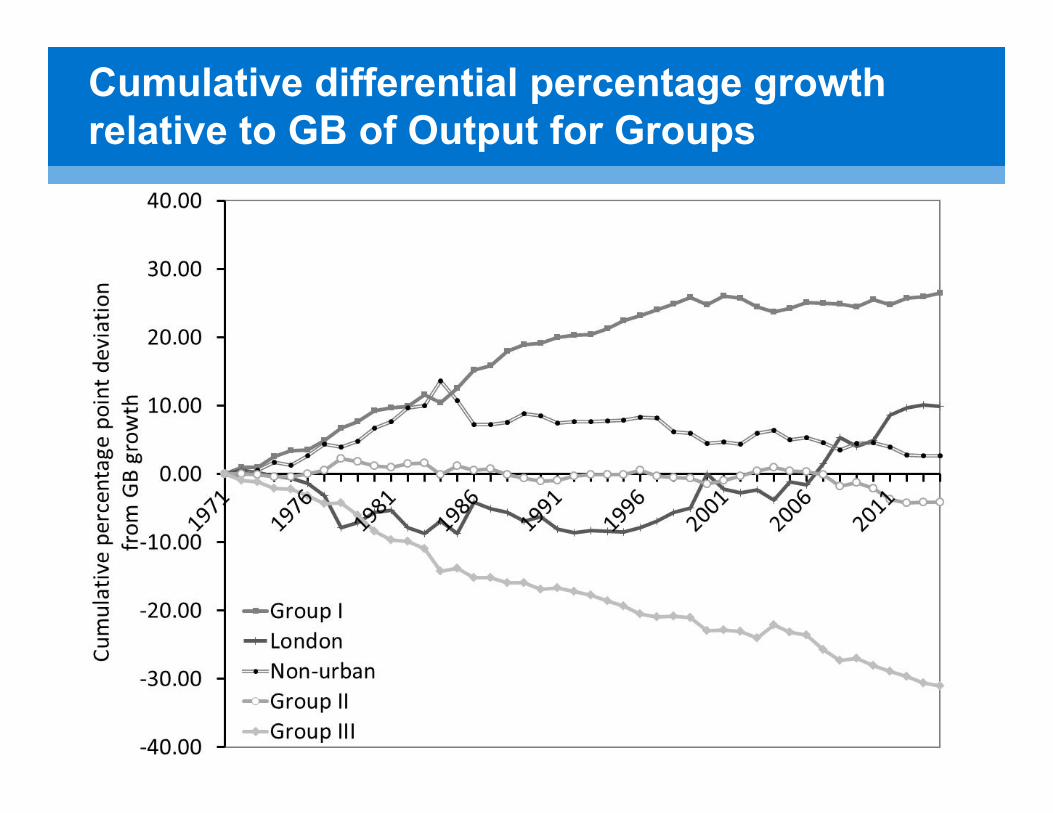
Cumulative differential percentage growth relative to GB of Output for Groups
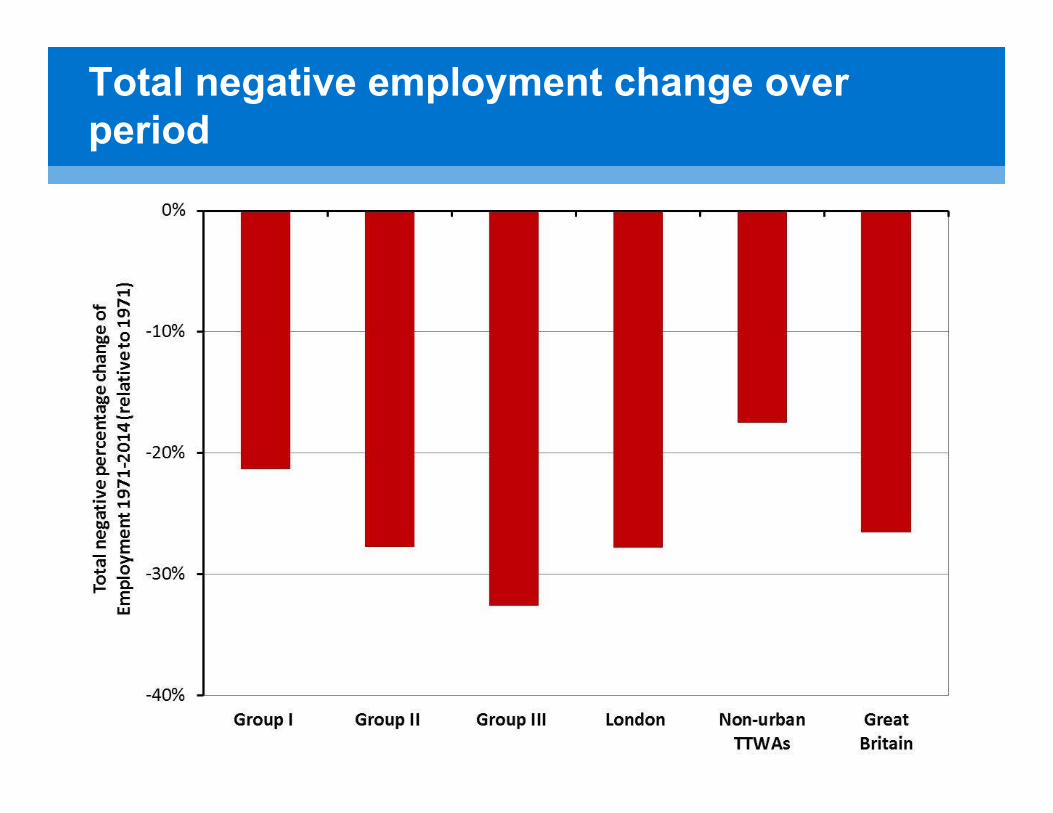
Total negative employment change over period
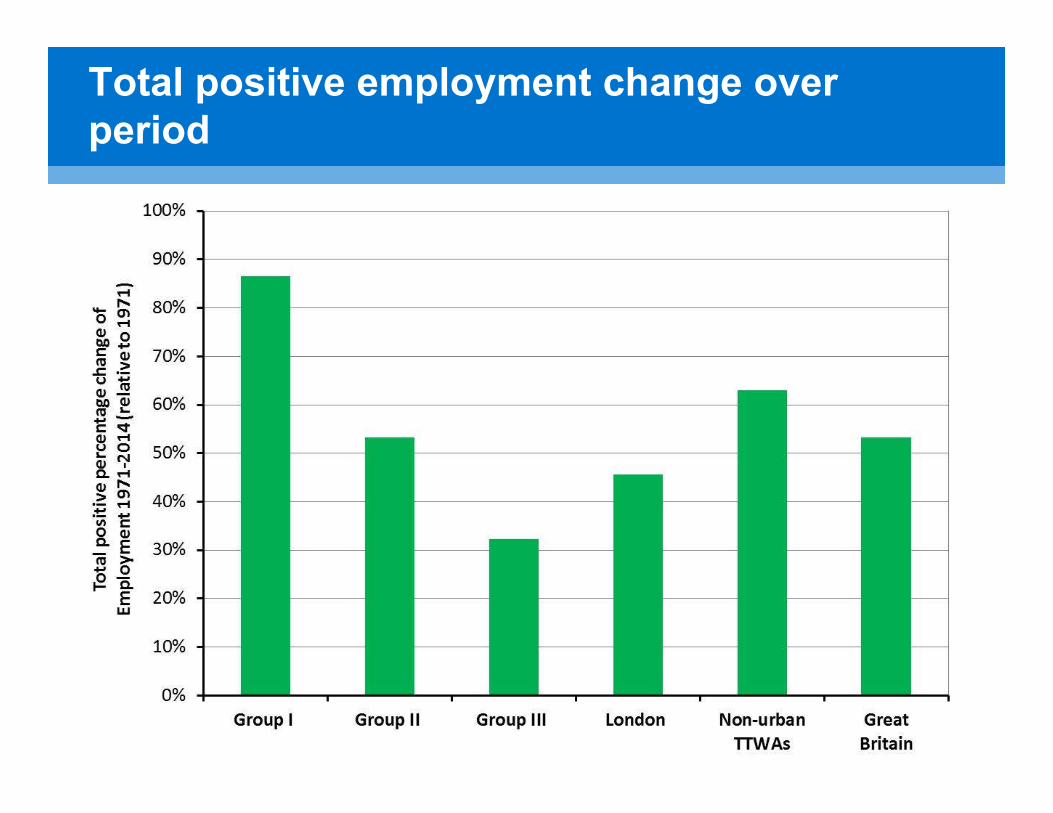
Total positive employment change over period
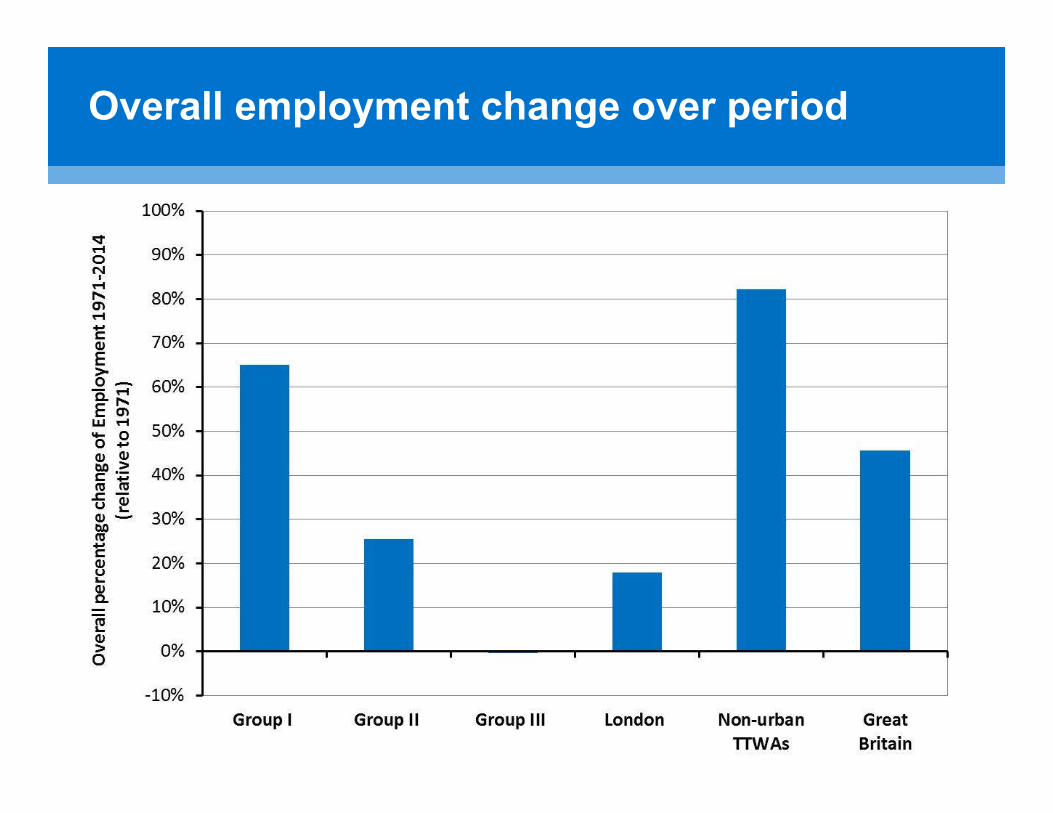
Overall employment change over period

Structural Transformation in the British Economy
Deindustrialisation and increasing polarisation in service sector
• Relative de-industrialisation since about 1960s in most advanced economies.
• Also absolute de-industrialisation in terms of employment, at accelerated pace in 1970s and 1980s.
• More lately, polarisation in the service sector, between:
Dynamic, high-productivity and tradeable activities (in IT, finance, design, life sciences, media, etc.).
More low-productivity – often also non-tradeable – segments (e.g. personal services, leisure, education, most public services).
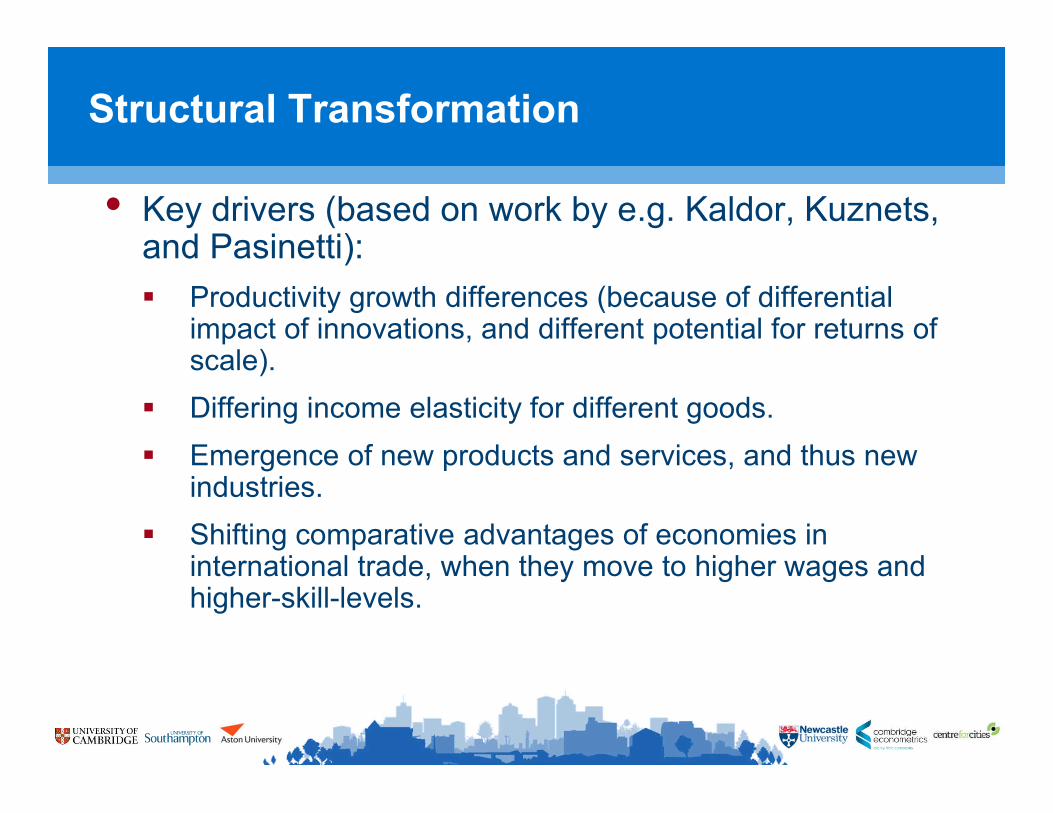
Structural Transformation
• Key drivers (based on work by e.g. Kaldor, Kuznets, and Pasinetti):
Productivity growth differences (because of differential impact of innovations, and different potential for returns of scale).
Differing income elasticity for different goods.
Emergence of new products and services, and thus new industries.
Shifting comparative advantages of economies in international trade, when they move to higher wages and higher-skill-levels.
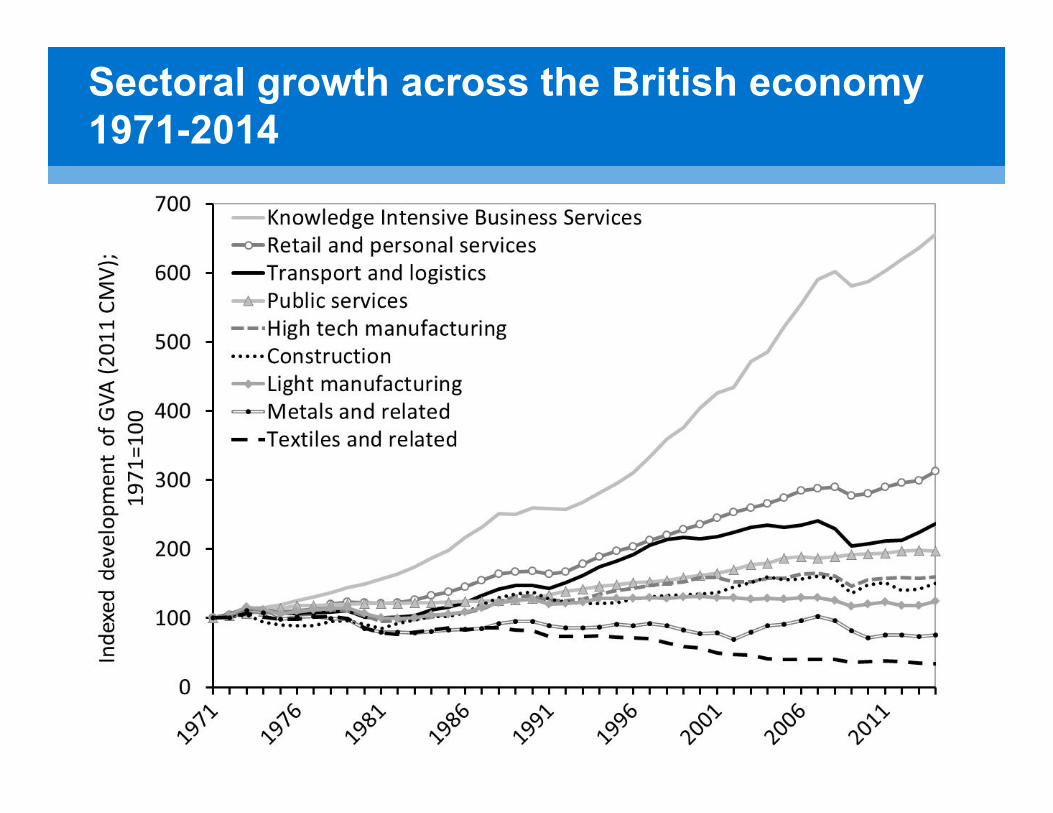
Sectoral growth across the British economy 1971-2014
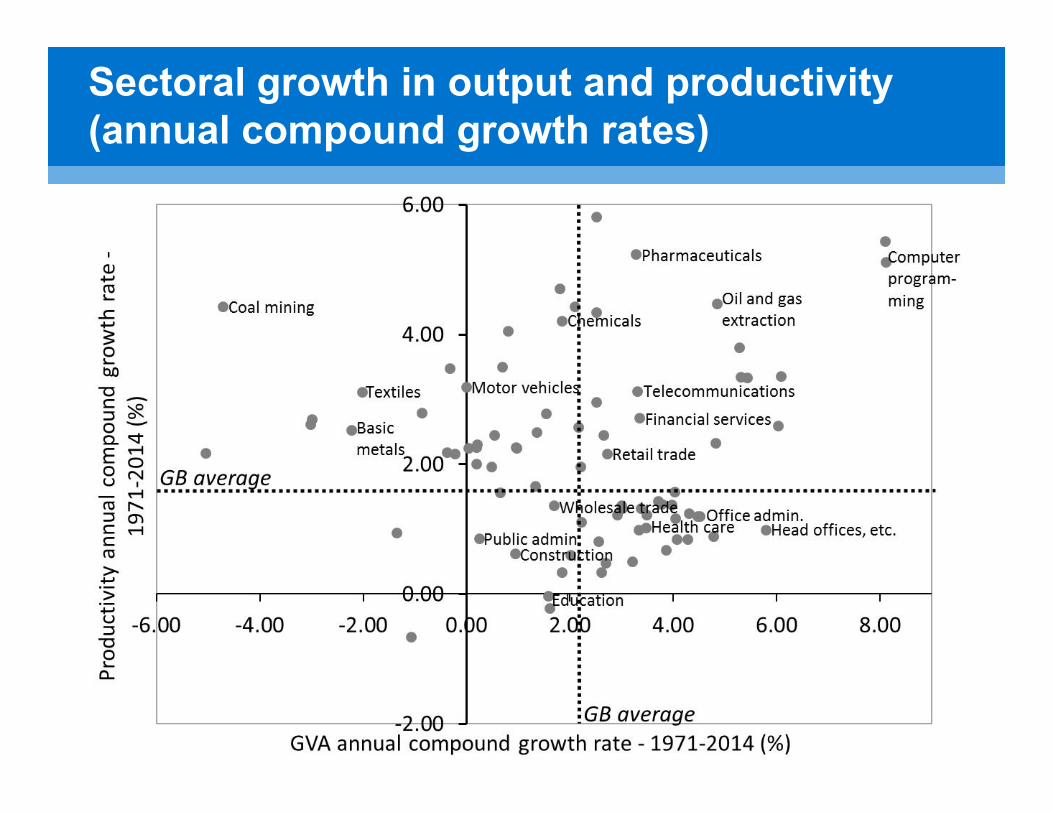
Sectoral growth in output and productivity (annual compound growth rates)
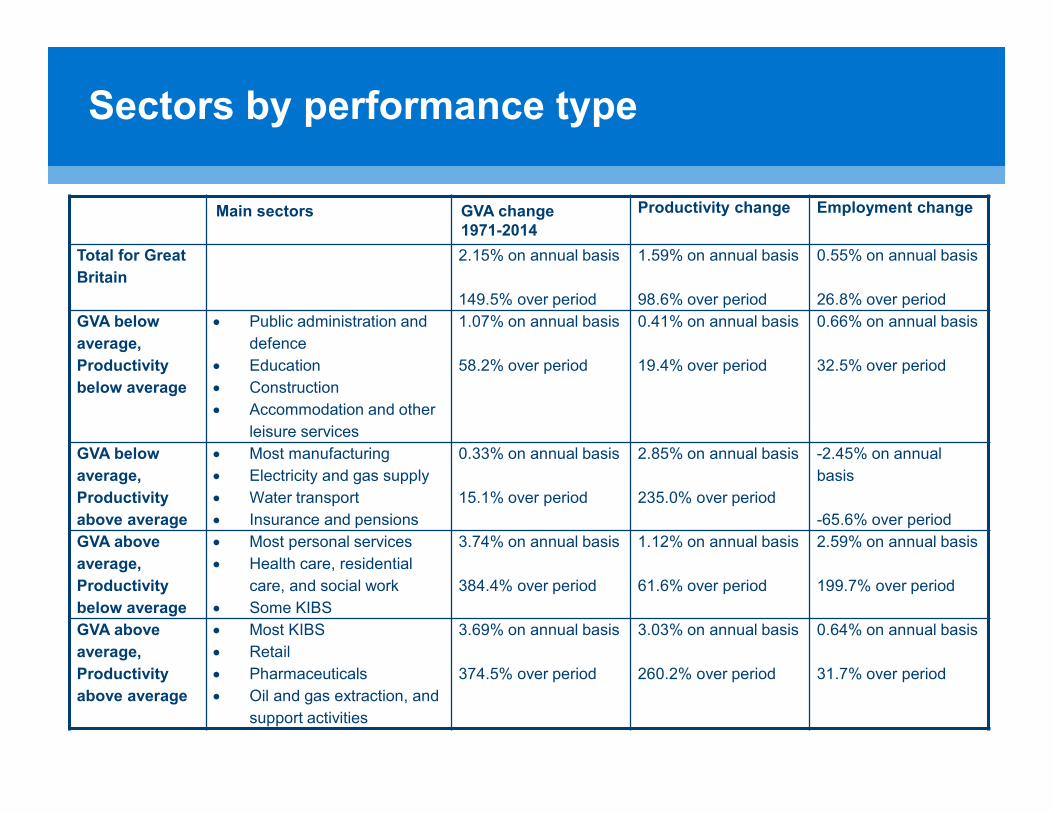
Sectors by performance type
Main sectors GVA change1971-2014
Productivity change Employment change
Total for Great
Britain
2.15% on annual basis
149.5% over period
1.59% on annual basis
98.6% over period
0.55% on annual basis
26.8% over period
GVA below
average,
Productivity
below average
Public administration and
defence
Education
Construction
Accommodation and other
leisure services
1.07% on annual basis
58.2% over period
0.41% on annual basis
19.4% over period
0.66% on annual basis
32.5% over period
GVA below
average,
Productivity
above average
Most manufacturing
Electricity and gas supply
Water transport
Insurance and pensions
0.33% on annual basis
15.1% over period
2.85% on annual basis
235.0% over period
-2.45% on annual
basis
-65.6% over period
GVA above
average,
Productivity
below average
Most personal services
Health care, residential
care, and social work
Some KIBS
3.74% on annual basis
384.4% over period
1.12% on annual basis
61.6% over period
2.59% on annual basis
199.7% over period
GVA above
average,
Productivity
above average
Most KIBS
Retail
Pharmaceuticals
Oil and gas extraction, and
support activities
3.69% on annual basis
374.5% over period
3.03% on annual basis
260.2% over period
0.64% on annual basis
31.7% over period
Contribution of Structural Factors to the Growth of
British Cities
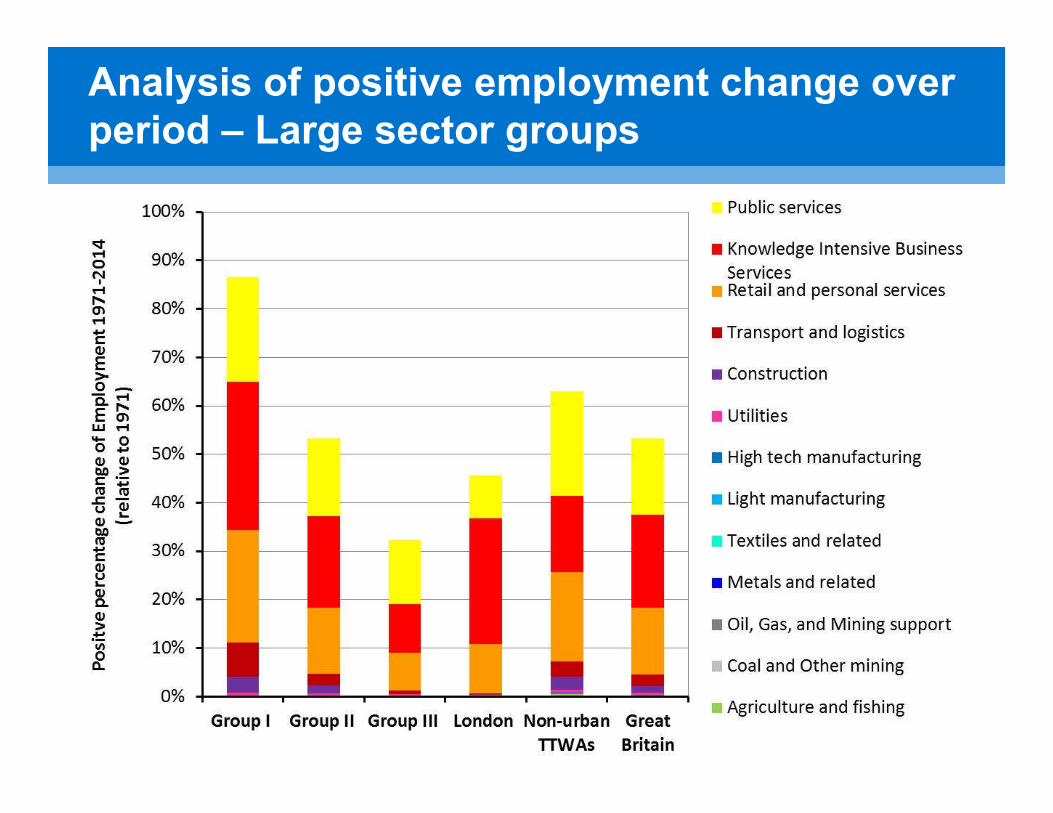
Analysis of positive employment change over period – Large sector groups
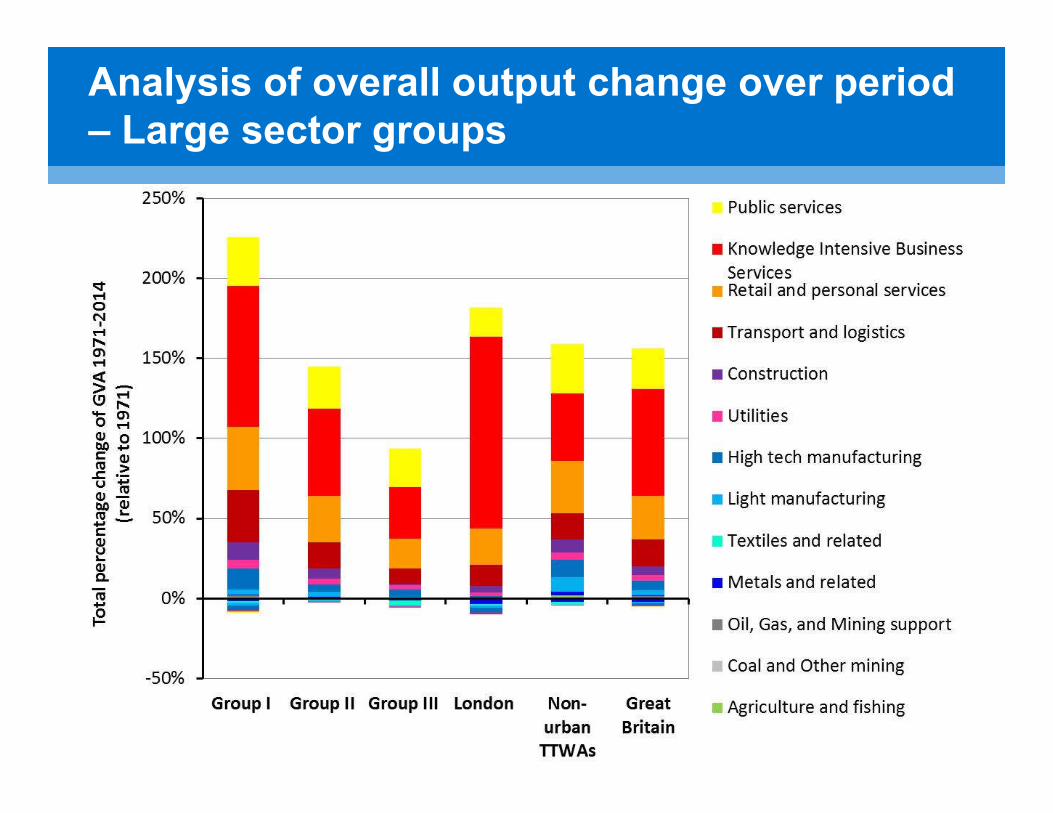
Analysis of overall output change over period – Large sector groups
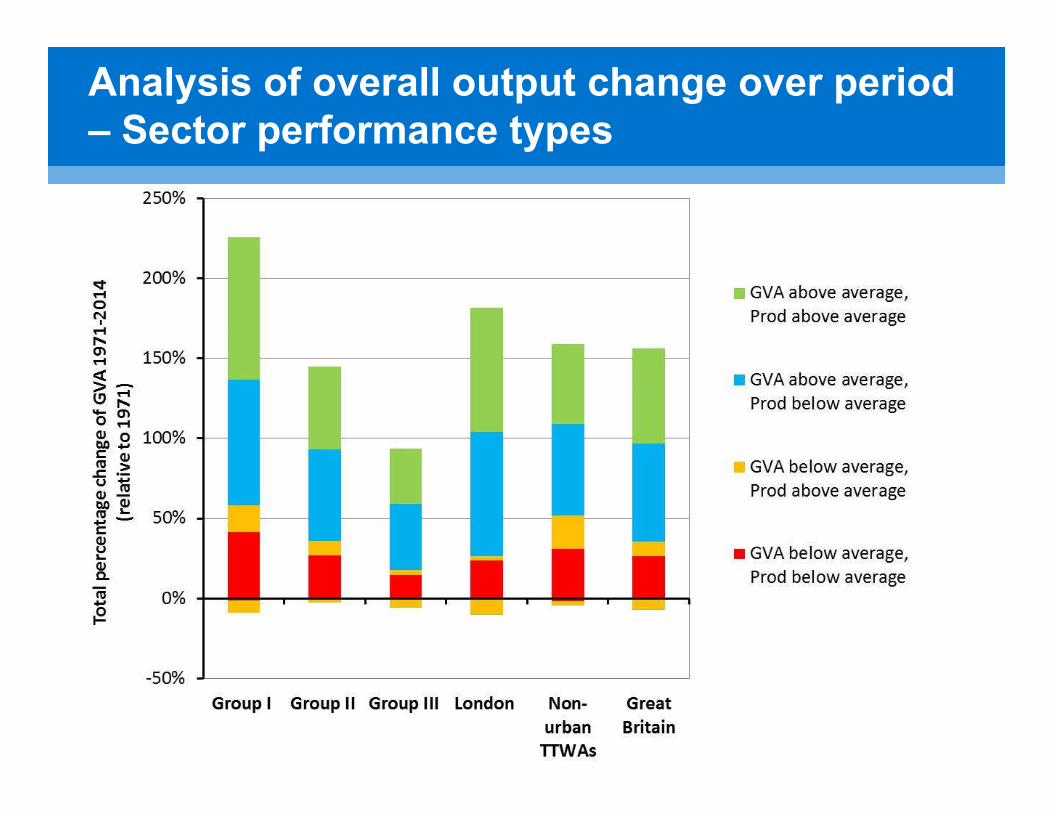
Analysis of overall output change over period – Sector performance types
29
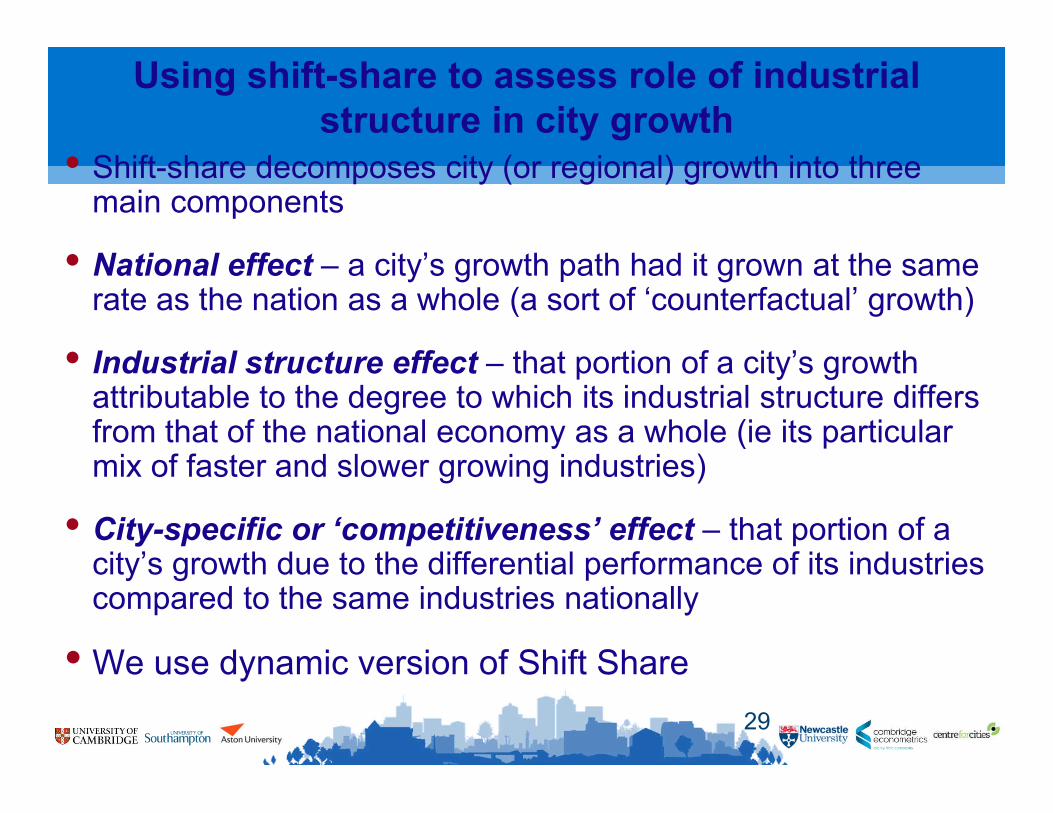
• Shift-share decomposes city (or regional) growth into three main components
• National effect – a city’s growth path had it grown at the same rate as the nation as a whole (a sort of ‘counterfactual’ growth)
• Industrial structure effect – that portion of a city’s growth attributable to the degree to which its industrial structure differs from that of the national economy as a whole (ie its particular mix of faster and slower growing industries)
• City-specific or ‘competitiveness’ effect – that portion of a city’s growth due to the differential performance of its industries compared to the same industries nationally
• We use dynamic version of Shift Share
Using shift-share to assess role of industrial structure in city growth
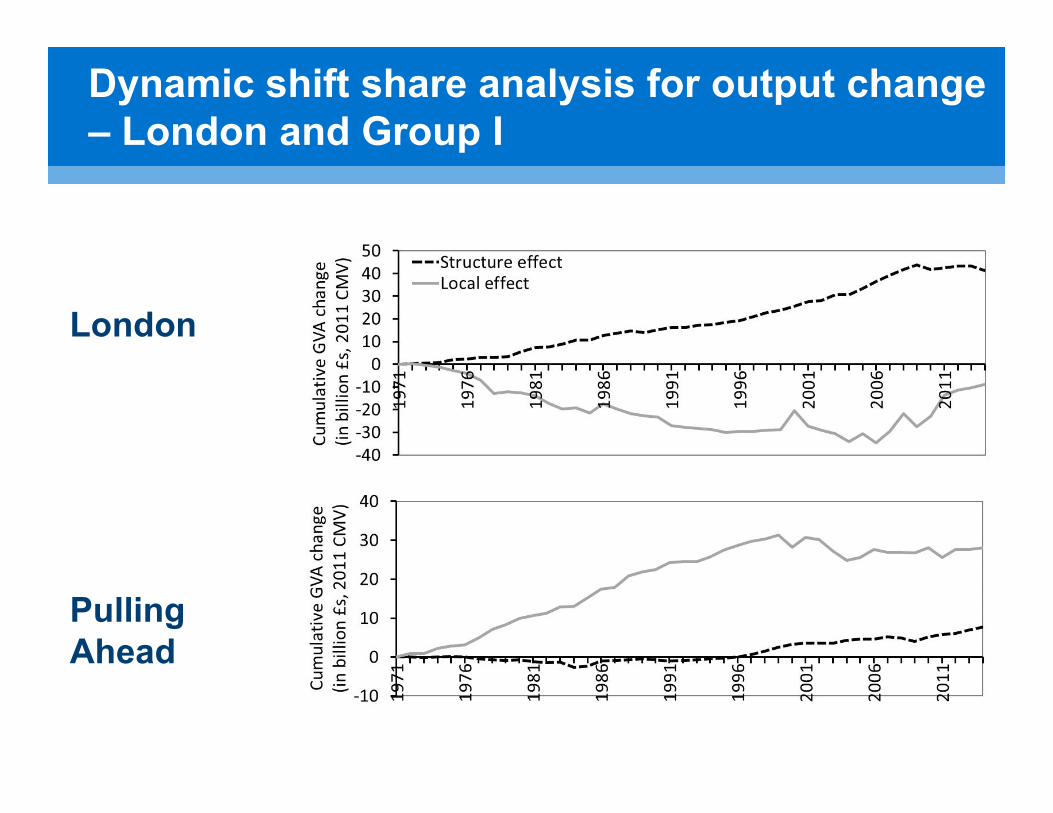
Dynamic shift share analysis for output change – London and Group I
London
Pulling Ahead
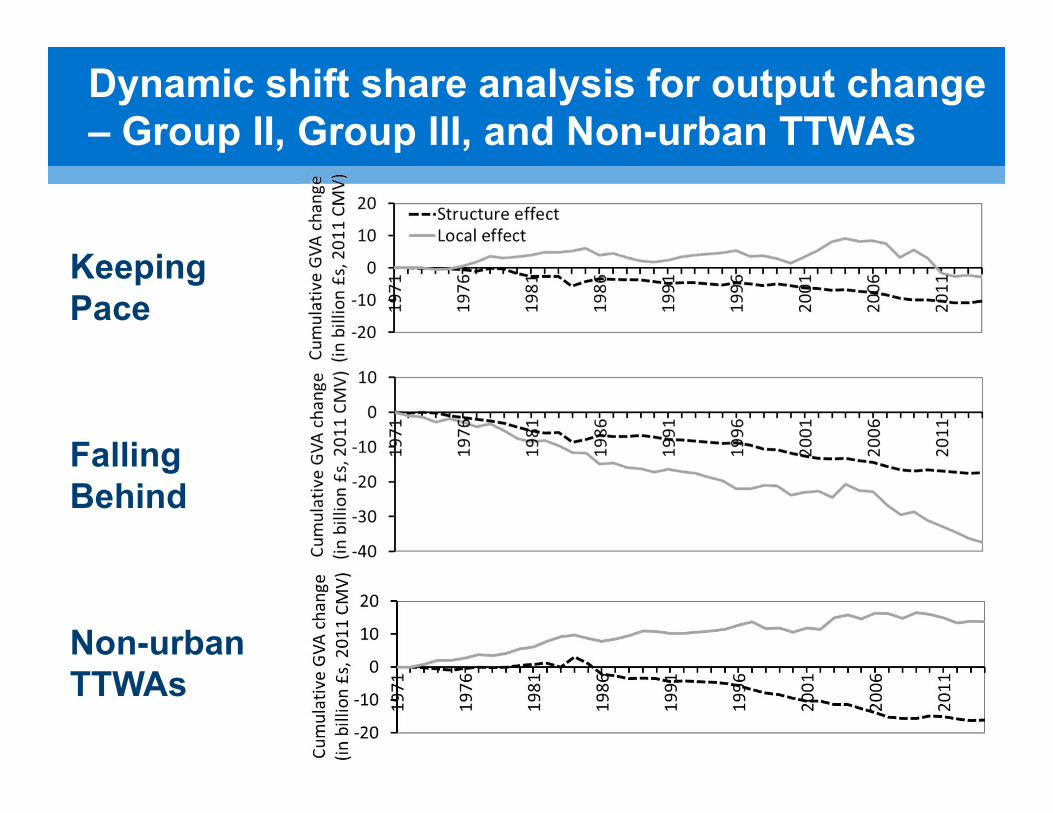
Dynamic shift share analysis for output change – Group II, Group III, and Non-urban TTWAs
Keeping Pace
Falling Behind
Non-urbanTTWAs
Contribution of structure re local effects
• Throughout period London benefitted from its particular economic structure,However, structural effect offset by local effect until mid 1990s. In recent yearslocal effect has been strongly positive;
• Structural effect also substantial in explaining slow growth of older industrialcities (Group III)-explaining about half of the gap between city and nation as awhole. However, negative effect has been at least as large and has increasedovertime-various factors affecting a city’s competitiveness have becomeincreasingly unfavourable;
• Group II cities and other, less urban, TTWAs have also coped with a negativestructural effect-but heavily compensated by a positive local effect;
• Strong growth in leading Group I cities has been almost entirely due to highlypositive local effect reflecting a growing competitive advantage.

Conclusions
Key components relative to change
Between-sector changes (effect of composition captured by shift share) account for some of the divergent development of British cities.
However, a full explanation has to explain thecontribution of the factors contained in the ‘localeffect’;
Within-sector changes; Within-sector changes – due todifferent firm- demographics, different tasks and functions,different levels of entrepreneurship and innovation, etc. –seem to be dominant however
Cities’ local supply factors. – labour market / skills; builtenvironment / infrastructure; other legacies; and institutionsand policy – will shape both these types of changes (andthus adaptability).
• In the course of the dynamic specialisation seen in city economies, therelationships between these three sets of processes are deeplyrecursive through time;
• While our dynamic shift-share analysis has allowed us to rigorouslydistinguish and pull out the direct effects of structural change onvariations in city growth, it is not intended to identify more indirect andevolutionary path dependent effects that stem from structural change;
• These indirect effects may be important and may be closely integratedwith both within-sector and local supply-side development in specificensembles.
Within-sector changes
• Within-sector changes; Cities host firms that are classifiedas belonging to the same industry but are actually quitedifferent in their capabilities, employment, business modelsand strategies, and these ‘within-sector’ effects will alsocontribute to divergent economic performances. Fastergrowing cities and less urban areas may be characterisedby a relatively higher proportion of businesses that arerelatively enterprising;
• These businesses have favourable know-how and expertiseand undertake a relatively higher proportion of productinnovation and targeting new and emerging markets.
Cities’ local supply factors
• Cities’ local supply factors. – labour market / skills; builtenvironment / infrastructure; other legacies; and institutions andpolicy – shape both these types of changes (and thus
adaptability); Local areas start with an inherited pattern ofland use and a resource base and institutions that weretailored to another era and the legacy of the past weighsheavily on their ability to adjust to new economic futures.
• The Group III cities tend to be amongst the oldest industrial cities withinfrastructure, labour forces and a constrained land use pattern to match(See Fothergill and Gudgin, 1982);
• In contrast the fast growing Group I cities contain post second world warNew Towns characterised by plentiful and planned land assembly, upto-date infrastructure and labour with skills more appropriate to the newage;
• While there is considerable scope for policy initiatives to modify andimprove these local supply factors and characteristics, it is also the casethat their development is primarily the outcome of a long-termcumulative and path dependent process in which industrial changeplays a key role and accumulates different types of asset and institution(Storper, 2015).