Embed Size (px)
Citation preview

GROWING A GREAT
AUSTRALIAN MINING
COMPANY
RIU EXPLORERS CONFERENCE
Chris Bonwick, Managing Director
13 February 2013
For
per
sona
l use
onl
y

L
l Certain oral and written statements contained or incorporated by reference in this presentation, including information as to the future financial or operating performance of the Company and its projects, constitute forward-looking statements. All statement, other than statements of historical fact, are forward-looking statements. The words “believe”, “expect”, “anticipate”, “contemplate”, “target”, “plan”, “intend”, “continue”, “budget”, “estimate”, “may”, “will”, “schedule” and similar expressions identify forward-looking statements.
Forward-looking statements include, among other things, statements regarding targets, estimates and assumptions in respect of nickel, gold or other metal production and prices, operating costs and results, capital expenditures, mineral reserves and mineral resources and anticipated grades and recovery rates. Forward-looking statements are necessarily based upon a number of estimates and assumptions related to future business, economic, market, political, social and other conditions that, while considered reasonable by the Company, are inherently subject to significant uncertainties and contingencies. Many known and unknown factors could cause actual events or results to differ materially from estimated or anticipated events or results reflected in such forward-looking statements. Such factors include, but are not limited to: competition; mineral prices; ability to meet additional funding requirements; exploration, development and operating risks; uninsurable risks; uncertainties inherent in ore reserve and resource estimates; dependence on third party smelting facilities; environmental regulation and liability; currency risks; effects of inflation on results of operations; factors relating to title to properties; native title and aboriginal heritage issues; dependence on key personnel; and share price volatility and also include unanticipated and unusual events, many of which are beyond the Company’s ability to control or predict.
The Company disclaims any intent or obligation to update any forward-looking statements, whether as a result of new information, future events or results or otherwise. All forward-looking statement made in this presentation are qualified by the foregoing cautionary statements. Investors are cautioned that forward-looking statements are not guarantees of future performance and, accordingly, not to put undue reliance on such statements.
DISCLAIMER
Independence Group NL ABN 46 092 786 304
2
For
per
sona
l use
onl
y

L
l Capital Structure: ASX 200 Code : IGO
232.9M shares
Financials: Market Cap. (11/2/13): A$1,148.1M
Cash (end Dec Qtr 2012): A$102.9M
Debt (end Dec Qtr 2012): (A$16.2M)
Unaudited H1 NPAT: A$16.3M
Substantial shareholders: 65 Institutions in Top 100
67% Australian 10% Overseas
Dividends: Interim dividend (23 Mar 2012) 2c
Final dividend (28 Sep 2012) 1c
Total Dividends Paid to Date 70 cps
FINANCIAL SUMMARY
3
For
per
sona
l use
onl
y

L
l
L
l
Highly complementary management and technical capabilities, with proven successful
track records of exploration, project management and operations
Combination of low cost cash flows from current operating mines with significant long-life
development projects and highly prospective exploration
IGO ASSET PIPELINE
4
For
per
sona
l use
onl
y

L
l
L
l
IGO MAJOR PROJECTS
5
For
per
sona
l use
onl
y

L
l NEW AUSTRALIAN GOLD PROVINCE
UNDER SAND DUNES
TROPICANA GOLD PROJECT
IGO 30%, AGA 70%, MANAGER
6
L
l
Regional drilling Early Stage Pit
For
per
sona
l use
onl
y

L
l
L
l
TROPICANA GOLD PROJECT
IGO 30%, AGA 70%, MANAGER
7
References : IGO & AGA 4/12/2012 ASX Releases for Tropicana Gold Project Mineral Resource Estimate
IGO & AGA 27/7/2011 ASX Releases for Reserve Estimate
For
per
sona
l use
onl
y

PROJECT UNDER CONSTRUCTION:
Project 75% complete at 31st December 2012
First production estimated December Qtr 2013
IGO attributable production years 1-3^: 141-147,000 oz Au pa
Cash costs years 1-3~: A$590-630/oz Au
Recent gold price (8/2/2013): A$1,626/oz
Resources – IGO 30% Share: 2.4M oz Au#
Reserves – IGO 30% Share: 1.2M oz Au*
……and growing
Combined land position of 13,480sq km
References : ̂ IGO 11/11/2010 ASX Releases for Tropicana Gold Project Development Approval (real terms as at 2010)
# IGO & AGA 4/12/2012 for ASX Releases for Tropicana Gold Project Mineral Resource Estimate
* IGO & AGA 27/7/2011 ASX Releases for Reserve Estimate
~ AGA 31/1/2013 ASX Release Tropicana Gold Project Update
L
l
CASA approved Aerodrome
1.5 hour flight time from Perth
TROPICANA GOLD PROJECT
IGO 30%, AGA 70%, MANAGER
8
For
per
sona
l use
onl
y

TROPICANA GOLD PROJECT
0
100,000
200,000
300,000
400,000
500,000
600,000
700,000
800,000
900,000
Gold Ounces Australian Mine Production 2011
Tropicana* (30% IGO)
Tropicana* (100%)
* Based on BFS Production Years 1-3
L
l IN 2011 DOMESTIC GOLD PRODUCTION >100Koz
9 Source:
IGO 30%, AGA 70%, MANAGER
For
per
sona
l use
onl
y

L
l
L
l
TROPICANA GOLD PROJECT
UPSIDE STUDIES & POTENTIAL
10
L
l
References : IGO & AGA 4/12/2012 ASX Releases for Tropicana Gold Project Mineral Resource Estimate
IGO & AGA 27/7/2011 ASX Releases for Reserve Estimate
For
per
sona
l use
onl
y

L
l
L
l
Drill widths approximate true widths
11
TROPICANA GOLD PROJECT
SIGNIFICANT DOWN PLUNGE POTENTIAL
L
l
For
per
sona
l use
onl
y

L
l
L
l
12
TROPICANA GOLD PROJECT
SIGNIFICANT REGIONAL POTENTIAL
L
l
Tenement Area 13,480 km2
Geochem Coverage over 7,000 km2
Geochem Based Prospects ~ 60
Of the 60 Geochem Prospects ~ 32 have
been drilled with RC or DD
Of the 32 Prospects drilled ~14 have
drill intercepts > 5g/t Au
For
per
sona
l use
onl
y

L
l
TROPICANA GOLD PROJECT
FLY THROUGH
15
For
per
sona
l use
onl
y

L
l
L
l
Record^ Annual 2012 Production – 9,995t Ni (2011/12 Guidance 8,800-9,200t Ni).
IGO produced over 83,000t Ni since acquisition.
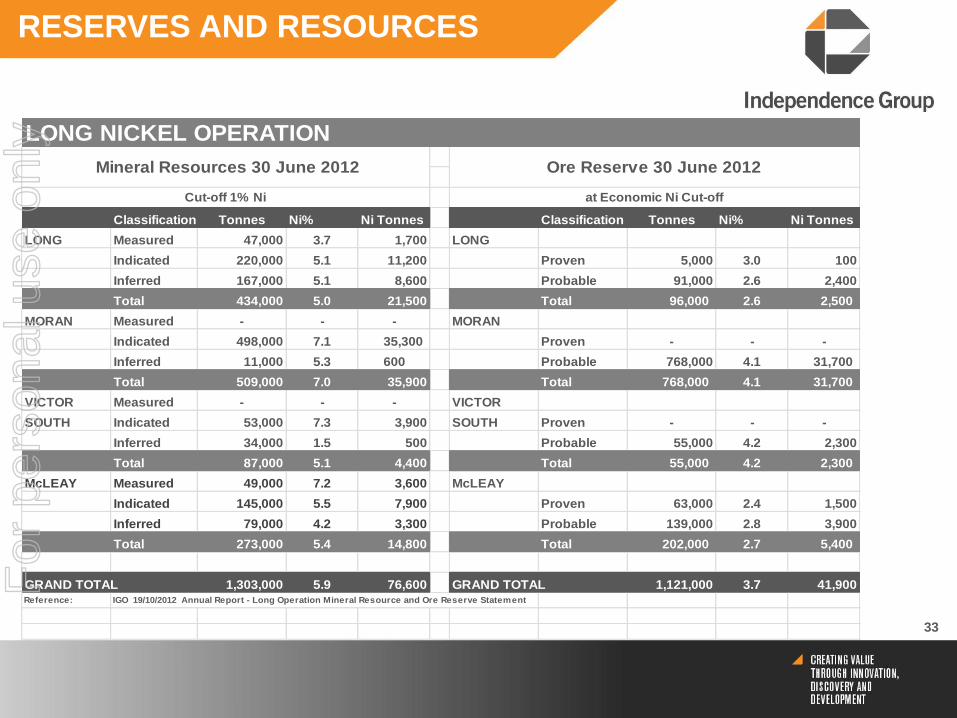
June 2012 Ore Reserve 41,900t Ni and Resource 76,600t Ni.
Exploration success continues to add to Mining Inventory
LONG NICKEL
OPERATION
2011/12
ACTUAL
2012/13
GUIDANCE
Sept Qtr
2012
Dec Qtr
2012
Production (Payable Ni Tonnes) 9,995 9,200 – 9,600 2,952 2,645
*Cash Costs (A$/lb Ni) $4.74 $4.80 - $5.00 $3.88 $4.84
Tonnes 282,177 260,000 – 280,000 76,713 65,770
Hedging : FY13 200 Ni tonnes per month @ A$12.17/lb
LONG NICKEL OPERATION (IGO 100%)
^Record during the ten years of IGO ownership
References: IGO 29/8/2012 ASX Release for 2012 Financial Year Full Year Result and Final Dividend
IGO 31/10/2012 ASX Release for Quarterly Activities Report to 30 September 2012
IGO 31/01/2013 ASX Release for Quarterly Activities Report to 31 December 2012
IGO 19/10/2012 Annual Report for Long Nickel Mine Mineral Resource and Ore Reserve Statement
* Cash Costs are reported based on Payable Metal Including Royalties
14
For
per
sona
l use
onl
y

L
l
L
l
CELEBRATING 10Yrs OF LOW COST NICKEL PRODUCTION
LONG NICKEL OPERATION (IGO 100%)
15
Net Margin
10 Year Production
Average Cash Cost + Royalties A$4.12/lb
Realised Ni Price A$10.06/lb
For
per
sona
l use
onl
y

L
l
L
l
High powered TEM transmitter
**exclusive to IGO**
10 x more powerful than
conventional systems.
Doubles search radius
detection up to 200m.
Cleaner data.
More accurate targeting.
INNOVATIVE RESEARCH AND DEVELOPMENT
Nickel sulphides are very
conductive and can be
detected using
electromagnetic
geophysicial technology.
Down hole TEM probe
200m search radius.
3D visualisation of
massive NiS targets.
LONG NICKEL OPERATION (IGO 100%)
16
For
per
sona
l use
onl
y

L
l
L
l
LONG NICKEL OPERATION (IGO 100%)
DEPOSITS & TARGETS LONGITUDINAL PROJECTION
References: IGO 19/10/2012 ASX Release: Annual Report for Long Nickel Mine Mineral Resource and Ore Reserve Statement
IGO 31/10/2012 ASX Release : Quarterly Activities Report to 30 September 2012 17
For
per
sona
l use
onl
y

L
l
L
l
ZINC-COPPER-SILVER
OPERATION
ACTUAL
2011/12
GUIDANCE
2012/13
Sept QTR
2012
Dec QTR
2012
Production (Zn Tonnes) 16,569 27,000 – 28,000 6,668 8,962
Production (Cu Tonnes) 7,257 5,000 – 6,000 1,360 1,207
Production (Ag ozs) 577,726 700,000 – 800,000 194,844 261,645
*Cash Costs (A$/lb Zn) $0.58 $0.40 - $0.60 $0.69 $0.41
References: IGO 29/8/2012 ASX Release for 2012 Financial Year Full Year Result and Final Dividend
IGO 31/10/2012 ASX Release for Quarterly Activities Report to 30 September 2012
IGO 31/01/2013 ASX Release for Quarterly Activities Report to 31 December 2012
* Cash costs are reported based on payable metal including royalties
Switch from contract to owner operator mining
Senior management changes
Value creation mentality instilled
Proactive mining plan – adaptive to market conditions
Operational flexibility – 2 years of developed ore at Bentley
Improved mining fleet reliability
Reduced power costs at Bentley
Successfully commissioned HMS plant
Improved Concentrate Offtake Terms 18
JAGUAR OPERATION (IGO 100%)
PRODUCTION UPDATE &
OPERATIONAL IMPROVEMENTS
For
per
sona
l use
onl
y

L
l
L
l
19
Removes waste rock from diluted ore and stringer sulphides.
Increases mill head-grade resulting in reduced processing costs.
HEAVY MEDIA SEPARATION PLANT
Total tonnes treated 95,108t
Removed 40,187t of waste from ore feed(42%)
HMS Cu feed upgraded by 61.2%
HMS Zn feed upgraded by 62.0%
(from 24/4/2012 to 17/11/2012)
JAGUAR & BENTLEY (IGO 100%)
PRODUCTION UPDATE & OPERATIONAL
IMPROVEMENTS
“Sinks” “Floats”
For
per
sona
l use
onl
y
L
l
L
l
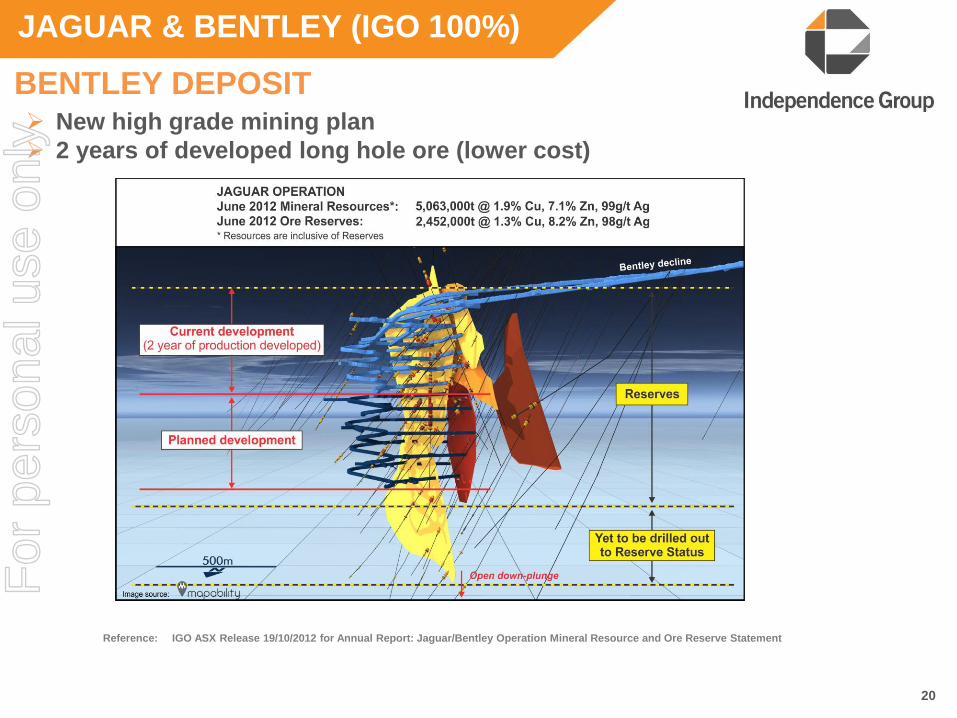
Reference: IGO ASX Release 19/10/2012 for Annual Report: Jaguar/Bentley Operation Mineral Resource and Ore Reserve Statement
BENTLEY DEPOSIT
JAGUAR & BENTLEY (IGO 100%)
New high grade mining plan
2 years of developed long hole ore (lower cost)
20
For
per
sona
l use
onl
y

L
l
L
l
JAGUAR & BENTLEY (IGO 100%)
BENTLEY DEPOSIT
Discovered – 2008 Development – 2011 First Stoping – Sept Qtr 2012
Bentley - Mineral Resource Total Tonnes Cu % Zn % Ag g/t Au g/t
Total Resource 2,914,000 1.9 10.2 134 0.7
Bentley – Contained Metal Cu t Zn t Ag Moz Au oz
Total Resource 55,600 298,600 12.6 68,000
Reference: IGO ASX Release 19/10/2012 for Annual Report: Jaguar/Bentley Operation Mineral Resource and Ore Reserve Statement
Early production has yielded a positive reconciliation against Ore Reserve
+33% ore tonnes, +48% Zn metal, +33% Cu metal (as of 30 Sept 2012 against Ore Reserve)
21
For
per
sona
l use
onl
y

L
l
L
l
Under-explored 50km long prospective Cu-Zn-Ag VMS corridor.
High Prospectivity around existing 3 mines.
Six Cu-Zn-Ag alteration anomalies under-cover being systematically tested.
Golden Grove Gossan Hill : discovery history
JAGUAR & BENTLEY (IGO 100%)
22
Bentley Deposit Scale Comparison
For
per
sona
l use
onl
y

L
l
L
l
STOCKMAN PROJECT (IGO 100%)
23
Currawong Deposit Wilga Deposit
Stockman Total Tonnes Cu % Zn % Ag g/t Au g/t
Total Ore Reserve 8,432,000 2.3 4.3 39 1.1
Total Resource 13,986,000 2.1 4.3 38 1.0
Reference: IGO ASX Release 19/10/2012 for Annual Report: Stockman Project Mineral Resource Statement
IGO ASX Release 31/01/2013 for Quarterly Activities Report to 31 December 2012
For
per
sona
l use
onl
y

L
l
L
l
STOCKMAN PROJECT (IGO 100%)
FEASIBILITY STUDY
24
Two underground mines - Wilga and Currawong
Feeding a 1Mtpa flotation plant over 9 years
LOM Payable Metals 144,000t Cu, 229,000t Zn, 4.1Moz Ag & 44,000oz Au
Recent gold discovery at Bigfoot prospect, 300m north of Currawong deposit,
a potential game changer
Enhanced Feasibility Study underway
For
per
sona
l use
onl
y

L
l
Near mine high grade “Bigfoot style” mineralisation
Significant untested potential for VMS and Gold deposits
Historical 1970s regional exploration never assayed for gold
IGO high powered TEM system detected New “Eureka” target below Bigfoot
STOCKMAN PROJECT (IGO 100%)
EXPLORATION POTENTIAL
25
For
per
sona
l use
onl
y

L
l
L
l Scoping Study commenced.
Potential to increase resources down dip and along strike.
KARLAWINDA GOLD PROJECT (IGO 100%)
BIBRA PROSPECT CROSS-SECTION
Reference: IGO 28/06/2012 ASX Release for Karlawinda Gold Project 26
For
per
sona
l use
onl
y

L
l
Long term exploration asset to find new Australian mineral camps.
293,000 geochemical samples collected by De Beers over 30 years.
IGO analysing samples for 57 elements including Ni, Cu, Pb, Zn, Au,
Ag, Pt, Pd, U, rare earths, Sn, Li, K etc.
Over 49,000 samples analysed to date generating numerous
geochemical anomalies.
IGO has pegged a number of previously unknown gold, copper, zinc
and tin anomalies.
Sample coverage
Sample storage
DE BEERS DATABASE (IGO 100%)
No buy-back or royalties in future mineral discoveries
27
L
l
For
per
sona
l use
onl
y

L
l
DE BEERS DATABASE (IGO 100%)
28
L
l UNLOCKING THE POTENTIAL
De Beers Targets Under Review
71 Gold Anomalies
33 Base Metal Anomalies
3 Other/Strategic Metal Anomalies
Anomalous base metal and sulphur rich gossan
found by Independence Group geologists following
upstream from a De Beers stream sediment sample
For
per
sona
l use
onl
y

29
IGO STRATEGIC OBJECTIVES
Future Target : Sustainable Annual A$200M
Cash flow from Operations
3 Operating Mines
Tropicana (IGO 30%)
Long Nickel Operation
(100%)
Bentley Base Metal
Operation (100%)
Project Development
Pipeline
Stockman
Karlawinda
Exploration
Near Mine
Extensions
Brownfields
Greenfields
30.2 58.9 52.8 31.9 38.2
0
50
100
150
200
2009 A 2010 A 2011 A 2012 A HALF YEARONLY- YTD
2014 2015 2016 2017 2018
A$M Cashflow From Operations
Cashflow From Operations
Target Annual Cashflow with Tropicana, Long & Bentley at full production
For
per
sona
l use
onl
y

L
l
L
l
IGO TRANSFORMATION
30
GROWING A GREAT
AUSTRALIAN MINING COMPANY
Planning for the Next Ten Years
Continue and Improve our excellent safety record
Target annual sustainable A$200M Cashflow
from Operations
Target Low cash costs Long: A$4.80-5.00lb Ni
Jaguar: A$0.30-0.50lb Zn
Tropicana A$580-630oz Au
Innovation in mining, metallurgy and exploration
Find the “Big One”
New Australian Precious or Base Metal Discoveries
New High Grade Gold Argentina
Pay consistent dividends
For
per
sona
l use
onl
y

Perth Office
Chris Bonwick, Managing Director
Suite 4, Level 5, South Shore Centre
85 South Perth Esplanade
South Perth, Western Australia, 6151
PO Box 496, South Perth,
Western Australia, 6951
Telephone: +61 8 9238 8300
Facsimile: +61 8 9238 8399
Email: [email protected]
Website: www.igo.com.au
ASX Code: IGO
INDEPENDENCE GROUP
CONTACT DETAILS L
l
L
l
31
For
per
sona
l use
onl
y

L
l
L
l
APPENDIX
RESERVES AND RESOURCES
STATEMENTS
32
For
per
sona
l use
onl
y
L
l
L
l
RESERVES AND RESOURCES
Classification Tonnes Ni% Ni Tonnes Classification Tonnes Ni% Ni Tonnes
LONG Measured 47,000 3.7 1,700 LONG
Indicated 220,000 5.1 11,200 Proven 5,000 3.0 100
Inferred 167,000 5.1 8,600 Probable 91,000 2.6 2,400
Total 434,000 5.0 21,500 Total 96,000 2.6 2,500
MORAN Measured - - - MORAN
Indicated 498,000 7.1 35,300 Proven - - -
Inferred 11,000 5.3 600 Probable 768,000 4.1 31,700
Total 509,000 7.0 35,900 Total 768,000 4.1 31,700
VICTOR Measured - - - VICTOR
SOUTH Indicated 53,000 7.3 3,900 SOUTH Proven - - -
Inferred 34,000 1.5 500 Probable 55,000 4.2 2,300
Total 87,000 5.1 4,400 Total 55,000 4.2 2,300
McLEAY Measured 49,000 7.2 3,600 McLEAY
Indicated 145,000 5.5 7,900 Proven 63,000 2.4 1,500
Inferred 79,000 4.2 3,300 Probable 139,000 2.8 3,900
Total 273,000 5.4 14,800 Total 202,000 2.7 5,400
GRAND TOTAL 1,303,000 5.9 76,600 GRAND TOTAL 1,121,000 3.7 41,900Reference: IGO 19/10/2012 Annual Report - Long Operation Mineral Resource and Ore Reserve Statement
Mineral Resources 30 June 2012
LONG NICKEL OPERATION
Ore Reserve 30 June 2012
Cut-off 1% Ni at Economic Ni Cut-off
33
For
per
sona
l use
onl
y

L
l
L
l
RESERVES AND RESOURCES
34
Tonnes Grade
Contained
Gold Tonnes Grade
Contained
Gold
Classification (Mt) (g/t)1
(Moz)2
Classification (Mt) (g/t)3
(Moz)4
Measured 29.8 2.1 2.03
Indicated 76.4 2.0 4.78 Proven 25.8 2.3 1.90
Inferred 11.9 2.8 1.08 Probable 30.6 2.0 2.01
TOTAL 118.0 2.1 7.89 TOTAL 56.4 2.2 3.91
Notes:
(1) Cut-off: 0.3g/t Au for transported and saprolite, 0.4g/t Au for transitional and fresh material, 1.73 g/t Au underground.
(2) Havana, Tropicana and Boston Shaker A$1,500/oz Au optimisation.
(3) Cut-off: 0.4g/t Au for transported and upper saprolite, 0.5g/t Au for lower saprolite, 0.6g/t Au for saprock, 0.7g/t Au fresh ore.
(4) A$1,210/oz Au optimisation.
References: IGO & AGA 4/12/2012 ASX Release for Tropicana Gold Project Mineral Resource Estimate
IGO & AGA 27/7/2011 ASX Release for Reserve Estimate
TROPICANA GOLD PROJECT JVMineral Resources
December 2012
Ore Reserves
June 2011
For
per
sona
l use
onl
y

L
l
L
l
RESERVES AND RESOURCES
Classification Tonnes Cu% Zn% Ag g/t Au g/t Classification Tonnes Cu% Zn% Ag g/t Au g/t
JAGUAR Measured 429,000 2.5 4.4 61 - JAGUAR Proven 73,000 1.9 0.5 15 -
Indicated 129,000 1.8 2.6 32 - Probable 6,000 1.5 0.4 10 -
Inferred 31,000 2.6 2.7 43 - Total 79,000 1.8 0.4 14 -
Stockpiles 6,000 1.9 3.7 54 -
Total 595,000 2.3 3.9 54 BENTLEY Proven - - - - -
Probable 2,373,000 1.3 8.5 100 0.5
BENTLEY Measured - - - - - Total 2,373,000 1.3 8.5 100 0.5
Indicated 2,118,000 1.7 10.5 125 0.7
Inferred 795,000 2.5 9.6 160 0.9
Stockpiles 1,000 0.8 6.5 66 0.3 GRAND TOTAL 2,452,000 1.3 8.2 98 -
Total 2,914,000 1.9 10.2 134 0.7
Mineral Resources - August 2009
TEUTONIC Measured - - - - -
BORE Indicated 946,000 1.7 3.6 65 -
Inferred 608,000 1.4 0.7 25 -
Total 1,554,000 1.6 2.5 49 -
GRAND TOTAL 5,063,000 1.9 7.1 99
Reference: IGO 19/10/2012 Annual Report - Jaguar/Bentley Operation Mineral Resource and Ore Reserve Statement
JAGUAR / BENTLEY OPERATION
Mineral Resources 30 June 2012
JAGUAR / BENTLEY OPERATION
Ore Reserve 30 June 2012
35
For
per
sona
l use
onl
y

L
l
L
l
RESERVES AND RESOURCES
STOCKMAN PROJECTMineral Resources 30 June 2012 Ore Reserve 31 December 2012
Classification Tonnes Cu% Zn% Ag g/t Au g/t Classification Tonnes Cu% Zn% Ag g/t Au g/t
CURRAWONG Indicated 9,548,000 2.0 4.2 42 1.2 Proven 0 0 0 0 0
Inferred 781,000 1.4 2.2 23 0.5 Probable 7,333,000 2.2 4.1 40 1.2
Total 10,329,000 2.0 4.0 40 1.1 Total 7,333,000 2.2 4.1 40 1.2
WILGA Indicated 2,987,000 2.0 4.8 31 0.5 Proven 0 0.0 0.0 0 0.0
Inferred 670,000 3.7 5.5 34 0.4 Probable 1,099,000 2.5 5.3 30 0.5
Total 3,657,000 2.3 4.9 32 0.5 Total 1,099,000 2.5 5.3 30 0.5
GRAND TOTAL 13,986,000 2.1 4.3 38 1.0 8,432,000 2.3 4.3 39 1.1
* Inferred Au grades for Wilga
Reference: IGO 19/10/2012 Annual Report -Stockman Project Mineral Resource Statement
IGO 31/01/2013 ASX Release for Quarterly Activities Report 20 31 December 2012 36
For
per
sona
l use
onl
y

L
l
L
l
RESERVES AND RESOURCES
Tonnes Au Grade Contained Au
(Mt) (g/t) (oz)
Laterite 2.2 1.1 77,100
Upper Saprolite 0.9 1.1 31,000
Lower Saprolite 1.9 1.1 63,600
Transitional 2.1 1.0 68,200
Sub-total 7.1 1.1 239,900
Fresh 11.4 1.1 434,300
TOTAL INFERRED 18.5 1.1 674,300
Reference: IGO 28/06/2012 ASX Release - Bibra Resources Estimate (Au (oz) figures have been rounded to nearest 100oz)
Mineralisation Type
KARLAWINDA GOLD PROJECT :
BIBRA DEPOSIT (INFERRED RESOURCES - JUNE 2012)
37
For
per
sona
l use
onl
y

L
l
L
l
Notes:
The information in this summary presentation that relates to Exploration Results is based on information compiled by Mr
Christopher M Bonwick who is a full-time employee of the Company and is a member of the Australasian Institute of Mining
and Metallurgy. Mr Bonwick has sufficient experience which is relevant to the style of mineralisation and type of deposit under
consideration and to the activity which he is undertaking to qualify as a Competent Person as defined in the 2004 Edition of the
‘Australasian Code for Reporting of Exploration Results, Mineral Resources and Ore Reserves’. Mr Bonwick consents to the
inclusion in the report of the matters based on his information in the form and context in which it appears.
The information in this summary presentation that relates to Mineral Resources or Ore Reserves is a compilation of previously
published data for which Competent Persons consents were obtained. Their consents remain in place for subsequent releases
by Independence Group NL of the same information in the same context, until the consent is withdrawn or replaced by a
subsequent report and accompanying consent. Public releases to the ASX of Mineral Resources or Ore Reserves have been
referenced on each slide in this summary presentation, in accordance with clause 5 of the 2004 edition of the ‘Australasian
Code for Reporting of Exploration Results, Mineral Resources and Ore Reserves’. These references include the Competent
Persons consent for each Mineral Resource or Ore Reserve.
COMPETENT PERSONS STATEMENTS
38
For
per
sona
l use
onl
y


![Village of Rosedale - LLA Default Homepageapp1.lla.state.la.us/PublicReports.nsf/D4398D85B9... · JND] l>l Ni)] NI AUDIIOK SKI POK I ON C OMPl IA\( T M)K I ACII MAJOR PKOOKAM](https://img.pdfslide.us/doc/110x75/5d3c16cb88c99348578c739d/village-of-rosedale-lla-default-jnd-ll-ni-ni-audiiok-ski-pok-i-on-c-ompl.jpg)