Embed Size (px)
Citation preview

Group Spinner: Recognizing & Visualizing Learning in the Classroom for Reflection, Communication & Planning
Ahmed Kharrufa1, Sally Rix2, Timur Osadchiy1, Anne Preston3, Patrick Olivier1 1Open Lab, Newcastle University
Newcastle upon Tyne, UK
{ahmed.kharrufa, t.osadchiy,
patrick.olivier}@newcastle.ac.uk
2Newcastle University
Newcastle upon Tyne, UK
3Kingston University,
Kingston upon Thames, UK
ABSTRACT
Group Spinner is a digital visual tool intended to help
teachers observe and reflect on children’s collaborative
technology-enhanced learning activities in the classroom.
We describe the design of Group Spinner, which was
informed by activity theory, previous work and teachers’
focus group feedback. Based on a radar chart and a set of
indicators, Group Spinner allows teachers to record in-class
observations as to different aspects of group learning and
learning behaviors, beyond the limited knowledge
acquisition measures. Our exploratory study involved 6
teachers who used the tool for a total of 23 classes in subjects
ranging from Maths and Geography to Sociology and Art.
Semi-structured interviews with these teachers revealed a
number of different uses of the tool. Depending on their
experience and pedagogy, teachers considered Group
Spinner to be a valuable tool to support awareness,
reflection, communication, and/or planning.
Author Keywords
Technology enhanced learning; collaboration; reflection;
schools/educational setting; radar-chart; observation.
ACM Classification Keywords
H.5.0 Information Interfaces and Presentation: General
INTRODUCTION For the past two decades there has been an increasing
pressure on schools to focus more on the teaching of 21st
century skills [17], integrate more technology in the
classroom [30] and adapt to changing ideas about knowledge
and learning [44]. This dynamic educational landscape has
given rise to significant challenges in recognizing the impact
of such changes on students’ learning. Standardized
assessments facilitated by ‘high stakes’ testing “encourage
engagement with learning only insofar that it serves the
achievement of the outcome” [21].
When it comes to technology based learning interventions,
attempts to identify the impact of the use of technology
within education must go beyond input-output tests and
measure the broader pattern of use [8]. What is measured by
standardized tests is, to a large extent, shaped by concepts of
learning and knowledge developed prior to the digital age
[44]. Technology’s expected role – as a tool, a learning
support or as an agent of change – and its expected
contributions must be taken into consideration [35]. As
McFarlane highlights, while some learning technologies may
not (or are not intended to) support the acquisition of
knowledge, their positive effects are on the development of
‘skills’ such as problem-solving, critical thinking, autonomy,
confidence and information-building – highly desirable skills
for members of modern society.
Thus a challenge for teachers is to incorporate and evidence
a wider variety of learning opportunities in the classroom.
New approaches and tools are needed to support teachers to
reflect on their practice in these new settings, as well as
recognize development in students’ learning and learning
behaviors beyond basic subject knowledge.
Figure 1. Annotated crop of Group Spinner’s interface
showing current and previous session graphs along with
some indicators.
Copyright is held by the owner/author(s).
CHI 2017, May 06-11, 2017, Denver, CO, USA ACM 978-1-4503-4655-9/17/05.
http://dx.doi.org/10.1145/3025453.3025679
Classroom Tools CHI 2017, May 6–11, 2017, Denver, CO, USA
5556

We describe the design process and present an exploratory
study of Group Spinner, an interactive visualization tool
based on a radar-chart and a set of indicators that allows
teachers to record in-class observations of different aspects
of group learning and learning behaviors. Group Spinner
allows teachers (and potentially students) to tag positive
observable behaviors according to a predefined rubric. These
tags are incorporated in a radar-chart diagram that allows a
quick recording and visualization of each group’s
performance with respect to the rubric (see Figure 1). With
repeated use, Group Spinner can help teachers to track
changes in students’ learning/learning behavior with a view
to visually communicate these changes to students and to
inform planning and even pedagogy of future sessions.
Our research goals evolved during the research process from
designing an evaluation tool for recognizing/ visualizing
learning, to exploring its general use for teachers. We
therefore conducted an exploratory study with six teachers,
who used the tool for a total of 23 classes in subjects ranging
from Mathematics and Geography to Sociology and Art. Our
contribution is three-fold: 1) the introduction of Group
Spinner as a digital tool to support teachers in technology-
enhanced group learning activities; 2) the identification of
insights into different use cases and the potential benefits of
Group Spinner based on teachers’ feedback in an exploratory
study; and, 3) an understanding of teacher practices and
concerns in technology-enhanced group-based lessons.
RELATED WORK
Collaborative technology in the classroom
Existing research on educational technology has mainly
focused on understanding the role of technology from
researchers’ perspectives. That is, it overlooked how
teachers can observe and understand the role of technology
with regards to students’ learning and behavior. This is
unsurprising as evaluating learning resulting from the use of
technologies targeting collaboration or higher level skills is
not straight forward, and is normally done through extensive
qualitative analysis (e.g. [19,26,28]). Dillenbourg and
Jermann’s work on classroom orchestration [9] aimed at
providing a model for analyzing (and designing) technology
use in the classroom. The model brings researchers’ attention
to a wide range of factors under the themes of teacher
centrism, cross-plane integration, sequentiality, time
management and physicality. However, its focus is more on
how teachers orchestrate (manage) the classroom in the
presence of technology than on students’ learning side of
things. Accordingly, while this model has been used by
researchers looking at collaborative technology for the
classroom (e.g. [24,34]), its use meant that it focused the
analysis on understanding technology’s role in supporting
teachers in their ‘orchestration’ activities.
Taxonomies for assessing learning
A number of taxonomies have been developed to help
teachers in assessing students’ learning. The SOLO
taxonomy (Structure of the Observed Learning Outcome)
provides a framework which enables teachers to focus on
quality of learning rather than quantity. It is defined as “a
systematic way of describing how a learner’s performance
grows in complexity when mastering many academic tasks.”
[4:87]. SOLO is widely used by teachers as an effective tool
to evaluate the learning outcome of an open task, where
students are empowered to construct their own learning as
opposed to reconstructing, or regurgitating, information they
have already been given. Despite this, SOLO is still clearly
focused on learning outcomes: that is, the knowledge and
understanding of content. The learning processes that
students engage in are disregarded, meaning that learning
remains a knowledge-driven pursuit and the behaviors that
enable students to effectively acquire that knowledge and
understanding are ignored.
Bloom’s Taxonomy of Educational Objectives [5,27] and its
subsequent revisions [1] widens the scope of behaviors to
observe. The usefulness of this template lies in it being able
to support teachers in the design of curricula and classes
which integrate plans for learning behaviors across three
domains (Cognitive, Affective and Psychomotor) and to
structure learning objectives in a progressive linear sequence
moving from simple (remembering) to more complex
(evaluating) behaviors. The increased use of digital
technology in the classroom led to the development of
Bloom’s Digital Taxonomy [7], whereby different digital
tools are aligned to the types of behaviors they can facilitate
and where collaboration is a common thread running
throughout. However, neither taxonomy recognizes the
complex and dynamic nature of learning processes and,
where technology is concerned, student-driven appropriation
of the different tools available to them. The Digital
Taxonomy also reduces characterizations of learning to a
limited number of descriptors and tools, where the ultimate
goal is assessment rather than leveraging the affordances of
technology for learning design.
Starkey [44] highlighted shortcomings in both SOLO and
Bloom’s taxonomies and proposed the ‘digital age learning
matrix’. Her main criticism of SOLO taxonomy was its
narrow focus on knowledge within the learner and that it did
not pay due regard to knowledge creation and the connected
nature of learning in the digital world. While Bloom’s
taxonomy addressed knowledge creation, it was considered
too linear and not appropriate for use as a holistic tool.
Starkey’s matrix was developed as a research tool for the
analysis and evaluation of teachers’ activities that
incorporates the use of technologies in the classroom. The
matrix combines elements of observed use of technology
(accessing information, presenting, processing information,
and gaming) with levels of learning (doing, thinking about
connection, thinking about concepts, critiquing and
evaluating, knowledge creation and knowledge sharing).
While more holistic, Starkey’s matrix is still knowledge-
oriented and does not adapt to the new rules/culture of more
innovative classrooms by incorporating subjective aspects of
learning (such as motivation and engagement) and, in
Classroom Tools CHI 2017, May 6–11, 2017, Denver, CO, USA
5557

regards to collaboration, only takes the perspective of
knowledge sharing.
Other dedicated frameworks do exist for several different
desirable learning skills and behaviours. For example,
Limberg’s [31] typology enables us to understand the
characteristics of students’ Information Seeking behaviour,
and Guilloteaux et al. [18] addresses motivation and
engagement. However, these do not address how such
processes might coexist in students’ learning experience.
Studies to assess learning
In an attempt to examine the impact of a statewide
technology coaching program for teachers, Lowther et al’s
[33] mixed methods study found that while data based on
students assessment and achievement records showed that
gains in high-stakes tests were mixed, it was the classroom
observations that revealed the changes in students’ behavior.
Such behaviors included more frequent engagement in
research, project-based learning and use of technology.
However, the classroom observations were carried out by
researchers trained for a specific observation protocol of
computer use, one that involved counting the number of
times certain activities (such as cooperative learning and
hands-on activity) occurred.
Moving from collecting data to presenting data, Ikuta and
Gotoh [22] and Narumi and Gotoh [39] described the
development and evaluation of a tool for visualizing learning
outcomes. Their approach used radar chart visualizations of
four learning outcomes: knowledge and understanding,
domain-specific skills, generic skills and attitude. The
approach has a superficial similarity to Group Spinner, but is
in fact a highly structured and restricted output-only set of
radar charts that are intended to create a visual summary of
students’ formal assessment results over the course of their
undergraduate studies. The graphs are drawn automatically,
created through a complex process of mapping proportions
of different module assessment to each learning outcome and
aggregating all the students’ assessment results. The
visualizations formed part of the students’ e-portfolios and
were intended to help students reflect on their learning,
establish their own learning targets and become more
independent in their learning.
While such approaches expand the measure of learning
beyond domain-knowledge, the reliance on performance
assessments serves to enforce the traditional emphasis on
formal assessment. Dintzner et al. [10] used radar charts and
curriculum mapping to visualize how the different courses in
a pharmacy doctoral program contribute to the programmatic
“big picture”. This again is used as an organizational,
output-only, visual tool to compare the contribution of the
different courses to different competences rather than a tool
for teachers or students.
Activity Theory
Unlike taxonomies and tools that are developed with
specific goals in mind, Activity Theory (AT) [38,42] can
provide a holistic framework for a wider exploration of
learning processes. Developed originally as a general
framework for studying human practices as a development
process both at the individual and social level, it has been
widely used in education where learning becomes the
practice being studied [2,12,23,43]. AT’s conceptualization
of learning has three main elements: a subject (the learners);
the object (task or activity); and a tool/instrument (a
computer or a skill) [23]. Engeström, in his book ‘Learning
by Expanding’ [11] developed the application of AT for
education by incorporating the community (stakeholders in
the learning process), the rules that govern the subject
behavior within the community and the learning context, and
the division of labor to achieve the objective (see Figure 2).
While providing a framework for exploration, the abstract
nature of AT makes it difficult to operationalize as a tool for
teachers in their daily practice.
Finally, most previous research fails to accommodate student
development over time, focusing instead on providing
snapshots of students’ performance – typically of one
learning task. Indeed, the literature identifies a lack of
teacher-oriented practical tools to scaffold the provision of
more holistic views of students’ learning and learning
behavior; this is the key motivation for Group Spinner.
GROUP SPINNER: DESIGN AND DEVELOPMENT
Group Spinner’s original motivation was to help teachers
recognize and record progress in students learning and
learning behaviors beyond the limited scope of assessment
of knowledge acquisition. We drew on: 1) AT’s view on
learning [11] to provide a frame for identifying relevant
observable behaviors; 2) the use of the radar-chart (e.g.
[10,22,39]) as a tool to visualize measures of diverse
behaviors in one chart as well as the change of these
measures over time; and 3) existing taxonomies and
guidelines to inform the development of a structured
observation protocol for each behavior (a rubric). The design
of Group Spinner was undertaken in five phases: 1) the
development of the radar chart and its axes; 2) a focus group
with teachers; 3) the development of an exemplar rubric; 4)
a paper-based prototype trial; and 5) development of a fully
functional digital prototype.
Figure 2. The structure of a human activity system [11:63]
Classroom Tools CHI 2017, May 6–11, 2017, Denver, CO, USA
5558
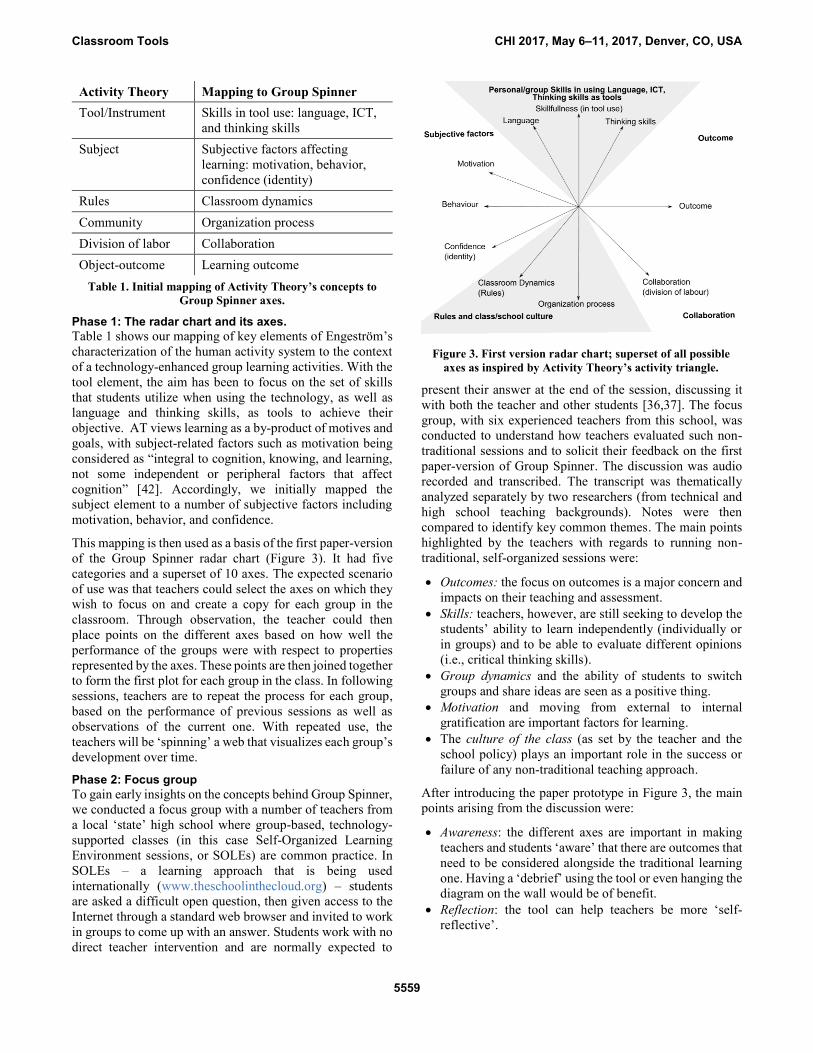
Phase 1: The radar chart and its axes.
Table 1 shows our mapping of key elements of Engeström’s
characterization of the human activity system to the context
of a technology-enhanced group learning activities. With the
tool element, the aim has been to focus on the set of skills
that students utilize when using the technology, as well as
language and thinking skills, as tools to achieve their
objective. AT views learning as a by-product of motives and
goals, with subject-related factors such as motivation being
considered as “integral to cognition, knowing, and learning,
not some independent or peripheral factors that affect
cognition” [42]. Accordingly, we initially mapped the
subject element to a number of subjective factors including
motivation, behavior, and confidence.
This mapping is then used as a basis of the first paper-version
of the Group Spinner radar chart (Figure 3). It had five
categories and a superset of 10 axes. The expected scenario
of use was that teachers could select the axes on which they
wish to focus on and create a copy for each group in the
classroom. Through observation, the teacher could then
place points on the different axes based on how well the
performance of the groups were with respect to properties
represented by the axes. These points are then joined together
to form the first plot for each group in the class. In following
sessions, teachers are to repeat the process for each group,
based on the performance of previous sessions as well as
observations of the current one. With repeated use, the
teachers will be ‘spinning’ a web that visualizes each group’s
development over time.
Phase 2: Focus group
To gain early insights on the concepts behind Group Spinner,
we conducted a focus group with a number of teachers from
a local ‘state’ high school where group-based, technology-
supported classes (in this case Self-Organized Learning
Environment sessions, or SOLEs) are common practice. In
SOLEs – a learning approach that is being used
internationally (www.theschoolinthecloud.org) – students
are asked a difficult open question, then given access to the
Internet through a standard web browser and invited to work
in groups to come up with an answer. Students work with no
direct teacher intervention and are normally expected to
present their answer at the end of the session, discussing it
with both the teacher and other students [36,37]. The focus
group, with six experienced teachers from this school, was
conducted to understand how teachers evaluated such non-
traditional sessions and to solicit their feedback on the first
paper-version of Group Spinner. The discussion was audio
recorded and transcribed. The transcript was thematically
analyzed separately by two researchers (from technical and
high school teaching backgrounds). Notes were then
compared to identify key common themes. The main points
highlighted by the teachers with regards to running non-
traditional, self-organized sessions were:
Outcomes: the focus on outcomes is a major concern and
impacts on their teaching and assessment.
Skills: teachers, however, are still seeking to develop the
students’ ability to learn independently (individually or
in groups) and to be able to evaluate different opinions
(i.e., critical thinking skills).
Group dynamics and the ability of students to switch
groups and share ideas are seen as a positive thing.
Motivation and moving from external to internal
gratification are important factors for learning.
The culture of the class (as set by the teacher and the
school policy) plays an important role in the success or
failure of any non-traditional teaching approach.
After introducing the paper prototype in Figure 3, the main
points arising from the discussion were:
Awareness: the different axes are important in making
teachers and students ‘aware’ that there are outcomes that
need to be considered alongside the traditional learning
one. Having a ‘debrief’ using the tool or even hanging the
diagram on the wall would be of benefit.
Reflection: the tool can help teachers be more ‘self-
reflective’.
Activity Theory Mapping to Group Spinner
Tool/Instrument Skills in tool use: language, ICT,
and thinking skills
Subject Subjective factors affecting
learning: motivation, behavior,
confidence (identity)
Rules Classroom dynamics
Community Organization process
Division of labor Collaboration
Object-outcome Learning outcome
Table 1. Initial mapping of Activity Theory’s concepts to
Group Spinner axes.
Figure 3. First version radar chart; superset of all possible
axes as inspired by Activity Theory’s activity triangle.
Classroom Tools CHI 2017, May 6–11, 2017, Denver, CO, USA
5559

Communication: the tool could be used as a “good
communication device, to communicate in your learning
and get, for own personal target setting”. One suggested
use case was to stop halfway through a session and have
discussions such as “Look at this. Which are we best at?
Which are we worst at? Where are we making best
progress? Where’s the change?”
Planning: the tool could be used to plan sessions based
on the previous ones to “move things forward”.
Need for a rubric: a taxonomy is desirable. The SOLO
taxonomy was suggested as an example to help identify
where to place a certain point on the axes.
Generalizability: the potential benefits of the tools were
seen as applicable for any group task, not confined to the
self-organized learning environment context.
Finally, the teachers identified two major points of concern
with the tool: (1) Complexity: There is a need to reduce the
number of axes, to make it relevant to the activity at hand
and increase its usability; 2) Workload: there was a concern
about the additional effort required to use it in class, with one
experienced teacher explaining that Group Spinner would
just be “another layer” of work.
The focus group confirmed our view that too much emphasis
is put on assessing traditional learning outcomes. It also
confirmed the importance of the identified axes including
subjective factors (motivation), skills (critical thinking),
group dynamics (collaboration) and classroom culture. In
addition to validating some of our motivations and design
choices, the insights from the focus group changed how we
viewed the potential use of the tool and accordingly our
overall research goals. We no longer aimed to study Group
Spinner simply as an evaluation tool, but to explore its
general use to support teachers. Most importantly, the notion
of using it as a reflection tool for the teacher and a
communication tool to discuss and reflect on progress with
students during or after sessions. Teachers also talked about
using Group Spinner as a planning tool based on previous
observations. This led us to make two important design
decisions: 1) identify a core set of axes, and 2) provide a clear
rubric for each axis.
Phase 3: An exemplar rubric
Self-Organized Learning Environment sessions present a
good context to identify core axes and rubrics needed for
Group Spinner, given its collaborative nature, reliance on the
use of technology as a mediating tool (the Internet), its view
of learning as extending beyond knowledge acquisition, and
its need for minimum teacher scaffolding (allowing teachers
to observe the class). For this context we used five axes: 1)
Information Seeking (the use of the Internet/critical thinking
as tools); 2) Outcome; 3) Collaboration (division of labour);
4) Working within SOLEs (context-specific culture/rules);
and 5) Motivation and Engagement (subjective factors).
These axes, along with their rubric, link to most of the main
aspects covered by AT and reflect the key points raised in the
focus group. The underlined numbered points in the
following descriptions show the rubric’s main observable
indicators:
(1) Information Seeking
Students are increasingly relying on the use of the Internet in
their assignments and in the classroom, making information
seeking a key 21st century skill. In settings that promote
learner independence, this is done with no—or minimal—
guidance [36]. However, students are not necessarily
equipped with effective information seeking skills, often
stopping at the first information they encounter and building
answers from the most readily available information rather
than the most accurate or persuasive [20]. An inability to
navigate the Internet to answer difficult questions and
attendant frustration have been apparent in SOLE research
[41]. Limberg’s typology [31,32] was adopted as a criteria
for observing effective information seeking. It reflects a clear
progression of the sophistication of information management
from: (1) Fact Finding, to (2) Balancing Information to find
a position and finally to (3) Scrutinizing and Analyzing. This
model is also applicable to digital environments because the
affective and constructive elements of the process remain the
same [29]. Moreover, these behaviors are easily observable
by watching students and listening to their conversations.
(2) Outcome
Evaluating outcomes can be difficult for teachers in settings
where diversity of information and outcomes are welcome.
It is appropriate to consider both how much and how well
students have learned, with Biggs and Collis [3] suggesting
that the latter is much more challenging. Limberg [31] found
that there was significant overlap between how students
experienced information seeking and what learning outcome
was achieved: students who predominantly worked within
the simple fact finding stage typically obtained an outcome
best described as fragmentary knowledge, while those
scrutinizing and analyzing information showed critical
assessment grounded in understanding and evaluation. This
approach to constructing answers worked well with SOLO
taxonomy [3], as it offers a framework within which teachers
can evaluate the quality of an answer that they could not have
anticipated. SOLO begins at the prestructural level, whereby
students present: (1) No or Incorrect Information, to the
unistructural, where they focus on (2) Facts on One Aspect,
to multistructural where they offer (3) Multiple Aspects but
with No Links, relational, where they show (4) Development
of an Answer and finally extended abstract, in which they go
beyond the information they found to (5) Apply Information
to New Areas. Within this evaluative framework, students
can gain credit for quantitative increases in knowledge up to
the third level, at which point qualitative increases in
understanding are required [4].
(3) Collaboration
When the teacher is not expected to be directly involved
during group activities, students rely on their peers for
support. A model examining the use of digital technology
must therefore address the collaborative nature of knowledge
creation and use [44]. However, as Wiener [45] puts it
Classroom Tools CHI 2017, May 6–11, 2017, Denver, CO, USA
5560

“Students put into groups are only students grouped and are
not collaborators, unless a task that demands consensual
learning unifies the group activity”. Students may appear to
be working together to find a common answer by sharing
some resources and doing actions together. However, when
asked separately they may give different answers, indicating
an absence of true attempts to engage in discussions aiming
to reach a common ground and a consensus. Thus, reaching
consensus is one of the key elements expected from effective
group collaboration [45]. There are a number of observable
behaviors that give positive indications that some type of
collaboration is happening [13,15,45] of which we selected:
(1) Sharing Resources; (2) Joint Actions; (3) Mutual
Planning; (4) Equal Participation; (5) Communication; and
(6) Reaching Consensus.
(4) Context-Specific: Working within SOLE
The rubric for ‘Working with SOLE’ was developed on the
basis of numerous observations of SOLE sessions, the
majority of which were at secondary school level (11-18
years). Over the course of more than 50 such observations it
was clear both that students found the adjustment from
‘traditional’ lessons to SOLE challenging (see also [41]), and
that teachers were also unsure of how this different style of
learning might look in practice. This served as further
evidence of the need for context-specific axes for Group
Spinner. In self-organized settings, full responsibility for
learning is handed over to students. Indeed, it can be difficult
for them to understand how to deal with such an extreme
change in their learning environment and we observed a
default behavior of asking the teacher for help. The rubric for
this axis was designed to address these key aspects of SOLE
activities: (1) Taking Responsibility for their learning. The
move from “knowledge hoarding” to (2) Knowledge Sharing
[14] was also problematic for students as they often saw
learning as a competition. Observations showed that students
were typically happy to produce ‘an’ answer, regardless of
whether they fully understood it or believed it was the best
answer. Yet the concept of learning as a process of (3)
Exploration, in which students could satisfy their curiosity,
is central to SOLE. Another defining element of self-
organized learning is (4) Spontaneity, although in our
observations of students the rules and rituals of the
traditional classroom were so entrenched that students would
more readily adopt these in other settings rather than do
something different.
(5) Motivation and Engagement
In learning sciences, motivation is an individual difference
variable used interchangeably to describe why a student does
something, for how long they are willing to do it and how
hard they are going to pursue it. In terms of classroom
practice, motivation is treated by teachers and students as
associated with particular behavioral characteristics. The
associated term ‘engagement’ is also often used to refer to
different types of ‘motivated behavior’. Teachers and
students have very personalized definitions of these
constructs that may or may not be rooted in something which
is evidenced or recognized behaviorally. However, teachers’
and students’ use the terms generally to refer to: ‘why, how
long, how hard, how well, how proactively and in what way
students engage in the learning process’. To provide some
guidance through which motivation might be manifested in
action, we draw on Guilloteaux and Dornyei’s work on the
Motivational Orientation of Language Teaching (MOLT)
Observation Scheme [18]. MOLT was devised to gain
information on students’ ‘situation-specific’ motivation. It
formulates an observation scheme, with specific descriptors
of motivated and motivational-relevant behavior to help
identify the quality of motivational experiences as they
‘happen in time’. The observable ‘motivated behavior’
[16,18] includes three main variables/measures: (1)
Attention and not displaying inattentive or disruptive
behavior; (2) Participation and actively taking part in
discussion linked to the activity; and (3) Volunteering to help
students, groups and the teacher.
Phase 4: Paper-based classroom trial
A member of the research team used a paper-based version
of Group Spinner (a radar chart with the five axes of the
rubric only along with the rubric) to further inform the first
digital version of Group Spinner. The researcher, who has
experience in teaching, running and observing SOLE
sessions, attended two such sessions to observe students and
record these observations on the paper-based radar chart. The
two main insights from this lightweight face-validity
evaluation of the design were: (1) that the rubrics’ details of
observable behaviors were valuable in drawing the
observer’s attention to important and easily observable
aspects of students behavior that may be otherwise missed;
and (2) trying to keep a mental record of these behaviors and
translating them into points on the graph was cognitively
challenging. Functionality to tag behaviors as they are
observed, which could then inform the graph, was seen as
essential for the successful use of the tool.
Phase 5: Design and development of the digital tool
The focus group and the paper trial helped shape the original
design ideas, and led to the following five additional design
features for the digital version of Group Spinner (see Figure
4 and Figure 5):
1. Two clear modes of operation: (a) a rubric-based
indicators mode, focused on tagging behaviors as they
happen (setting indicator values, Figure 5); and a (b)
graph mode which allows viewing and manipulating
points on the graph (while optionally viewing the
indicator values, Figure 4)
2. Navigation: (a) quick navigation between the axes and
their indicators in indicators mode, reducing the need for
scrolling by displaying main headlines for the indicators
(and help for each indicator through a help icon); and (b)
quick scrolling to a specific axis indicator using
navigation links on the sidebar (Figure 5).
3. Incremental control: allow incrementing or
decrementing a value for each indicator representing
Classroom Tools CHI 2017, May 6–11, 2017, Denver, CO, USA
5561

either the number of times a behavior is observed, its
quality, or both (depending on how teachers want to use
it) (Figure 5).
4. Making comparison: (a) display the graph from the
previous session for reference (Figure 4); (b) support
comparing and averaging graphs for all groups for a
certain session, or for all sessions for a certain group.
5. Support multiple groups (or students) per session with a
quick way to switch between groups; allow the creation
of new classes, sessions, and groups (Figure 4).
Group Spinner was designed to be available on most
smartphones, tablets and PCs. It was developed as a
responsive web-app using HTML5, CSS and JavaScript on
the client side with Bootstrap 3, AngularJS and D3.js
frameworks. The server side was built using Python with
Pyramid framework and SQLAlchemy as an Object
Relational Mapper. PostgreSQL was used for the database.
The tool was trialed with one teacher (T1) for two sessions
before making it available to the other teachers. T1
provided early feedback which led to improvements in
switching between the indicators and graph modes, and
better presentation and navigation in the indicators mode.
GROUP SPINNER: USER STUDY
Group Spinner was used over 23 sessions in total (average of
50 minutes per session) by six participants, one primary
school teacher (T1), four secondary school teachers from the
same school (T2-T5), and a practitioner from the research
team (T6) (Table 2). T2-T5 where from the school in which
we conducted the focus group (only T4 had taken part in the
focus group). Training teachers to use Group Spinner took
approximately 10-15 minutes. Teachers ranged in
experience, from one year of teaching with infrequent use of
SOLEs to 10 years of teaching with regular use of SOLES
over the past three years. We conducted semi-structured
interviews (averaging 25 minutes each) individually with the
teachers, except for T6 (a member of the research team) who
provided her feedback in written form. Interviews were
audio recorded and transcribed for analysis.
Our goal was to explore both the different ways in which
teachers use Group Spinner as well as its identified benefits
to teachers and learners. This guided the questions of the
interview, where teachers were asked about how they used
Group Spinner, its perceived value, their perception of
associated workload and their feedback on the ease of
understanding the axes/rubric and the tool itself. The
interview transcripts were analyzed separately by two
researchers (from technical and high school teaching
backgrounds) as with the focus group transcript. The analysis
was first informed by pre-determined themes driven by the
interview questions and subthemes emerging from the focus
group & interview transcripts. We were keen to see if the
teachers’ feedback addressed the same themes that emerged
from the focus group (awareness, reflection, communication,
and planning).
A quote from T5 summarized much of the feedback we
received: “I think as a teacher it does allow you to focus on
those subdivisions within what kids are doing in SOLE and
really think about them…I think that does then maybe alter
your pedagogy around what you do, what you ask kids to do.
As I say one thing that came out for me was something that I
was suspecting anyway, which is I think we need to ban that
presentation, hard presentation methods. But I think, the
crucial thing is what I would have done with it long-term
around the data that is gathered. So then have a really
powerful conversation with the kids”, then added “It is a tool
to allow you to improve pedagogy and debrief”.
Figure 4. The graph mode shows the current/previous
session graphs. The current graph points can be changed by
dragging the control points along the axes. The right side
allows changing sessions/ and groups as well as switching to
the indicators mode.
Figure 5. The indicators mode allows teachers to change the
value of each indicator as well as display a clear description
for each (help icon). The bar to the right allows for quick
navigation to the desired set of indicators.
Classroom Tools CHI 2017, May 6–11, 2017, Denver, CO, USA
5562

How? Observed use cases
(H1) Post-class tagging (T1): T1 struggled with the idea of
using the interface “in situ” and settled on an approach where
she would look at the indicators after the session: “did I think
they had done those things or not?” She would then do the
tagging, giving values based on memory and translating
these into points on the graph. This is potentially a
consequence of her being a tester for an earlier Group
Spinner prototype, in which the navigation design had not
been optimized. None of the other teachers reported
difficulties using Group Spinner during a class.
(H2) Tagging during the class (T2, T3, T6): Teachers tagged
behaviors as they were observed for each of the groups, on
their tablets while walking around the class and talking to
groups. T2 and T3 drew the graphs at the end or immediately
after the sessions, based on the tags and their memory. T6
worked on the graph and the indicators during the session.
(H3) Working on the graph directly (T2, T4): Teachers
walked around the class and talked to groups as normal, but
adjusted the graph directly without using the indicators. T2
used Group Spinner for the first few sessions as in (H2), but
once she got familiar with the indicators she switched to
(H3). Similarly, T4 said that she initially used the criteria to
help her understand what is related to each axis. T4 said that
the process of tagging would take too much lesson time when
she would rather be talking with students, whereas working
directly on the graph was quite quick.
(H4) Systematic observation cycles (T5): T5 did systematic
cycles around the six groups in his class every 10 minutes.
This involved stopping at each group and asking them
questions to identify and tag students’ learning and learning
behavior, and adjusting the graph accordingly at the end of
each cycle. He reported that this was very intensive but he
wanted to capture the rise and fall in students’ performance
throughout the session and not just have a final outcome
(even though the tool only maintains the final state). This
approach prompted discussions with groups such as “I was
really pushing that axis, I’m dragging it down again to get
you to think about why that might be happening.”
For all teachers, judgment for the tagging was based on both
the quantity and the quality of the observed behaviors.
Why? Value for teachers and learners
(W1) Awareness: All teachers referred to the value of the tool
in increasing their awareness about what was happening in
the class. T1, T3, and T4 said that it brought their attention
to, or made them “more aware” (T4) of things they may not
think about (T1: “I had never assessed any of those things
that are on the spinner before.”) T3 initially questioned the
value of the tool, but later said that she found that it helped
her become aware of, and analyze, what each group was
doing as well as concentrate on skills/behaviors that she
might not think about otherwise. T1: “…you have got the
immediate impact of the graph. Then you have got your bits,
statements down the side to back up what has been put on
there” (Figure 1 shows one of T1’s graphs for sessions 6 with
some of the indicators).
(W2) Reflection: T1, T2, and T5 described using the tool to
help them think of, or ‘reflect’ on, their teaching and identify
areas for development. T5: “there is that obvious ability to
then reflect on what you have done, the quality of your
question. How you might adapt SOLE accordingly.”
However, T2 emphasized the importance of the tool at first
use (to be aware of, and think about, the different aspects in
the session) and not necessarily for longitudinal use (due to
limited time, and the independent nature of her sessions).
(W3) Communication: While T1 (who taught 6 to 7 year
olds), T3, and T6 did not use the tool to mediate discussions
with the students, T2, T4 and T5 suggested that this could be
one of the most important benefits of the tool. T4 mentioned
that using the tool as a communication device helped
students be “reflective on how they’ve done” across sessions
and made them aware of what was happening with other
groups. She emphasized that the tool helped make students
aware of the process as “it isn’t an evaluation of what they
did at the end, it’s an evaluation of what they did throughout”. She also stressed the importance and benefits
of the ‘visual’ representation in discussions with students:
“Sometimes there was things that I hadn’t even picked up on
that they then gave value to, which hopefully just having that
conversation, but we would have had that conversation, it
might have changed the focus of it potentially.” T5 echoed
T4’s view on the importance of using the visual tool over a
number of sessions to stimulate discussions with students
and ask questions about what might be the reason for changes
of the points on different axes. According to T5 “I think that
is perhaps its biggest strength actually. Predictably I think
that would be where many teachers would find it to be really
useful, the idea that they have got an evidence base, to talk
to individual groups or even whole groups”. T2 only talked
in terms of potential benefits. T1 and T4 saw potential in
using the tool to talk to school’s management “to show that
SOLE is a worthwhile thing to do” [T1] as the tool helped
look “at the whole child” rather than just ticking objectives.
(W4) Track/Inform/Plan: One of the most interesting
comments was from T5 (quoted earlier) that the tool
encouraged him to rethink how he facilitates self-organized
Sessions Age Subject
T1 7 6-7 Art and SOLE
T2 3 x 2classes 11-12 Math
T3 2 13-14 Geography
T4 2 13-14 Sociology
T5 2 11-12 Geography
T6 4 10-15 Digital & foreign
language skills (summer
school)
Table 2. Sessions with Group Spinner
Classroom Tools CHI 2017, May 6–11, 2017, Denver, CO, USA
5563

sessions. According to T1, T3, and T5 the tool helped in
recognizing progress, and thus could assist in identifying
areas for development. “I was able to use the spinner tool to
show progress, then retract it…You would normally get an
overall feeling for the direction of travel without seeing some
of those barriers or red traffic lights.” [T5]. T6 however, said
that she used the tool at check points just to ‘document
things’.
(W5) Repeated use: T1 who talked the most about the value
of repeated use, used Group Spinner for seven sessions with
the same class. “when I look back I can see immediately
what the focus of that session was…I need to make sure
there are opportunities for making sure it is balanced all the
way round” (Figure 6). Other teachers who have used the tool
two or three times with the same class talked about the
benefits of comparing to a previous lesson, and the potential
benefits for both the teacher in recognizing development,
reflection, and planning (T1, T3, T5) and the students during
post-session debriefings (T4, T5). T1 and T2 drew the graphs
independently of previous sessions and then looked at the
previous sessions for comparisons. Conversely, T3 made use
of the graph from the previous session when creating a new
one.
Did it add to your workload?
Teachers had different views regarding workload,
correlating the load to their use of the tool in the study and
how they may use it in the future. T1 said “Well it is
interesting to fill in so it is something I would be thinking
about anyway.” T3 said “kind of did it within the lesson so
not much”. T4 said that it was “dead easy to use”, but might
have thought otherwise had she worked on the indicators
rather than the graphs directly. T6 claimed it would only add
to the workload if she wanted to study the data and graphs
afterwards. On the other hand, T2 and T5 said that the use of
the tool did add to their workload, either because they wanted
to have conversations with the students (T2) or because of a
systematic approach to visiting and talking to each group
(T5).
Ease of understanding and use
Whilst the feedback was mostly that the axes made sense and
were easy to understand, the participants raised several
issues: T1 said that she struggled with the outcome axis; T2
found the ‘working within SOLE’ indicator quite difficult, as
she found the definition of a ‘perfect scenario’ unclear; and
T5 said that he was not fully convinced by the motivation
and engagement axis. Otherwise, apart from reports from
three teachers about a few cases where updates where not
saved (due to internet connection or multiple login issues),
there were no comments on any usability issues with the app.
Challenges and teachers’ wish list
The main challenge teachers reported relates to time
management. T2 stated that she would be hesitant to use the
tool in the future, as she would not be able to find the time to
use it to engage with students, where she perceived that the
tool was of most value. T3 stated that because in the
beginning she was not fully used to the tool, she felt like at
times it held her back from fully engaging with the students.
T3 also expressed concerns in using it with classes that have
behavior issues, where using the tool and managing behavior
may come into conflict.
T2 and T5 wanted to have a record of the changing values
for each tag during the session, enabling discussions with
students about changes in their behavior/performance within
it. T2 wanted a below zero indicator value for recording
negative behavior. T4 asked for the ability to have school-
wide customizations of axes. Finally, T1 and T6 talked about
there being value in providng the ability to attach
notes/photos to the graph axes (or the indicators). According
to T1 “a lot of early years programs work like that.”
DISCUSSION
During the design process, the focus of the tool shifted from
a tool to help with evaluation to a tool to recognize and
reflect on learning. The focus group and study then extended
this to include communication and planning. Even though
only T4 took part in the study and focus group, the six
teachers’ comments from the study confirmed the same
‘value’ themes of awareness, reflection, communication and
planning. T4, who was skeptical in the focus group and
expressed concerns that the tool would only add another
layer of work, became much more positive about it. She
mentioned that working directly on the graph was ‘dead
easy’ and she was among those who particularly valued the
visualizations as a tool to scaffold conversations with the
students. The feedback from the teachers highlighted a great
variety in how teachers have or would use Group Spinner in
terms of breadth, depth, and frequency/time span. Four
different use cases were identified, mostly determined by the
teachers’ pedagogical approach, their goals behind using
Group Spinner, and the time/effort they were willing to
invest in using it.
An interesting conclusion that can be drawn from the study
is that teachers’ experience in settings like SOLE, their
pedagogy and the age of the students involved could be
linked to the extent to which the teachers perceived the main
value of the tool as a student development tool, or a personal
(teacher) development tool. T2-T5 (all having at least one
Figure 6. Graphs of 6 sessions by T1 with the yet unmodified
graph of session 7.
Classroom Tools CHI 2017, May 6–11, 2017, Denver, CO, USA
5564
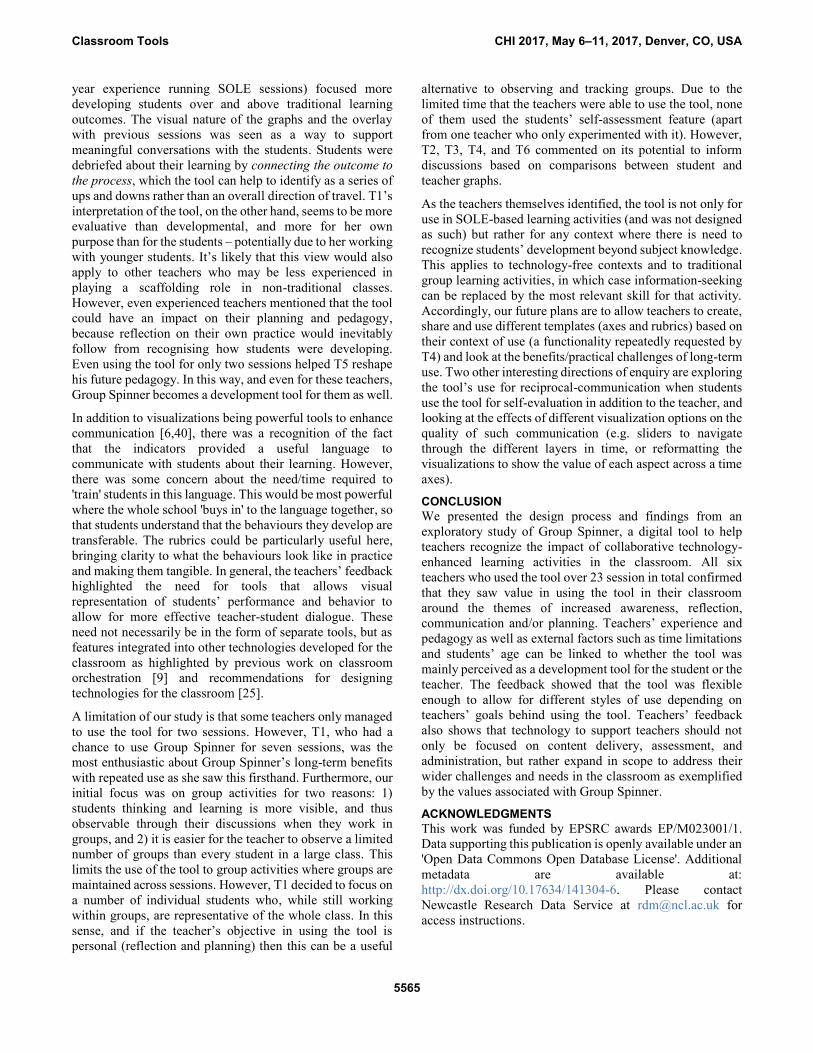
year experience running SOLE sessions) focused more
developing students over and above traditional learning
outcomes. The visual nature of the graphs and the overlay
with previous sessions was seen as a way to support
meaningful conversations with the students. Students were
debriefed about their learning by connecting the outcome to
the process, which the tool can help to identify as a series of
ups and downs rather than an overall direction of travel. T1’s
interpretation of the tool, on the other hand, seems to be more
evaluative than developmental, and more for her own
purpose than for the students – potentially due to her working
with younger students. It’s likely that this view would also
apply to other teachers who may be less experienced in
playing a scaffolding role in non-traditional classes.
However, even experienced teachers mentioned that the tool
could have an impact on their planning and pedagogy,
because reflection on their own practice would inevitably
follow from recognising how students were developing.
Even using the tool for only two sessions helped T5 reshape
his future pedagogy. In this way, and even for these teachers,
Group Spinner becomes a development tool for them as well.
In addition to visualizations being powerful tools to enhance
communication [6,40], there was a recognition of the fact
that the indicators provided a useful language to
communicate with students about their learning. However,
there was some concern about the need/time required to
'train' students in this language. This would be most powerful
where the whole school 'buys in' to the language together, so
that students understand that the behaviours they develop are
transferable. The rubrics could be particularly useful here,
bringing clarity to what the behaviours look like in practice
and making them tangible. In general, the teachers’ feedback
highlighted the need for tools that allows visual
representation of students’ performance and behavior to
allow for more effective teacher-student dialogue. These
need not necessarily be in the form of separate tools, but as
features integrated into other technologies developed for the
classroom as highlighted by previous work on classroom
orchestration [9] and recommendations for designing
technologies for the classroom [25].
A limitation of our study is that some teachers only managed
to use the tool for two sessions. However, T1, who had a
chance to use Group Spinner for seven sessions, was the
most enthusiastic about Group Spinner’s long-term benefits
with repeated use as she saw this firsthand. Furthermore, our
initial focus was on group activities for two reasons: 1)
students thinking and learning is more visible, and thus
observable through their discussions when they work in
groups, and 2) it is easier for the teacher to observe a limited
number of groups than every student in a large class. This
limits the use of the tool to group activities where groups are
maintained across sessions. However, T1 decided to focus on
a number of individual students who, while still working
within groups, are representative of the whole class. In this
sense, and if the teacher’s objective in using the tool is
personal (reflection and planning) then this can be a useful
alternative to observing and tracking groups. Due to the
limited time that the teachers were able to use the tool, none
of them used the students’ self-assessment feature (apart
from one teacher who only experimented with it). However,
T2, T3, T4, and T6 commented on its potential to inform
discussions based on comparisons between student and
teacher graphs.
As the teachers themselves identified, the tool is not only for
use in SOLE-based learning activities (and was not designed
as such) but rather for any context where there is need to
recognize students’ development beyond subject knowledge.
This applies to technology-free contexts and to traditional
group learning activities, in which case information-seeking
can be replaced by the most relevant skill for that activity.
Accordingly, our future plans are to allow teachers to create,
share and use different templates (axes and rubrics) based on
their context of use (a functionality repeatedly requested by
T4) and look at the benefits/practical challenges of long-term
use. Two other interesting directions of enquiry are exploring
the tool’s use for reciprocal-communication when students
use the tool for self-evaluation in addition to the teacher, and
looking at the effects of different visualization options on the
quality of such communication (e.g. sliders to navigate
through the different layers in time, or reformatting the
visualizations to show the value of each aspect across a time
axes).
CONCLUSION
We presented the design process and findings from an
exploratory study of Group Spinner, a digital tool to help
teachers recognize the impact of collaborative technology-
enhanced learning activities in the classroom. All six
teachers who used the tool over 23 session in total confirmed
that they saw value in using the tool in their classroom
around the themes of increased awareness, reflection,
communication and/or planning. Teachers’ experience and
pedagogy as well as external factors such as time limitations
and students’ age can be linked to whether the tool was
mainly perceived as a development tool for the student or the
teacher. The feedback showed that the tool was flexible
enough to allow for different styles of use depending on
teachers’ goals behind using the tool. Teachers’ feedback
also shows that technology to support teachers should not
only be focused on content delivery, assessment, and
administration, but rather expand in scope to address their
wider challenges and needs in the classroom as exemplified
by the values associated with Group Spinner.
ACKNOWLEDGMENTS
This work was funded by EPSRC awards EP/M023001/1.
Data supporting this publication is openly available under an
'Open Data Commons Open Database License'. Additional
metadata are available at:
http://dx.doi.org/10.17634/141304-6. Please contact
Newcastle Research Data Service at [email protected] for
access instructions.
Classroom Tools CHI 2017, May 6–11, 2017, Denver, CO, USA
5565

REFERENCES
1. L.W. Anderson and D. Krathwohl. 2001. A
Taxonomy for Learning, Teaching and Assessing: a
Revision of Bloom’s Taxonomy of Educational
Objectives. Longman, New York.
2. Sasha Barab, Steve Schatz, and Rebecca Scheckler.
2004. Using Activity Theory to Conceptualize
Online Community and Using Online Community
to Conceptualize Activity Theory. Mind, Culture,
and Activity 11, 1: 25–47.
https://doi.org/10.1207/s15327884mca1101
3. John B Biggs and K. F. Collis. 2014. Evaluating the
quality of learning: the SOLO taxonomy (Structure
of the Observed Learning Outcome). Academic
Press, Cambridge.
4. John B Biggs and Catherine Tang. 2011. Teaching
For Quality Learning At University.
5. B. S. Bloom and D. R. Krathwohl. 1956. Taxonomy
of Educational Objectives: The classification of
educational goals. Handbook I: Cognitive Domain.
Longmans, New York.
6. SK Card, JD Mackinlay, and B Shneiderman. 1999.
Readings in information visualization: using vision to think.
7. Andrew. Churches. 2009. Bloom’s digital
taxonomy. Educational origami.
8. C Crook. 1996. Computers and the collaborative
experience of learning. Psychology Press.
9. Pierre Dillenbourg and Patrick Jermann. 2010.
Technology for Classroom Orchestration. In New
Science of Learning. Springer New York, New
York, NY, 525–552. https://doi.org/10.1007/978-1-
4419-5716-0_26
10. Matthew R Dintzner, Eric C Nemec, Kim Tanzer,
and Beth Welch. 2015. Using Radar Plots for
Curricular Mapping to Visualize Assessment in a
New Doctor of Pharmacy Program. American
journal of pharmaceutical education 79, 8: 121.
https://doi.org/10.5688/ajpe798121
11. Yrjö Engeström. 2014. Learning by Expanding.
Cambridge University Press.
12. Yrno Engestrom. 2001. Expansive Learning at
Work: toward an activity theoretical
reconceptualization. Journal of Education and
Work 14, 1: 133–156.
https://doi.org/10.1080/13639080020028747
13. Cresencia Fong. 2009. Guidance and Career
Education Course rubric.
14. Dianne P. Ford and Sandy Staples. 2010. Are full
and partial knowledge sharing the same? Journal of
Knowledge Management 14, 394–409.
https://doi.org/10.1108/13673271011050120
15. Leonardo Giusti, Massimo Zancanaro, Eynat Gal,
and Patrice L. (Tamar) Weiss. 2011. Dimensions of
collaboration on a tabletop interface for children
with autism spectrum disorder. In Proceedings of
the 2011 annual conference on Human factors in
computing systems - CHI ’11, 3295.
https://doi.org/10.1145/1978942.1979431
16. T. Good and J. Brophy. 2003. Looking in
Classrooms. Boston: Allyn & Bacon.
17. Jiangyue Gu and Brian R. Belland. 2015. Preparing
Students with 21st Century Skills: Integrating
Scientific Knowledge, Skills, and Epistemic Beliefs
in Middle School Science Curricula. In Emerging
Technologies for STEAM Education. Springer
International Publishing, Cham, 39–60.
https://doi.org/10.1007/978-3-319-02573-5_3
18. Marie J Guilloteaux, Zoltán Dörnyei, and Zoltàn
Dôrnyei. 2008. Motivating Language Learners: A
Classroom-Oriented Investigation of the Effects of
Motivational Strategies on Student Motivation.
Source: TESOL Quarterly 42, 1: 55–77.
19. P. Heslop, A. Preston, A. Kharrufa, M. Balaam, D.
Leat, and P. Olivier. 2015. Evaluating digital
tabletop collaborative writing in the classroom.
https://doi.org/10.1007/978-3-319-22668-2_41
20. Wendy Holliday and Qin Li. 2004. Understanding
the millennials: updating our knowledge about
students. Reference Services Review 32, 4: 356–
366. https://doi.org/10.1108/00907320410569707
21. Desmond Hunter. 2006. Assessing collaborative
learning. British Journal of Music Education 23, 1:
75. https://doi.org/10.1017/S0265051705006753
22. T Ikuta and Y Gotoh. 2014. Development of
Visualization of Learning Outcomes Using
Curriculum Mapping Takashi Ikuta and Yasushi
Gotoh. In Digital Systems for Open Access to
Formal and Informal Learning, D. G. Sampson et
al (ed.). Springer International Publishing, 69–82.
https://doi.org/10.1007/978-3-319-02264-2_6
23. K. Isssroff and E. Scanlon. 2002. Using technology
in Higher Education: an Activity Theory
perspective. Journal of Computer Assisted Learning
18, 1: 77–83. https://doi.org/10.1046/j.0266-
4909.2001.00213.x
24. Ahmed Kharrufa, Madeline Balaam, Phil Heslop,
David Leat, Paul Dolan, and Patrick Olivier. 2013.
Tables in the Wild: Lessons Learned from a Large-
Scale Multi-Tabletop Deployment. In Proceedings
of the SIGCHI Conference on Human Factors in
Computing Systems - CHI ’13, 1021.
Classroom Tools CHI 2017, May 6–11, 2017, Denver, CO, USA
5566

https://doi.org/10.1145/2470654.2466130
25. Ahmed Kharrufa, Roberto Martinez-Maldonado,
Judy Kay, and Patrick Olivier. 2013. Extending
tabletop application design to the classroom. In
Proceedings of the 2013 ACM international
conference on Interactive tabletops and surfaces -
ITS ’13, 115–124.
https://doi.org/10.1145/2512349.2512816
26. Ahmed N S Kharrufa, Patrick Olivier, and David
Leat. 2010. Learning Through Reflection at the
Tabletop: A Case Study with Digital Mysteries. In
EdMedia: World Conference on Educational Media
and Technology, 665–674.
27. D. R. Krathwohl, B. S. Bloom, and B. B. Masia.
1964. Taxonomy of Educational Objectives: The
classification of educational goals. Handbook II:
Affective Domain. David McKay Company, New
York.
28. Stefan Kreitmayer, Yvonne Rogers, Robin Laney,
and Stephen Peake. 2013. UniPad: orchestrating
collaborative activities through shared tablets and
an integrated wall display. In Proceedings of the
2013 ACM international joint conference on
Pervasive and ubiquitous computing - UbiComp
’13, 801. https://doi.org/10.1145/2493432.2493506
29. Carol C. Kuhlthau, Jannica Heinström, and Ross J.
Todd. 2008. The “information search process”
revisited: is the model still useful? Information
Research 13: 45–45. https://doi.org/Article
30. Cher Ping Lim, Yong Zhao, Jo Tondeur, Ching
Sing Chai, and Chin-Chung Tsai. 2013. Bridging
the gap: technology trends and use of technology in
schools. Educational Technology & Society
16, 2: 59–69.
31. Louise Limberg. 1999. Three Conceptions of
Information Seeking and Use. Proceedings of the
Second international conference on research in
Information Needs, seeking and use in different contexts, September 1999: 1–16.
32. Louise Limberg. 1999. Experiencing information
seeking and learning: A study of the interaction
between two phenomena. Information Research 5,
50–67.
33. DL Lowther, FA Inan, and J Daniel Strahl. 2008.
Does technology integration “work” when key
barriers are removed? Educational Media
International 45, 3: 195–213.
34. Roberto Martinez Maldonado, Yannis Dimitriadis,
Judy Kay, Kalina Yacef, and Marie-Theresa
Edbauer. 2012. Orchestrating a multi-tabletop
classroom: from activity design to enactment and
reflection. In Proceedings of the 2012 ACM
international conference on Interactive tabletops
and surfaces - ITS ’12, 119.
https://doi.org/10.1145/2396636.2396655
35. A. McFarlane. 2001. Perspectives on the
relationships between ICT and assessment. Journal
of Computer Assisted Learning 17, 3: 227–234.
https://doi.org/10.1046/j.0266-4909.2001.00177.x
36. Sugata Mitra. 2014. SOLE Toolkit. Newcastle
University.
37. Sugata Mitra. 2014. The future of schooling:
Children and learning at the edge of chaos.
Prospects 44, 4: 547–558.
https://doi.org/10.1007/s11125-014-9327-9
38. BA Nardi. 1996. Context and consciousness:
activity theory and human-computer interaction.
MIT Press.
39. Takatsune Narumi and Yasushi Gotoh. 2014.
Students’ Reflections Using Visualized Learning
Outcomes and E-Portfolios. International
Association for Development of the Information
Society.
40. Karen Renaud and Judy Van Biljon. 2016. The role
of knowledge visualisation in supporting
postgraduate dissertation assessment. British
Journal of Educational Technology.
https://doi.org/10.1111/bjet.12494
41. S Rix and S McElwee. 2016. What happens if
students are asked to learn Geography content,
specifically Population, through SOLE? Other
Education: The Journal of Educational Alternatives
5, 1: 30–54.
42. W.-M. Roth and Y.-J. Lee. 2007. “Vygotsky’s
Neglected Legacy”: Cultural-Historical Activity
Theory. Review of Educational Research 77, 2:
186–232.
https://doi.org/10.3102/0034654306298273
43. Wolff-Michael Roth. 2004. Introduction: “Activity
Theory and Education: An Introduction.” Mind,
Culture, and Activity 11, 1: 1–8.
https://doi.org/10.1207/s15327884mca1101_1
44. Louise Starkey. 2011. Evaluating learning in the
21st century: a digital age learning matrix.
Technology, Pedagogy and Education 20, 1: 19–39.
https://doi.org/10.1080/1475939X.2011.554021
45. Harvey S. Wiener. 1986. Collaborative Learning in
the Classroom: A Guide to Evaluation. College
English 48, 1: 52. https://doi.org/10.2307/376586
Classroom Tools CHI 2017, May 6–11, 2017, Denver, CO, USA
5567


![Predictive Modeling of Spinner Dolphin (Stenella ... · spinner), S.l. centroamericana (Central American spinner) and S.l. roseiventris (Dwarf spinner) [19,20]. The Gray’s spinner](https://img.pdfslide.us/doc/110x75/5f87e3e5d2d3037d75174768/predictive-modeling-of-spinner-dolphin-stenella-spinner-sl-centroamericana.jpg)