Embed Size (px)
Citation preview

1 | P a g e
Admiral Group plc
Group Solvency and Financial Condition
Report
31 December 2016

2 | P a g e
CONTENTS
Summary ................................................................................................................................................. 5
Statement of Directors’ Responsibilities................................................................................................. 9
Audit Opinion ........................................................................................................................................ 10
A. Business and Performance ............................................................................................................ 13
A.1. Business ................................................................................................................................. 13
A.2. Underwriting performance .................................................................................................... 17
A.3. Investment performance ....................................................................................................... 18
A.4. Performance of other activities ............................................................................................. 19
A.5. Any other information ........................................................................................................... 20
B. System of Governance .................................................................................................................. 21
B.1. General information on the system of governance ............................................................... 21
B.2. Fit and proper requirements ................................................................................................. 23
B.3. Risk management system including the own risk and solvency assessment (ORSA) ............ 24
B.4. Internal control system .......................................................................................................... 25
B.4.1 Compliance function ......................................................................................................... 26
B.5. Internal audit function ........................................................................................................... 27
B.6. Actuarial function .................................................................................................................. 28
B.7. Outsourcing ............................................................................................................................ 28
B.8. Any other information ........................................................................................................... 29
C. Risk Profile ..................................................................................................................................... 30
C.1. Underwriting risk ................................................................................................................... 33
C.2. Market risk ............................................................................................................................. 35
C.3. Counterparty Default risk ...................................................................................................... 37
C.4. Liquidity risk ........................................................................................................................... 37
C.5. Operational risk ...................................................................................................................... 37
C.6. Other material risks ............................................................................................................... 38
C.7. Any other information ........................................................................................................... 38
D. Valuation for Solvency Purposes (Audited) .................................................................................. 40
D.1. Assets ..................................................................................................................................... 41
D.2. Liabilities ................................................................................................................................ 42
D.3. Technical provisions .............................................................................................................. 42
D.4. Alternative methods of valuation .......................................................................................... 46
D.5. Any other information ........................................................................................................... 46
E. Capital Management (Audited) .................................................................................................... 47
E.1. Own funds .............................................................................................................................. 47
E.2. Solvency capital requirement and Minimum Capital Requirement ...................................... 51
3 | P a g e
E.3. Use of the duration-based equity sub-module in the calculation of the Solvency Capital Requirement ................................................................................................................................. 52
E.4. Differences between the standard formula and any internal model used............................ 52
E.5. Non compliance with the Minimum Capital Requirement and non-compliance with the Solvency Capital Requirement ...................................................................................................... 52
E.6. Any other information ........................................................................................................... 52
Appendix 1 – Glossary ........................................................................................................................... 55
Appendix 2 – Quantitative Reporting Templates ................................................................................. 56
4 | P a g e
INTRODUCTION
This Admiral Group plc Solvency and Financial Condition Report (SFCR) is a new report that has been
prepared in compliance with Solvency II regulatory requirements. It contains a range of regulatory
disclosures that support the information presented in the Quantitative Reporting Templates (QRTs)
shown in Appendix 2.
The report is not intended to provide a comprehensive review of the Group’s businesses and the
markets in which they operate, how these businesses are managed, or performance of these
businesses during the year. This information is detailed in the Group’s 2016 Annual Report. Where
relevant, specific references to the Annual Report are made throughout this SFCR. It can be found at:
https://admiralgroup.co.uk/sites/default/files_public/annual-report/2017/03/2016-full-year-results-
annual-report.pdf
STRUCTURE AND CONTENTS
This Group SFCR has been prepared in accordance with Article 359 and Articles 290 to 298 of the
Solvency II delegated acts. The structure of the report is in accordance with Annex XX of the
delegated acts.
The Group has obtained a supervisory waiver to prepare a single Group SFCR. As such this report
also contains Solvency information relating to Solvency II regulated solo entities Admiral Insurance
Company Limited (AICL) and Admiral Insurance (Gibraltar) Limited (AIGL). The waiver was obtained
as the nature of the Group’s governance structure, with the Group Board and its Committees leading
the Group’s management and control framework, means that there is significant overlap in the
disclosures for the Group and the solo entities. The single Group SFCR waiver therefore allows
stakeholders to access concise disclosures for all relevant entities in one report.
All amounts in this report are presented in pounds sterling, rounded to the nearest £0.1 million,
which is the Group’s presentation currency. Unless otherwise stated, information in this report is
unaudited.

5 | P a g e
SUMMARY
SECTION A – BUSINESS PERFORMANCE
Admiral Group plc ‘the Group’ is one of the UK’s largest car insurance providers. In addition to
offering car insurance in the UK, the Group also writes household business in the UK, and car
insurance in four countries outside of the UK; Italy, Spain, France and the USA.
The Group and its Solvency II regulated solo entities AICL and AIGL recorded statutory profits of
£278m, £15m and £55m respectively in 2016. The table below splits the statutory results between
underwriting (as reported in the premiums, claims and expenses QRTs in Appendix 2 to this report),
investment and other activities:
31-Dec-16 Group AICL AIGL
Net Underwriting Results as per Section A.2 60.3 7.2 53.9
Net Investment Result as per A.3 53.1 3.6 35.7
Net Result Arising from Other Activities (Including Profit Commissions) as per A.4
165.0 4.4 (34.2)
Statutory Profit Before Tax 278.4 15.2 55.4
Taxation expense (64.3) (2.4) (2.0)
Statutory Profit After Tax 214.1 12.9 53.4
The 2016 statutory results noted above were impacted by the change in the Ogden discount rate
(the rate used for calculating the value of lump sum personal injury compensation in the UK) from
2.5% to minus 0.75%, announced by the UK Government on 27 February 2017.
The estimated total impact of the change to the Group, net of reinsurance and post tax, is
approximately £150 million.
The impact on the Group’s reported IFRS profit before tax (non statutory basis) for 2016 was £105.4
million.
SECTION B – SYSTEM OF GOVERNANCE
Section B to this report focuses on the Group’s system of Governance. The Group Board is the
principal decision-making forum for the Group providing entrepreneurial leadership, both directly
and through its Committees, and delegating authority to the Executive team.
The Board has delegated authority to a number of permanent Committees to deal with matters in
accordance with written Terms of Reference. The principal Committees of the Board - Audit,
Remuneration, Group Risk and Nomination all comply fully with the requirements of the Corporate
Governance Code.
There were no material changes in the system of governance during 2016, aside from the following
changes in membership of the Group Board:
Henry Engelhardt stepped down from the Board with effect from 12 May 2016.
Margaret Johnson stepped down from the Board with effect from 28 April 2016.
Lucy Kellaway stepped down from the Board with effect from 28 April 2016.

6 | P a g e
Justine Roberts joined the Board with effect from 17 June 2016
In addition to the changes above, Alastair Lyons (who has served in the role of Chairman since July
2000) did not seek re-election at the AGM in April 2017. His successor as Chairman is Annette Court,
who has been a Board member since 2012.
Section B reports in detail as to how the system of governance works in practice, including a focus on
the Group’s remuneration policy, the system of internal control and the Solvency II key functions of
Risk Management, Compliance, Internal Audit and Actuarial.
SECTION C – RISK PROFILE
The Admiral Group Board is responsible for determining risk strategy and risk appetite across the
Group, and for the Group’s system of risk management and internal control. The Board has
delegated the development, implementation and maintenance of the Group’s risk management
framework to the Group Risk Committee, which reports its activities to both the Board and also to
the Group Audit Committee, for the purposes of reviewing and reporting on the overall effectiveness
of this system.
Section C discussed the Group’s risk assessment and risk management approach in more detail. It
also provides information on the Group’s material risks, as shown by the Solvency Capital
Requirements of the Group and its solo entities in the table below:
31-Dec-16 GROUP AICL AIGL
Market Risk 77.2 8.0 51.2
Counterparty Risk 35.5 4.8 22.5
Life Underwriting Risk 2.8 0.0 2.4
Non-Life Underwriting Risk 325.0 73.7 206.5
Diversification (68.4) (7.9) (45.1)
Basic SCR 372.1 78.6 237.4
Operational Risk 60.6 9.4 48.3
Loss absorbing capacity of deferred taxes
(22.4) (9.9) (9.3)
SCR excluding Capital Add-On 410.3 78.1 276.4
Capital Add-On 75.8 0.0 0.0
SCR 486.1 78.1 276.4
As can be noted from the table, the material risk category for the Group and its solo entities is non-
life insurance risk which (before diversification with other risk types) represents, 67%, 94% and 75%
of the SCRs of the Group and its solo entities, AICL and AIGL respectively.

7 | P a g e
SECTION D – VALUATION FOR SOLVENCY PURPOSES
Section D focuses on the Solvency II balance sheet and the valuation of assets and liabilities. In line
with Solvency II rules, assets and liabilities on the Solvency II balance sheet are held at fair value, i.e.
the price that would be received to sell an asset or paid to transfer a liability in an orderly
transaction between market participants at the valuation date.
The material classes in the Group and solo entity Solvency II balance sheets are shown in the table
below. Each class is discussed in further detail in section D.
Solvency II Balance Sheet, 31-Dec-16 Group AICL AIGL
Goodwill, DAC and Intangible Assets - - -
Property, plant and equipment 30.3 - -
Investments excl Participations 2,438.0 335.3 1,805.3
Investment in Participations 68.2 - -
Reinsurance recoverables 897.2 77.7 755.8
Receivables and other assets 292.6 5.3 65.3
Cash 283.0 56.7 75.3
Total Assets 4,009.3 475.0 2,701.7
Technical Provisions - best estimate 2,050.1 317.7 1,633.8
Technical Provisions - risk margin 61.4 11.1 44.1
Deposits from reinsurers 464.8 - 463.0
Deferred tax liabilities 57.7 5.9 7.3
Other payables and liabilities 333.3 12.6 141.4
Subordinated liabilities 212.9 0.0 0.0
Total Liabilities 3,180.3 347.3 2,289.6
Excess of Assets over Liabilities 829.0 127.7 412.1
SECTION E – CAPITAL MANAGEMENT
The Group manages its capital to ensure that all entities within the Group are able to continue as
going concerns and also to ensure that regulated entities meet regulatory requirements with an
appropriate margin. Excess capital above these levels within subsidiaries is paid up to the Group
holding company in the form of dividends on a regular basis.
The Group and its regulated subsidiaries report strong solvency positions at 31 December 2016. The
solvency positions reported in the Annual QRTs are summarised in the table below:
31-Dec-16 GROUP AICL AIGL
Solvency Capital Requirement 486.1 78.1 276.4
Eligible Own Funds 891.3 127.7 532.1
Solvency Surplus 405.2 49.6 255.7
Solvency Ratio 183% 164% 193%
8 | P a g e
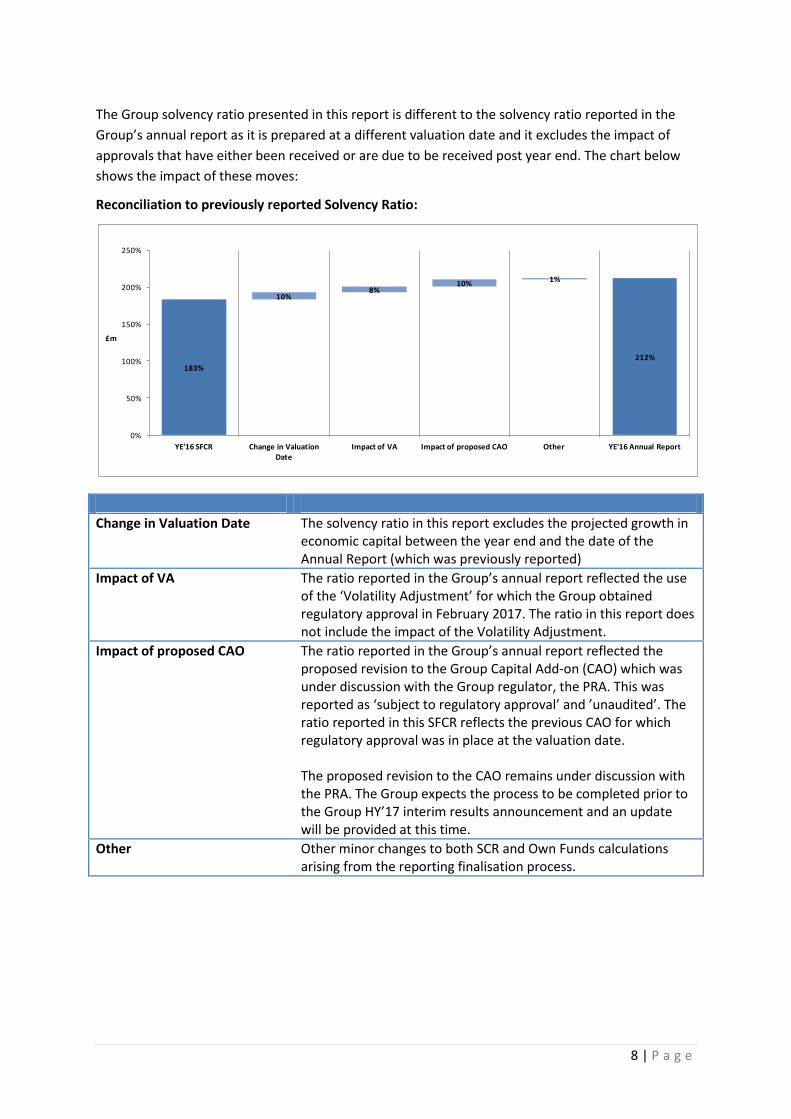
The Group solvency ratio presented in this report is different to the solvency ratio reported in the
Group’s annual report as it is prepared at a different valuation date and it excludes the impact of
approvals that have either been received or are due to be received post year end. The chart below
shows the impact of these moves:
Reconciliation to previously reported Solvency Ratio:
Change in Valuation Date The solvency ratio in this report excludes the projected growth in economic capital between the year end and the date of the Annual Report (which was previously reported)
Impact of VA The ratio reported in the Group’s annual report reflected the use of the ‘Volatility Adjustment’ for which the Group obtained regulatory approval in February 2017. The ratio in this report does not include the impact of the Volatility Adjustment.
Impact of proposed CAO The ratio reported in the Group’s annual report reflected the proposed revision to the Group Capital Add-on (CAO) which was under discussion with the Group regulator, the PRA. This was reported as ‘subject to regulatory approval’ and ’unaudited’. The ratio reported in this SFCR reflects the previous CAO for which regulatory approval was in place at the valuation date. The proposed revision to the CAO remains under discussion with the PRA. The Group expects the process to be completed prior to the Group HY’17 interim results announcement and an update will be provided at this time.
Other Other minor changes to both SCR and Own Funds calculations arising from the reporting finalisation process.
183%
212%
10%8%
10%1%
0%
50%
100%
150%
200%
250%
YE'16 SFCR Change in Valuation Date
Impact of VA Impact of proposed CAO Other YE'16 Annual Report
£m

9 | P a g e
STATEMENT OF DIRECTORS’ RESPONSIBILITIES
The Directors are responsible for ensuring that the SFCR is properly prepared in all material respects
in accordance with the Prudential Regulatory Authority (PRA) rules and SII Regulations.
The PRA Rulebook for SII firms in Rule 6.1(2) and Rule 6.2(1) of the Reporting Part requires that the
Group must have in place a written policy ensuring the ongoing appropriateness of any information
disclosed and that the Group must ensure that its SFCR is subject to approval by the Directors.
The Board of Directors confirm that, to the best of their knowledge:
(a) Throughout the financial year in question, the Group and its solo insurance undertakings have
complied in all material respects with the requirements of the PRA rules and SII Regulations as
applicable; and
(b) It is reasonable to believe that, at the date of the publication of the SFCR, the Group and its solo
insurance undertakings continue to comply, and will continue so to comply in future.
By Order of the Board
Geraint Jones
Chief Financial Officer
29 June 2017

10 | P a g e
AUDIT OPINION
Report of the external independent auditor to the Directors of Admiral Group PLC (‘the Company’) pursuant to Rule 4.1 (2) of the External Audit Chapter of the PRA Rulebook applicable to Solvency II firms
Report on the Audit of the relevant elements of the Group Solvency and Financial
Condition Report (‘SFCR’)
Opinion
Except as stated below, we have audited the following documents prepared by the Company as at 31 December 2016:
The ‘Valuation for solvency purposes’ and ‘Capital Management’ sections of the Group SFCR of the Company as at 31 December 2016, (‘the Narrative Disclosures subject to audit’);
Group templates S.02.01.02, S.23.01.22, S.25.01.22 and S.32.01.22 (‘the Group Templates
subject to audit’); and Solo templates S.02.01.02, S.12.01.02, S.17.01.02, S.23.01.01, S.25.01.21 and S.28.01.01
in respect of Admiral Insurance Company Limited and Admiral Insurance (Gibraltar) Limited (‘the Solo Templates subject to audit’).
The Narrative Disclosures subject to audit, the Group Templates and the Solo Templates subject to
audit are collectively referred to as the ‘relevant elements of the Group SFCR’.
We are not required to audit, nor have we audited, and as a consequence do not express an opinion on the Other Information which comprises:
the ‘Executive Summary’, ‘Business and performance’, ‘System of governance’ and ‘Risk profile’ elements of the Group SFCR;
Group Templates S.05.01.02 and S.05.02.01;
Solo Templates S.05.01.02, S.05.02.01 and S.19.01.21; the written acknowledgement by management of their responsibilities, including for the
preparation of the Group SFCR (‘the Responsibility Statement’); and information which pertains to an undertaking that is not a Solvency II undertaking and has
been prepared in accordance with PRA rules other than those implementing the Solvency II Directive or in accordance with an EU instrument other than the Solvency II regulations (‘the sectoral information’).
To the extent the information subject to audit in the relevant elements of the Group SFCR includes amounts that are totals, sub-totals or calculations derived from the Other Information, we have relied without verification on the Other Information.
In our opinion, the information subject to audit in the relevant elements of the Group SFCR of the
Company as at 31 December 2016 is prepared, in all material respects, in accordance with the financial reporting provisions of the PRA Rules and Solvency II regulations on which they are based, as modified by relevant supervisory modifications, and as supplemented by supervisory approvals and determinations.
Basis for opinion
We conducted our audit in accordance with International Standards on Auditing (UK and Ireland) (ISAs (UK and Ireland)) and ISA (UK) 800 and ISA (UK) 805, and applicable law. Our responsibilities under those standards are further described in the Auditor’s Responsibilities for the Audit of the relevant elements of the Group Solvency and Financial Condition Report section of our report. We are independent of the Company in accordance with the ethical requirements that are relevant to our audit of the Group SFCR in the UK, including the APB’s ethical standards,
and we have fulfilled our other ethical responsibilities in accordance with these requirements. We believe that the audit evidence we have obtained is sufficient and appropriate to provide a basis for our opinion.
Conclusions relating to going concern
We are required to report in respect of the following matters where:

11 | P a g e
the Directors’ use of the going concern basis of accounting in the preparation of the Group SFCR is not appropriate; or
the Directors have not disclosed in the Group SFCR any identified material uncertainties that may cast significant doubt about the Company’s ability to continue to adopt the going concern basis of accounting for a period of at least twelve months from the date when the Group SFCR is authorised for issue. We have nothing to report in relation to these matters
Emphasis of Matter – Basis of Accounting
We draw attention to the ‘Valuation for solvency purposes’ section of the Group SFCR, which describes the basis of accounting. The Group SFCR is prepared in compliance with the financial reporting provisions of the PRA Rules and Solvency II regulations, and therefore in accordance with a special purpose financial reporting framework. The Group SFCR is required to be published, and intended users include but are not limited to the PRA. As a result, the Group SFCR may not
be suitable for another purpose. Our opinion is not modified in respect of these matters.
Other Information
The Directors are responsible for the Other Information.
Our opinion on the relevant elements of the Group SFCR does not cover the Other Information and we do not express an audit opinion or any form of assurance conclusion thereon.
In connection with our audit of the Group SFCR, our responsibility is to read the Other
Information and, in doing so, consider whether the Other Information is materially inconsistent with the relevant elements of the Group SFCR, or our knowledge obtained in the audit, or otherwise appears to be materially misstated. If we identify such material inconsistencies or apparent material misstatements, we are required to determine whether there is a material
misstatement in the relevant elements of the Group SFCR or a material misstatement of the Other
Information. If, based on the work we have performed, we conclude that there is a material misstatement of this Other Information, we are required to report that fact.
We have nothing to report in this regard.
Responsibilities of Directors for the Group Solvency and Financial Condition Report
The Directors are responsible for the preparation of the Group SFCR in accordance with the financial reporting provisions of the PRA rules and Solvency II regulations which have been modified by the modifications, and supplemented by the approvals and determinations made by the PRA under section 138A of FSMA, the PRA Rules and Solvency II regulations on which they are based.
The Directors are also responsible for such internal control as they determine is necessary to enable the preparation of a Group SFCR that is free from material misstatement, whether due to fraud or error.
Auditor’s Responsibilities for the Audit of the relevant elements of the Group Solvency and Financial Condition Report
It is our responsibility to form an independent opinion as to whether the relevant elements of the Group SFCR are prepared, in all material respects, with financial reporting provisions of the PRA Rules and Solvency II regulations on which they are based.
Our objectives are to obtain reasonable assurance about whether the relevant elements of the
Group SFCR are free from material misstatement, whether due to fraud or error, and to issue an auditor’s report that includes our opinion. Reasonable assurance is a high level of assurance, but it
is not a guarantee that an audit conducted in accordance with ISAs (UK and Ireland) will always
detect a material misstatement when it exists. Misstatements can arise from fraud or error and are considered material if, individually or in the aggregate, they could reasonably be expected to influence the decision making or the judgement of the users taken on the basis of the Group SFCR.
A further description of our responsibilities for the audit of the financial statements is located on
the Financial Reporting Council’s website at https://www.frc.org.uk/auditorsresponsibilities. The same responsibilities apply to the audit of the Group SFCR.

12 | P a g e
This report is made solely to the Directors of Admiral Group PLC in accordance with Rule 4.1 (2) of
the External Audit Chapter of the PRA Rulebook for Solvency II firms. We acknowledge that our
report will be provided to the PRA for the use of the PRA solely for the purposes set down by statute and the PRA’s rules. Our audit work has been undertaken so that we might state to the insurer’s Directors those matters we are required to state to them in an auditor’s report on the
relevant elements of the Group SFCR and for no other purpose. To the fullest extent permitted by law, we do not accept or assume responsibility to anyone other than the Company and the PRA, for our audit work, for this report or for the opinions we have formed.
Report on Other Legal and Regulatory Requirements
Sectoral Information
In our opinion, in accordance with Rule 4.2 of the External Audit Chapter of the PRA Rulebook, the sectoral information has been properly compiled in accordance with the PRA rules and EU
instruments relating to that undertaking from information provided by members of the group and the relevant insurance group undertaking.
Other Information
In accordance with Rule 4.1 (3) of the External Audit Chapter of the PRA Rulebook for Solvency II firms we are also required to consider whether the Other Information is materially inconsistent with our knowledge obtained in the audit of Admiral Group PLC’s statutory financial statements. If, based on the work we have performed, we conclude that there is a material misstatement of this other information, we are required to report that fact.
We have nothing to report in this regard.
Mark McQueen For and on behalf of Deloitte LLP Statutory Auditor London, United Kingdom 29 June 2017
Appendix – relevant elements of the Group Solvency and Financial Condition Report that are not subject to audit
The relevant elements of the Group SFCR that are not subject to audit comprise:
Elements of the Narrative Disclosures subject to audit identified as ‘unaudited’
13 | P a g e
A. BUSINESS AND PERFORMANCE
A.1. BUSINESS
GENERAL INFORMATION
Admiral Group plc ‘the Group’ is one of the UK’s largest car insurance providers. In addition to
offering car insurance in the UK, the Group also writes household business in the UK, and car
insurance in four countries outside of the UK; Italy, Spain, France and the USA.
Outside of insurance, the Group also has price comparison businesses in the UK, Spain, France and
the USA, with the UK price comparison business, Confused.com, being one of the UK’s leading
comparison websites for the last 15 years.
The Group is a company incorporated in the United Kingdom. Its registered office is at Tŷ Admiral,
David Street, Cardiff CF10 2EH and its shares are listed on the London Stock Exchange.
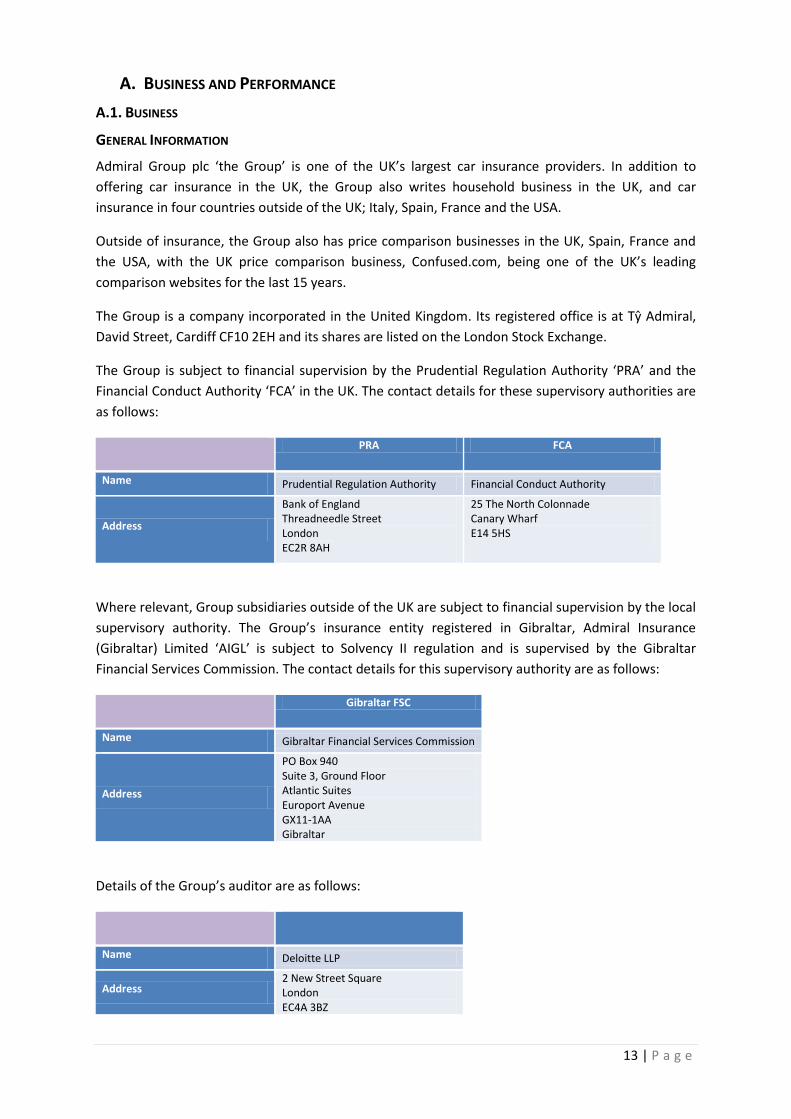
The Group is subject to financial supervision by the Prudential Regulation Authority ‘PRA’ and the
Financial Conduct Authority ‘FCA’ in the UK. The contact details for these supervisory authorities are
as follows:
PRA FCA
Name Prudential Regulation Authority Financial Conduct Authority
Address
Bank of England Threadneedle Street London EC2R 8AH
25 The North Colonnade Canary Wharf E14 5HS
Where relevant, Group subsidiaries outside of the UK are subject to financial supervision by the local
supervisory authority. The Group’s insurance entity registered in Gibraltar, Admiral Insurance
(Gibraltar) Limited ‘AIGL’ is subject to Solvency II regulation and is supervised by the Gibraltar
Financial Services Commission. The contact details for this supervisory authority are as follows:
Gibraltar FSC
Name Gibraltar Financial Services Commission
Address
PO Box 940 Suite 3, Ground Floor Atlantic Suites Europort Avenue GX11-1AA Gibraltar
Details of the Group’s auditor are as follows:
Name Deloitte LLP
Address 2 New Street Square London EC4A 3BZ

14 | P a g e
As noted above, the Group is listed on the London Stock Exchange. At 31 December 2016, the
Company's issued share capital comprised a single class of shares referred to as ordinary shares.
Details of the share capital and shares issued during the year can be found in the Group’s 2016
Annual Report (note 11d to the Group financial statements). Major shareholders as at 31 December
2016 were as follows:
Major shareholders % Shareholding at 31 December 2016
H Engelhardt & Family 11.2%
Munich Re 10.1%
GROUP STRUCTURE
The chart below shows the major subsidiaries of the Group’s Parent Company, grouped by Solvency
II classification. For further details of the subsidiary undertakings, country of incorporation and class
of shares held by the parent company refer to the Group’s 2016 Annual Report (note 11f to the
Group financial statements).
Admiral Group plc
SII Insurance Undertakings
•Admiral Insurance Company Limited (EEA insurer)
•Admiral Insurance (Gibraltar) Limited (EEA insurer)
Third Country Insurance Undertakings
•Elephant Insurance Company (Non EEA insurer)
Ancillary Service Undertakings
•EUI Limited
•EUI (France) Limited
•Elephant Insurance Services Limited
Strategic Participations
•Inspop.com Limited
•Inspop.com (France) Limited
•Able Insurance Services Limited
•Rastreator.com Limited
•Inspop USA LLC
•Admiral Law Limited
•BDE Law Limited
•Preminen Price Comparison Limited

15 | P a g e
The Group’s major activities are summarised in the following sections:
Insurance Undertakings (SII and Third Country undertakings)
At 31 December 2016, the Group had car insurance businesses in five geographical locations (UK,
Italy, Spain, France and the USA), and a Household insurance business in the UK. As noted above,
two of the Group’s insurance undertakings (AICL and AIGL), are SII insurers whilst the third Elephant
Insurance Company (EIC), is registered in the USA and therefore classified as a Third Country
undertaking.
The table below summarise the Group’s material Solvency II lines of business:
Motor Vehicle Liability
Private motor insurance, capturing bodily injury liabilities (including liabilities that may potentially settle by way of Periodic Payment Order in the future) and third party property damage.
Motor Vehicle Other Private motor insurance, capturing accident damage liabilities (including fire and theft and windscreen liabilities).
Fire and damage to other property
Household insurance, capturing accidental damage, escape of water, fire, weather and subsidence liabilities.
General Liability Household insurance capturing public liability risks.
Assistance and Misc Financial Loss
Any other risks arising from insurance products that supplement the core private motor and household insurance products.
Life (Periodic Payment Orders) Private motor insurance liabilities arising through claims settled as Periodic Payment Orders.
Ancillary Services Undertakings
The Group’s insurance intermediaries are classified as Ancillary Services Undertakings for Solvency II
purposes. These entities are non‐regulated (as per the definition in Article 2(4) of Directive 2002)
with principal activities that are deemed to be ancillary to the Group’s insurance undertakings. The
most material entity is EUI Limited which provides intermediary services for insurance underwriting
in the UK, Spain and Italy.
Strategic Participations
All non-insurance related operations in the Group are classified as Strategic Participations. The
principal activity is Price Comparison, where Admiral’s strategy is to develop websites that allow
consumers to compare a range of general insurance, financial services and other products. The
international strategy is to exploit the UK expertise in price comparison and export it overseas.
The Group’s UK price comparison site, branded as Confused.com (Inspop.com Limited) was launched
in 2002 and is one of the UK’s leading comparison websites. International price comparison
operations in Europe (Rastreator.com in Spain and Lelynx.fr in France) and in the USA
(compare.com) have subsequently been launched in 2009, 2010 and 2013 respectively. More
recently, the Group has established Preminen, a Price Comparison incubator that looks to establish
price comparison businesses in a number of new markets around the world.
The Group’s UK based law firms, Admiral Law and BDE Law, provide a range of legal services, with
the companies’ legal experts primarily specialising in road traffic accident claims, and the Group’s

16 | P a g e
commercial van broker, Able Insurance Services Limited (branded as ‘Gladiator’) offers policyholders
a wide range of commercial van insurance products from across the market.
SIGNIFICANT EVENTS DURING THE REPORTING PERIOD
Change in UK discount rate (‘Ogden’)
On 27 February 2017, the UK Government announced the outcome of the review of the discount
rate (referred to as the Ogden discount rate) used for calculating the value of lump sum personal
injury compensation. The new rate is minus 0.75% and applies to all unsettled and new claims from
20 March 2017.
The estimated total impact, net of reinsurance and post tax, of the change to minus 0.75% from
2.5% is approximately £150 million.
The change in rate has been treated as an adjusting post balance sheet event in the Group’s 2016
financial statements and the UK motor actuarial best estimates and Solvency II technical provisions
used in the calculation of the solvency position reported later in this report, have been prepared on
the basis of the new rate. The booked reserves in the financial statements continue to include a
prudent and significant margin above the actuarial best estimates in line with the Group’s reserving
policy.
The majority of the financial impact in respect of premiums earned up to the date of change (£105
million pre-tax, £87 million post-tax), was recognised in the form of reduced 2016 IFRS profits. The
balance, along with the impact on business written but unearned at the date of change, will be
recognised in the form of lower reserve releases and profit commission over the subsequent three
to five financial years as the affected claims settle.
The Group anticipates that if UK market pricing adjusts future premiums to reflect the lower Ogden
rate, there will be no significant impact on future business and its profitability after the change. The
Group is confident that its strong capital position, along with its prudent approach to claims
reserving, will allow it to manage the outcome without significant change to its business or long
term financial outlook.

17 | P a g e
A.2. UNDERWRITING PERFORMANCE
The tables below show the Group’s underwriting performance (premiums, claims and expenses in
line with QRTs S.05.01 and S.05.02) summarised by Solvency II line of business and by geographical
location. The tables are prepared on a financial statement basis and are reconciled to the Group
statutory profit in section A.4 below. Total Group net premiums written of £598.4m (which does not
form part of the profit reconciliation) can be agreed to note 5 of the Group Financial statements
within the 2016 Annual Report.
31-Dec-16 Net Premiums
Written
Net Premiums
Earned
Net Claims Incurred
Net Expenses Incurred
Other Expenses
*1
Total
Motor Vehicle Liability 422.7 391.0 270.0 88.6 32.4
Motor Vehicle Other 115.0 104.8 76.5 26.3 2.1
Fire and damage to other property 20.4 16.9 12.9 5.8 (1.8)
General Liability 0.1 0.0 0.0 0.0 0.0
Assistance and Misc Financial Loss 40.4 36.1 15.5 3.1 17.4
Life 0.0 0.0 8.4 2.1 (10.5)
Total 2016 598.4 548.8 383.3 125.9 (20.8) 60.3
31-Dec-16 Net
Premiums Written
Net Premiums
Earned
Net Claims Incurred
Net Expenses Incurred
Other Expenses
*1
Total
UK 488.5 454.5 306.8 77.8 69.9
USA 49.4 41.3 39.5 21.7 (19.8)
Italy 39.6 34.5 21.1 15.5 (2.0)
Spain 11.4 10.6 9.2 5.2 (3.8)
France 9.6 7.8 6.8 5.7 (4.7)
Total 598.4 548.8 383.3 125.9 (20.8) 60.3
*1 Other expenses represent intra-group price comparison expenses that are eliminated for the
purposes of the Group financial statements.
Analysis by Line of Business
The tables show that the Group achieved an underwriting profit of £60.3 million.
The first table analyses underwriting profit by Solvency II line of business. As noted on the QRTs in
Appendix 3 it should be noted that premiums, claims and expenses within Group insurance
businesses are not typically allocated to these individual lines of business for the purposes of
internal or external reporting and so therefore simplifications have been utilised to make this
allocation for the purposes of QRT disclosure. One such assumption is that the Life (PPO) line of
business does not attract premiums and therefore a loss totalling allocated claims and expenses is
reported.
The split of underwriting profit by line of business shows that the motor insurance lines of business
(motor vehicle liability, motor vehicle other and Life (relating to Periodic Payment Orders ‘PPOs’))
report a combined profit of £24 million.

18 | P a g e
The Fire and Damage to Property and General Liability lines can be attributed to the UK Household
business. A total underwriting loss of £1.8 million is reported.
Finally, the Assistance and Miscellaneous Financial Loss lines of business primarily relate to the UK
motor policy upgrade products underwritten by the Group, and contribute an underwriting profit of
£17 million.
Analysis by Geographical Location
The second table above analyses the Group underwriting performance by geographical location. The
UK Insurance business generates over 100% of the Group underwriting profit (£70 million), with the
Group’s International businesses in total contributing an underwriting loss of £30 million.
The underwriting performance analysis excludes other revenue generated from the sale of
additional products alongside the core motor insurance policy. Therefore, the combined
international underwriting loss is different to the International Car Insurance segment loss of £19.4
million reported in note 4 to the Group financial statements in the Group’s 2016 Annual Report.
Other revenue generated by the UK and International businesses is reported within Section A.4
below (Performance of Other Activities).
Solo Entity Premiums, Claims and Expenses
31-Dec-16 Net Premiums
Written
Net Premiums
Earned
Net Claims Incurred
Net Expenses Incurred
Other Expenses
Total 2016
AICL 158.1 147.8 107.6 33.0 7.2
AIGL 391.0 359.8 235.1 70.8 53.9
As detailed in the QRTs in Appendix 2 to this report, total non-life and life premiums, claims for the
Group’s two SII solo entities AICL and AIGL are shown in the table above. Both entities report an
underwriting profit, with the more material underwriting profits in AIGL reflecting its higher net
share of UK motor insurance and profits generated by the motor policy upgrade products.
A.3. INVESTMENT PERFORMANCE
31-Dec-16 Group AICL AIGL
Investment return on assets classified as ‘Fair value through profit and loss’
2.9 0.8 1.0
Gains of forward contracts 6.5 - -
Interest income on ‘Available for sale’ debt securities
23.4 2.0 22.1
Interest income on term deposits 4.7 0.8 3.4
Interest income on ‘Held to Maturity’ gilt assets
6.2 - -
Unwind of discount on gilt assets (0.8) - -
Release of accrual for reinsurers share of returns
9.2 - 9.2
Interest receivable on cash and cash equivalents
1.0 - -
Total 2016 53.1 3.6 35.7
19 | P a g e
Group Investment and interest income in 2016 was £53.1 million. £9.2 million of the income is due
to a release of an accrual relating to quota share reinsurance arrangements, whilst £4.9m of the
increase relates to unrealised gains on forward foreign exchange contracts. The balance is due to
additional investment income earned on higher average balances.
The underlying rate of return for the year (excluding the reinsurance accrual) on the Group’s cash
and investments was 1.4%.
In addition to the investment income recognised in the IFRS income statement, the Group also
recorded a gain of £30.3 million (2015: loss of £12.6 million) in the Fair Value reserve within Equity
as a result of unrealised gains arising on the valuation of ‘Available for Sale’ financial assets. These
gains arose following the reduction in interest rates during 2016 (in particular in the period
immediately following the Brexit vote).
Investment income in the solo entities was £3.6m and £35.7m for AICL and AIGL respectively.
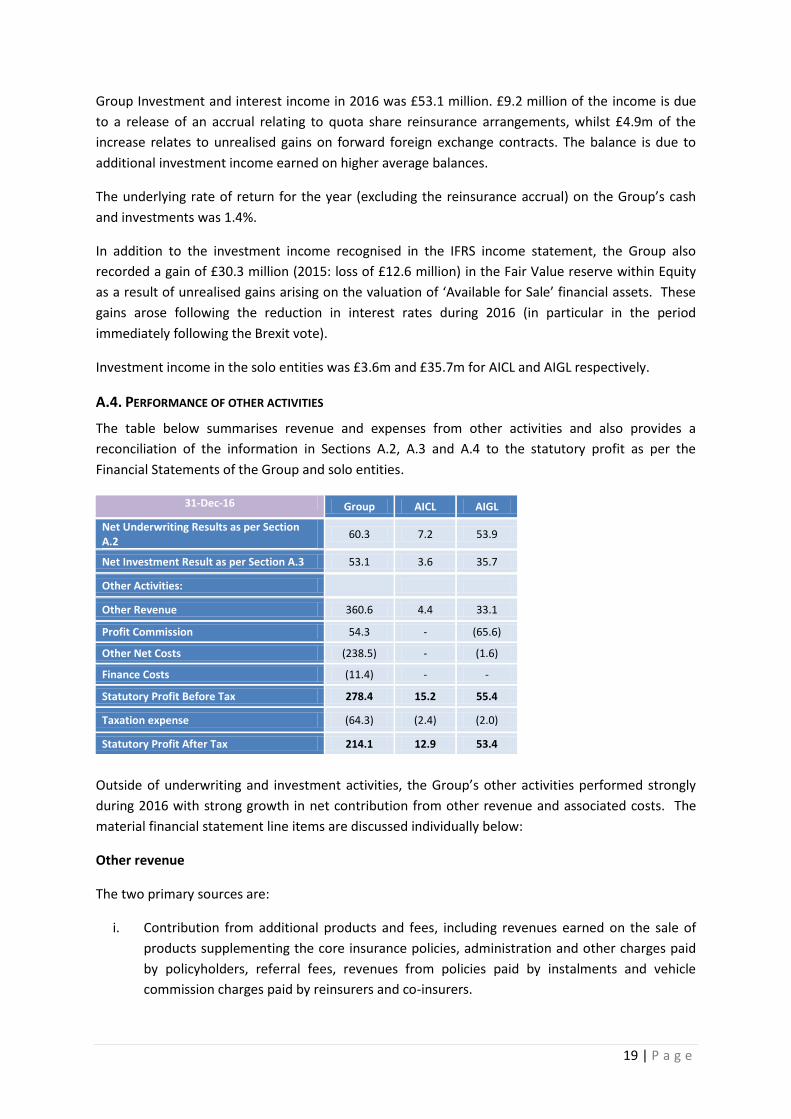
A.4. PERFORMANCE OF OTHER ACTIVITIES
The table below summarises revenue and expenses from other activities and also provides a
reconciliation of the information in Sections A.2, A.3 and A.4 to the statutory profit as per the
Financial Statements of the Group and solo entities.
31-Dec-16 Group AICL AIGL
Net Underwriting Results as per Section A.2
60.3 7.2 53.9
Net Investment Result as per Section A.3 53.1 3.6 35.7
Other Activities:
Other Revenue 360.6 4.4 33.1
Profit Commission 54.3 - (65.6)
Other Net Costs (238.5) - (1.6)
Finance Costs (11.4) - -
Statutory Profit Before Tax 278.4 15.2 55.4
Taxation expense (64.3) (2.4) (2.0)
Statutory Profit After Tax 214.1 12.9 53.4
Outside of underwriting and investment activities, the Group’s other activities performed strongly
during 2016 with strong growth in net contribution from other revenue and associated costs. The
material financial statement line items are discussed individually below:
Other revenue
The two primary sources are:
i. Contribution from additional products and fees, including revenues earned on the sale of
products supplementing the core insurance policies, administration and other charges paid
by policyholders, referral fees, revenues from policies paid by instalments and vehicle
commission charges paid by reinsurers and co-insurers.
20 | P a g e
Revenue increased to £199 million from £182m in 2015, primarily as a result of growth in the
policy base of the UK motor insurance business.
ii. Price comparison revenue totalled £108 million in 2016. The main contribution to revenue is
from Confused.com in the UK, which grew revenue by 14% in 2016, taking advantage of
growth in the UK price comparison market and benefitting from a new driver-centric
strategy, supported by new marketing.
Profit Commission
Profit commission receivable from co-insurers and reinsurers in 2016 was £54 million at Group level.
AIGL reports negative profit commission of £66m as intra-group profit commission payable more
than offsets profit commission receivable from quota share reinsurers.
Other Net Costs
Other costs primarily relate to the other revenue noted above, being internal costs allocated to the
generation of contribution from other products and fees, and also price comparison expenses. These
costs increased with the growth in the revenue lines noted above.
This category also includes central group costs that are not allocated to individual businesses – net
share scheme charges being the most significant.
A.5. ANY OTHER INFORMATION
None.

21 | P a g e
B. SYSTEM OF GOVERNANCE
B.1. GENERAL INFORMATION ON THE SYSTEM OF GOVERNANCE
STRUCTURE OF THE ADMINISTRATIVE, MANAGEMENT OR SUPERVISORY BODY
The Board is the principal decision-making forum for the Group providing entrepreneurial
leadership, both directly and through its Committees, and delegating authority to the Executive
team.
The Group’s 2016 Annual report (Governance section) provides further detail of the role of the
Board and other information such as Board activity during the period.
The Board has delegated authority to a number of permanent Committees to deal with matters in
accordance with written Terms of Reference. The principal Committees of the Board - Audit,
Remuneration, Group Risk and Nomination (as shown in the diagram below) - all comply fully with
the requirements of the Corporate Governance Code.
All Committees are chaired by an independent Non-Executive Director, except the Nomination
Committee which is chaired by the Chairman of the Board, and comprise a majority of independent
Non-Executive Directors. Appointments to the Committees are made on the recommendation of the
Nomination Committee and are for a period of up to three years, which may be extended for two
further three year periods, provided the Director remains independent.
The Committees are constituted with written Terms of Reference that are reviewed annually to
ensure that they remain appropriate and reflect any changes in good practice and governance.
These Terms of Reference are available on request from the Company Secretary and can also be
found on the Company’s website: www.admiralgroup.co.uk. Directors are fully informed of all
Committee matters by the Committee Chairmen reporting on the proceedings of their Committee at
the subsequent Board meeting. Copies of Committee minutes are also distributed to the Board.
The AICL and AIGL subsidiary Boards are also chaired by independent Non Executive Directors.
MATERIAL CHANGES IN THE SYSTEM OF GOVERNANCE
There were no material changes in the system of governance during the year, aside from the
following changes in membership of the Group Board:
Board of Directors
Audit Committee
Group Risk Committee
Nomination Committee
Remuneration Committee
22 | P a g e
Henry Engelhardt stepped down from the Board with effect from 12 May 2016.
Margaret Johnson stepped down from the Board with effect from 28 April 2016.
Lucy Kellaway stepped down from the Board with effect from 28 April 2016.
Justine Roberts joined the Board with effect from 17 June 2016
In addition to the changes above, Alastair Lyons (who has served in the role of Chairman since July
2000) did not seek re-election at the AGM in April 2017. His successor as Chairman is Annette Court,
who has been a Board member since 2012.
REMUNERATION POLICY
Key Principles of Admiral Remuneration Arrangements
The Group is committed to the primary objective of maximising shareholder value over time and
ensuring that there is a strong link between performance and reward. This is reflected in the Group’s
stated Remuneration Policy of paying competitive, performance-linked and shareholder-aligned
remuneration packages comprising basic salaries coupled with participation in performance-based
share schemes to generate competitive total reward packages for superior performance.
Two share schemes are operated within the Group, as follows:
(i) The Approved Share Incentive Plan (the SIP)
Eligible employees qualified for awards under the SIP based upon the performance of the Group in
each half-year period. The maximum award for each year is £3,600 per employee. The awards are
made with reference to the Group’s performance against prior year profit before tax. Employees
must remain in employment for the holding period (three years from the date of award) otherwise
the shares are forfeited.
(ii) The Discretionary Free Share Scheme (the DFSS)
Under the DFSS, individuals receive an award of free shares at no charge. Staff must remain in
employment until the vesting date in order to receive shares.
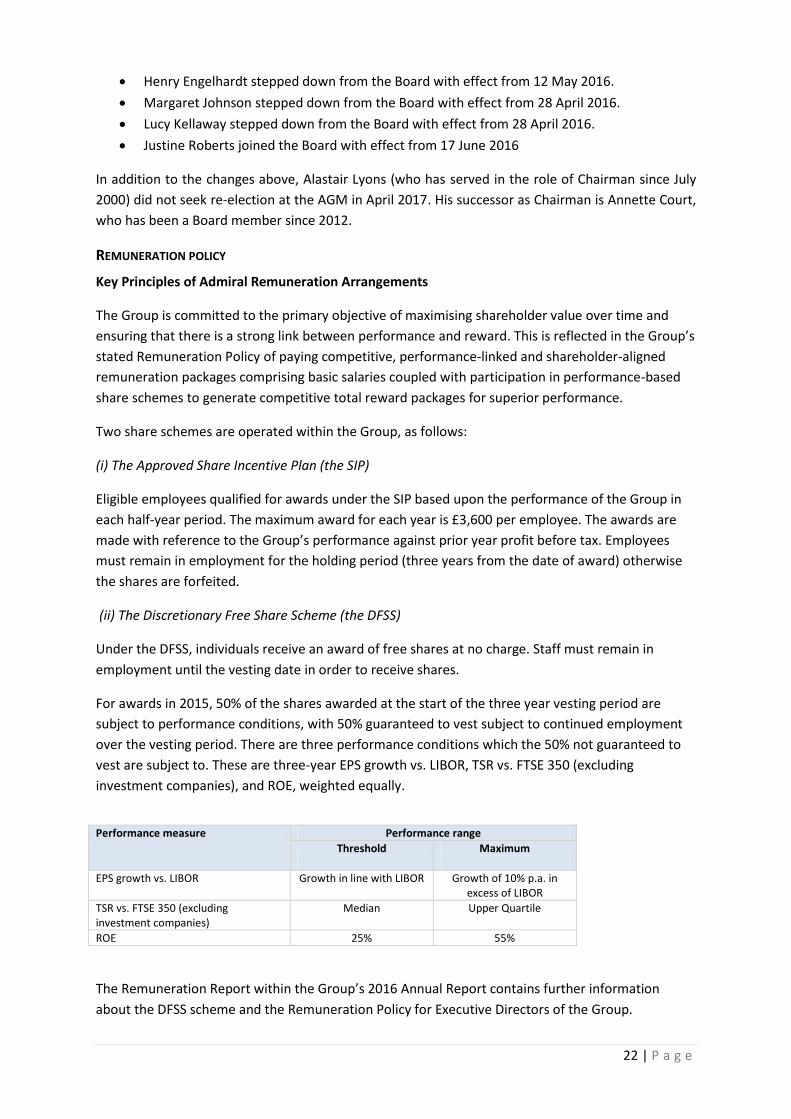
For awards in 2015, 50% of the shares awarded at the start of the three year vesting period are
subject to performance conditions, with 50% guaranteed to vest subject to continued employment
over the vesting period. There are three performance conditions which the 50% not guaranteed to
vest are subject to. These are three-year EPS growth vs. LIBOR, TSR vs. FTSE 350 (excluding
investment companies), and ROE, weighted equally.
Performance measure Performance range
Threshold
Maximum
EPS growth vs. LIBOR Growth in line with LIBOR Growth of 10% p.a. in excess of LIBOR
TSR vs. FTSE 350 (excluding investment companies)
Median Upper Quartile
ROE 25% 55%
The Remuneration Report within the Group’s 2016 Annual Report contains further information
about the DFSS scheme and the Remuneration Policy for Executive Directors of the Group.
23 | P a g e
MATERIAL RELATED PARTY TRANSACTIONS
Details relating to the remuneration and shareholdings of key management personnel are set out in
the Directors’ Remuneration Report within the Group’s 2016 Annual Report. Key management
personnel are able to obtain discounted motor insurance at the same rates as all other Group staff,
typically at a reduction of 15%.
The Board considers that only the Executive Directors of Admiral Group plc are key management
personnel. Aggregate compensation for the Executive Directors is disclosed in the Directors’
Remuneration Report within the Group’s 2016 Annual Report.
B.2. FIT AND PROPER REQUIREMENTS
The Admiral Group Nominations Committee owns and approves the Admiral Group Plc Fit and
Proper Policy. The policy aims to ensure that all senior individuals who represent the organisation
meet the fit and proper requirements in terms of qualifications, capability, honesty and integrity. As
per the Policy, all prospective senior management appointments shall fill out a checklist prior to an
offer being made. The checklist includes details of the candidate’s knowledge, competence and
experience to perform the role, and a declaration from the senior manager responsible for the
recruitment to confirm the assessment of the candidate’s fitness and propriety was carried out in
line with this Policy. In addition, the candidate will be subject to interviews with appropriate
members of staff, who will help complete the assessment of the candidate’s fitness and propriety in
relation to that role.
In order to ensure that the individuals running the organisation are fit and proper a number of
checks are undertaken including;
Previous employment history
Educational background check
Professional qualifications and membership check
Notification of appointment to regulator
Information on potential conflicts of interest
Criminal history checks
Credit checks
Identity checks
Directorship check
Financial sanctions checks
The Head of People Services is responsible for ensuring the Fit and Proper policy, approved by
Admiral Group Nominations Committee, is adhered to when senior management appointments are
made by the firm. The policy is reviewed annually by Compliance to ensure it is line with all relevant
regulations and remains fit for purpose. In addition, all senior management are subject to
requirements laid out by the UK regulators (FCA and PRA), through the Senior Insurance
Management Regime.

24 | P a g e
B.3. RISK MANAGEMENT SYSTEM INCLUDING THE OWN RISK AND SOLVENCY ASSESSMENT (ORSA)
The Group has a ‘three lines of defence’ approach to Risk Management. The ‘first line of defence’
describes the controls the Group has in place to deal with the day-to-day business. Controls, which
are designed to appropriately mitigate risk, are managed by the business unit and overseen by the
business unit Risk Management Committees who ensure compliance and review control
breakdowns, inadequacy of process and unexpected events.
The ‘second line of defence’ describes the Committees (primarily the GRC) and functions that are in
place to provide an oversight of the effective operation of the internal control framework. These
committees review the management of risk in relation to the particular risk appetite of the business,
as determined by the Board. The ‘second line’ is reinforced by the advisory and monitoring
functions of Risk and Compliance. Risk defines and prescribes risk assessment processes for the
business, maintains risk registers and undertakes regular reviews of these risks and controls in
conjunction with line management. Compliance advises on all areas of regulatory principles, rules
and guidance, including leading on any changes, and undertakes monitoring activity on key areas of
regulatory risk and policy adherence.
The ‘third line of defence’ describes the independent assurance provided by the Audit Committee
and the Group Internal Audit function that reports to that committee. Internal Audit undertakes a
programme of risk based audits covering all aspects of both the first and second lines of defence.
The findings from these audits are reported to all three lines, i.e. line management, the executive
and oversight committees and the Audit Committee.
The Group’s Enterprise Risk Management Framework is described in Section C (Risk Profile) below.
ORSA
Admiral Group Plc’s Risk Strategy is directly linked to its business plan and model. The approach is
embedded in the ORSA and links to the business planning process.
The Group Risk Function defines and prescribes the financial and operational risk assessment
processes for the business; performs second line reviews, including reserving and capital modelling
processes; maintains the risk registers; undertakes regular reviews of these risks in conjunction with
line management; delivers the Own Risk and Solvency Assessment (ORSA); and records any actual
losses or near misses that occur as a consequence of the realisation of risk.
The Chief Risk Officer has responsibility for ensuring that managers are aware of their risk
management obligations, providing them with support and advice, and ensuring that the risk
management strategy is properly communicated. Reports are produced showing the most significant
risks identified and the controls in place. Internal Audit uses the risk registers to plan and inform
their programme of audits around the most significant risks to the Group to ensure that the
prescribed controls are in place and are operating effectively.
ORSA Approval Process
On an annual basis, or following significant changes in the risk profile of the business, the Group Risk
Function will produce an Own Risk and Solvency Assessment (ORSA) Report, in line with the ORSA
Policy and Solvency II regulations. The report is reviewed and challenged at the GRC prior to
submission to the Group and subsidiary Board Committees.

25 | P a g e
The report is also submitted to the PRA for information purposes, and to receive feedback on the
quality and suitability of the report.
Group Determination of Solvency Requirements
Within the ORSA, the Solvency Capital Requirement is calculated on two bases; Regulatory and
Economic (ultimate). The ORSA considers both bases in order to provide a quantification of the
differences between the two viewpoints. In addition, analyses of the key drivers of economic
(ultimate) capital needs and regulatory capital requirements are also considered.
Admiral is currently developing an internal model and intends to seek approval from the PRA and
the FSC to calculate the regulatory SCR using a Partial Internal Model (PIM) for Group and AIGL.
Whilst Admiral completes this development, the Group’s regulatory capital requirement is based on
the Solvency II standard formula with a capital add-on to reflect recognised limitations in the
standard formula, (predominantly in respect of profit commission arrangements within co- and
reinsurance contracts and risks arising from Periodic Payment Order (PPOs) claims).
Refer to section C for a review of the Group’s basis for calculating Regulatory capital requirements.
B.4. INTERNAL CONTROL SYSTEM
The Admiral Group Internal Control Policy documents the procedures in place within the Group, to
ensure there is an effective internal control system operating. The internal control system is
managed through both the effective operation of the systems of governance in place within the
Group, as well as through the three lines of defence strategy adopted by the Group.
The Internal Control framework is broadly defined as continually operating processes, effected by
the Board of Directors, management and all levels of personnel, designed to provide reasonable
assurance regarding the achievement of objectives in the following categories:
Effectiveness and efficiency of operations in view of its risks and objectives
Availability and reliability of financial and non financial information
Compliance with applicable laws, regulations and administrative provisions
Internal control consists of four interrelated components:
Control environment – sets the tone of an organisation through the business plan, risk
appetite and risk profile
Control activities – policies and procedures that help ensure necessary actions are taken to
address risks to achieve the business’ objectives.
Information and Communication – Pertinent information must be identified, captured and
communicated in a form and timeframe that allows relevant individuals to carry out their
responsibilities.
Monitoring – Internal control systems need to be monitored to assess the quality of the
internal control system over time. This is accomplished through ongoing monitoring
activities, with deficiencies in the internal control framework reported to senior
management and the Board.

26 | P a g e
The Group’s control environment is determined by the Admiral Group Board of Directors, supported
by a number of Committees who have set the tone of the organisation through the Admiral culture,
principles, business plan and risk appetite.
Key control activities are mapped to primary risks held within the Group’s risk universe.
Line 1 (operational functions) are responsible for monitoring all the risks facing their operation,
whether this be through Call monitoring, file reviews or audit reviews. Results on monitoring
activities are provided to operation managers, and subsequently reported on through the Admiral
Group Governance structure.
Line 2 (Risk & Data Protection, Compliance and Actuarial functions) are responsible for the oversight
of the Line 1 monitoring. This is done through:
Risk reviews – business unit risk and controls discussed at RMCs with material risks and KRIs
presented to Group Risk Committee in the Consolidated Risk Report
Compliance Advice and Compliance Monitoring Reviews presented to Group Risk Committee
Actuarial and validation reviews
Line 3 (Internal Audit) are responsible for conducting an objective and independent appraisal of all
the Group's activities, financial and otherwise, through a risk based plan, approved annually by the
Group Audit Committee.
External Reviewers are responsible for the oversight of specific processes within the Group,
depending on the scope of the review they are required to undertake. This includes:
External Auditors - responsible for the review of accounting and financial processes
presented to Audit Committee
External Consultancies – review of a number of key processes
B.4.1 COMPLIANCE FUNCTION
The Group has a compliance function within each operation that reports directly to the Group Risk
Committee. Each Compliance Function is responsible for reviewing Line 1’s compliance with the
control activities and reporting these to the Group Risk Committee for external challenge and
oversight by the Non Executive Directors.
In addition, each Compliance function must design and implement their own control activities to
mitigate their risks and test the operating effectiveness of these prior to being reported to the
Group Risk Committee for challenge. The Compliance report combines both of these responsibilities
and the attendance of the Head of Compliance at the Group Risk Committee acts as a
communication line to the other Compliance Functions.
The Compliance Department works to ensure the business has effective systems and controls to
facilitate adherence to the rules and guidelines set by the Financial Conduct Authority (FCA) &
Prudential Regulation Authority (PRA), along with other regulatory bodies such as the Competition
Commission as applicable.
27 | P a g e
B.5. INTERNAL AUDIT FUNCTION
The Group Internal Audit function is responsible for conducting an objective and independent
appraisal of the Group's activities and controls, financial and otherwise, through a risk based plan,
approved annually by the Group Audit Committee. It is responsible for evaluating and reporting to
the Board and the Audit Committee, and thereby providing them with assurance on the operating
effectiveness of controls that management has put in place.
Internal Audit is also responsible for providing assurance over the arrangements for risk
management, control and governance, compliance with internal policies, procedures and controls,
and value for money. The Group Internal Audit department shall report to the relevant
Board/Committee the findings and recommendations from their review, including the time period
envisaged to remedy any shortcomings, and follow up on any recommendations made on a timely
basis. It remains the duty of management to operate these arrangements, to determine whether or
not to accept audit recommendations and to recognise and accept the risks of not taking action.
Management need to provide an appropriate level of justification and where applicable supporting
documentation to justify their reasoning, when choosing to accept the given risk, or decline a
recommendation.
The Annual Audit Plan is based on a methodical risk analysis, taking into account all activities and the
complete system of governance, as well as expected developments of activities and
innovations. Significant areas of risk, identified as Tier One risks, per the Risk Register, are
considered for inclusion in the Annual Audit Plan each year. Any audits graded red in colour are
reviewed within a 12 month period until they are in a non-red status. Outside of these, a plan,
extending over four years, is in place.
Independence and Objectivity of the Internal Audit Function
The Group’s internal audit policy states that the Internal Audit department and all of its employees
must be functionally and organisationally independent of the business processes, events and
transactions of the company. The Internal Audit department will carry out its assignments with
impartiality and is free to express its opinions in their reports. Amongst many matters, the Internal
Audit department must have direct access to the Board of Directors, Audit Committee and the Chief
Executive Officer and be able to report directly to these levels when they deem this necessary. Such
independent structure should enable the internal auditor to render impartial and unbiased
judgement, essential to the proper conduct of their work.
Internal Audit activity must be free from interference in determining the scope of internal auditing,
performing work and communicating results.
An Internal Auditor will not perform an audit review in an area where they had a consultancy /
operational role in the previous twelve months.
Where practical, areas under review are rotated amongst the staff in Internal Audit to avoid any
potential conflict of interest.

28 | P a g e
B.6. ACTUARIAL FUNCTION
The Actuarial Function has a number of responsibilities in the area of Technical provisions and also in
providing an opinion on the adequacy of re-insurance and underwriting.
Solvency II requirements state that the Actuarial Function shall be carried out by persons who have
knowledge of actuarial and financial mathematics, commensurate with the nature, scale and
complexity of the risks inherent in the business, and who are able to demonstrate their relevant
experience with applicable professional and other standards. The Actuarial Function should be free
from influences that may compromise its ability to undertake its duties in an objective, fair and
independent manner.
The Actuarial Function produces a written report (“The Actuarial Function Report”) which is
submitted to the Board, at least annually, documenting all tasks undertaken, identifying deficiencies
and making recommendations to remedy these deficiencies. The report is designed to include the
calculation of technical provisions, an opinion on overall underwriting policy and an opinion on the
adequacy of reinsurance arrangements.
The responsibilities that fall under the remit of the Actuarial Function are segregated from other
business activities to allow independent review and challenge, allowing the Actuarial Function to
provide an independent opinion of the areas of Technical Provisions, Reinsurance and Underwriting.
The review and challenge is carried out by the 2nd line Group Risk Function which enables clearer
separation of activities and strengthens the independence. The Actuarial Function is made up of
suitably qualified actuaries who have the skills and knowledge to make the decisions without the
influence of others.
B.7. OUTSOURCING
The Group’s Outsourcing Policy ensures that any third party arrangement entered into by the Group
does not lead to impairment of either the group’s systems of governance and internal control, or the
relevant supervisory authority in monitoring compliance risks, does not unduly increase the
operational risk and does not undermine continuous and satisfactory service to customers.
The Group outsources a number of critical and important functions across all businesses, to various
third parties. Services received in relation to these critical and important functions include:
Provision of call centre services for insurance businesses across the Group
Provision of printing and document management services
Provision of IT and telephony services
Provision of third party actuarial reviews of insurance reserves across the Group
Provision of investment management services
Material intra-group outsourcing arrangements include the provision of insurance services by the
Group’s insurance intermediaries EUI Limited, EUI (France) Limited and Elephant Insurance Services
LLC to the Group’s regulated insurance entities. In addition, the Group has a number of shared IT
development centres that provide services to both the Group’s insurers and price comparison
websites. Intra-group outsourcing arrangements fall within the scope of the Group’s outsourcing
policy in a consistent manner to outsourcing arrangements external to the Group.
29 | P a g e
B.8. ANY OTHER INFORMATION
Assessment of the adequacy of the system of governance
The Board is ultimately responsible for the Group’s system of governance, including the system of
risk management and internal control. As noted in the Group’s 2016 Annual Report, the Board
confirms the Group’s compliance with the principles and provisions of the UK Corporate Governance
Code 2014 (the code) which is applicable to the year under review, and is considered to represent
best practice for UK listed companies.
30 | P a g e
C. RISK PROFILE
RISK ASSESSMENT AND RISK MANAGEMENT
The Admiral Group Board is responsible for determining risk strategy and risk appetite across the
Group, and for the Group’s system of risk management and internal control. The Board has
delegated the development, implementation and maintenance of the Group’s risk management
framework to the Group Risk Committee, which reports its activities to both the Board and also to
the Group Audit Committee, for the purposes of reviewing and reporting on the overall effectiveness
of this system.
The Group’s 2016 Annual Report (pages 58 – 61) contains detailed information on the activities of
the Group Risk Committee during 2016 along with the Committee’s duties and responsibilities and
the Group’s Risk Management and Internal Control statement.
Risk management is a continuous process which forms an essential part of Admiral Group’s business
operations with successful risk taking required to achieve the Group’s business objectives in the
short, medium and long term. Admiral has always sought to protect its downside and this is
characterised by: the reinsurance model; a prudent approach to claims reserving; an organic growth
strategy; a test and learn approach of taking measured steps before investing further; and a
conservative approach to investment management.
The Group’s Enterprise Risk Management Framework (ERMF) is designed to identify, evaluate and
manage the risks to which Admiral is exposed. Risk appetite is a central element of the ERMF - this
seeks to determine the level of risk the Group Board deem appropriate for the business to accept,
net of controls and mitigating factors such as reinsurance and other management actions.
There are six key components of the Admiral Group Risk Appetite:
i. The Key Risks to the business are identified ii. Risk Classifications are assigned to each key risk on a materiality basis.
iii. Risk Drivers are identified for each key risk. iv. Risk Appetite Statements are then assigned to define the risk and the Boards approach to
managing the risk. v. Key Risk Indicators are monitored for each risk driver.
vi. Triggers and Limits are defined to reflect early warning indicators and risk limits.
MATERIAL RISKS
The material, or Key Risks to the Group are listed below, and may be mapped to the main categories
of risk within the Solvency II Solvency Capital Requirement (SCR):

31 | P a g e
Key Risk Risk Overview
Insurance, or Underwriting Risk Uncertainty over the occurrence, amount or timing of claims arising on insurance contracts issued by the Group.
Market Risk Fluctuations in the value of market prices of the Group’s investment assets and liabilities, or in the income and expenses generated from these assets and liabilities.
Counterparty, or Credit Risk The risk that counterparties (primarily either reinsurers or banks or other investment counterparties) default on obligations.
Operational Risk Risks arising through operational processes and procedures. These include risks related to people, processes, IT systems, information security, business continuity and customer outcomes.
Group Risk
Risks, other than those captured within categories above arising across the Group’s operations. These may relate to the Group’s non insurance businesses (such as Price Comparison) or to other risks relating to the insurance businesses (such as loss of additional revenues from customers).
Each of these risk categories is discussed in further detail in sections C1 – C7 below, along with
details of risk mitigating actions taken by the Group Board in respect of each risk. Pages 40 – 43 of
the Group’s 2016 Annual Report also provides further information on the Group’s ‘Principal Risks
and Uncertainties’, their impacts and the associated mitigating actions.
The Group’s Solvency II SCR reflects the profile of these material risks. The chart below evidences
that insurance, or underwriting risk is the Group’s material risk concentration, comprising 68% of the
YE 2016 SCR. There has not been a material change to this risk profile over the course of 2016 and
there is not expected to be a material change during 2017.
2016 Group Solvency Capital Requirement – by risk type
The Group’s core and dominant line of business is UK motor and therefore the insurance, or
underwriting risk is concentrated on the applicable SII lines of business for UK motor (primarily, non
life ‘liability’ and ‘other’ risks).
The composition of the SCR for the solo entities AICL and AIGL is shown in the charts below:
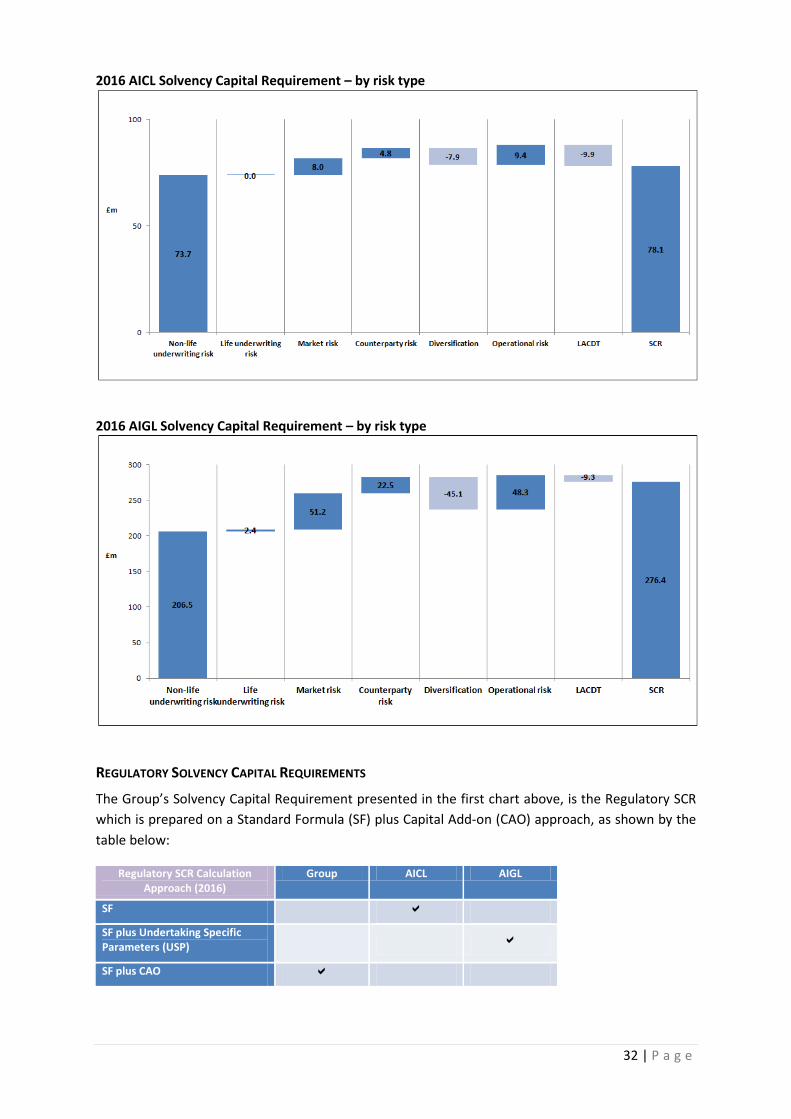
32 | P a g e
2016 AICL Solvency Capital Requirement – by risk type
2016 AIGL Solvency Capital Requirement – by risk type
REGULATORY SOLVENCY CAPITAL REQUIREMENTS
The Group’s Solvency Capital Requirement presented in the first chart above, is the Regulatory SCR
which is prepared on a Standard Formula (SF) plus Capital Add-on (CAO) approach, as shown by the
table below:
Regulatory SCR Calculation Approach (2016)
Group AICL AIGL
SF
SF plus Undertaking Specific Parameters (USP)
SF plus CAO

33 | P a g e
As previously disclosed, the Group is preparing to make a Partial Internal Model submission to the
UK and Gibraltar regulators. Ahead of the start of the Solvency II regime, the Group applied for a
CAO to the standard formula to reflect recognised limitations in the standard formula with respect
to Admiral’s risk profile. These predominately relate to profit commission arrangements in co-
insurance and reinsurance contracts and risks arising from claims including PPO claims. The Group
anticipates applying for an update to the CAO on an annual basis until the PIM is approved. For
further detail, please refer to sections C6 and E2 below.
The Regulatory SCRs for the Group’s Solvency II regulated subsidiaries AICL and AIGL, are calculated
on a standard formula basis. For the UK regulated subsidiary, AICL, the Group considers the standard
formula to appropriately reflect the Company’s risk profile.
For the Gibraltar regulated subsidiary, the interaction of profit commission arrangements with
external reinsurers and intra-group profit commission arrangements means limitations of the
standard formula with respect to these risks cannot be addressed with a CAO as the add-on would
reflect a deduction to the standard formula, which is not permitted within Solvency II regulation.
AIGL has obtained approval from the Gibraltar regulator (Gibraltar Financial Services Commission) to
use Undertaking Specific Parameters (USPs) in its calculation of underwriting risk.
C.1. UNDERWRITING RISK
The Group’s underwriting risk consists of Non-life and Life components. As noted above, the
material concentration of risk is within Non-life underwriting risk, given the Group’s focus on general
insurance lines of business. Life underwriting risk arises through the settlement of claims on a
Periodic Payment Order (PPO) basis, where annual index-linked settlements to claimants exposes
the Group to life risks such as the claimant’s life expectancy (longevity) and inflation.
NON-LIFE UNDERWRITING RISKS
Non- life underwriting risk consists of the following components of risk:
Non-life premium risk
Non-life reserve risk
Lapse risk
Catastrophe risk
The valuation of non-life underwriting risk is driven by the premium and reserve risk component,
with small contributions made by lapse and catastrophe risk.
The majority of non-life underwriting risk is accepted by the Group’s regulated subsidiaries in the UK
and Gibraltar, AICL and AIGL. As a result, there is little difference between the sum of the
components of non-life insurance for AICL and AIGL and the Group valuation. The key exception to
this is catastrophe risk; the difference here is driven by exposure to natural weather catastrophes
(primarily through hail and flood) in the USA due to risks underwritten within EIC.
The table below shows the allocation of Group non-life insurance risk across the Group’s three
regulated insurers:

34 | P a g e
Non-life Underwriting risk SCR – by entity
Non-life Reserve risk is driven by adverse development in the valuation of the liabilities which is
mainly related to longer tailed bodily injury claims, arising from the Group’s UK Motor business,
which have greater uncertainty associated with the ultimate cost of claims than, for example,
property damage claims (across both Motor and Household businesses). These claims can develop
over a number of years so the reserve risk figure relates to several underwriting years.
The Group’s retention of risk across underwriting years for the core UK motor business varies
depending on the co-insurance and quota share reinsurance contracts in place for each year. The
Group has historically used reinsurance (in the form of both co-insurance and quota share
reinsurance, as well as excess of loss reinsurance) as a risk mitigation tool across all lines of business
- refer to the risk mitigation section below for further detail. In addition, the Group’s annual report
contains further information about the co-insurance and reinsurance arrangements in place for
businesses across the Group (page 26 for UK Insurance and page 33 for International Insurance).
Premium risk is the risk that the Group incurs losses on risks arising in the 12 months after the
valuation date. Premium risk consists of a lower proportion of bodily injury exposure, and therefore
has a higher proportion of property damage in future claims experience which increases the
diversification between claim types compared to reserve risk. This is due to premium risk
considering the future occurrence and severity of claims, rather than the development of existing
claims, of which property damage claims generally settle quickly.
LIFE UNDERWRITING RISKS
As noted above, the Group is exposed to life underwriting risks in respect of claims that have settled
by way of a PPO. The risks relevant to the Group within the standard formula calculation of life risk
are longevity risk and life expense risk. In addition, the Group’s CAO captures inflation risk (refer to
section C6).
The Group has a relatively low number of settled PPO claims, and therefore, life underwriting risk
does not reflect a significant contribution of risk. In addition diversification against the significant
non life insurance risks further reduces the element of the SCR attributable to life underwriting risk.
206.5
325.0
73.7
46.9-2.0
0
50
100
150
200
250
300
350
AIGL AICL EIC Diversification Non-life underwriting risk
£m
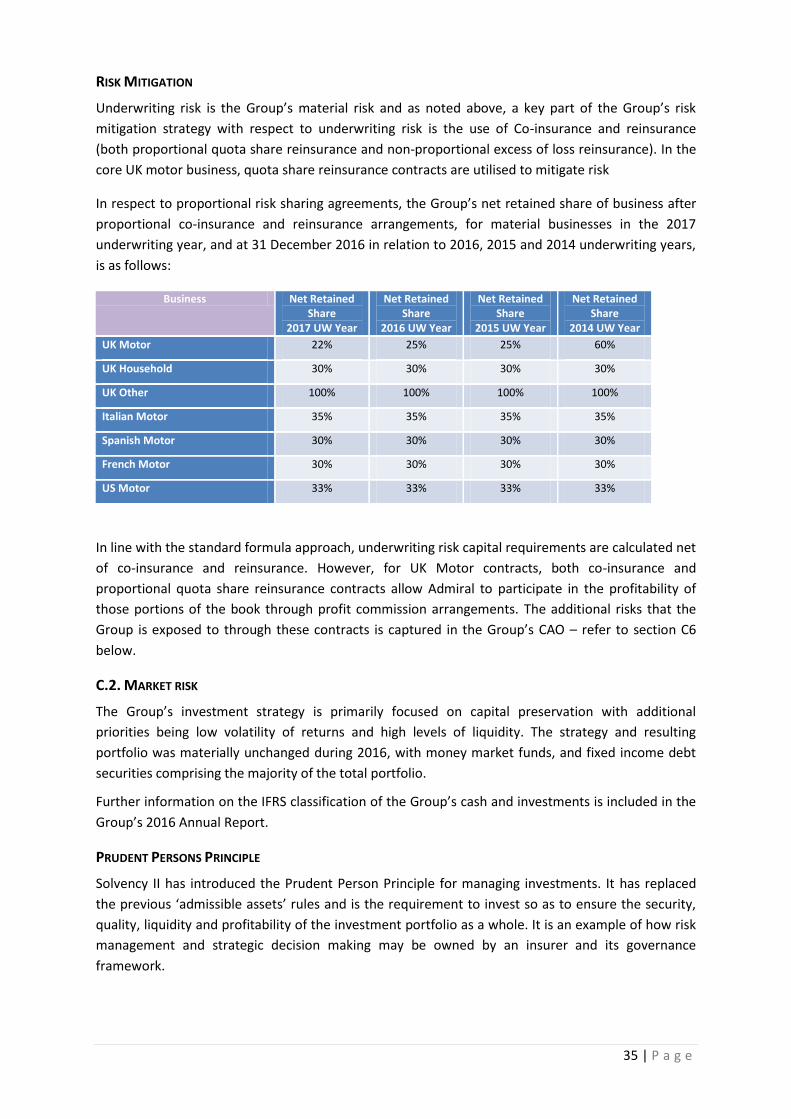
35 | P a g e
RISK MITIGATION
Underwriting risk is the Group’s material risk and as noted above, a key part of the Group’s risk
mitigation strategy with respect to underwriting risk is the use of Co-insurance and reinsurance
(both proportional quota share reinsurance and non-proportional excess of loss reinsurance). In the
core UK motor business, quota share reinsurance contracts are utilised to mitigate risk
In respect to proportional risk sharing agreements, the Group’s net retained share of business after
proportional co-insurance and reinsurance arrangements, for material businesses in the 2017
underwriting year, and at 31 December 2016 in relation to 2016, 2015 and 2014 underwriting years,
is as follows:
Business Net Retained Share
2017 UW Year
Net Retained Share
2016 UW Year
Net Retained Share
2015 UW Year
Net Retained Share
2014 UW Year
UK Motor 22% 25% 25% 60%
UK Household 30% 30% 30% 30%
UK Other 100% 100% 100% 100%
Italian Motor 35% 35% 35% 35%
Spanish Motor 30% 30% 30% 30%
French Motor 30% 30% 30% 30%
US Motor 33% 33% 33% 33%
In line with the standard formula approach, underwriting risk capital requirements are calculated net
of co-insurance and reinsurance. However, for UK Motor contracts, both co-insurance and
proportional quota share reinsurance contracts allow Admiral to participate in the profitability of
those portions of the book through profit commission arrangements. The additional risks that the
Group is exposed to through these contracts is captured in the Group’s CAO – refer to section C6
below.
C.2. MARKET RISK
The Group’s investment strategy is primarily focused on capital preservation with additional
priorities being low volatility of returns and high levels of liquidity. The strategy and resulting
portfolio was materially unchanged during 2016, with money market funds, and fixed income debt
securities comprising the majority of the total portfolio.
Further information on the IFRS classification of the Group’s cash and investments is included in the
Group’s 2016 Annual Report.
PRUDENT PERSONS PRINCIPLE
Solvency II has introduced the Prudent Person Principle for managing investments. It has replaced
the previous ‘admissible assets’ rules and is the requirement to invest so as to ensure the security,
quality, liquidity and profitability of the investment portfolio as a whole. It is an example of how risk
management and strategic decision making may be owned by an insurer and its governance
framework.

36 | P a g e
The Prudent Person Principle seeks to ensure that the industry understands and is capable of
managing its investment risks. Specifically, insurers must be able to demonstrate that they can
properly identify measure, monitor, manage, control and report on their investment risks and not
place reliance upon information provided by third parties.
Admiral’s risk management and strategic decision making process in respect of asset investment is centred on the Group’s Investment Committee. The Investment Committee is a Management committee that includes Non –Executive representation. The governance process for material asset investment decisions can be summarised as follows:
At each stage of the process the proposal is subject to review by senior management independent of
the proposal. Implementation of an investment decision is performed only once all stages of
approval have been achieved. The quantitative analysis is considered but also the experience of the
senior management allows for a material qualitative investigation.
Once the purchase has occurred the asset is then part of the ongoing valuation, income and capital
process. The Group Investment Committee meets on a quarterly basis and reviews detailed
Management Information presented on a look-through basis that covers the security, quality,
liquidity and profitability of the portfolio.
MARKET RISK COMPONENTS
Market risk comprises 16% of the Group’s 2016 regulatory SCR. The largest contribution at YE’16 is
from spread risk, primarily reflecting the risk of valuation changes in the Group’s fixed income debt
securities resulting from credit spread changes. Interest rate risk, Equity risk (in relation to the
valuation of the parent company’s holdings in Strategic Participations), Concentration risk and
Spread risk also contribute as noted in the table below. Market risk comprises 10% and 19% of the
SCRs for AICL and AIGL respectively.
•Review of prospective asset class, prospective providers, and proposed assets from a capital and income perspective
•Senior Management review, including Group Chief Financial Officer and Group Chief Risk Officer
•Proposal to Investment Committee
•Proposal to Group Board and to relevant subsidiary Boards
•Investment implementation

37 | P a g e
Risk Description
Interest Rate Risk
The risk of a fall in the value of assets and/or an increase in the value of liabilities, due to changes in the level of interest rates. The standard formula interest rate module captures the net movement of both the Group’s investment portfolio and the Insurance Technical Provisions.
Strategic Participation Risk
The risk of a change in the value of the holdings in non-insurance subsidiary undertakings of Admiral Group. This consists of the investments made in, for example, the Group’s price comparison businesses.
Spread Risk The risk that the value of an investment holding falls, following a change in the riskiness (predominantly credit risk) of the issuing company.
Currency Risk The risk of exchange rate movements that adversely impact the net value of overseas assets and liabilities.
Concentration Risk The risk that Admiral Group holds a concentration of investments within a particular asset class or with a particular counterparty.
C.3. COUNTERPARTY DEFAULT RISK
Credit or Counterparty risk represents the risk of default by reinsurance partners and investment
counterparties holding the Group’s cash balances, in line with the standard formula approach. It
reflects 7% of the Group SCR and is mainly comprised of Type 1 counterparty risk – the risk relating
to default by reinsurance partners.
It is a relatively small component of risk because the Group only enters into reinsurance
arrangements with counterparties of appropriate credit ratings (A- or higher), and because the
Group has ‘funds withheld’ arrangements in place with its largest motor quota share reinsurance
partners in the UK which mitigates a significant proportion of the risk faced.
C.4. LIQUIDITY RISK
Liquidity risk is not a key risk for the Group as both the UK Motor and Household Insurance have
significant cash in-flows of income in advance of claims and expenses being paid, which are expected
to be less than the total premiums received. This reduces the risk of a liquidity strain.
The total amount of expected profit included in future premiums as calculated in accordance with
Article 260 of the Delegated Acts is £14.3 million for the Consolidated Group and £4.3m and £16.4m
for AICL and AIGL respectively.
As noted in section C2 above, one of the Group’s strategic considerations when determining
investment strategy is liquidity and a significant proportion of the funds invested sit in instant access
money market funds.
C.5. OPERATIONAL RISK
Operational risk arises within all areas of the business. The Group, through its ERMF, implements,
maintains and monitors a series of internal controls that aim to mitigate the range of operational
risks that the Group faces.
The operational risk capital requirement is calculated using the standard formula.
38 | P a g e
C.6. OTHER MATERIAL RISKS
CAPITAL ADD-ON
As noted earlier in this section, the Group has applied for a Capital Add-on as a result of limitations
in the standard formula with respect to the Group’s risk profile. The CAO reported in the 2016 Group
annual QRT is £75.8m, following approval in October 2015.
The CAO primarily reflects the following risks:
Risk Description
Profit Commission
Admiral has extensive profit commission arrangements within its co-insurance and quota share reinsurance arrangements. Under stressed conditions, there is a risk that profit commission income recognised in the Solvency II balance sheet will need to be de-recognised, reducing the value of Own Funds.
PPO (Potential and Settled)
Admiral-specific parameters for both reserve and premium risk uncertainty are derived to reflect the risk associated with both future and potential PPOs, which is not deemed to be appropriately reflected in the standard formula parameters. In addition the inflation risk related to settled PPOs is captured in recognition of the limitations of the standard formula life underwriting risk module.
C.7. ANY OTHER INFORMATION
LOSS ABSORBING CAPACITY OF DEFERRED TAXES (LACDT)
At YE’16, the Group’s regulatory SCR is reduced by £22.4 million to reflect the tax losses arising as a
result of the 1 in 200 year event, that may be utilised against current or deferred tax liabilities. The
resulting LACDT can primarily be attributed to the Group’s regulated insurance entities in the UK and
Gibraltar. No LACDT benefit has been recognised on the basis of the potential to offset tax losses
against profits on business that will be written in the future.
RISK SENSITIVITY
The Group has established processes to undertake stress and scenario testing on an ongoing basis,
with testing undertaken at least annually. The stress testing processes operate in collaboration with
the Corporate Governance Committees and involve a number of members of senior and operational
management. The results of the tests undertaken improve the Boards understanding of risk,
influence business decisions and form a key part of the Enterprise Risk Management Framework.
In addition, solvency ratio sensitivities are reported to the Group Board and its Committees on a
regular basis. The following Group solvency ratio sensitivities (as reported in the 2016 Annual
Report) are examples of those that are regularly reviewed:
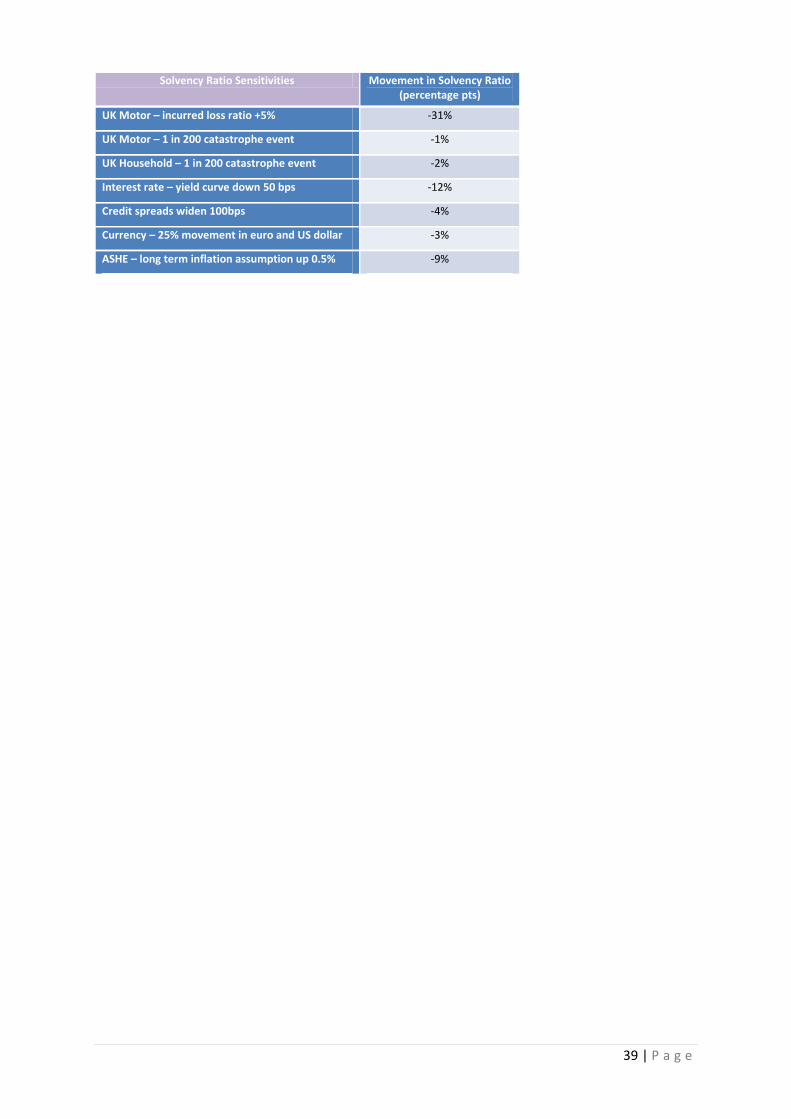
39 | P a g e
Solvency Ratio Sensitivities Movement in Solvency Ratio (percentage pts)
UK Motor – incurred loss ratio +5% -31%
UK Motor – 1 in 200 catastrophe event -1%
UK Household – 1 in 200 catastrophe event -2%
Interest rate – yield curve down 50 bps -12%
Credit spreads widen 100bps -4%
Currency – 25% movement in euro and US dollar -3%
ASHE – long term inflation assumption up 0.5% -9%
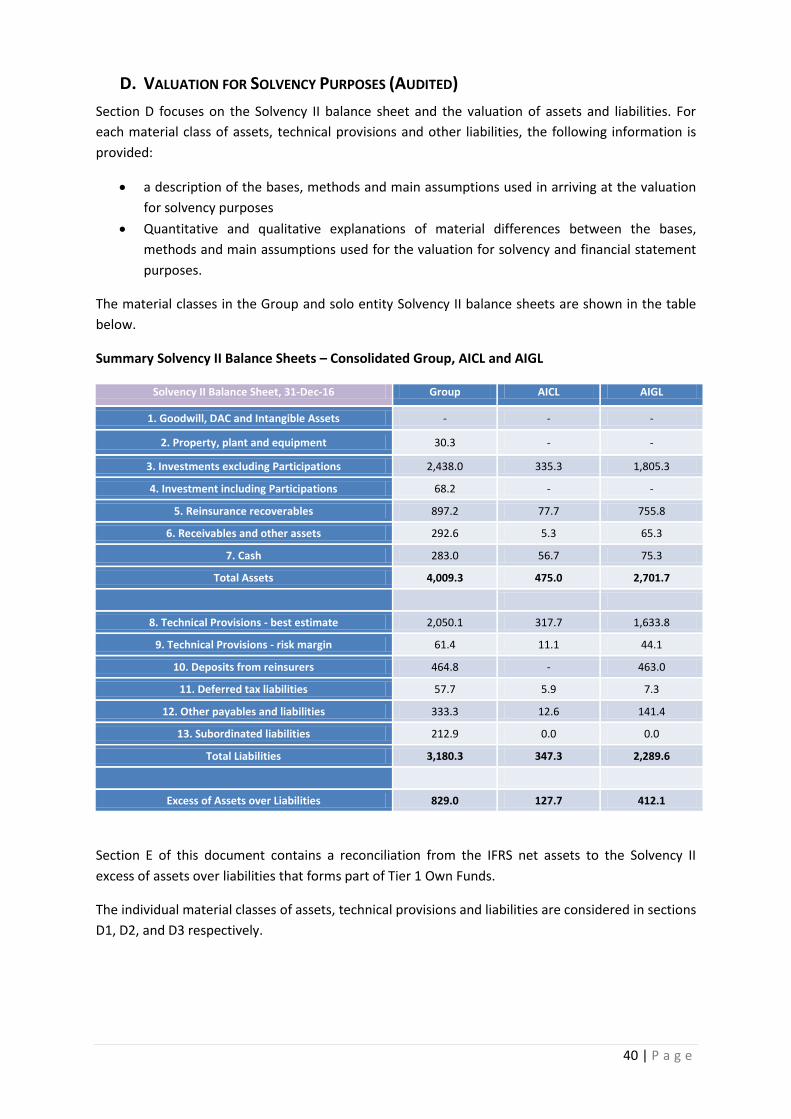
40 | P a g e
D. VALUATION FOR SOLVENCY PURPOSES (AUDITED)
Section D focuses on the Solvency II balance sheet and the valuation of assets and liabilities. For
each material class of assets, technical provisions and other liabilities, the following information is
provided:
a description of the bases, methods and main assumptions used in arriving at the valuation
for solvency purposes
Quantitative and qualitative explanations of material differences between the bases,
methods and main assumptions used for the valuation for solvency and financial statement
purposes.
The material classes in the Group and solo entity Solvency II balance sheets are shown in the table
below.
Summary Solvency II Balance Sheets – Consolidated Group, AICL and AIGL
Solvency II Balance Sheet, 31-Dec-16 Group AICL AIGL
1. Goodwill, DAC and Intangible Assets - - -
2. Property, plant and equipment 30.3 - -
3. Investments excluding Participations 2,438.0 335.3 1,805.3
4. Investment including Participations 68.2 - -
5. Reinsurance recoverables 897.2 77.7 755.8
6. Receivables and other assets 292.6 5.3 65.3
7. Cash 283.0 56.7 75.3
Total Assets 4,009.3 475.0 2,701.7
8. Technical Provisions - best estimate 2,050.1 317.7 1,633.8
9. Technical Provisions - risk margin 61.4 11.1 44.1
10. Deposits from reinsurers 464.8 - 463.0
11. Deferred tax liabilities 57.7 5.9 7.3
12. Other payables and liabilities 333.3 12.6 141.4
13. Subordinated liabilities 212.9 0.0 0.0
Total Liabilities 3,180.3 347.3 2,289.6
Excess of Assets over Liabilities 829.0 127.7 412.1
Section E of this document contains a reconciliation from the IFRS net assets to the Solvency II
excess of assets over liabilities that forms part of Tier 1 Own Funds.
The individual material classes of assets, technical provisions and liabilities are considered in sections
D1, D2, and D3 respectively.

41 | P a g e
D.1. ASSETS
Material Class
1. Goodwill, DAC and Intangible Assets
Goodwill, deferred acquisition costs and intangible assets (primarily internally generated software assets) have no economic value and are therefore eliminated in the transition from IFRS to Solvency II.
2. Property, plant and equipment
Property plant and equipment, PPE (primarily leasehold improvements) are held at the IFRS value of cost less depreciation. This valuation is not considered to differ materially from its economic market value. PPE held in Strategic Participation entities is held within the strategic participation valuation rather than this line item on the SII balance sheet.
3. Investments and 7. Cash
Financial assets and liabilities are held at Fair Value where level 1 inputs can been obtained. Level 1 refers to the first level of the Fair Value hierarchy which categorises valuation inputs into three levels. The hierarchy gives the highest priority (Level 1) to quoted prices in an active market, and the lowest priority to unobservable inputs (Level 3).
Level 1 inputs
Level 1 inputs are quoted prices in active markets for identical assets or liabilities that the entity can access at the measurement date.
A quoted market price in an active market provides the most reliable evidence of fair value and is used without adjustment to measure fair value whenever available, with limited exceptions.
Level 2 inputs
Level 2 inputs are inputs other than quoted market prices included within Level 1 that are observable for the asset or liability, either directly or indirectly.
Level 2 inputs include:
quoted prices for similar assets or liabilities in active markets
quoted prices for identical or similar assets or liabilities in markets that are not active
inputs other than quoted prices that are observable for the asset or liability, for example
o interest rates and yield curves observable at commonly quoted intervals
o implied volatilities o credit spreads
inputs that are derived principally from or corroborated by observable market data by correlation or other means ('market-corroborated inputs').
The Group currently categorises its valuation of investments in money market funds fixed income debt securities, and government gilts as Level 1.
Level 1 valuations for money market funds, fixed income debt securities and
government gilts reflect the fair value (the amount a third party would pay for the asset
on the valuation date), and are obtained externally from observable market
information. This valuation is consistent with the IFRS valuation, except for government
gilts which are held on an amortised cost basis within the IFRS financial statements.
Cash and term deposits are held at amortised cost which is materially consistent with as
fair value. This is in line with the IFRS valuation.
4. Investments in Participations
Participations are valued and accounted for using the adjusted net equity method for solvency II purposes. This is different to the IFRS valuation which is based on an unadjusted IFRS net asset valuation – the differences therefore relate to the adjustments noted in these valuation policies.

42 | P a g e
5. Reinsurance Recoverables Refer to Technical Provisions section (D.3).
6. Receivables and other assets
The fair value of receivables is based on the amortised cost valuation, in line with Level 2 of the FV hierarchy noted above. This amortised cost valuation approximates to fair value and therefore there are no valuation differences between IFRS and SII valuation.
D.2. LIABILITIES
Material Class
8. Technical Provisions - best estimate
Refer to Technical Provisions section (D.3).
9. Technical Provisions - risk margin
Refer to Technical Provisions section (D.3).
10. Deposits from reinsurers Deposits from reinsurers reflect amounts held in relation to reinsurance contracts. The balances are valued on a historic cost basis.
11. Deferred tax liabilities
The deferred tax liability in the Group Solvency II balance sheet reflects the net deferred tax liability on a Solvency II basis using the valuation rules within IAS 12. The revaluation reflects the deferred tax impact of the revaluations made between IFRS and Solvency II in the other balance sheet line items, primarily the release of margin in the Technical Provisions and Profit Commission balances.
The IFRS deferred tax balance is a net deferred tax asset.
12. Other payables and liabilities
Other payables and liabilities primarily reflect other balances with co-insurers and reinsurers, not classified elsewhere and balances between the entities within the scope of the Solvency II Group and related participations.
The balances are valued on an amortised cost basis which is materially consistent with fair value; this valuation is the same as the IFRS valuation.
13. Subordinated liabilities
Subordinated liabilities reflects the Groups’ 10 year subordinated bonds. For Solvency II purposes it is included at fair value (excluding the impact of changes in Admiral’s own credit quality). On an IFRS basis, it is held at amortised cost.
D.3. TECHNICAL PROVISIONS
TECHNICAL PROVISIONS – BEST ESTIMATE
Best estimate technical provisions for Group and solo entity material lines of business are as follows:
Best estimate technical provisions - Group
31-Dec-16 Motor Vehicle Liability
Motor Vehicle Other
Fire and Other
Damage to Property
General Liability
Life Other Total
Gross - Best Estimate
1,833.2 130.0 0.8 35.7 34.5 15.9 2,050.1
Recoverable from reinsurers
785.0 79.8 0.6 25.4 6.4 0.0 897.2
Net - Best Estimate 1,048.2 50.2 0.2 10.3 28.1 15.9 1,152.9
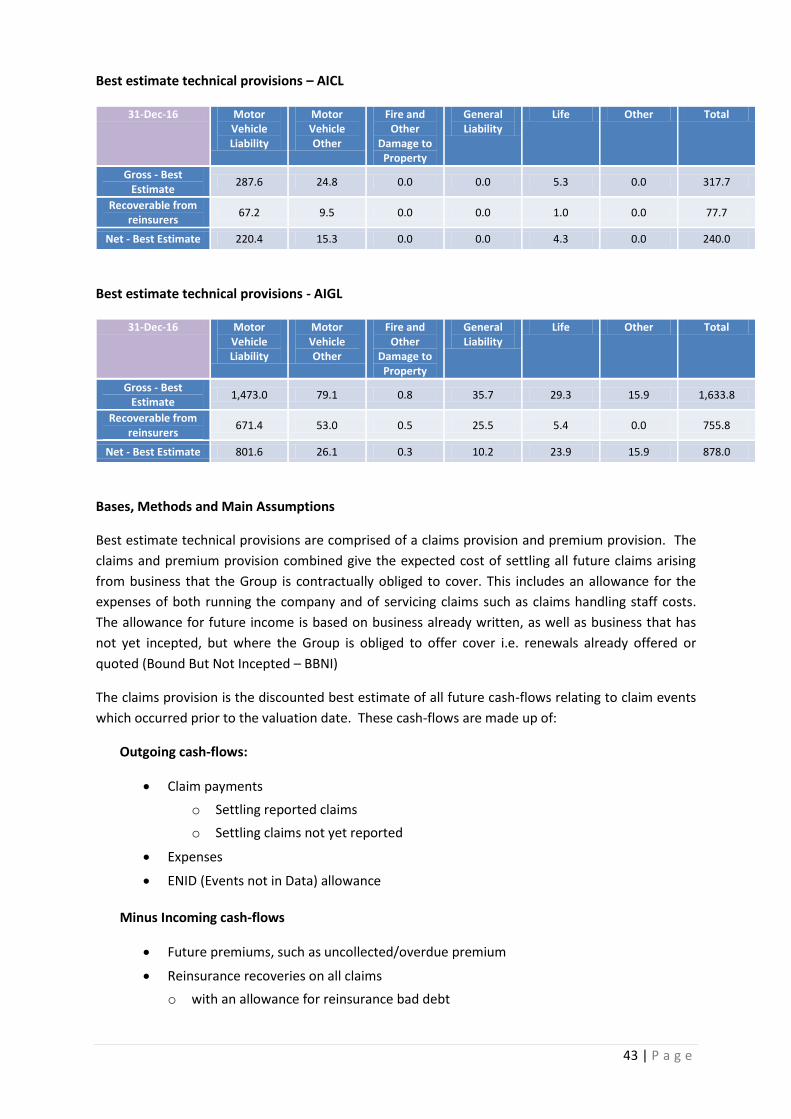
43 | P a g e
Best estimate technical provisions – AICL
31-Dec-16 Motor Vehicle Liability
Motor Vehicle Other
Fire and Other
Damage to Property
General Liability
Life Other Total
Gross - Best Estimate
287.6 24.8 0.0 0.0 5.3 0.0 317.7
Recoverable from reinsurers
67.2 9.5 0.0 0.0 1.0 0.0 77.7
Net - Best Estimate 220.4 15.3 0.0 0.0 4.3 0.0 240.0
Best estimate technical provisions - AIGL
31-Dec-16 Motor Vehicle Liability
Motor Vehicle Other
Fire and Other
Damage to Property
General Liability
Life Other Total
Gross - Best Estimate
1,473.0 79.1 0.8 35.7 29.3 15.9 1,633.8
Recoverable from reinsurers
671.4 53.0 0.5 25.5 5.4 0.0 755.8
Net - Best Estimate 801.6 26.1 0.3 10.2 23.9 15.9 878.0
Bases, Methods and Main Assumptions
Best estimate technical provisions are comprised of a claims provision and premium provision. The
claims and premium provision combined give the expected cost of settling all future claims arising
from business that the Group is contractually obliged to cover. This includes an allowance for the
expenses of both running the company and of servicing claims such as claims handling staff costs.
The allowance for future income is based on business already written, as well as business that has
not yet incepted, but where the Group is obliged to offer cover i.e. renewals already offered or
quoted (Bound But Not Incepted – BBNI)
The claims provision is the discounted best estimate of all future cash-flows relating to claim events
which occurred prior to the valuation date. These cash-flows are made up of:
Outgoing cash-flows:
Claim payments
o Settling reported claims
o Settling claims not yet reported
Expenses
ENID (Events not in Data) allowance
Minus Incoming cash-flows
Future premiums, such as uncollected/overdue premium
Reinsurance recoveries on all claims
o with an allowance for reinsurance bad debt
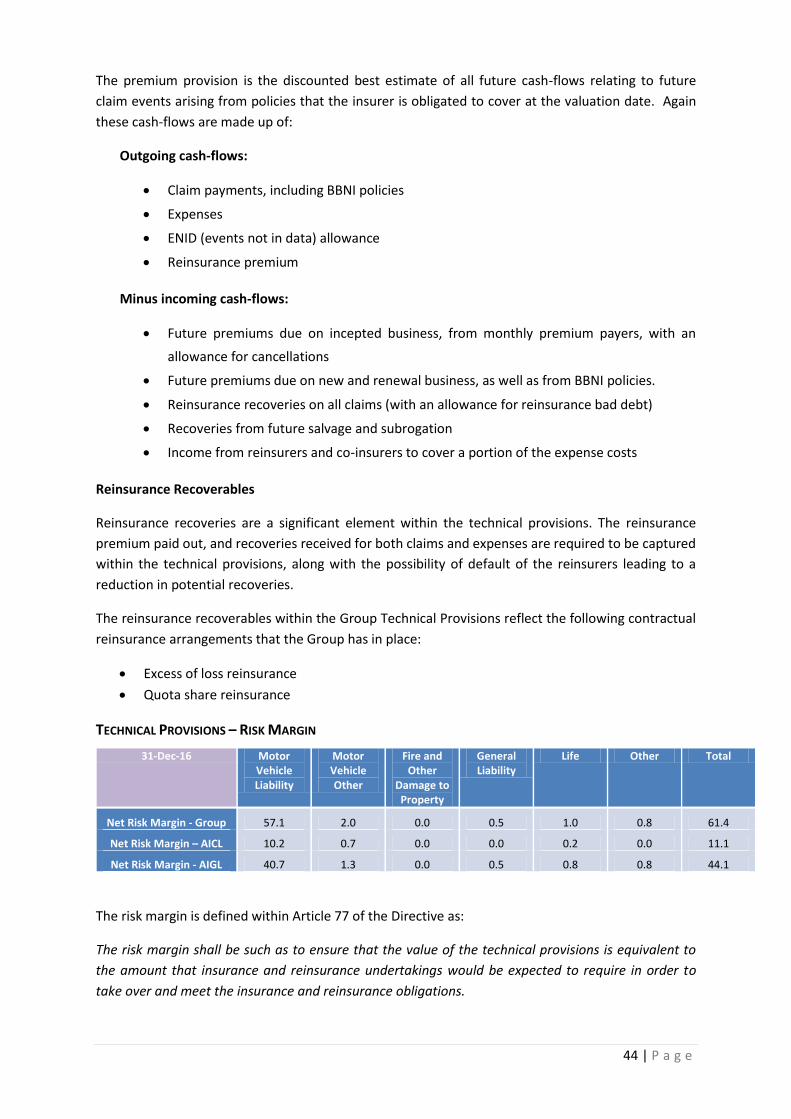
44 | P a g e
The premium provision is the discounted best estimate of all future cash-flows relating to future
claim events arising from policies that the insurer is obligated to cover at the valuation date. Again
these cash-flows are made up of:
Outgoing cash-flows:
Claim payments, including BBNI policies
Expenses
ENID (events not in data) allowance
Reinsurance premium
Minus incoming cash-flows:
Future premiums due on incepted business, from monthly premium payers, with an
allowance for cancellations
Future premiums due on new and renewal business, as well as from BBNI policies.
Reinsurance recoveries on all claims (with an allowance for reinsurance bad debt)
Recoveries from future salvage and subrogation
Income from reinsurers and co-insurers to cover a portion of the expense costs
Reinsurance Recoverables
Reinsurance recoveries are a significant element within the technical provisions. The reinsurance
premium paid out, and recoveries received for both claims and expenses are required to be captured
within the technical provisions, along with the possibility of default of the reinsurers leading to a
reduction in potential recoveries.
The reinsurance recoverables within the Group Technical Provisions reflect the following contractual
reinsurance arrangements that the Group has in place:
Excess of loss reinsurance
Quota share reinsurance
TECHNICAL PROVISIONS – RISK MARGIN
31-Dec-16 Motor Vehicle Liability
Motor Vehicle Other
Fire and Other
Damage to Property
General Liability
Life Other Total
Net Risk Margin - Group 57.1 2.0 0.0 0.5 1.0 0.8 61.4
Net Risk Margin – AICL 10.2 0.7 0.0 0.0 0.2 0.0 11.1
Net Risk Margin - AIGL 40.7 1.3 0.0 0.5 0.8 0.8 44.1
The risk margin is defined within Article 77 of the Directive as:
The risk margin shall be such as to ensure that the value of the technical provisions is equivalent to
the amount that insurance and reinsurance undertakings would be expected to require in order to
take over and meet the insurance and reinsurance obligations.
45 | P a g e
The risk margin calculation uses the first simplification within the delegated acts, which is applied as
follows:
The one-year SCR is run off in line with the level of claims and premium provisions expected to remain at each year-end position,
The prescribed cost of capital of 6% is applied to each SCR
The SCRs are then discounted to the valuation date using the prescribed EIOPA yield curve.
Material Changes in Assumptions
Other than those changes that relate to the change in Ogden discount rate referenced earlier in this
report, there have been no material changes in assumptions applied to the technical provisions
during the period.
Key Uncertainties
There are many areas of uncertainty within the technical provisions. Estimation techniques are
therefore used in the calculation of the ultimate cost of settling both claims that have occurred prior
to the balance sheet date and remain unsettled at the balance sheet date, and claims costs that will
arise in relation to events that have not happened at the balance sheet date.
The projected ultimate cost of claims is calculated using a variety of different actuarial projection
techniques (including incurred and paid chain ladder and an average cost of claim approach) to allow
an actuarial assessment of their potential outcome. They include allowance for unreported claims.
The most significant sensitivity in the use of the projection techniques arises from any future step
change in claims costs, which would cause future claim cost inflation to deviate from historic trends.
This is most likely to arise from a change in the regulatory or judicial regime that leads to an increase
in awards or legal costs for bodily injury claims that is significantly above or below the historical
trend.
An example of this is the change in Ogden discount rate that was announced in February 2017 and is
discussed earlier in this report.
RECONCILIATION TO IFRS VALUES
The best estimate Solvency II technical provisions for the Group and solo entities are lower than the
equivalent provisions held on an IFRS basis for financial statement purposes.
This is primarily due to the following:
Removal of margin held above best estimate in IFRS reserves, partially offset by the
introduction of additional SII reserves for loss adjustment expenses, and Events Not in Data.
The SII approach to calculation of the premium provision (including the transfer of future
premium cash-flows into technical provisions from other financial statement line items)
The approach to discounting, with SII technical provisions being discounted using the EIOPA
yield curve.
The introduction of the SII risk margin reduces the net impact of the reduction in provisions on
translation from IFRS to SII.
46 | P a g e
ADJUSTMENTS AND SIMPLIFICATIONS
The Matching Adjustment has not been applied in the calculation of Technical Provisions at 31
December 2016.
The Volatility Adjustment (VA) is not applied in the calculation of Technical Provisions at 31
December 2016. In February 2017, the Group obtained approval to use the VA in the calculation of
technical provisions for the Group and its regulated subsidiaries from the UK and Gibraltar
regulators.
The transitional risk-free interest rate term structure as per Article 308c of the Directive has not
been applied in the calculation of Technical Provisions at 31 December 2016.
The transitional deduction as per Article 308d of the Directive has not been applied in the calculation
of Technical Provisions at 31 December 2016.
D.4. ALTERNATIVE METHODS OF VALUATION
No alternative methods for valuation have been applied.
D.5. ANY OTHER INFORMATION
None.
47 | P a g e
E. CAPITAL MANAGEMENT (AUDITED)
METHOD OF CALCULATION OF GROUP SOLVENCY
Group solvency is calculated as the ratio of Eligible Group Own Funds to the Group Solvency Capital
Requirement.
Articles 230 and 233 of the Directive prescribe that one of the following methods must be used to
calculate Group solvency:
Method 1 – Standard method based on Consolidation of financial statements
Method 2 – Alternative method based on a deduction and aggregation approach
The Group applies Method 1 for the calculation of Group solvency. The basis for the consolidation is
a Solvency II Group consisting of the following entities:
Entity Description
Admiral Group plc (Parent) Insurance holding company
Admiral Insurance Company Limited UK regulated insurance entity
Admiral Insurance (Gibraltar) Limited Gibraltar regulated insurance entity
Elephant Insurance Company Limited Third country insurance entity
EUI Limited Ancillary services undertaking
EUI France Limited Ancillary services undertaking
Elephant Insurance Services Limited Ancillary services undertaking
All remaining Group subsidiaries are included as strategic participation investments in the parent
company.
E.1. OWN FUNDS
CAPITAL MANAGEMENT OBJECTIVES
The Group manages its capital to ensure that all entities within the Group are able to continue as
going concerns and also to ensure that regulated entities meet regulatory requirements with an
appropriate margin. Excess capital above these levels within subsidiaries is paid up to the Group
holding company in the form of dividends on a regular basis. Forward looking assessments of Capital
are performed on a three year basis and a reported with the Group’s annual ORSA process.
The Group’s dividend policy is to pay 65% of IFRS post-tax profits as a normal dividend and to pay a
further special dividend comprising earnings not required to be held in the Group for solvency or
other potential uses of Capital.

48 | P a g e
The strength of the Group’s capital position at YE’16 allowed the Board to propose, and shareholders
approve, a 2016 final dividend of 51.5 pence per share (£144 million), as follows:
15.0 pence per share representing a normal element, based on the dividend policy of
distributing 65% of post-tax profits; and
A special element of 36.5 pence per share.
This dividend has been deducted from Tier 1 Own Funds as noted in the following section. It was
paid on 2 June 2017.
CLASSIFICATION OF OWN FUNDS BY TIER
The classification of Own Funds for the Group and solo entities at 31 December 2016 is as follows:
Group AICL AIGL
31-Dec-16 TO COVER SCR
TO COVER MCR
TO COVER SCR
TO COVER MCR
TO COVER SCR
TO COVER MCR
Ordinary Share Capital 0.3 0.3 37.3 37.3 0.1 0.1
Share Premium Account 13.1 13.1 - - 14.9 14.9
Reconciliation Reserve 671.6 671.6 90.4 90.4 397.1 397.1
Deductions (6.7) (6.7) - - - -
Tier 1 Own Funds 678.4 678.4 127.7 127.7 412.1 412.1
Subordinated Liabilities 212.9 212.9 - - - -
Tier 2 Own Funds 212.9 212.9 0.0 0.0 0.0 0.0
Total Basic Own Funds 891.3 891.3 127.7 127.7 412.1 412.1
Ancillary Own Funds - - - - 120.0 -
Total Available Own Funds 891.3 891.3 127.7 127.7 532.1 412.1
Total Eligible Own Funds 891.3 707.3 127.7 127.7 532.1 412.1
Tier 1 Own Funds
Tier 1 Own Funds consist of Ordinary Share Capital, Share Premium and the Reconciliation Reserve,
which includes a deduction for foreseeable dividends. Total Tier 1 Own Funds may be reconciled to
the excess of assets over liabilities in the Solvency II balance sheet (as documented in section D) as
follows:

49 | P a g e
Tier 1 Group Own Funds – composition
The excess of asset over liabilities of £829.0m can be reconciled to the equity shown in the Group’s
2016 financial statements of £581.7m as follows:
Reconciliation of IFRS Net Assets to Excess of assets over liabilities - Group
As noted in section D, the primary valuation difference (£463 million) arises on the transition from
net IFRS insurance liabilities and amounts due to and from co-insurers and reinsurers in relation to
profit commission, to Solvency II technical provisions and profit commission balances. The majority
of the change in deferred tax (-£62.5 million) relates to the additional liability that arises from the
release of profit on the transfer to SII best estimate technical provisions and profit commissions.
The other material adjustment is the elimination of the Group’s intangible assets (goodwill, software
and deferred acquisition costs) which totals £160 million.
For both AICL and AIGL, the ‘excess of assets over liabilities’ is equivalent to Tier 1 Own Funds. The
reconciliations of IFRS Net Assets to the SII excess of assets over liabilities are as follows:

50 | P a g e
Reconciliation of IFRS Net Assets to Excess of assets over liabilities – AICL
Reconciliation of IFRS Net Assets to Excess of assets over liabilities - AIGL
FUNGIBILITY AND TRANSFERABILITY OF GROUP OWN FUNDS
The Group has not identified any material restrictions to the fungibility and transferability of Group
Own Funds. The deduction to Tier 1 Own Funds (of £6.7 million noted above) relates to the
restriction to own funds arising from the calculation of the contribution of subsidiaries to the Group
as per Guideline 12 in the EIOPA Level 3 guidelines on Group Solvency (as documented in Technical
Annex 1 to that paper).
The restriction arises due to the recognition of diversification effects at Group level. It is not a
significant restriction as there is limited intra-entity diversification at Group level, with the main
diversification effects arising within the two regulated subsidiaries.
Tier 2 Own Funds
Tier 2 Own Funds consist of subordinated liabilities in the form of the Group’s 10 year dated, listed
subordinated debt. The debt was issued in July 2014 and matures in July 2024 and pays a fixed rate
of interest of 5.5%. On issuance, the Group obtained confirmation from the UK regulator, the PRA
that the debt qualifies as Solvency II Tier 2 Own Funds.
329.0
412.1
101.3
-10.9
-7.3
0
50
100
150
200
250
300
350
400
450
IFRS Net Assets Intangible Asset Elimination
Revaluation of TPs and Profit commission
Deferred tax Excess of assets over liabilities
£m
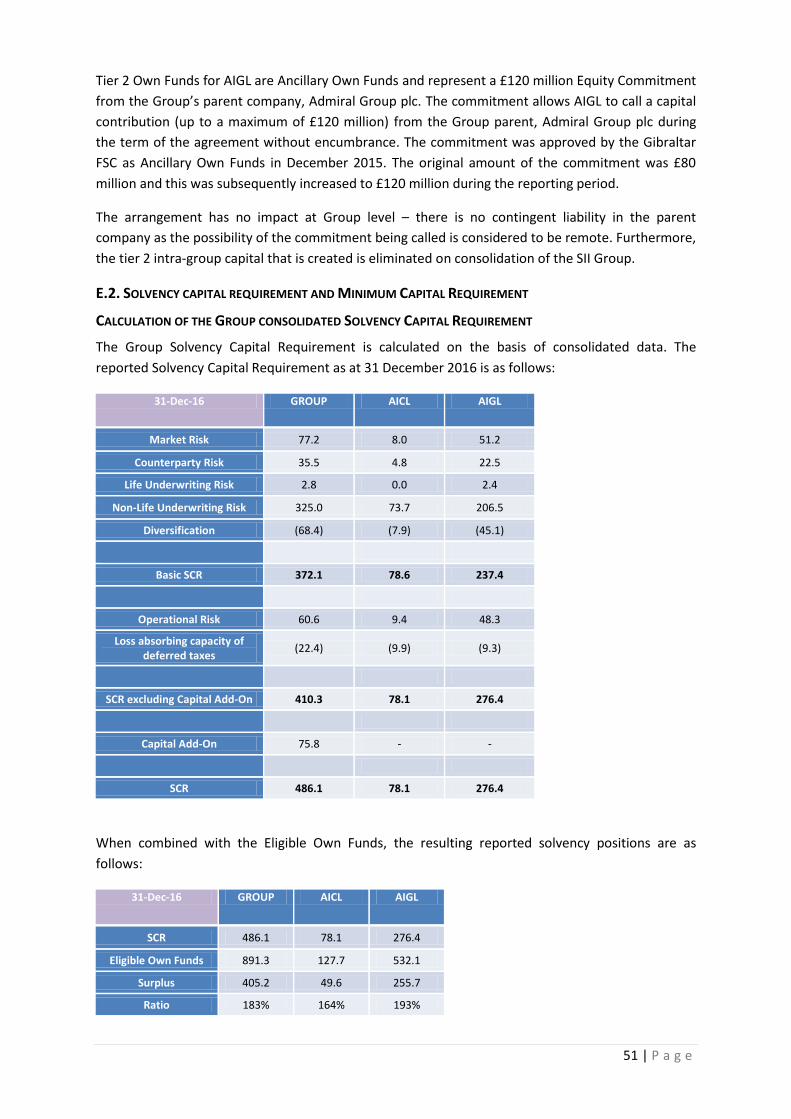
51 | P a g e
Tier 2 Own Funds for AIGL are Ancillary Own Funds and represent a £120 million Equity Commitment
from the Group’s parent company, Admiral Group plc. The commitment allows AIGL to call a capital
contribution (up to a maximum of £120 million) from the Group parent, Admiral Group plc during
the term of the agreement without encumbrance. The commitment was approved by the Gibraltar
FSC as Ancillary Own Funds in December 2015. The original amount of the commitment was £80
million and this was subsequently increased to £120 million during the reporting period.
The arrangement has no impact at Group level – there is no contingent liability in the parent
company as the possibility of the commitment being called is considered to be remote. Furthermore,
the tier 2 intra-group capital that is created is eliminated on consolidation of the SII Group.
E.2. SOLVENCY CAPITAL REQUIREMENT AND MINIMUM CAPITAL REQUIREMENT
CALCULATION OF THE GROUP CONSOLIDATED SOLVENCY CAPITAL REQUIREMENT
The Group Solvency Capital Requirement is calculated on the basis of consolidated data. The
reported Solvency Capital Requirement as at 31 December 2016 is as follows:
31-Dec-16 GROUP AICL AIGL
Market Risk 77.2 8.0 51.2
Counterparty Risk 35.5 4.8 22.5
Life Underwriting Risk 2.8 0.0 2.4
Non-Life Underwriting Risk 325.0 73.7 206.5
Diversification (68.4) (7.9) (45.1)
Basic SCR 372.1 78.6 237.4
Operational Risk 60.6 9.4 48.3
Loss absorbing capacity of deferred taxes
(22.4) (9.9) (9.3)
SCR excluding Capital Add-On 410.3 78.1 276.4
Capital Add-On 75.8 - -
SCR 486.1 78.1 276.4
When combined with the Eligible Own Funds, the resulting reported solvency positions are as
follows:
31-Dec-16 GROUP AICL AIGL
SCR 486.1 78.1 276.4
Eligible Own Funds 891.3 127.7 532.1
Surplus 405.2 49.6 255.7
Ratio 183% 164% 193%
52 | P a g e
CALCULATION OF THE MINIMUM CAPITAL REQUIREMENT
The Group Minimum Capital Requirement at 31 December 2016 is £144.7 million. It is calculated in
line with Article 230 of the Directive as the minimum of:
The Minimum Capital Requirement, calculated for the Group as per Article 129 of the
Directive; and
The Group’s proportional share of the MCR of the related undertakings
The Minimum Capital Requirement for the solo entities is calculated as per Article 129 of the
Directive.
The coverage of eligible own funds to MCR at 31 December 2016 is as follows:
31-Dec-16 GROUP AICL AIGL
MCR 144.7 34.2 110.5
Eligible Own Funds 707.3 127.7 412.1
Surplus 562.6 93.5 301.6
Ratio 489% 373% 373%
E.3. USE OF THE DURATION-BASED EQUITY SUB-MODULE IN THE CALCULATION OF THE SOLVENCY CAPITAL
REQUIREMENT
The duration based equity sub-module has not been used in the calculation of the Solvency Capital
Requirement.
E.4. DIFFERENCES BETWEEN THE STANDARD FORMULA AND ANY INTERNAL MODEL USED
Not applicable – no internal model has been used during the reporting period.
E.5. NON COMPLIANCE WITH THE MINIMUM CAPITAL REQUIREMENT AND NON-COMPLIANCE WITH THE
SOLVENCY CAPITAL REQUIREMENT
There have been no instances of non compliance with the Minimum Capital Requirement or the
Solvency Capital Requirement during the period.
E.6. ANY OTHER INFORMATION
Movement in SCR, MCR and Own Funds over the period (unaudited)
The following tables summarise the change in SCR, MCR and Own Funds for the Consolidated Group
and the SII solo entities over the reporting period, with material movements noted below each table.
SCR GROUP AICL AIGL
2016 Annual Submission 486.1 78.1 276.4
Day 1 Submission 425.7 68.3 257.7
Movement 60.4 9.8 18.7

53 | P a g e
The increase in SCR for Group, AIGL and AICL is primarily the result of an increase in non-life
underwriting risk over the year. This in turn reflects increasing exposures through growth across all
SII lines of business
MCR GROUP AICL AIGL
2016 Annual Submission 144.7 34.2 110.5
Day 1 Submission 102.9 30.7 92.8
Movement 41.8 3.5 17.7
On a similar basis to the SCR, the increase in MCR over the period for group, AIGL and AICL also
relates to the growth over the period.
Own Funds GROUP AICL AIGL
2016 Annual Submission 891.3 127.7 532.1
Day 1 Submission 839.2 116.9 327.6
Movement 52.1 10.8 204.5
In relation to Own Funds, the material increase in the period is observed in AIGL, with increases in
Basic tier 1 and Ancillary tier 2 own funds. The increase in tier 1 primarily relates to the retention of
profits during the period, whilst the increase in tier 2 reflects an increase in the amount committed
under the intra-group equity commitment from £80m to £120m.
Reconciliation to previously reported Solvency Ratio (unaudited)
The Group solvency ratio presented in this report is different to the solvency ratio reported in the
Group’s annual report as it is prepared at a different valuation date and it excludes the impact of
approvals that have either been received or are due to be received post year end. The chart below
shows the impact of these moves:
183%
212%
10%8%
10%1%
0%
50%
100%
150%
200%
250%
YE'16 SFCR Change in Valuation Date
Impact of VA Impact of proposed CAO Other YE'16 Annual Report
£m
54 | P a g e
Change in Valuation Date The solvency ratio in this report excludes the projected growth in economic capital between the year end and the date of the Annual Report (which was previously reported)
Impact of VA The ratio reported in the Group’s annual report reflected the use of the ‘Volatility Adjustment’ for which the Group obtained regulatory approval in February 2017. The ratio in this report does not include the impact of the Volatility Adjustment.
Impact of proposed CAO The ratio reported in the Group’s annual report reflected the proposed revision to the Group Capital Add-on (CAO) which was under discussion with the Group regulator, the PRA. This was reported as ‘subject to regulatory approval’ and ‘unaudited’. The ratio reported in this SFCR reflects the previous CAO for which regulatory approval was in place at the valuation date. The proposed revision to the CAO remains under discussion with the PRA. The Group expects the process to be completed prior to the Group HY’17 interim results announcement and an update will be provided at this time.
Other Other minor changes to both SCR and Own Funds calculations arising from the reporting finalisation process.
55 | P a g e
APPENDIX 1 – GLOSSARY
Term Definition
Accident year The year in which an accident occurs, also referred to as the earned basis.
Actuarial best estimate The probability-weighted average of all future claims and cost scenarios calculated using historical data, actuarial methods and judgement.
ASHE ‘Annual Survey of Hours and Earnings’ – a statistical index that is typically used for calculation inflation of annual payment amounts under Periodic Payment Order (PPO) claims settlements.
Claims reserves A monetary amount set aside for the future payment of incurred claims that have not yet been settled, thus representing a balance sheet liability.
Co-insurance An arrangement in which two or more insurance companies agree to underwrite insurance business on a specified portfolio in specified proportions. Each co-insurer is directly liable to
the policyholder for their proportional share.
Commutation An agreement between a ceding insurer and the reinsurer that provides for the valuation, payment, and complete discharge of all obligations between the parties under a particular
reinsurance contract.
Insurance market cycle The tendency for the insurance market to swing between highs and lows of profitability over time, with the potential to influence premium rates (also known as the “underwriting cycle”).
Net claims The cost of claims incurred in the period, less any claims costs recovered under reinsurance contracts. It includes both claims payments and movements in claims reserves.
Net insurance premium revenue
Also referred to as net earned premium. The element of premium, less reinsurance premium, earned in the period.
Ogden discount rate The discount rate used in calculation of personal injury claims settlements. The rate is set by the Lord Chancellor, the most recent rate of minus 0.75% being announced on 27 February
2017.
Periodic Payment Order (PPO) A compensation award as part of a claims settlement that involves making a series of annual payments to a claimant over their remaining life to cover the costs of the care they will
require.
Premium A series of payments are made by the policyholder, typically monthly or annually, for part of or all of the duration of the contract. Written premium refers to the total amount the
policyholder has contracted for, whereas earned premium refers to the recognition of this premium over the life of the contract.
Profit commission A clause found in some reinsurance and coinsurance agreements that provides for profit sharing.
Reinsurance Contractual arrangements whereby the Group transfers part or all of the insurance risk accepted to another insurer. This can be on a quota share basis (a percentage share of
premiums, claims and expenses) or an excess of loss basis (full reinsurance for claims over an agreed value).
Ultimate loss ratio The projected ratio for a particular accident year or underwriting year, often used in the calculation of underwriting profit and profit commission.
Underwriting year The year in which the policy was incepted.
Underwriting year basis Also referred to as the written basis. Claims incurred are allocated to the calendar year in which the policy was underwritten. Underwriting year basis results relate to the 2015 underwriting year, are calculated on the whole account (including co-insurance and
reinsurance shares) and include all premiums, claims, expenses incurred and other revenue (for example instalment income and commission income relating to the sale of products that
are ancillary to the main insurance policy) relating to policies incepting in the relevant underwriting year.
Written/Earned basis A policy can be written in one calendar year but earned over a subsequent calendar year.

56 | P a g e
APPENDIX 2 – QUANTITATIVE REPORTING TEMPLATES
The Group and its subsidiaries are required to disclose the following templates as set out in the
Commission Implementing Regulation (EU) 2015/2452 of 2 December 2015 laying down
implementing technical standards with regard to the procedures, formats and templates of the
solvency and financial condition report in accordance with Directive 2009/138/EC of the European
Parliament and of the Council:
Group
Template Code Template Name
S.02.01.02 Balance sheet
S.05.01.02 Premiums, claims and expenses by line of business
S.05.02.01 Premiums, claims and expenses by country
S.23.01.22 Own Funds
S.25.01.22 Solvency Capital Requirement – for Groups on standard formula
S.32.01.22 Undertakings in the scope of the Group
Admiral Insurance Company Limited (AICL)
Template Code Template Name
S.02.01.02 Balance sheet
S.05.01.02 Premiums, claims and expenses by line of business
S.05.02.01 Premiums, claims and expenses by country
S.12.01.02 Life and Health SLT technical provisions
S.17.01.02 Non-life technical provisions
S.19.01.21 Non- life insurance claims
S.23.01.01 Own Funds
S.25.01.21 Solvency Capital Requirement – for undertakings on standard formula
S.28.01.01 Minimum Capital Requirement – only life or non-life insurance or reinsurance activity
Admiral Insurance (Gibraltar) Limited (AIGL)
Template Code Template Name
S.02.01.02 Balance sheet
S.05.01.02 Premiums, claims and expenses by line of business
S.05.02.01 Premiums, claims and expenses by country
S.12.01.02 Life and Health SLT technical provisions
S.17.01.02 Non-life technical provisions
S.19.01.21 Non- life insurance claims
S.23.01.01 Own Funds
S.25.01.21 Solvency Capital Requirement – for undertakings on standard formula
S.28.01.01 Minimum Capital Requirement – only life or non-life insurance or reinsurance activity

Admiral Group Plc
Solvency and Financial Condition Report
Disclosures
31 December
2016
(Monetary amounts in GBP thousands)

S.02.01.02 - £'000
Balance sheetSolvency II
value
Assets C0010
R0030 Intangible assets
R0040 Deferred tax assets
R0050 Pension benefit surplus
R0060 Property, plant & equipment held for own use 30,341
R0070 Investments (other than assets held for index-linked and unit-linked contracts) 2,506,201
R0080 Property (other than for own use) 0
R0090 Holdings in related undertakings, including participations 68,222
R0100 Equities 0
R0110 Equities - listed 0
R0120 Equities - unlisted 0
R0130 Bonds 1,494,874
R0140 Government Bonds 277,166
R0150 Corporate Bonds 976,204
R0160 Structured notes 0
R0170 Collateralised securities 241,504
R0180 Collective Investments Undertakings 765,716
R0190 Derivatives 4,723
R0200 Deposits other than cash equivalents 172,667
R0210 Other investments 0
R0220 Assets held for index-linked and unit-linked contracts
R0230 Loans and mortgages 0
R0240 Loans on policies 0
R0250 Loans and mortgages to individuals
R0260 Other loans and mortgages
R0270 Reinsurance recoverables from: 897,164
R0280 Non-life and health similar to non-life 890,763
R0290 Non-life excluding health 890,763
R0300 Health similar to non-life
R0310 Life and health similar to life, excluding index-linked and unit-linked 6,401
R0320 Health similar to life
R0330 Life excluding health and index-linked and unit-linked 6,401
R0340 Life index-linked and unit-linked
R0350 Deposits to cedants 0
R0360 Insurance and intermediaries receivables 172,717
R0370 Reinsurance receivables 8,707
R0380 Receivables (trade, not insurance) 109,681
R0390 Own shares (held directly) 0
R0400 Amounts due in respect of own fund items or initial fund called up but not yet paid in 0
R0410 Cash and cash equivalents 283,006
R0420 Any other assets, not elsewhere shown 1,455
R0500 Total assets 4,009,272
S.02.01.02 - £'000
Balance sheet
Solvency II value
Liabilities C0010
R0510 Technical provisions - non-life 2,075,950
R0520 Technical provisions - non-life (excluding health) 2,075,950
R0530 TP calculated as a whole
R0540 Best Estimate 2,015,540
R0550 Risk margin 60,410
R0560 Technical provisions - health (similar to non-life) 0
R0570 TP calculated as a whole
R0580 Best Estimate
R0590 Risk margin
R0600 Technical provisions - life (excluding index-linked and unit-linked) 35,581
R0610 Technical provisions - health (similar to life) 35,581
R0620 TP calculated as a whole
R0630 Best Estimate 34,546
R0640 Risk margin 1,035
R0650 Technical provisions - life (excluding health and index-linked and unit-linked) 0
R0660 TP calculated as a whole
R0670 Best Estimate
R0680 Risk margin
R0690 Technical provisions - index-linked and unit-linked 0
R0700 TP calculated as a whole
R0710 Best Estimate
R0720 Risk margin
R0740 Contingent liabilities
R0750 Provisions other than technical provisions
R0760 Pension benefit obligations
R0770 Deposits from reinsurers 464,769
R0780 Deferred tax liabilities 57,731
R0790 Derivatives 4
R0800 Debts owed to credit institutions 20,000
R0810 Financial liabilities other than debts owed to credit institutions
R0820 Insurance & intermediaries payables 0
R0830 Reinsurance payables 0
R0840 Payables (trade, not insurance) 313,313
R0850 Subordinated liabilities 212,900
R0860 Subordinated liabilities not in BOF
R0870 Subordinated liabilities in BOF 212,900
R0880 Any other liabilities, not elsewhere shown 0
R0900 Total liabilities 3,180,250
R1000 Excess of assets over liabilities 829,022

S.05.01.02 (unaudited) - £'000
Non-life
Medical expense
insurance
Income protection insurance
Workers' compensation
insurance
Motor vehicle liability
insurance
Other motor insurance
Marine, aviation and
transport insurance
Fire and other damage to property insurance
General liability
insurance
Credit and suretyship insurance
Legal expenses insurance
AssistanceMisc.
financial lossHealth Casualty
Marine, aviation and
transportProperty
C0010 C0020 C0030 C0040 C0050 C0060 C0070 C0080 C0090 C0100 C0110 C0120 C0130 C0140 C0150 C0160 C0200
Premiums written
R0110 Gross - Direct Business 1,069,150 298,439 73,135 192 15,560 25,572 1,482,048
R0120 Gross - Proportional reinsurance accepted 0
R0130 Gross - Non-proportional reinsurance accepted 0
R0140 Reinsurers' share 646,459 183,461 52,773 138 782 0 883,613
R0200 Net 422,691 114,978 20,363 53 14,778 25,572 598,435
Premiums earned
R0210 Gross - Direct Business 985,020 270,757 61,219 161 14,144 22,315 1,353,615
R0220 Gross - Proportional reinsurance accepted 0
R0230 Gross - Non-proportional reinsurance accepted 0
R0240 Reinsurers' share 594,018 165,962 44,303 116 383 0 804,783
R0300 Net 391,002 104,795 16,916 44 13,761 22,315 548,833
Claims incurred
R0310 Gross - Direct Business 772,849 220,158 43,149 113 7,709 8,677 1,052,655
R0320 Gross - Proportional reinsurance accepted 0
R0330 Gross - Non-proportional reinsurance accepted 0
R0340 Reinsurers' share 502,871 143,677 30,208 79 853 0 677,688
R0400 Net 269,978 76,481 12,942 34 6,856 8,677 374,967
Changes in other technical provisions
R0410 Gross - Direct Business 0 0 0 0 0 0 0
R0420 Gross - Proportional reinsurance accepted 0
R0430 Gross - Non-proportional reinsurance accepted 0
R0440 Reinsurers' share 0 0 0 0 0 0 0
R0500 Net 0 0 0 0 0 0 0
R0550 Expenses incurred 88,614 26,259 5,792 15 1,138 2,000 123,819
R1200 Other expenses -18,003
R1300 Total expenses 105,816
As noted in the main body of the report, the allocation of premium, claims and expenses to line of business (between both non life and life, and within non-life) is based on a simplified approach and is only for the purpose of the QRT disclosure.
The Group and subsidiary Boards do not receive or review premiums, claims and expenses information presented on an IFRS basis, using this allocation by line of business.
Premiums, claims and expenses by line of business
Line of Business for: non-life insurance and reinsurance obligations (direct business and accepted proportional reinsurance)Line of business for: accepted non-proportional
reinsurance
Total
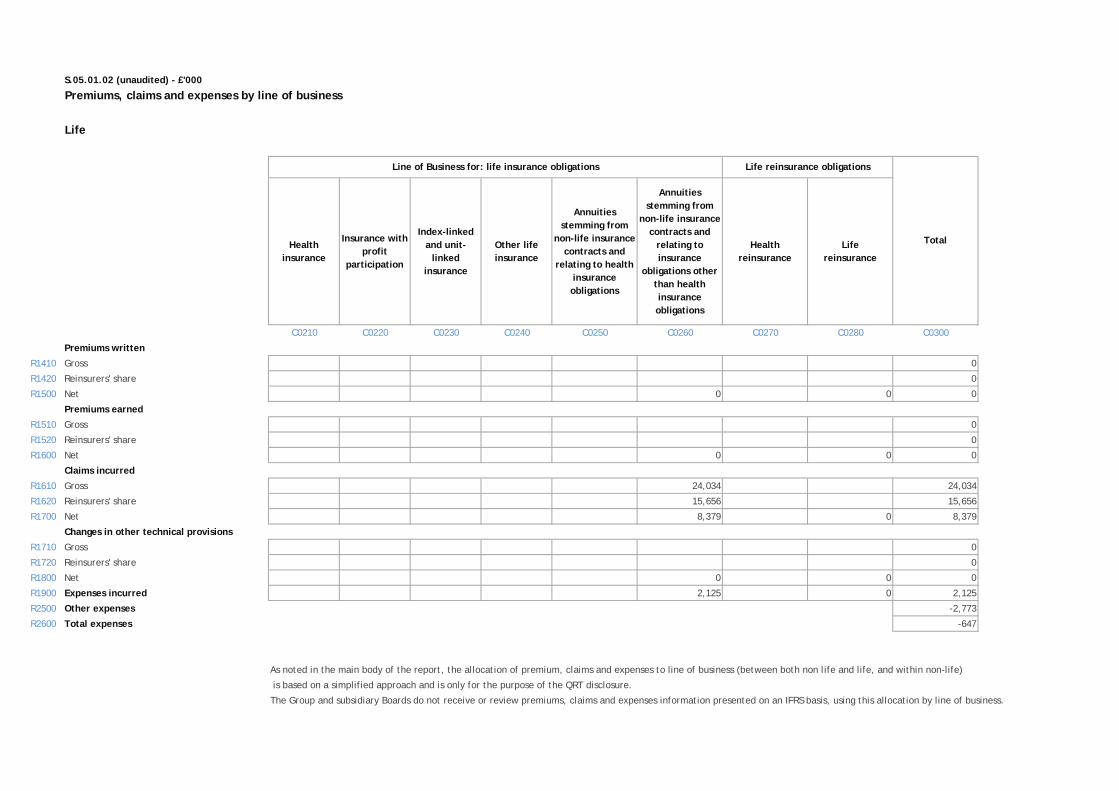
S.05.01.02 (unaudited) - £'000
Life
Health insurance
Insurance with profit
participation
Index-linked and unit-
linked insurance
Other life insurance
Annuities stemming from
non-life insurance contracts and
relating to health insurance obligations
Annuities stemming from
non-life insurance contracts and
relating to insurance
obligations other than health insurance obligations
Health reinsurance
Life reinsurance
C0210 C0220 C0230 C0240 C0250 C0260 C0270 C0280 C0300
Premiums written
R1410 Gross 0
R1420 Reinsurers' share 0
R1500 Net 0 0 0
Premiums earned
R1510 Gross 0
R1520 Reinsurers' share 0
R1600 Net 0 0 0
Claims incurred
R1610 Gross 24,034 24,034
R1620 Reinsurers' share 15,656 15,656
R1700 Net 8,379 0 8,379
Changes in other technical provisions
R1710 Gross 0
R1720 Reinsurers' share 0
R1800 Net 0 0 0
R1900 Expenses incurred 2,125 0 2,125
R2500 Other expenses -2,773
R2600 Total expenses -647
As noted in the main body of the report, the allocation of premium, claims and expenses to line of business (between both non life and life, and within non-life)
is based on a simplified approach and is only for the purpose of the QRT disclosure.
The Group and subsidiary Boards do not receive or review premiums, claims and expenses information presented on an IFRS basis, using this allocation by line of business.
Premiums, claims and expenses by line of business
Line of Business for: life insurance obligations Life reinsurance obligations
Total
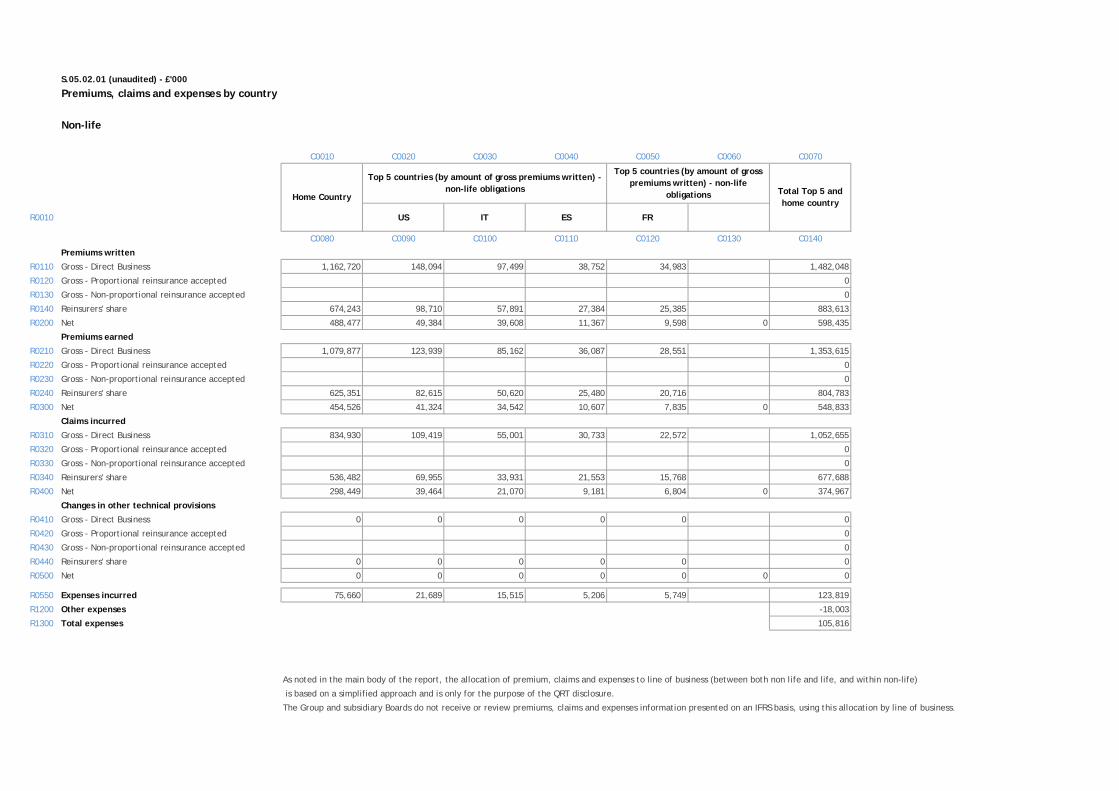
S.05.02.01 (unaudited) - £'000
Premiums, claims and expenses by country
Non-life
C0010 C0020 C0030 C0040 C0050 C0060 C0070
R0010 US IT ES FR
C0080 C0090 C0100 C0110 C0120 C0130 C0140
Premiums written
R0110 Gross - Direct Business 1,162,720 148,094 97,499 38,752 34,983 1,482,048
R0120 Gross - Proportional reinsurance accepted 0
R0130 Gross - Non-proportional reinsurance accepted 0
R0140 Reinsurers' share 674,243 98,710 57,891 27,384 25,385 883,613
R0200 Net 488,477 49,384 39,608 11,367 9,598 0 598,435
Premiums earned
R0210 Gross - Direct Business 1,079,877 123,939 85,162 36,087 28,551 1,353,615
R0220 Gross - Proportional reinsurance accepted 0
R0230 Gross - Non-proportional reinsurance accepted 0
R0240 Reinsurers' share 625,351 82,615 50,620 25,480 20,716 804,783
R0300 Net 454,526 41,324 34,542 10,607 7,835 0 548,833
Claims incurred
R0310 Gross - Direct Business 834,930 109,419 55,001 30,733 22,572 1,052,655
R0320 Gross - Proportional reinsurance accepted 0
R0330 Gross - Non-proportional reinsurance accepted 0
R0340 Reinsurers' share 536,482 69,955 33,931 21,553 15,768 677,688
R0400 Net 298,449 39,464 21,070 9,181 6,804 0 374,967
Changes in other technical provisions
R0410 Gross - Direct Business 0 0 0 0 0 0
R0420 Gross - Proportional reinsurance accepted 0
R0430 Gross - Non-proportional reinsurance accepted 0
R0440 Reinsurers' share 0 0 0 0 0 0
R0500 Net 0 0 0 0 0 0 0
R0550 Expenses incurred 75,660 21,689 15,515 5,206 5,749 123,819
R1200 Other expenses -18,003
R1300 Total expenses 105,816
As noted in the main body of the report, the allocation of premium, claims and expenses to line of business (between both non life and life, and within non-life)
is based on a simplified approach and is only for the purpose of the QRT disclosure.
The Group and subsidiary Boards do not receive or review premiums, claims and expenses information presented on an IFRS basis, using this allocation by line of business.
Home Country
Top 5 countries (by amount of gross premiums written) - non-life obligations
Top 5 countries (by amount of gross premiums written) - non-life
obligations Total Top 5 and home country

S.05.02.01 (unaudited) - £'000
Premiums, claims and expenses by country
Life
C0150 C0160 C0170 C0180 C0190 C0200 C0210
R1400 US IT ES FR
C0220 C0230 C0240 C0250 C0260 C0270 C0280
Premiums written
R1410 Gross 0
R1420 Reinsurers' share 0
R1500 Net 0 0 0 0 0 0 0
Premiums earned
R1510 Gross 0
R1520 Reinsurers' share 0
R1600 Net 0 0 0 0 0 0 0
Claims incurred
R1610 Gross 24,034 0 0 0 0 24,034
R1620 Reinsurers' share 15,656 0 0 0 0 15,656
R1700 Net 8,379 0 0 0 0 0 8,379
Changes in other technical provisions
R1710 Gross 0
R1720 Reinsurers' share 0
R1800 Net 0 0 0 0 0 0 0
R1900 Expenses incurred 2,125 2,125
R2500 Other expenses -2,773
R2600 Total expenses -647
As noted in the main body of the report, the allocation of premium, claims and expenses to line of business (between both non life and life, and within non-life)
is based on a simplified approach and is only for the purpose of the QRT disclosure.
The Group and subsidiary Boards do not receive or review premiums, claims and expenses information presented on an IFRS basis, using this allocation by line of business.
Home Country
Top 5 countries (by amount of gross premiums written) - life obligations
Top 5 countries (by amount of gross premiums written) - life obligations Total Top 5 and
home country
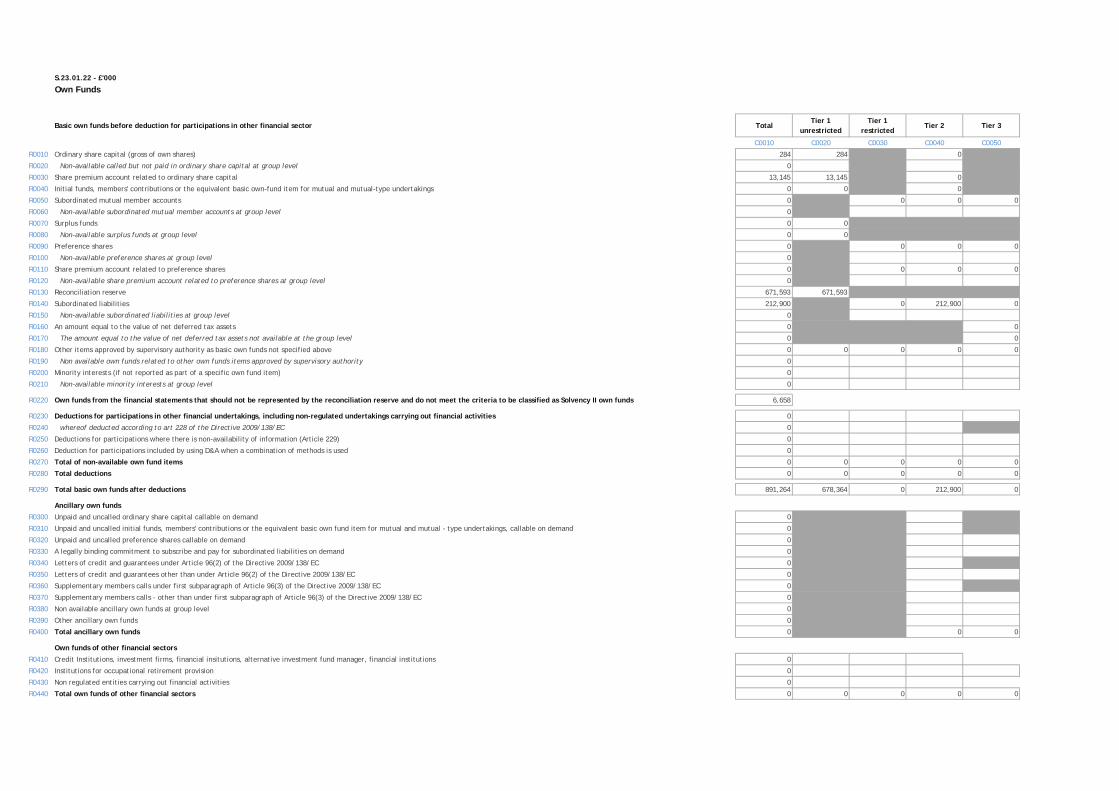
S.23.01.22 - £'000
Own Funds
Basic own funds before deduction for participations in other financial sector TotalTier 1
unrestrictedTier 1
restrictedTier 2 Tier 3
C0010 C0020 C0030 C0040 C0050
R0010 Ordinary share capital (gross of own shares) 284 284 0
R0020 Non-available called but not paid in ordinary share capital at group level 0
R0030 Share premium account related to ordinary share capital 13,145 13,145 0
R0040 Initial funds, members' contributions or the equivalent basic own-fund item for mutual and mutual-type undertakings 0 0 0
R0050 Subordinated mutual member accounts 0 0 0 0
R0060 Non-available subordinated mutual member accounts at group level 0
R0070 Surplus funds 0 0
R0080 Non-available surplus funds at group level 0 0
R0090 Preference shares 0 0 0 0
R0100 Non-available preference shares at group level 0
R0110 Share premium account related to preference shares 0 0 0 0
R0120 Non-available share premium account related to preference shares at group level 0
R0130 Reconciliation reserve 671,593 671,593
R0140 Subordinated liabilities 212,900 0 212,900 0
R0150 Non-available subordinated liabilities at group level 0
R0160 An amount equal to the value of net deferred tax assets 0 0
R0170 The amount equal to the value of net deferred tax assets not available at the group level 0 0
R0180 Other items approved by supervisory authority as basic own funds not specified above 0 0 0 0 0
R0190 Non available own funds related to other own funds items approved by supervisory authority 0
R0200 Minority interests (if not reported as part of a specific own fund item) 0
R0210 Non-available minority interests at group level 0
R0220 Own funds from the financial statements that should not be represented by the reconciliation reserve and do not meet the criteria to be classified as Solvency II own funds 6,658
R0230 Deductions for participations in other financial undertakings, including non-regulated undertakings carrying out financial activities 0
R0240 whereof deducted according to art 228 of the Directive 2009/138/EC 0
R0250 Deductions for participations where there is non-availability of information (Article 229) 0
R0260 Deduction for participations included by using D&A when a combination of methods is used 0
R0270 Total of non-available own fund items 0 0 0 0 0
R0280 Total deductions 0 0 0 0 0
R0290 Total basic own funds after deductions 891,264 678,364 0 212,900 0
Ancillary own funds
R0300 Unpaid and uncalled ordinary share capital callable on demand 0
R0310 Unpaid and uncalled initial funds, members' contributions or the equivalent basic own fund item for mutual and mutual - type undertakings, callable on demand 0
R0320 Unpaid and uncalled preference shares callable on demand 0
R0330 A legally binding commitment to subscribe and pay for subordinated liabilities on demand 0
R0340 Letters of credit and guarantees under Article 96(2) of the Directive 2009/138/EC 0
R0350 Letters of credit and guarantees other than under Article 96(2) of the Directive 2009/138/EC 0
R0360 Supplementary members calls under first subparagraph of Article 96(3) of the Directive 2009/138/EC 0
R0370 Supplementary members calls - other than under first subparagraph of Article 96(3) of the Directive 2009/138/EC 0
R0380 Non available ancillary own funds at group level 0
R0390 Other ancillary own funds 0
R0400 Total ancillary own funds 0 0 0
Own funds of other financial sectors
R0410 Credit Institutions, investment firms, financial insitutions, alternative investment fund manager, financial institutions 0
R0420 Institutions for occupational retirement provision 0
R0430 Non regulated entities carrying out financial activities 0
R0440 Total own funds of other financial sectors 0 0 0 0 0
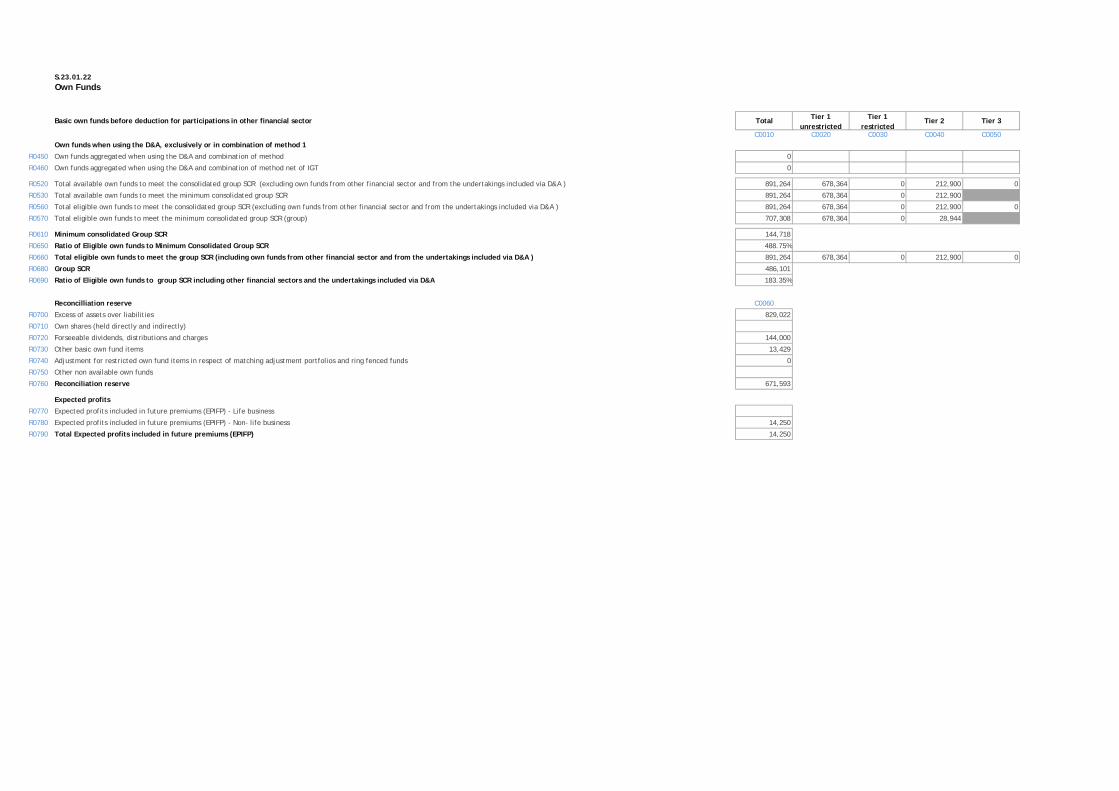
S.23.01.22
Own Funds
Basic own funds before deduction for participations in other financial sector Total Tier 1unrestricted
Tier 1restricted
Tier 2 Tier 3
C0010 C0020 C0030 C0040 C0050Own funds when using the D&A, exclusively or in combination of method 1
R0450 Own funds aggregated when using the D&A and combination of method 0
R0460 Own funds aggregated when using the D&A and combination of method net of IGT 0
R0520 Total available own funds to meet the consolidated group SCR (excluding own funds from other financial sector and from the undertakings included via D&A ) 891,264 678,364 0 212,900 0
R0530 Total available own funds to meet the minimum consolidated group SCR 891,264 678,364 0 212,900
R0560 Total eligible own funds to meet the consolidated group SCR (excluding own funds from other financial sector and from the undertakings included via D&A ) 891,264 678,364 0 212,900 0
R0570 Total eligible own funds to meet the minimum consolidated group SCR (group) 707,308 678,364 0 28,944
R0610 Minimum consolidated Group SCR 144,718
R0650 Ratio of Eligible own funds to Minimum Consolidated Group SCR 488.75%
R0660 Total eligible own funds to meet the group SCR (including own funds from other financial sector and from the undertakings included via D&A ) 891,264 678,364 0 212,900 0
R0680 Group SCR 486,101
R0690 Ratio of Eligible own funds to group SCR including other financial sectors and the undertakings included via D&A 183.35%
Reconcilliation reserve C0060
R0700 Excess of assets over liabilities 829,022
R0710 Own shares (held directly and indirectly)
R0720 Forseeable dividends, distributions and charges 144,000
R0730 Other basic own fund items 13,429
R0740 Adjustment for restricted own fund items in respect of matching adjustment portfolios and ring fenced funds 0
R0750 Other non available own funds
R0760 Reconciliation reserve 671,593
Expected profits
R0770 Expected profits included in future premiums (EPIFP) - Life business
R0780 Expected profits included in future premiums (EPIFP) - Non- life business 14,250
R0790 Total Expected profits included in future premiums (EPIFP) 14,250
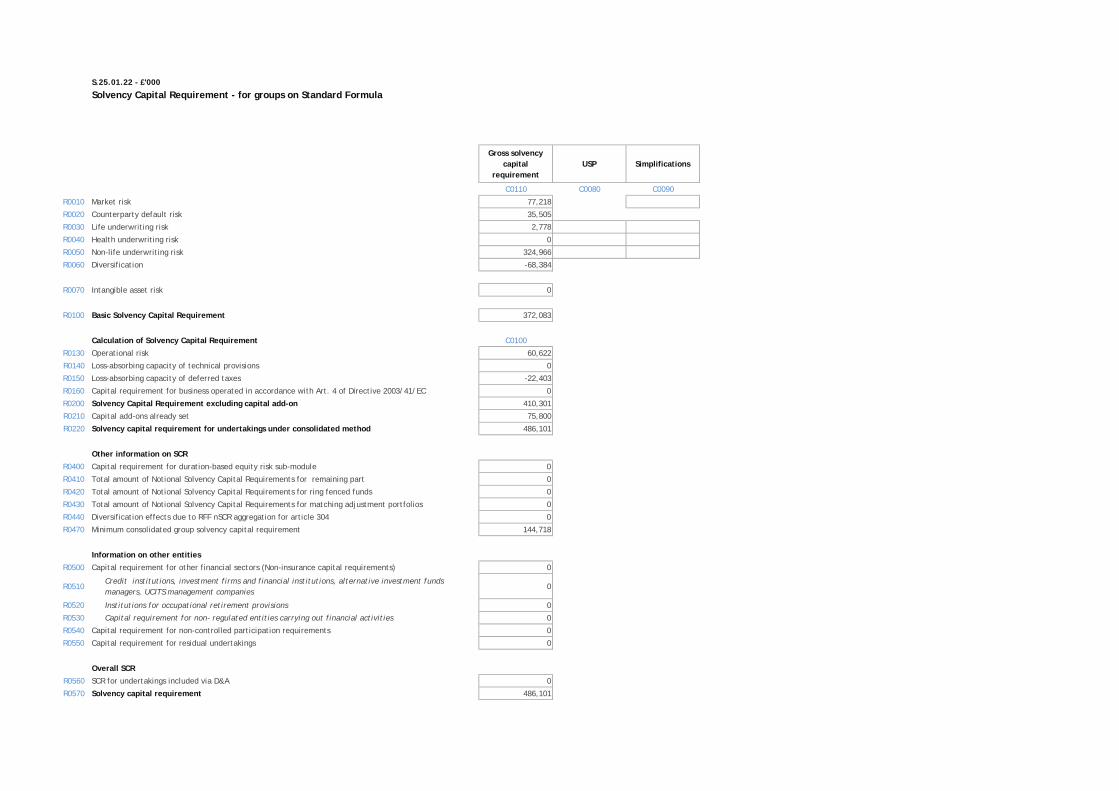
S.25.01.22 - £'000
Solvency Capital Requirement - for groups on Standard Formula
Gross solvency capital
requirementUSP Simplifications
C0110 C0080 C0090
R0010 Market risk 77,218
R0020 Counterparty default risk 35,505
R0030 Life underwriting risk 2,778
R0040 Health underwriting risk 0
R0050 Non-life underwriting risk 324,966
R0060 Diversification -68,384
R0070 Intangible asset risk 0
R0100 Basic Solvency Capital Requirement 372,083
Calculation of Solvency Capital Requirement C0100
R0130 Operational risk 60,622
R0140 Loss-absorbing capacity of technical provisions 0
R0150 Loss-absorbing capacity of deferred taxes -22,403
R0160 Capital requirement for business operated in accordance with Art. 4 of Directive 2003/41/EC 0
R0200 Solvency Capital Requirement excluding capital add-on 410,301
R0210 Capital add-ons already set 75,800
R0220 Solvency capital requirement for undertakings under consolidated method 486,101
Other information on SCR
R0400 Capital requirement for duration-based equity risk sub-module 0
R0410 Total amount of Notional Solvency Capital Requirements for remaining part 0
R0420 Total amount of Notional Solvency Capital Requirements for ring fenced funds 0
R0430 Total amount of Notional Solvency Capital Requirements for matching adjustment portfolios 0
R0440 Diversification effects due to RFF nSCR aggregation for article 304 0
R0470 Minimum consolidated group solvency capital requirement 144,718
Information on other entities
R0500 Capital requirement for other financial sectors (Non-insurance capital requirements) 0
R0510Credit institutions, investment firms and financial institutions, alternative investment funds managers, UCITS management companies
0
R0520 Institutions for occupational retirement provisions 0
R0530 Capital requirement for non- regulated entities carrying out financial activities 0
R0540 Capital requirement for non-controlled participation requirements 0
R0550 Capital requirement for residual undertakings 0
Overall SCR
R0560 SCR for undertakings included via D&A 0
R0570 Solvency capital requirement 486,101
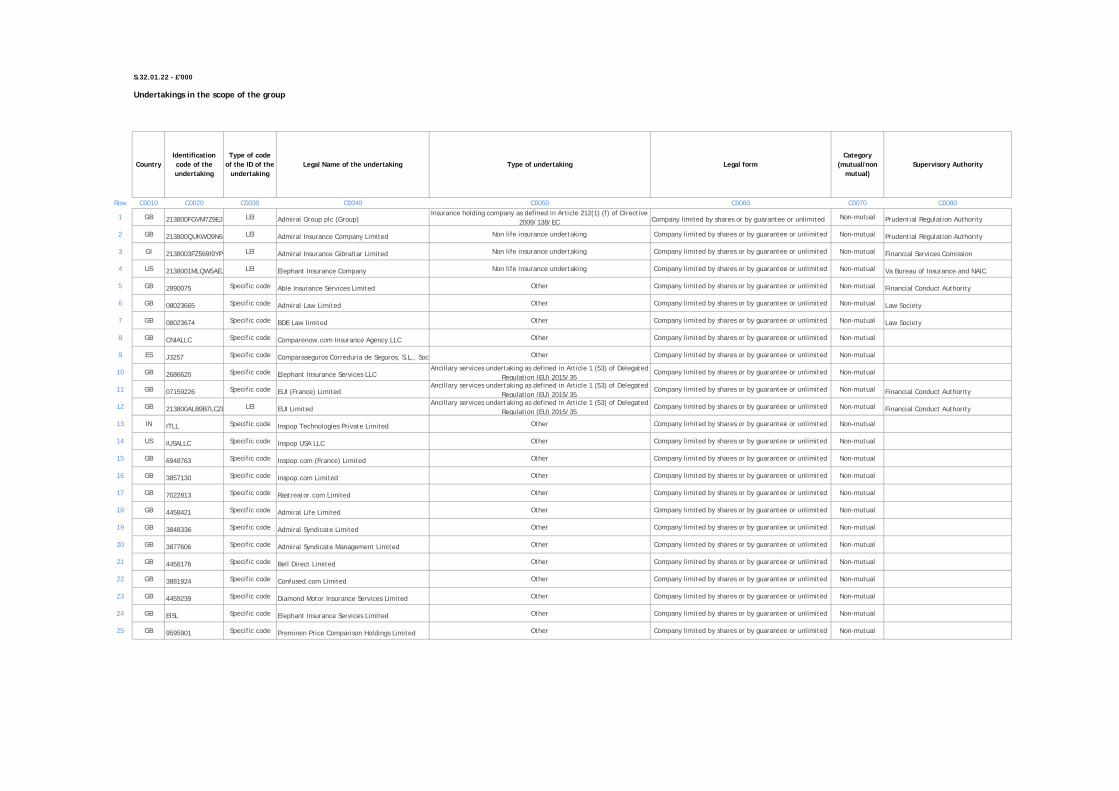
S.32.01.22 - £'000
Undertakings in the scope of the group
CountryIdentification code of the undertaking
Type of code of the ID of the
undertakingLegal Name of the undertaking Type of undertaking Legal form
Category (mutual/non
mutual)Supervisory Authority
Row C0010 C0020 C0030 C0040 C0050 C0060 C0070 C0080
1 GB 213800FGVM7Z9EJ LEI Admiral Group plc (Group)Insurance holding company as defined in Article 212(1) (f) of Directive
2009/138/EC Company limited by shares or by guarantee or unlimited Non-mutual Prudential Regulation Authority
2 GB 213800QUKWO9N6C LEI Admiral Insurance Company Limited Non life insurance undertaking Company limited by shares or by guarantee or unlimited Non-mutual Prudential Regulation Authority
3 GI 2138003FZ569I9YPG LEI Admiral Insurance Gibraltar Limited Non life insurance undertaking Company limited by shares or by guarantee or unlimited Non-mutual Financial Services Comission
4 US 2138001MLQW5AEJ LEI Elephant Insurance Company Non life insurance undertaking Company limited by shares or by guarantee or unlimited Non-mutual Va Bureau of Insurance and NAIC
5 GB 2890075 Specific code Able Insurance Services Limited Other Company limited by shares or by guarantee or unlimited Non-mutual Financial Conduct Authority
6 GB 08023665 Specific code Admiral Law Limited Other Company limited by shares or by guarantee or unlimited Non-mutual Law Society
7 GB 08023674 Specific code BDE Law limited Other Company limited by shares or by guarantee or unlimited Non-mutual Law Society
8 GB CNIALLC Specific code Comparenow.com Insurance Agency LLC Other Company limited by shares or by guarantee or unlimited Non-mutual
9 ES J3257 Specific code Comparaseguros Correduría de Seguros, S.L., Soc Other Company limited by shares or by guarantee or unlimited Non-mutual
10 GB 2686620 Specific code Elephant Insurance Services LLCAncillary services undertaking as defined in Article 1 (53) of Delegated
Regulation (EU) 2015/35Company limited by shares or by guarantee or unlimited Non-mutual
11 GB 07159226 Specific code EUI (France) LimitedAncillary services undertaking as defined in Article 1 (53) of Delegated
Regulation (EU) 2015/35Company limited by shares or by guarantee or unlimited Non-mutual Financial Conduct Authority
12 GB 213800ALB9B7LCZL LEI EUI LimitedAncillary services undertaking as defined in Article 1 (53) of Delegated
Regulation (EU) 2015/35Company limited by shares or by guarantee or unlimited Non-mutual Financial Conduct Authority
13 IN ITLL Specific code Inspop Technologies Private Limited Other Company limited by shares or by guarantee or unlimited Non-mutual
14 US IUSALLC Specific code Inspop USA LLC Other Company limited by shares or by guarantee or unlimited Non-mutual
15 GB 6948763 Specific code Inspop.com (France) Limited Other Company limited by shares or by guarantee or unlimited Non-mutual
16 GB 3857130 Specific code Inspop.com Limited Other Company limited by shares or by guarantee or unlimited Non-mutual
17 GB 7022813 Specific code Rastreator.com Limited Other Company limited by shares or by guarantee or unlimited Non-mutual
18 GB 4458421 Specific code Admiral Life Limited Other Company limited by shares or by guarantee or unlimited Non-mutual
19 GB 3848336 Specific code Admiral Syndicate Limited Other Company limited by shares or by guarantee or unlimited Non-mutual
20 GB 3877606 Specific code Admiral Syndicate Management Limited Other Company limited by shares or by guarantee or unlimited Non-mutual
21 GB 4458176 Specific code Bell Direct Limited Other Company limited by shares or by guarantee or unlimited Non-mutual
22 GB 3881924 Specific code Confused.com Limited Other Company limited by shares or by guarantee or unlimited Non-mutual
23 GB 4459239 Specific code Diamond Motor Insurance Services Limited Other Company limited by shares or by guarantee or unlimited Non-mutual
24 GB EISL Specific code Elephant Insurance Services Limited Other Company limited by shares or by guarantee or unlimited Non-mutual
25 GB 9595901 Specific code Preminen Price Comparison Holdings Limited Other Company limited by shares or by guarantee or unlimited Non-mutual

S.32.01.22 - £'000
Undertakings in the scope of the grou
CountryIdentification code of the undertaking
Type of code of the ID of the
undertaking
Row C0010 C0020 C0030
1 GB 213800FGVM7Z9EJ LEI
2 GB 213800QUKWO9N6C LEI
3 GI 2138003FZ569I9YPG LEI
4 US 2138001MLQW5AEJ LEI
5 GB 2890075 Specific code
6 GB 08023665 Specific code
7 GB 08023674 Specific code
8 GB CNIALLC Specific code
9 ES J3257 Specific code
10 GB 2686620 Specific code
11 GB 07159226 Specific code
12 GB 213800ALB9B7LCZL LEI
13 IN ITLL Specific code
14 US IUSALLC Specific code
15 GB 6948763 Specific code
16 GB 3857130 Specific code
17 GB 7022813 Specific code
18 GB 4458421 Specific code
19 GB 3848336 Specific code
20 GB 3877606 Specific code
21 GB 4458176 Specific code
22 GB 3881924 Specific code
23 GB 4459239 Specific code
24 GB EISL Specific code
25 GB 9595901 Specific code
Group solvency calculation
% capital share
% used for the establishment of
consolidated accounts
% voting rights Other criteria Level of influenceProportional share
used for group solvency calculation
YES/NODate of decision
if art. 214 is applied
Method used and under method 1, treatment of the undertaking
C0180 C0190 C0200 C0210 C0220 C0230 C0240 C0250 C0260
100.00% 100.00% 100.00% Dominant Included in the scope Method 1: Full consolidation
100.00% 100.00% 100.00% Dominant Included in the scope Method 1: Full consolidation
100.00% 100.00% 100.00% Dominant Included in the scope Method 1: Full consolidation
100.00% 100.00% 100.00% Dominant Included in the scope Method 1: Full consolidation
100.00% 100.00% 100.00% Dominant Included in the scope Method 1: Adjusted equity method
90.00% 90.00% 90.00% Dominant Included in the scope Method 1: Adjusted equity method
90.00% 90.00% 90.00% Dominant Included in the scope Method 1: Adjusted equity method
71.10% 71.10% 71.10% Dominant Included in the scope Method 1: Adjusted equity method
75.00% 75.00% 75.00% Dominant Included in the scope Method 1: Adjusted equity method
100.00% 100.00% 100.00% Dominant Included in the scope Method 1: Full consolidation
100.00% 100.00% 100.00% Dominant Included in the scope Method 1: Full consolidation
100.00% 100.00% 100.00% Dominant Included in the scope Method 1: Full consolidation
100.00% 100.00% 100.00% Dominant Included in the scope Method 1: Adjusted equity method
71.10% 71.10% 71.10% Dominant Included in the scope Method 1: Adjusted equity method
100.00% 100.00% 100.00% Dominant Included in the scope Method 1: Adjusted equity method
100.00% 100.00% 100.00% Dominant Included in the scope Method 1: Adjusted equity method
75.00% 75.00% 75.00% Dominant Included in the scope Method 1: Adjusted equity method
100.00% 100.00% 100.00% Dominant Included in the scope Method 1: Adjusted equity method
100.00% 100.00% 100.00% Dominant Included in the scope Method 1: Adjusted equity method
100.00% 100.00% 100.00% Dominant Included in the scope Method 1: Adjusted equity method
100.00% 100.00% 100.00% Dominant Included in the scope Method 1: Adjusted equity method
100.00% 100.00% 100.00% Dominant Included in the scope Method 1: Adjusted equity method
100.00% 100.00% 100.00% Dominant Included in the scope Method 1: Adjusted equity method
100.00% 100.00% 100.00% Dominant Included in the scope Method 1: Adjusted equity method
50.00% 50.00% 50.00% Dominant Included in the scope Method 1: Adjusted equity method
Criteria of influenceInclusion in the scope of Group
supervision

Admiral Insurance Company Limited
Solvency and Financial Condition Report
Disclosures
31 December
2016
(Monetary amounts in GBP thousands)
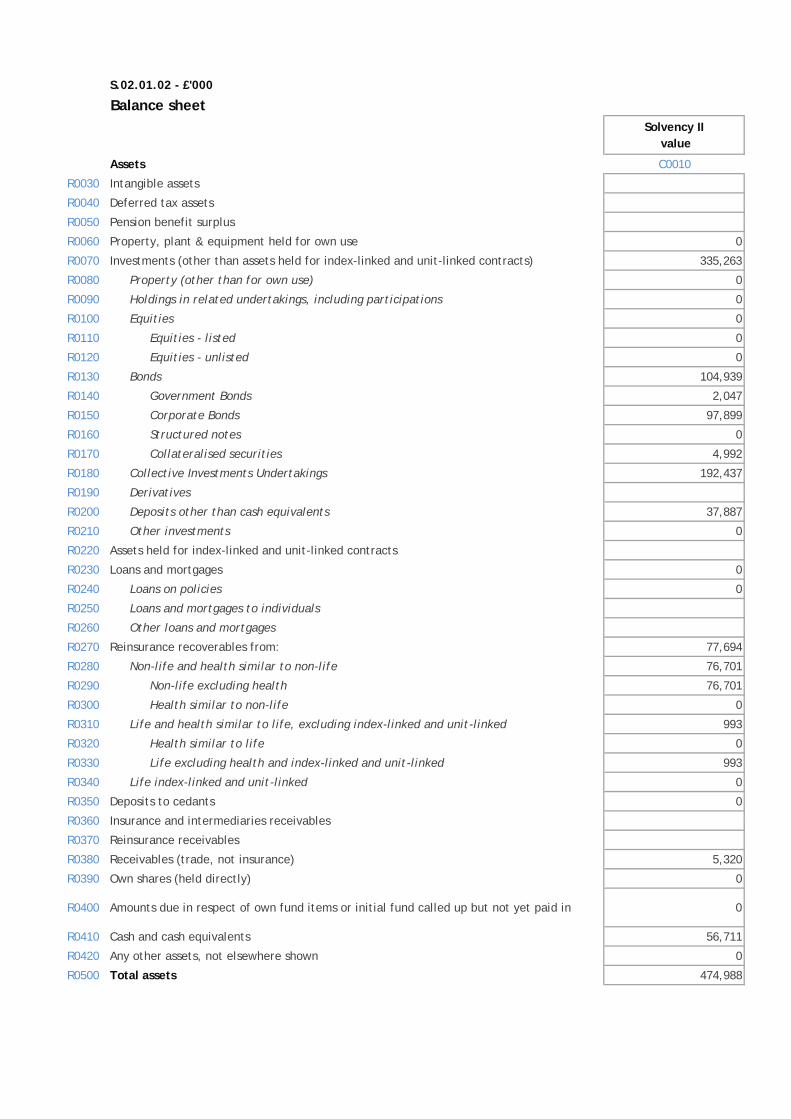
S.02.01.02 - £'000
Balance sheetSolvency II
value
Assets C0010
R0030 Intangible assets
R0040 Deferred tax assets
R0050 Pension benefit surplus
R0060 Property, plant & equipment held for own use 0
R0070 Investments (other than assets held for index-linked and unit-linked contracts) 335,263
R0080 Property (other than for own use) 0
R0090 Holdings in related undertakings, including participations 0
R0100 Equities 0
R0110 Equities - listed 0
R0120 Equities - unlisted 0
R0130 Bonds 104,939
R0140 Government Bonds 2,047
R0150 Corporate Bonds 97,899
R0160 Structured notes 0
R0170 Collateralised securities 4,992
R0180 Collective Investments Undertakings 192,437
R0190 Derivatives
R0200 Deposits other than cash equivalents 37,887
R0210 Other investments 0
R0220 Assets held for index-linked and unit-linked contracts
R0230 Loans and mortgages 0
R0240 Loans on policies 0
R0250 Loans and mortgages to individuals
R0260 Other loans and mortgages
R0270 Reinsurance recoverables from: 77,694
R0280 Non-life and health similar to non-life 76,701
R0290 Non-life excluding health 76,701
R0300 Health similar to non-life 0
R0310 Life and health similar to life, excluding index-linked and unit-linked 993
R0320 Health similar to life 0
R0330 Life excluding health and index-linked and unit-linked 993
R0340 Life index-linked and unit-linked 0
R0350 Deposits to cedants 0
R0360 Insurance and intermediaries receivables
R0370 Reinsurance receivables
R0380 Receivables (trade, not insurance) 5,320
R0390 Own shares (held directly) 0
R0400 Amounts due in respect of own fund items or initial fund called up but not yet paid in 0
R0410 Cash and cash equivalents 56,711
R0420 Any other assets, not elsewhere shown 0
R0500 Total assets 474,988

S.02.01.02 - £'000
Balance sheet
Solvency II value
Liabilities C0010
R0510 Technical provisions - non-life 323,332
R0520 Technical provisions - non-life (excluding health) 323,332
R0530 TP calculated as a whole 0
R0540 Best Estimate 312,383
R0550 Risk margin 10,949
R0560 Technical provisions - health (similar to non-life) 0
R0570 TP calculated as a whole 0
R0580 Best Estimate 0
R0590 Risk margin 0
R0600 Technical provisions - life (excluding index-linked and unit-linked) 5,452
R0610 Technical provisions - health (similar to life) 0
R0620 TP calculated as a whole 0
R0630 Best Estimate 0
R0640 Risk margin 0
R0650 Technical provisions - life (excluding health and index-linked and unit-linked) 5,452
R0660 TP calculated as a whole 0
R0670 Best Estimate 5,268
R0680 Risk margin 185
R0690 Technical provisions - index-linked and unit-linked 0
R0700 TP calculated as a whole 0
R0710 Best Estimate 0
R0720 Risk margin 0
R0740 Contingent liabilities
R0750 Provisions other than technical provisions
R0760 Pension benefit obligations
R0770 Deposits from reinsurers
R0780 Deferred tax liabilities 5,943
R0790 Derivatives
R0800 Debts owed to credit institutions
R0810 Financial liabilities other than debts owed to credit institutions
R0820 Insurance & intermediaries payables 6,034
R0830 Reinsurance payables -4,585
R0840 Payables (trade, not insurance) 11,100
R0850 Subordinated liabilities 0
R0860 Subordinated liabilities not in BOF
R0870 Subordinated liabilities in BOF 0
R0880 Any other liabilities, not elsewhere shown 0
R0900 Total liabilities 347,276
R1000 Excess of assets over liabilities 127,711
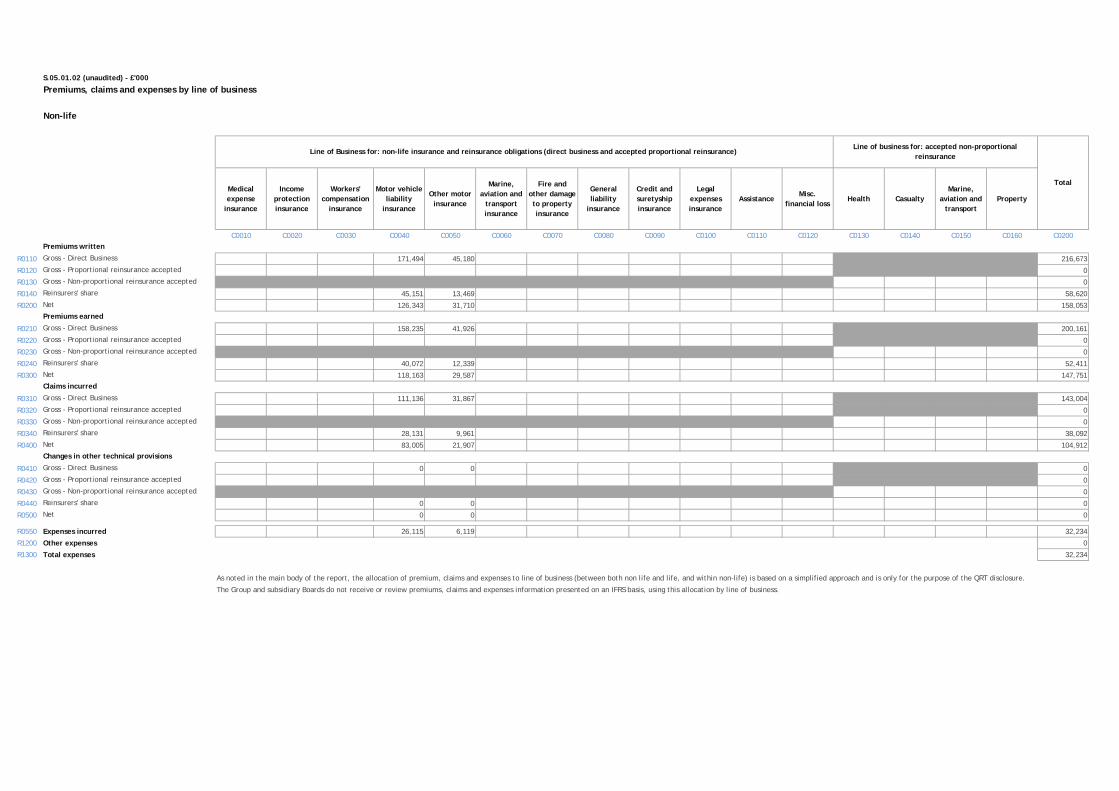
S.05.01.02 (unaudited) - £'000
Non-life
Medical expense
insurance
Income protection insurance
Workers' compensation
insurance
Motor vehicle liability
insurance
Other motor insurance
Marine, aviation and
transport insurance
Fire and other damage to property insurance
General liability
insurance
Credit and suretyship insurance
Legal expenses insurance
AssistanceMisc.
financial lossHealth Casualty
Marine, aviation and
transportProperty
C0010 C0020 C0030 C0040 C0050 C0060 C0070 C0080 C0090 C0100 C0110 C0120 C0130 C0140 C0150 C0160 C0200
Premiums written
R0110 Gross - Direct Business 171,494 45,180 216,673
R0120 Gross - Proportional reinsurance accepted 0
R0130 Gross - Non-proportional reinsurance accepted 0
R0140 Reinsurers' share 45,151 13,469 58,620
R0200 Net 126,343 31,710 158,053
Premiums earned
R0210 Gross - Direct Business 158,235 41,926 200,161
R0220 Gross - Proportional reinsurance accepted 0
R0230 Gross - Non-proportional reinsurance accepted 0
R0240 Reinsurers' share 40,072 12,339 52,411
R0300 Net 118,163 29,587 147,751
Claims incurred
R0310 Gross - Direct Business 111,136 31,867 143,004
R0320 Gross - Proportional reinsurance accepted 0
R0330 Gross - Non-proportional reinsurance accepted 0
R0340 Reinsurers' share 28,131 9,961 38,092
R0400 Net 83,005 21,907 104,912
Changes in other technical provisions
R0410 Gross - Direct Business 0 0 0
R0420 Gross - Proportional reinsurance accepted 0
R0430 Gross - Non-proportional reinsurance accepted 0
R0440 Reinsurers' share 0 0 0
R0500 Net 0 0 0
R0550 Expenses incurred 26,115 6,119 32,234
R1200 Other expenses 0
R1300 Total expenses 32,234
As noted in the main body of the report, the allocation of premium, claims and expenses to line of business (between both non life and life, and within non-life) is based on a simplified approach and is only for the purpose of the QRT disclosure.
The Group and subsidiary Boards do not receive or review premiums, claims and expenses information presented on an IFRS basis, using this allocation by line of business.
Premiums, claims and expenses by line of business
Line of Business for: non-life insurance and reinsurance obligations (direct business and accepted proportional reinsurance)Line of business for: accepted non-proportional
reinsurance
Total
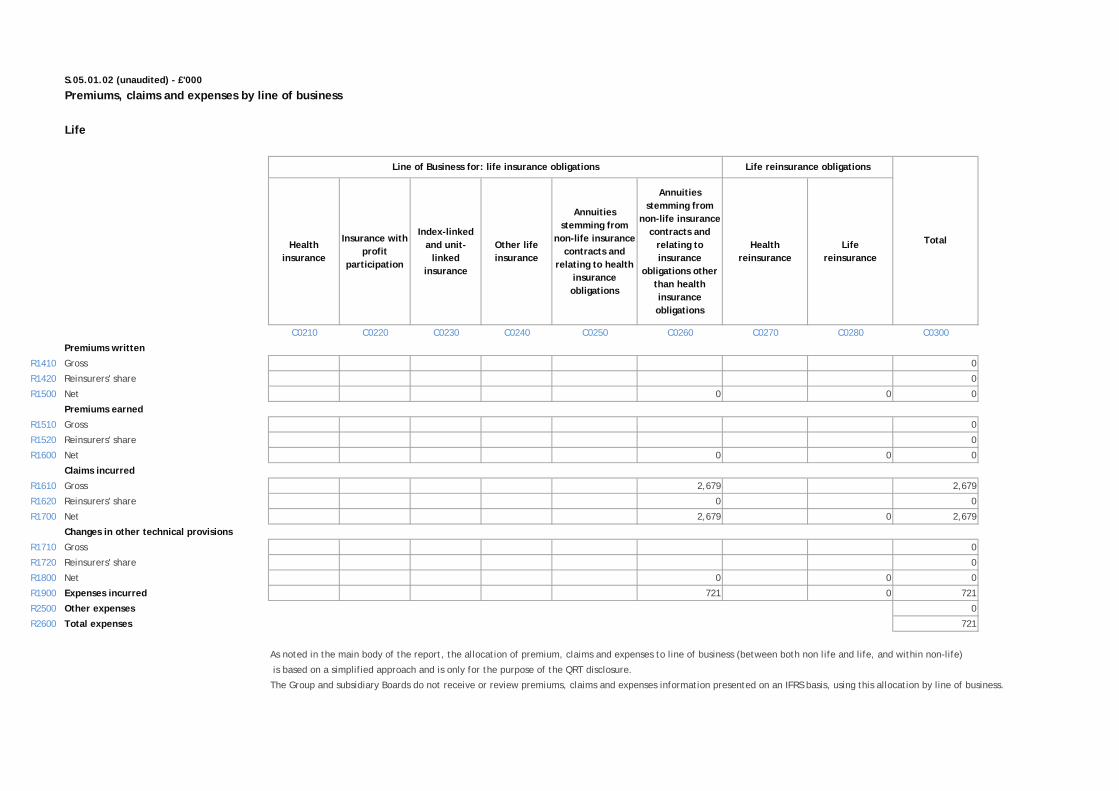
S.05.01.02 (unaudited) - £'000
Life
Health insurance
Insurance with profit
participation
Index-linked and unit-
linked insurance
Other life insurance
Annuities stemming from
non-life insurance contracts and
relating to health insurance obligations
Annuities stemming from
non-life insurance contracts and
relating to insurance
obligations other than health insurance obligations
Health reinsurance
Life reinsurance
C0210 C0220 C0230 C0240 C0250 C0260 C0270 C0280 C0300
Premiums written
R1410 Gross 0
R1420 Reinsurers' share 0
R1500 Net 0 0 0
Premiums earned
R1510 Gross 0
R1520 Reinsurers' share 0
R1600 Net 0 0 0
Claims incurred
R1610 Gross 2,679 2,679
R1620 Reinsurers' share 0 0
R1700 Net 2,679 0 2,679
Changes in other technical provisions
R1710 Gross 0
R1720 Reinsurers' share 0
R1800 Net 0 0 0
R1900 Expenses incurred 721 0 721
R2500 Other expenses 0
R2600 Total expenses 721
As noted in the main body of the report, the allocation of premium, claims and expenses to line of business (between both non life and life, and within non-life)
is based on a simplified approach and is only for the purpose of the QRT disclosure.
The Group and subsidiary Boards do not receive or review premiums, claims and expenses information presented on an IFRS basis, using this allocation by line of business.
Premiums, claims and expenses by line of business
Line of Business for: life insurance obligations Life reinsurance obligations
Total
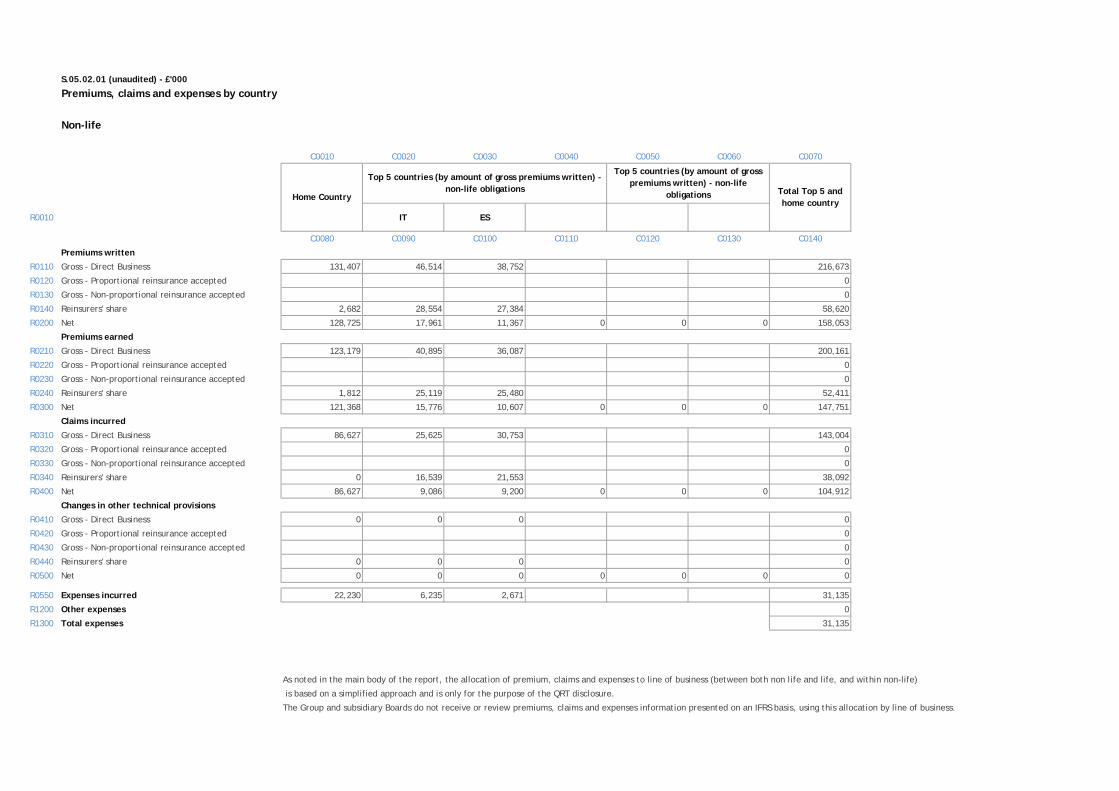
S.05.02.01 (unaudited) - £'000
Premiums, claims and expenses by country
Non-life
C0010 C0020 C0030 C0040 C0050 C0060 C0070
R0010 IT ES
C0080 C0090 C0100 C0110 C0120 C0130 C0140
Premiums written
R0110 Gross - Direct Business 131,407 46,514 38,752 216,673
R0120 Gross - Proportional reinsurance accepted 0
R0130 Gross - Non-proportional reinsurance accepted 0
R0140 Reinsurers' share 2,682 28,554 27,384 58,620
R0200 Net 128,725 17,961 11,367 0 0 0 158,053
Premiums earned
R0210 Gross - Direct Business 123,179 40,895 36,087 200,161
R0220 Gross - Proportional reinsurance accepted 0
R0230 Gross - Non-proportional reinsurance accepted 0
R0240 Reinsurers' share 1,812 25,119 25,480 52,411
R0300 Net 121,368 15,776 10,607 0 0 0 147,751
Claims incurred
R0310 Gross - Direct Business 86,627 25,625 30,753 143,004
R0320 Gross - Proportional reinsurance accepted 0
R0330 Gross - Non-proportional reinsurance accepted 0
R0340 Reinsurers' share 0 16,539 21,553 38,092
R0400 Net 86,627 9,086 9,200 0 0 0 104,912
Changes in other technical provisions
R0410 Gross - Direct Business 0 0 0 0
R0420 Gross - Proportional reinsurance accepted 0
R0430 Gross - Non-proportional reinsurance accepted 0
R0440 Reinsurers' share 0 0 0 0
R0500 Net 0 0 0 0 0 0 0
R0550 Expenses incurred 22,230 6,235 2,671 31,135
R1200 Other expenses 0
R1300 Total expenses 31,135
As noted in the main body of the report, the allocation of premium, claims and expenses to line of business (between both non life and life, and within non-life)
is based on a simplified approach and is only for the purpose of the QRT disclosure.
The Group and subsidiary Boards do not receive or review premiums, claims and expenses information presented on an IFRS basis, using this allocation by line of business.
Home Country
Top 5 countries (by amount of gross premiums written) - non-life obligations
Top 5 countries (by amount of gross premiums written) - non-life
obligations Total Top 5 and home country
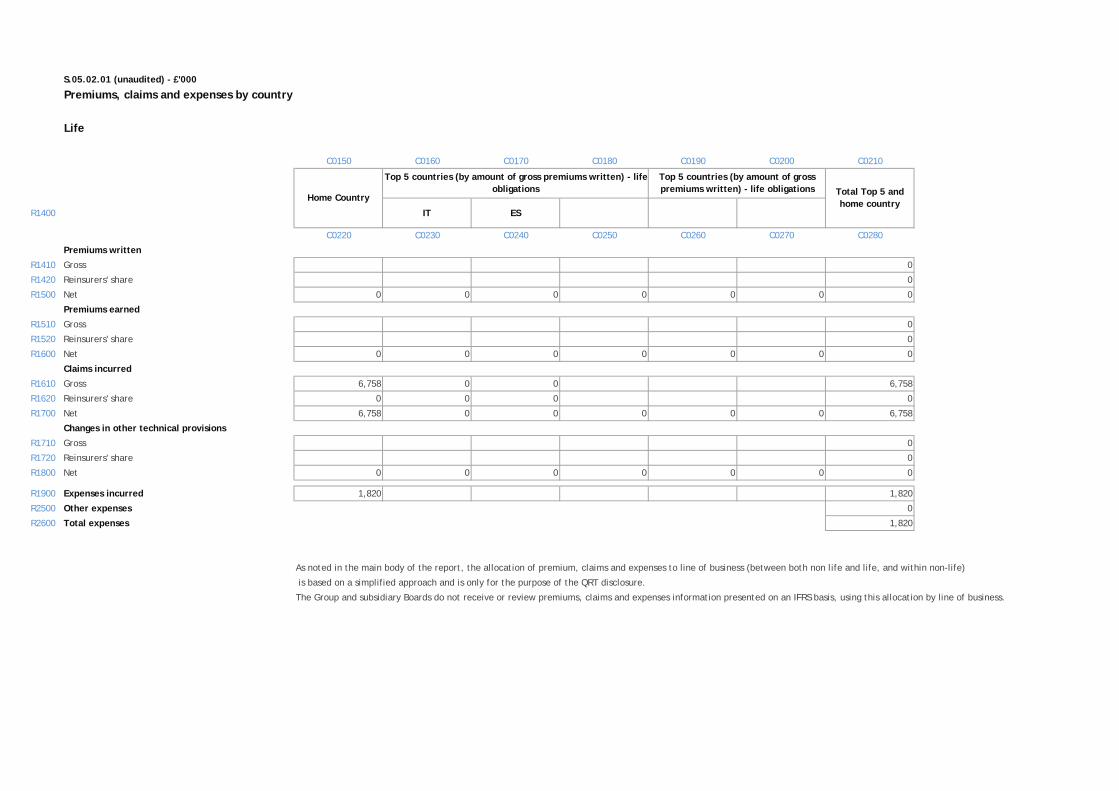
S.05.02.01 (unaudited) - £'000
Premiums, claims and expenses by country
Life
C0150 C0160 C0170 C0180 C0190 C0200 C0210
R1400 IT ES
C0220 C0230 C0240 C0250 C0260 C0270 C0280
Premiums written
R1410 Gross 0
R1420 Reinsurers' share 0
R1500 Net 0 0 0 0 0 0 0
Premiums earned
R1510 Gross 0
R1520 Reinsurers' share 0
R1600 Net 0 0 0 0 0 0 0
Claims incurred
R1610 Gross 6,758 0 0 6,758
R1620 Reinsurers' share 0 0 0 0
R1700 Net 6,758 0 0 0 0 0 6,758
Changes in other technical provisions
R1710 Gross 0
R1720 Reinsurers' share 0
R1800 Net 0 0 0 0 0 0 0
R1900 Expenses incurred 1,820 1,820
R2500 Other expenses 0
R2600 Total expenses 1,820
As noted in the main body of the report, the allocation of premium, claims and expenses to line of business (between both non life and life, and within non-life)
is based on a simplified approach and is only for the purpose of the QRT disclosure.
The Group and subsidiary Boards do not receive or review premiums, claims and expenses information presented on an IFRS basis, using this allocation by line of business.
Home Country
Top 5 countries (by amount of gross premiums written) - life obligations
Top 5 countries (by amount of gross premiums written) - life obligations Total Top 5 and
home country

S.12.01.02 - £'000
Life and Health SLT Technical Provisions
Contracts without
options and guarantees
Contracts with options
or guarantees
Contracts without
options and guarantees
Contracts with options
or guarantees
Contracts without
options and guarantees
Contracts with options
or guarantees
C0020 C0030 C0040 C0050 C0060 C0070 C0080 C0090 C0100 C0150 C0160 C0170 C0180 C0190 C0200 C0210
R0010 Technical provisions calculated as a whole 0
R0020
Total Recoverables from reinsurance/SPV and Finite Re after the adjustment for expected losses due to counterparty default associated to TP calculated as a whole 0
Technical provisions calculated as a sum of BE and RM
Best estimate
R0030 Gross Best Estimate 5,268 5,268
R0080
Total Recoverables from reinsurance/SPV and Finite Re after the adjustment for expected losses due to counterparty default 993 993
R0090Best estimate minus recoverables from reinsurance/SPV and Finite Re
4,275 4,275
R0100 Risk margin 185 185
Amount of the transitional on Technical Provisions
R0110 Technical Provisions calculated as a whole 0
R0120 Best estimate 0
R0130 Risk margin 0
R0200 Technical provisions - total 5,452 5,452
Health insurance (direct business)Annuities
stemming from non-life
insurance contracts and
relating to health
insurance obligations
Health reinsurance (reinsurance
accepted)
Total (Health similar to life
insurance)
Insurance with profit
participation
Index-linked and unit-linked insurance Other life insurance Annuities stemming from
non-life insurance
contracts and relating to insurance
obligation other than health insurance obligations
Accepted reinsurance
Total (Life other than health insurance, including
Unit-Linked)

S.17.01.02 - £'000
Non-Life Technical Provisions
Medical expense
insurance
Income protection insurance
Workers' compensation
insurance
Motor vehicle liability
insurance
Other motor insurance
Marine, aviation and
transport insurance
Fire and other damage to property insurance
General liability
insurance
Credit and suretyship insurance
Legal expenses insurance
AssistanceMiscellaneous financial loss
Non-proportional
health reinsurance
Non-proportional
casualty reinsurance
Non-proportional
marine, aviation and
transport reinsurance
Non-proportional
property reinsurance
C0020 C0030 C0040 C0050 C0060 C0070 C0080 C0090 C0100 C0110 C0120 C0130 C0140 C0150 C0160 C0170 C0180
R0010 Technical provisions calculated as a whole 0 0 0
R0050Total Recoverables from reinsurance/SPV and Finite Re after the adjustment for expected losses due to counterparty default associated to TP calculated as a whole
0
Technical provisions calculated as a sum of BE and RM
Best estimate
Premium provisions
R0060 Gross 47,143 21,605 68,748
R0140Total recoverable from reinsurance/SPV and Finite Re after the adjustment for expected losses due to counterparty default
9,601 7,044 16,645
R0150 Net Best Estimate of Premium Provisions 37,542 14,561 52,103
Claims provisions
R0160 Gross 240,437 3,198 243,635
R0240Total recoverable from reinsurance/SPV and Finite Re after the adjustment for expected losses due to counterparty default
57,641 2,414 60,055
R0250 Net Best Estimate of Claims Provisions 182,796 784 183,580
R0260 Total best estimate - gross 287,580 24,803 312,383
R0270 Total best estimate - net 220,338 15,345 235,683
R0280 Risk margin 10,236 713 10,949
Amount of the transitional on Technical Provisions
R0290 Technical Provisions calculated as a whole 0
R0300 Best estimate 0
R0310 Risk margin 0
R0320 Technical provisions - total 297,816 25,516 323,332
R0330Recoverable from reinsurance contract/SPV and Finite Re after the adjustment for expected losses due to counterparty default - total
67,242 9,459 76,701
R0340Technical provisions minus recoverables from reinsurance/SPV and Finite Re - total
230,574 16,058 246,631
Direct business and accepted proportional reinsurance Accepted non-proportional reinsurance
Total Non-Life obligation

S.19.01.21 (unaudited) - £'000
Non-Life insurance claims
Total Non-life business
Z0010 Accident year / underwriting year
Gross Claims Paid (non-cumulative)
(absolute amount)
C0010 C0020 C0030 C0040 C0050 C0060 C0070 C0080 C0090 C0100 C0110 C0170 C0180
Year
0 1 2 3 4 5 6 7 8 9 10 & +
R0100 Prior 59 59 59
R0160 N-9 8,859 32,568 10,314 3,134 2,627 1,453 662 87 60 139 139 59,902
R0170 N-8 15,904 44,504 10,780 4,451 3,646 2,687 674 1,024 773 773 84,444
R0180 N-7 16,560 39,374 12,510 6,264 5,349 2,691 708 1,055 1,055 84,512
R0190 N-6 21,450 52,976 17,067 9,745 5,362 2,760 1,291 1,291 110,650
R0200 N-5 28,011 64,630 19,774 9,832 6,257 4,642 4,642 133,147
R0210 N-4 28,578 68,683 21,079 8,884 7,937 7,937 135,161
R0220 N-3 28,508 72,287 20,051 10,699 10,699 131,545
R0230 N-2 33,800 74,684 23,101 23,101 131,585
R0240 N-1 31,672 78,697 78,697 110,369
R0250 N 39,655 39,655 39,655
R0260 Total 168,048 1,021,029
Gross Undiscounted Best Estimate Claims Provisions
(absolute amount)
C0360
C0200 C0210 C0220 C0230 C0240 C0250 C0260 C0270 C0280 C0290 C0300
Year
0 1 2 3 4 5 6 7 8 9 10 & +
R0100 Prior 3,840 3,427
R0160 N-9 0 0 0 0 0 0 0 0 0 464 464
R0170 N-8 0 0 0 0 0 0 0 0 1,411 1,213
R0180 N-7 0 0 0 0 0 0 0 3,742 3,526
R0190 N-6 0 0 0 0 0 0 7,509 7,066
R0200 N-5 0 0 0 0 0 15,835 15,054
R0210 N-4 0 0 0 0 24,897 23,355
R0220 N-3 0 0 0 34,370 32,917
R0230 N-2 0 0 60,220 57,660
R0240 N-1 0 87,068 84,913
R0250 N 104,102 102,717
R0260 Total 332,311
Underwriting Year
Development year In Current year
Sum of years (cumulative)
Year end (discounted
data)Development year

S.23.01.01 - £'000
Own Funds
Basic own funds before deduction for participations in other financial sector as foreseen in article 68 of Delegated Regulation 2015/35 TotalTier 1
unrestrictedTier 1
restrictedTier 2 Tier 3
C0010 C0020 C0030 C0040 C0050
R0010 Ordinary share capital (gross of own shares) 37,300 37,300 0
R0030 Share premium account related to ordinary share capital 0 0 0
R0040 Initial funds, members' contributions or the equivalent basic own-fund item for mutual and mutual-type undertakings 0 0 0
R0050 Subordinated mutual member accounts 0 0 0 0
R0070 Surplus funds 0 0
R0090 Preference shares 0 0 0 0
R0110 Share premium account related to preference shares 0 0 0 0
R0130 Reconciliation reserve 90,411 90,411
R0140 Subordinated liabilities 0 0 0 0
R0160 An amount equal to the value of net deferred tax assets 0 0
R0180 Other own fund items approved by the supervisory authority as basic own funds not specified above 0 0 0 0 0
R0220 Own funds from the financial statements that should not be represented by the reconciliation reserve and do not meet the criteria to be classified as Solvency II own funds 0
R0230 Deductions for participations in financial and credit institutions 0
R0290 Total basic own funds after deductions 127,711 127,711 0 0 0
Ancillary own funds
R0300 Unpaid and uncalled ordinary share capital callable on demand 0
R0310 Unpaid and uncalled initial funds, members' contributions or the equivalent basic own fund item for mutual and mutual - type undertakings, callable on demand 0
R0320 Unpaid and uncalled preference shares callable on demand 0
R0330 A legally binding commitment to subscribe and pay for subordinated liabilities on demand 0
R0340 Letters of credit and guarantees under Article 96(2) of the Directive 2009/138/EC 0
R0350 Letters of credit and guarantees other than under Article 96(2) of the Directive 2009/138/EC 0
R0360 Supplementary members calls under first subparagraph of Article 96(3) of the Directive 2009/138/EC 0
R0370 Supplementary members calls - other than under first subparagraph of Article 96(3) of the Directive 2009/138/EC 0
R0390 Other ancillary own funds 0
R0400 Total ancillary own funds 0 0 0
Available and eligible own funds
R0500 Total available own funds to meet the SCR 127,711 127,711 0 0 0
R0510 Total available own funds to meet the MCR 127,711 127,711 0 0
R0540 Total eligible own funds to meet the SCR 127,711 127,711 0 0 0
R0550 Total eligible own funds to meet the MCR 127,711 127,711 0 0
R0580 SCR 78,115
R0600 MCR 34,228
R0620 Ratio of Eligible own funds to SCR 163.49%
R0640 Ratio of Eligible own funds to MCR 373.12%
Reconcilliation reserve C0060
R0700 Excess of assets over liabilities 127,711
R0710 Own shares (held directly and indirectly) 0
R0720 Foreseeable dividends, distributions and charges
R0730 Other basic own fund items 37,300
R0740 Adjustment for restricted own fund items in respect of matching adjustment portfolios and ring fenced funds 0
R0760 Reconciliation reserve 90,411
Expected profits
R0770 Expected profits included in future premiums (EPIFP) - Life business
R0780 Expected profits included in future premiums (EPIFP) - Non- life business 4,371
R0790 Total Expected profits included in future premiums (EPIFP) 4,371

S.25.01.21 - £'000
Solvency Capital Requirement - for undertakings on Standard Formula
Gross solvency capital requirement
USP Simplifications
C0110 C0080 C0090
R0010 Market risk 7,975
R0020 Counterparty default risk 4,821
R0030 Life underwriting risk 10
R0040 Health underwriting risk 0
R0050 Non-life underwriting risk 73,651
R0060 Diversification -7,849
R0070 Intangible asset risk 0
R0100 Basic Solvency Capital Requirement 78,609
C l l i f S l C i l R i C0 00Calculation of Solvency Capital Requirement C0100
R0130 Operational risk 9,395
R0140 Loss-absorbing capacity of technical provisions 0
R0150 Loss-absorbing capacity of deferred taxes -9,889
R0160 Capital requirement for business operated in accordance with Art. 4 of Directive 2003/41/EC 0
R0200 Solvency Capital Requirement excluding capital add-on 78,115
R0210 Capital add-ons already set 0
R0220 Solvency capital requirement 78,115
Other information on SCR
R0400 Capital requirement for duration-based equity risk sub-module 0
R0410 Total amount of Notional Solvency Capital Requirements for remaining part 0
R0420 Total amount of Notional Solvency Capital Requirements for ring fenced funds 0
R0430 Total amount of Notional Solvency Capital Requirements for matching adjustment portfolios 0
R0440 Diversification effects due to RFF nSCR aggregation for article 304 0

S.28.01.01 - £'000
Minimum Capital Requirement - Only life or only non-life insurance or reinsurance activity
Linear formula component for non-life insurance and reinsurance obligations C0010
R0010 MCRNL Result 34,134
Net (of reinsurance/SPV) best
estimate and TP calculated as a whole
Net (of reinsurance) written premiums in the last 12 months
C0020 C0030
R0020 Medical expense insurance and proportional reinsurance 0
R0030 Income protection insurance and proportional reinsurance 0
R0040 Workers' compensation insurance and proportional reinsurance 0
R0050 Motor vehicle liability insurance and proportional reinsurance 220,338 126,343
R0060 Other motor insurance and proportional reinsurance 15,345 31,710
R0070 Marine, aviation and transport insurance and proportional reinsurance 0
R0080 Fire and other damage to property insurance and proportional reinsurance 0 0
R0090 General liability insurance and proportional reinsurance 0 0
R0100 Credit and suretyship insurance and proportional reinsurance 0
R0110 Legal expenses insurance and proportional reinsurance 0
R0120 Assistance and proportional reinsurance 0
R0130 Miscellaneous financial loss insurance and proportional reinsurance 0
R0140 Non-proportional health reinsurance 0
R0150 Non-proportional casualty reinsurance 0
R0160 Non-proportional marine, aviation and transport reinsurance 0
R0170 Non-proportional property reinsurance 0
Linear formula component for life insurance and reinsurance obligations C0040
R0200 MCRL Result 94
Net (of reinsurance/SPV) best
estimate and TP calculated as a whole
Net (of reinsurance/SPV) total
capital at risk
C0050 C0060
R0210 Obligations with profit participation - guaranteed benefits
R0220 Obligations with profit participation - future discretionary benefits
R0230 Index-linked and unit-linked insurance obligations 0
R0240 Other life (re)insurance and health (re)insurance obligations 4,459
R0250 Total capital at risk for all life (re)insurance obligations
Overall MCR calculation C0070
R0300 Linear MCR 34,228
R0310 SCR 78,115
R0320 MCR cap 35,152
R0330 MCR floor 19,529
R0340 Combined MCR 34,228
R0350 Absolute floor of the MCR 2,146
R0400 Minimum Capital Requirement 34,228

Admiral Insurance
(Gibraltar) Limited
Solvency and Financial
Condition Report
Disclosures
31 December
2016
(Monetary amounts in GBP thousands)

S.02.01.02 - £'000
Balance sheet
Solvency II
value
Assets C0010
R0030 Intangible assets
R0040 Deferred tax assets
R0050 Pension benefit surplus
R0060 Property, plant & equipment held for own use 0
R0070 Investments (other than assets held for index-linked and unit-linked contracts) 1,805,282
R0080 Property (other than for own use) 0
R0090 Holdings in related undertakings, including participations 0
R0100 Equities 0
R0110 Equities - listed 0
R0120 Equities - unlisted 0
R0130 Bonds 1,140,211
R0140 Government Bonds 46,933
R0150 Corporate Bonds 862,259
R0160 Structured notes 0
R0170 Collateralised securities 231,019
R0180 Collective Investments Undertakings 552,572
R0190 Derivatives
R0200 Deposits other than cash equivalents 112,500
R0210 Other investments 0
R0220 Assets held for index-linked and unit-linked contracts
R0230 Loans and mortgages 0
R0240 Loans on policies 0
R0250 Loans and mortgages to individuals
R0260 Other loans and mortgages
R0270 Reinsurance recoverables from: 755,768
R0280 Non-life and health similar to non-life 750,360
R0290 Non-life excluding health 750,360
R0300 Health similar to non-life 0
R0310 Life and health similar to life, excluding index-linked and unit-linked 5,408
R0320 Health similar to life 0
R0330 Life excluding health and index-linked and unit-linked 5,408
R0340 Life index-linked and unit-linked 0
R0350 Deposits to cedants 0
R0360 Insurance and intermediaries receivables 41,418
R0370 Reinsurance receivables
R0380 Receivables (trade, not insurance) 23,929
R0390 Own shares (held directly) 0
R0400 Amounts due in respect of own fund items or initial fund called up but not yet paid in 0
R0410 Cash and cash equivalents 75,318
R0420 Any other assets, not elsewhere shown 0
R0500 Total assets 2,701,715

S.02.01.02 - £'000
Balance sheet
Solvency II
value
Liabilities C0010
R0510 Technical provisions - non-life 1,647,862
R0520 Technical provisions - non-life (excluding health) 1,647,862
R0530 TP calculated as a whole 0
R0540 Best Estimate 1,604,526
R0550 Risk margin 43,337
R0560 Technical provisions - health (similar to non-life) 0
R0570 TP calculated as a whole 0
R0580 Best Estimate 0
R0590 Risk margin 0
R0600 Technical provisions - life (excluding index-linked and unit-linked) 30,069
R0610 Technical provisions - health (similar to life) 0
R0620 TP calculated as a whole 0
R0630 Best Estimate 0
R0640 Risk margin 0
R0650 Technical provisions - life (excluding health and index-linked and unit-linked) 30,069
R0660 TP calculated as a whole 0
R0670 Best Estimate 29,278
R0680 Risk margin 791
R0690 Technical provisions - index-linked and unit-linked 0
R0700 TP calculated as a whole 0
R0710 Best Estimate 0
R0720 Risk margin 0
R0740 Contingent liabilities 0
R0750 Provisions other than technical provisions
R0760 Pension benefit obligations
R0770 Deposits from reinsurers 462,966
R0780 Deferred tax liabilities 7,299
R0790 Derivatives
R0800 Debts owed to credit institutions
R0810 Financial liabilities other than debts owed to credit institutions
R0820 Insurance & intermediaries payables 79,732
R0830 Reinsurance payables
R0840 Payables (trade, not insurance) 61,698
R0850 Subordinated liabilities 0
R0860 Subordinated liabilities not in BOF
R0870 Subordinated liabilities in BOF 0
R0880 Any other liabilities, not elsewhere shown
R0900 Total liabilities 2,289,626
R1000 Excess of assets over liabilities 412,089

S.05.01.02 (unaudited) - £'000
Non-life
Medical
expense
insurance
Income
protection
insurance
Workers'
compensation
insurance
Motor vehicle
liability
insurance
Other motor
insurance
Marine,
aviation and
transport
insurance
Fire and
other damage
to property
insurance
General
liability
insurance
Credit and
suretyship
insurance
Legal
expenses
insurance
AssistanceMisc. financial
lossHealth Casualty
Marine,
aviation and
transport
Property
C0010 C0020 C0030 C0040 C0050 C0060 C0070 C0080 C0090 C0100 C0110 C0120 C0130 C0140 C0150 C0160 C0200
Premiums written
R0110 Gross - Direct Business 808,213 194,608 73,135 192 15,560 25,572 1,117,280
R0120 Gross - Proportional reinsurance accepted 0
R0130 Gross - Non-proportional reinsurance accepted 0
R0140 Reinsurers' share 541,691 130,899 52,773 138 782 0 726,283
R0200 Net 266,522 63,709 20,363 53 14,778 25,572 390,997
Premiums earned
R0210 Gross - Direct Business 751,930 179,746 61,219 161 14,144 22,315 1,029,515
R0220 Gross - Proportional reinsurance accepted 0
R0230 Gross - Non-proportional reinsurance accepted 0
R0240 Reinsurers' share 504,050 120,905 44,303 116 383 0 669,757
R0300 Net 247,881 58,841 16,916 44 13,761 22,315 359,758
Claims incurred
R0310 Gross - Direct Business 527,270 127,971 43,149 113 7,709 8,677 714,889
R0320 Gross - Proportional reinsurance accepted 0
R0330 Gross - Non-proportional reinsurance accepted 0
R0340 Reinsurers' share 365,326 89,062 30,208 79 853 0 485,528
R0400 Net 161,944 38,909 12,942 34 6,856 8,677 229,361
Changes in other technical provisions
R0410 Gross - Direct Business 0 0 0 0 0 0 0
R0420 Gross - Proportional reinsurance accepted 0
R0430 Gross - Non-proportional reinsurance accepted 0
R0440 Reinsurers' share 0 0 0 0 0 0 0
R0500 Net 0 0 0 0 0 0 0
R0550 Expenses incurred 50,777 11,577 3,728 10 1,138 2,000 69,229
R1200 Other expenses 0
R1300 Total expenses 69,229
As noted in the main body of the report, the allocation of premium, claims and expenses to line of business (between both non life and life, and within non-life) is based on a simplified approach and is only for the purpose of the QRT disclosure.
The Group and subsidiary Boards do not receive or review premiums, claims and expenses information presented on an IFRS basis, using this allocation by line of business.
Premiums, claims and expenses by line of business
Line of Business for: non-life insurance and reinsurance obligations (direct business and accepted proportional reinsurance)Line of business for: accepted non-proportional
reinsurance
Total

S.05.01.02 (unaudited) - £'000
Life
Health
insurance
Insurance with
profit
participation
Index-linked
and unit-linked
insurance
Other life
insurance
Annuities
stemming from
non-life insurance
contracts and
relating to health
insurance
obligations
Annuities
stemming from
non-life insurance
contracts and
relating to
insurance
obligations other
than health
insurance
obligations
Health
reinsurance
Life
reinsurance
C0210 C0220 C0230 C0240 C0250 C0260 C0270 C0280 C0300
Premiums written
R1410 Gross 0
R1420 Reinsurers' share 0
R1500 Net 0 0
Premiums earned
R1510 Gross 0
R1520 Reinsurers' share 0
R1600 Net 0 0
Claims incurred
R1610 Gross 18,777 18,777
R1620 Reinsurers' share 13,078 13,078
R1700 Net 5,700 5,700
Changes in other technical provisions
R1710 Gross 0
R1720 Reinsurers' share 0
R1800 Net 0 0
R1900 Expenses incurred 1,605 1,605
R2500 Other expenses 0
R2600 Total expenses 1,605
As noted in the main body of the report, the allocation of premium, claims and expenses to line of business (between both non life and life, and within non-life)
is based on a simplified approach and is only for the purpose of the QRT disclosure.
The Group and subsidiary Boards do not receive or review premiums, claims and expenses information presented on an IFRS basis, using this allocation by line of business.
Premiums, claims and expenses by line of business
Line of Business for: life insurance obligations Life reinsurance obligations
Total

S.05.02.01 (unaudited) - £'000
Premiums, claims and expenses by country
Non-life
C0010 C0020 C0030 C0040 C0050 C0060 C0070
R0010 IT FR
C0080 C0090 C0100 C0110 C0120 C0130 C0140
Premiums written
R0110 Gross - Direct Business 1,035,806 46,492 34,983 1,117,280
R0120 Gross - Proportional reinsurance accepted 0
R0130 Gross - Non-proportional reinsurance accepted 0
R0140 Reinsurers' share 672,342 28,556 25,385 726,283
R0200 Net 363,464 17,935 9,598 0 0 0 390,997
Premiums earned
R0210 Gross - Direct Business 960,069 40,895 28,551 1,029,515
R0220 Gross - Proportional reinsurance accepted 0
R0230 Gross - Non-proportional reinsurance accepted 0
R0240 Reinsurers' share 623,922 25,119 20,716 669,757
R0300 Net 336,147 15,776 7,835 0 0 0 359,758
Claims incurred
R0310 Gross - Direct Business 666,785 25,576 22,528 714,889
R0320 Gross - Proportional reinsurance accepted 0
R0330 Gross - Non-proportional reinsurance accepted 0
R0340 Reinsurers' share 453,991 15,813 15,724 485,528
R0400 Net 212,794 9,763 6,804 0 0 0 229,361
Changes in other technical provisions
R0410 Gross - Direct Business 0 0 0 0
R0420 Gross - Proportional reinsurance accepted 0
R0430 Gross - Non-proportional reinsurance accepted 0
R0440 Reinsurers' share 0 0 0 0
R0500 Net 0 0 0 0 0 0 0
R0550 Expenses incurred 56,339 5,467 4,979 66,785
R1200 Other expenses 0
R1300 Total expenses 66,785
As noted in the main body of the report, the allocation of premium, claims and expenses to line of business (between both non life and life, and within non-life)
is based on a simplified approach and is only for the purpose of the QRT disclosure.
The Group and subsidiary Boards do not receive or review premiums, claims and expenses information presented on an IFRS basis, using this allocation by line of business.
Home Country
Top 5 countries (by amount of gross premiums written) -
non-life obligations
Top 5 countries (by amount of gross
premiums written) - non-life
obligations Total Top 5 and
home country

S.05.02.01 (unaudited) - £'000
Premiums, claims and expenses by country
Life
C0150 C0160 C0170 C0180 C0190 C0200 C0210
R1400 IT FR
C0220 C0230 C0240 C0250 C0260 C0270 C0280
Premiums written
R1410 Gross 0
R1420 Reinsurers' share 0
R1500 Net 0 0 0 0 0 0 0
Premiums earned
R1510 Gross 0
R1520 Reinsurers' share 0
R1600 Net 0 0 0 0 0 0 0
Claims incurred
R1610 Gross 18,777 0 0 18,777
R1620 Reinsurers' share 13,078 0 0 13,078
R1700 Net 5,700 0 0 0 0 0 5,700
Changes in other technical provisions
R1710 Gross 0
R1720 Reinsurers' share 0
R1800 Net 0 0 0 0 0 0 0
R1900 Expenses incurred 4,049 4,049
R2500 Other expenses 0
R2600 Total expenses 4,049
As noted in the main body of the report, the allocation of premium, claims and expenses to line of business (between both non life and life, and within non-life)
is based on a simplified approach and is only for the purpose of the QRT disclosure.
The Group and subsidiary Boards do not receive or review premiums, claims and expenses information presented on an IFRS basis, using this allocation by line of business.
Home Country
Top 5 countries (by amount of gross premiums written) - life
obligations
Top 5 countries (by amount of gross
premiums written) - life obligations Total Top 5 and
home country

S.12.01.02 - £'000
Life and Health SLT Technical Provisions
Contracts
without
options and
guarantees
Contracts with
options or
guarantees
Contracts
without
options and
guarantees
Contracts with
options or
guarantees
Contracts
without
options and
guarantees
Contracts
with options
or
guarantees
C0020 C0030 C0040 C0050 C0060 C0070 C0080 C0090 C0100 C0150 C0160 C0170 C0180 C0190 C0200 C0210
R0010 Technical provisions calculated as a whole 0
R0020
Total Recoverables from reinsurance/SPV and Finite Re after
the adjustment for expected losses due to counterparty default
associated to TP calculated as a whole 0
Technical provisions calculated as a sum of BE and RM
Best estimate
R0030 Gross Best Estimate 29,278 29,278
R0080
Total Recoverables from reinsurance/SPV and Finite Re after
the adjustment for expected losses due to counterparty default 5,408 5,408
R0090Best estimate minus recoverables from reinsurance/SPV
and Finite Re23,870 23,870
R0100 Risk margin 791 791
Amount of the transitional on Technical Provisions
R0110 Technical Provisions calculated as a whole 0
R0120 Best estimate 0
R0130 Risk margin 0
R0200 Technical provisions - total 30,069 30,069
Health insurance (direct business)
Annuities
stemming from
non-life
insurance
contracts and
relating to
health
insurance
obligations
Health
reinsurance
(reinsurance
accepted)
Total (Health
similar to life
insurance)
Insurance
with profit
participation
Index-linked and unit-linked insurance Other life insurance Annuities
stemming from
non-life
insurance
contracts and
relating to
insurance
obligation other
than health
insurance
obligations
Accepted
reinsurance
Total
(Life other
than health
insurance,
including
Unit-Linked)
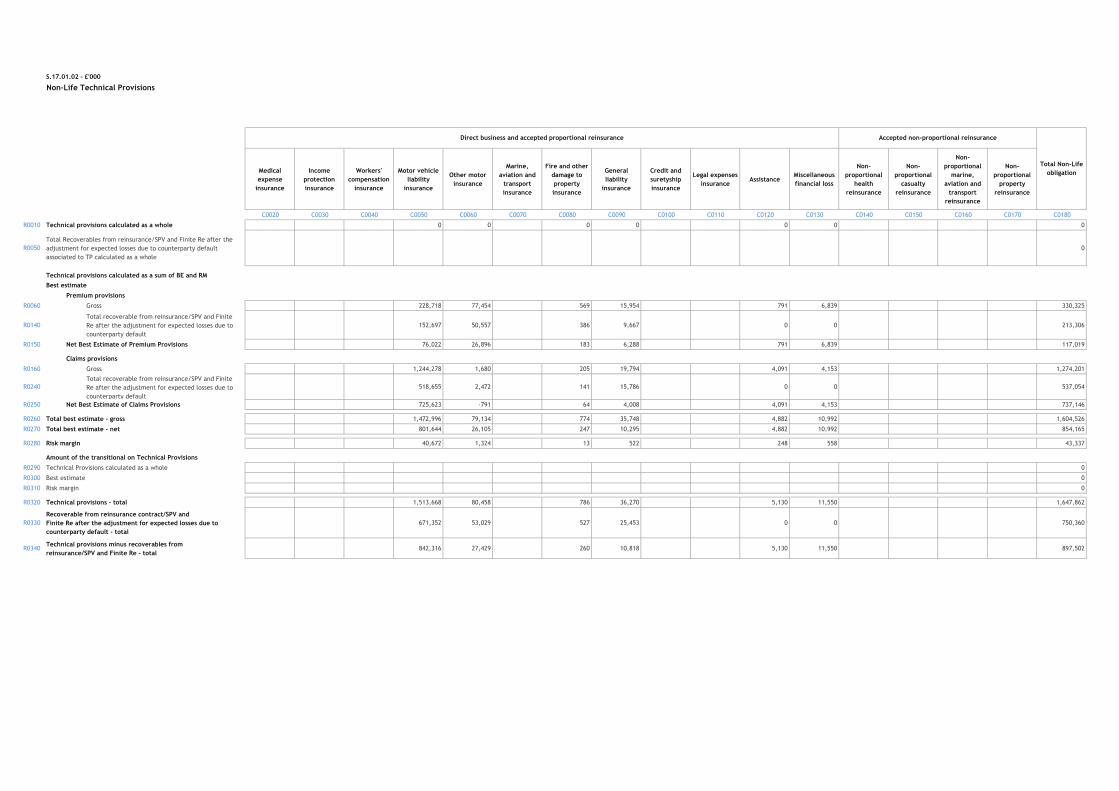
S.17.01.02 - £'000
Non-Life Technical Provisions
Medical
expense
insurance
Income
protection
insurance
Workers'
compensation
insurance
Motor vehicle
liability
insurance
Other motor
insurance
Marine,
aviation and
transport
insurance
Fire and other
damage to
property
insurance
General
liability
insurance
Credit and
suretyship
insurance
Legal expenses
insuranceAssistance
Miscellaneous
financial loss
Non-
proportional
health
reinsurance
Non-
proportional
casualty
reinsurance
Non-
proportional
marine,
aviation and
transport
reinsurance
Non-
proportional
property
reinsurance
C0020 C0030 C0040 C0050 C0060 C0070 C0080 C0090 C0100 C0110 C0120 C0130 C0140 C0150 C0160 C0170 C0180
R0010 Technical provisions calculated as a whole 0 0 0 0 0 0 0
R0050
Total Recoverables from reinsurance/SPV and Finite Re after the
adjustment for expected losses due to counterparty default
associated to TP calculated as a whole
0
Technical provisions calculated as a sum of BE and RM
Best estimate
Premium provisions
R0060 Gross 228,718 77,454 569 15,954 791 6,839 330,325
R0140
Total recoverable from reinsurance/SPV and Finite
Re after the adjustment for expected losses due to
counterparty default
152,697 50,557 386 9,667 0 0 213,306
R0150 Net Best Estimate of Premium Provisions 76,022 26,896 183 6,288 791 6,839 117,019
Claims provisions
R0160 Gross 1,244,278 1,680 205 19,794 4,091 4,153 1,274,201
R0240
Total recoverable from reinsurance/SPV and Finite
Re after the adjustment for expected losses due to
counterparty default
518,655 2,472 141 15,786 0 0 537,054
R0250 Net Best Estimate of Claims Provisions 725,623 -791 64 4,008 4,091 4,153 737,146
R0260 Total best estimate - gross 1,472,996 79,134 774 35,748 4,882 10,992 1,604,526
R0270 Total best estimate - net 801,644 26,105 247 10,295 4,882 10,992 854,165
R0280 Risk margin 40,672 1,324 13 522 248 558 43,337
Amount of the transitional on Technical Provisions
R0290 Technical Provisions calculated as a whole 0
R0300 Best estimate 0
R0310 Risk margin 0
R0320 Technical provisions - total 1,513,668 80,458 786 36,270 5,130 11,550 1,647,862
R0330
Recoverable from reinsurance contract/SPV and
Finite Re after the adjustment for expected losses due to
counterparty default - total
671,352 53,029 527 25,453 0 0 750,360
R0340Technical provisions minus recoverables from
reinsurance/SPV and Finite Re - total842,316 27,429 260 10,818 5,130 11,550 897,502
Direct business and accepted proportional reinsurance Accepted non-proportional reinsurance
Total Non-Life
obligation

S.19.01.21 (unaudited) - £'000
Non-Life insurance claims
Total Non-life business
Z0010 Accident year / underwriting year
Gross Claims Paid (non-cumulative)
(absolute amount)
C0010 C0020 C0030 C0040 C0050 C0060 C0070 C0080 C0090 C0100 C0110 C0170 C0180
Year
0 1 2 3 4 5 6 7 8 9 10 & +
R0100 Prior 374 374 374
R0160 N-9 34,965 65,208 13,854 7,580 7,142 7,077 3,908 325 123 40 40 140,223
R0170 N-8 42,118 82,499 17,967 11,141 9,694 8,886 2,452 2,054 3,503 3,503 180,314
R0180 N-7 54,615 111,601 26,382 16,236 14,670 8,280 1,986 3,435 3,435 237,205
R0190 N-6 77,818 165,726 40,809 31,028 18,684 11,264 3,713 3,713 349,042
R0200 N-5 117,153 213,871 57,182 36,496 23,615 25,725 25,725 474,041
R0210 N-4 116,748 203,590 64,041 35,956 30,237 30,237 450,571
R0220 N-3 103,637 197,555 68,367 47,985 47,985 417,545
R0230 N-2 115,079 219,153 76,424 76,424 410,656
R0240 N-1 121,639 254,779 254,779 376,418
R0250 N 156,745 156,745 156,745
R0260 Total 602,960 3,193,135
Gross Undiscounted Best Estimate Claims Provisions
(absolute amount)
C0360
C0200 C0210 C0220 C0230 C0240 C0250 C0260 C0270 C0280 C0290 C0300
Year
0 1 2 3 4 5 6 7 8 9 10 & +
R0100 Prior 17,760 15,766
R0160 N-9 0 0 0 0 0 0 0 0 0 2,355 2,349
R0170 N-8 0 0 0 0 0 0 0 0 5,778 4,764
R0180 N-7 0 0 0 0 0 0 0 13,172 11,203
R0190 N-6 0 0 0 0 0 0 32,702 29,859
R0200 N-5 0 0 0 0 0 80,740 75,196
R0210 N-4 0 0 0 0 114,554 103,615
R0220 N-3 0 0 0 156,993 146,601
R0230 N-2 0 0 255,786 237,463
R0240 N-1 0 362,775 347,073
R0250 N 466,544 456,182
R0260 Total 1,430,071
Underwriting Year
Development year In Current
year
Sum of years
(cumulative)
Year end
(discounted
data)
Development year

S.23.01.01 - £'000
Own Funds
Basic own funds before deduction for participations in other financial sector as foreseen in article 68 of Delegated Regulation 2015/35 TotalTier 1
unrestricted
Tier 1
restrictedTier 2 Tier 3
C0010 C0020 C0030 C0040 C0050
R0010 Ordinary share capital (gross of own shares) 58 58 0
R0030 Share premium account related to ordinary share capital 14,944 14,944 0
R0040 Initial funds, members' contributions or the equivalent basic own-fund item for mutual and mutual-type undertakings 0 0 0
R0050 Subordinated mutual member accounts 0 0 0 0
R0070 Surplus funds 0 0
R0090 Preference shares 0 0 0 0
R0110 Share premium account related to preference shares 0 0 0 0
R0130 Reconciliation reserve 397,087 397,087
R0140 Subordinated liabilities 0 0 0 0
R0160 An amount equal to the value of net deferred tax assets 0 0
R0180 Other own fund items approved by the supervisory authority as basic own funds not specified above 0 0 0 0 0
R0220 Own funds from the financial statements that should not be represented by the reconciliation reserve and do not meet the criteria to be classified as Solvency II own funds 0
R0230 Deductions for participations in financial and credit institutions 0
R0290 Total basic own funds after deductions 412,089 412,089 0 0 0
Ancillary own funds
R0300 Unpaid and uncalled ordinary share capital callable on demand 0
R0310 Unpaid and uncalled initial funds, members' contributions or the equivalent basic own fund item for mutual and mutual - type undertakings, callable on demand 0
R0320 Unpaid and uncalled preference shares callable on demand 0
R0330 A legally binding commitment to subscribe and pay for subordinated liabilities on demand 0
R0340 Letters of credit and guarantees under Article 96(2) of the Directive 2009/138/EC 0
R0350 Letters of credit and guarantees other than under Article 96(2) of the Directive 2009/138/EC 0
R0360 Supplementary members calls under first subparagraph of Article 96(3) of the Directive 2009/138/EC 0
R0370 Supplementary members calls - other than under first subparagraph of Article 96(3) of the Directive 2009/138/EC 0
R0390 Other ancillary own funds 120,000 120,000
R0400 Total ancillary own funds 120,000 120,000 0
Available and eligible own funds
R0500 Total available own funds to meet the SCR 532,089 412,089 0 120,000 0
R0510 Total available own funds to meet the MCR 412,089 412,089 0 0
R0540 Total eligible own funds to meet the SCR 532,089 412,089 0 120,000 0
R0550 Total eligible own funds to meet the MCR 412,089 412,089 0 0
R0580 SCR 276,415
R0600 MCR 110,490
R0620 Ratio of Eligible own funds to SCR 192.50%
R0640 Ratio of Eligible own funds to MCR 372.97%
Reconcilliation reserve C0060
R0700 Excess of assets over liabilities 412,089
R0710 Own shares (held directly and indirectly) 0
R0720 Foreseeable dividends, distributions and charges
R0730 Other basic own fund items 15,002
R0740 Adjustment for restricted own fund items in respect of matching adjustment portfolios and ring fenced funds 0
R0760 Reconciliation reserve 397,087
Expected profits
R0770 Expected profits included in future premiums (EPIFP) - Life business
R0780 Expected profits included in future premiums (EPIFP) - Non- life business 16,398
R0790 Total Expected profits included in future premiums (EPIFP) 16,398

S.25.01.21 - £'000
Solvency Capital Requirement - for undertakings on Standard Formula
Gross solvency capital
requirementUSP Simplifications
C0110 C0080 C0090
R0010 Market risk 51,171
R0020 Counterparty default risk 22,503
R0030 Life underwriting risk 2,375
R0040 Health underwriting risk 0
R0050 Non-life underwriting risk 206,499 Standard deviation for non-life premium risk, Standard deviation for non-life reserve risk
R0060 Diversification -45,133
R0070 Intangible asset risk 0
R0100 Basic Solvency Capital Requirement 237,415
Calculation of Solvency Capital Requirement C0100
R0130 Operational risk 48,268
R0140 Loss-absorbing capacity of technical provisions 0
R0150 Loss-absorbing capacity of deferred taxes -9,267
R0160 Capital requirement for business operated in accordance with Art. 4 of Directive 2003/41/EC 0
R0200 Solvency Capital Requirement excluding capital add-on 276,415
R0210 Capital add-ons already set 0
R0220 Solvency capital requirement 276,415
Other information on SCR
R0400 Capital requirement for duration-based equity risk sub-module 0
R0410 Total amount of Notional Solvency Capital Requirements for remaining part 0
R0420 Total amount of Notional Solvency Capital Requirements for ring fenced funds 0
R0430 Total amount of Notional Solvency Capital Requirements for matching adjustment portfolios 0
R0440 Diversification effects due to RFF nSCR aggregation for article 304 0

S.28.01.01 - £'000
Minimum Capital Requirement - Only life or only non-life insurance or reinsurance activity
Linear formula component for non-life insurance and reinsurance obligations C0010
R0010 MCRNL Result 109,875
Net (of
reinsurance/SPV) best
estimate and TP
calculated as a whole
Net (of reinsurance)
written premiums in
the last 12 months
C0020 C0030
R0020 Medical expense insurance and proportional reinsurance 0
R0030 Income protection insurance and proportional reinsurance 0
R0040 Workers' compensation insurance and proportional reinsurance 0
R0050 Motor vehicle liability insurance and proportional reinsurance 801,644 266,522
R0060 Other motor insurance and proportional reinsurance 26,105 63,709
R0070 Marine, aviation and transport insurance and proportional reinsurance 0
R0080 Fire and other damage to property insurance and proportional reinsurance 247 20,363
R0090 General liability insurance and proportional reinsurance 10,295 53
R0100 Credit and suretyship insurance and proportional reinsurance 0
R0110 Legal expenses insurance and proportional reinsurance 0
R0120 Assistance and proportional reinsurance 4,882 14,778
R0130 Miscellaneous financial loss insurance and proportional reinsurance 10,992 25,572
R0140 Non-proportional health reinsurance 0
R0150 Non-proportional casualty reinsurance 0
R0160 Non-proportional marine, aviation and transport reinsurance 0
R0170 Non-proportional property reinsurance 0
Linear formula component for life insurance and reinsurance obligations C0040
R0200 MCRL Result 615
Net (of
reinsurance/SPV) best
estimate and TP
calculated as a whole
Net (of
reinsurance/SPV) total
capital at risk
C0050 C0060
R0210 Obligations with profit participation - guaranteed benefits
R0220 Obligations with profit participation - future discretionary benefits
R0230 Index-linked and unit-linked insurance obligations 0
R0240 Other life (re)insurance and health (re)insurance obligations 29,278
R0250 Total capital at risk for all life (re)insurance obligations
Overall MCR calculation C0070
R0300 Linear MCR 110,490
R0310 SCR 276,415
R0320 MCR cap 124,387
R0330 MCR floor 69,104
R0340 Combined MCR 110,490
R0350 Absolute floor of the MCR 2,146
R0400 Minimum Capital Requirement 110,490