Embed Size (px)
Citation preview
—ABB LTD, ZURICH, SWITZERLAND, OCTOBER 25, 2018
Sustained growthQ3 2018 resultsUlrich Spiesshofer, CEO; Timo Ihamuotila, CFO
—
This presentation includes forward-looking information and statements including statements concerning the outlook for our businesses. These statements are based on current expectations, estimates and projections about the factors that may affect our future performance, including global economic conditions, and the economic conditions of the regions and industries that are major markets for ABB Ltd. These expectations, estimates and projections are generally identifiable by statements containing words such as “expects,” “believes,” “estimates,” “targets,” “plans,” “outlook”, “on track”, “2018 framework” or similar expressions.
There are numerous risks and uncertainties, many of which are beyond our control, that could cause our actual results to differ materially from the forward-looking information and statements made in this presentation and which could affect our ability to achieve any or all of our stated targets. The important factors that could cause such differences include, among others:
– business risks associated with the volatile global economic environment and political conditions
– costs associated with compliance activities
– market acceptance of new products and services
– changes in governmental regulations and currency exchange rates, and
– such other factors as may be discussed from time to time in ABB Ltd’s filings with the U.S. Securities and Exchange Commission, including its Annual Reports on Form 20-F.
Although ABB Ltd believes that its expectations reflected in any such forward-looking statement are based upon reasonable assumptions, it can give no assurance that those expectations will be achieved.
This presentation contains non-GAAP measures of performance. Definitions of these measures and reconciliations between these measures and their US GAAP counterparts can be found in the ‘Supplemental reconciliations and definitions’ section of “Financial Information” under “Quarterly results and annual reports” on our website at www.abb.com/investorrelations
Important notices
October 25, 2018 Slide 2

—
Q3 2018 financial performance
2018 update
October 25, 2018 Slide 3
Agenda
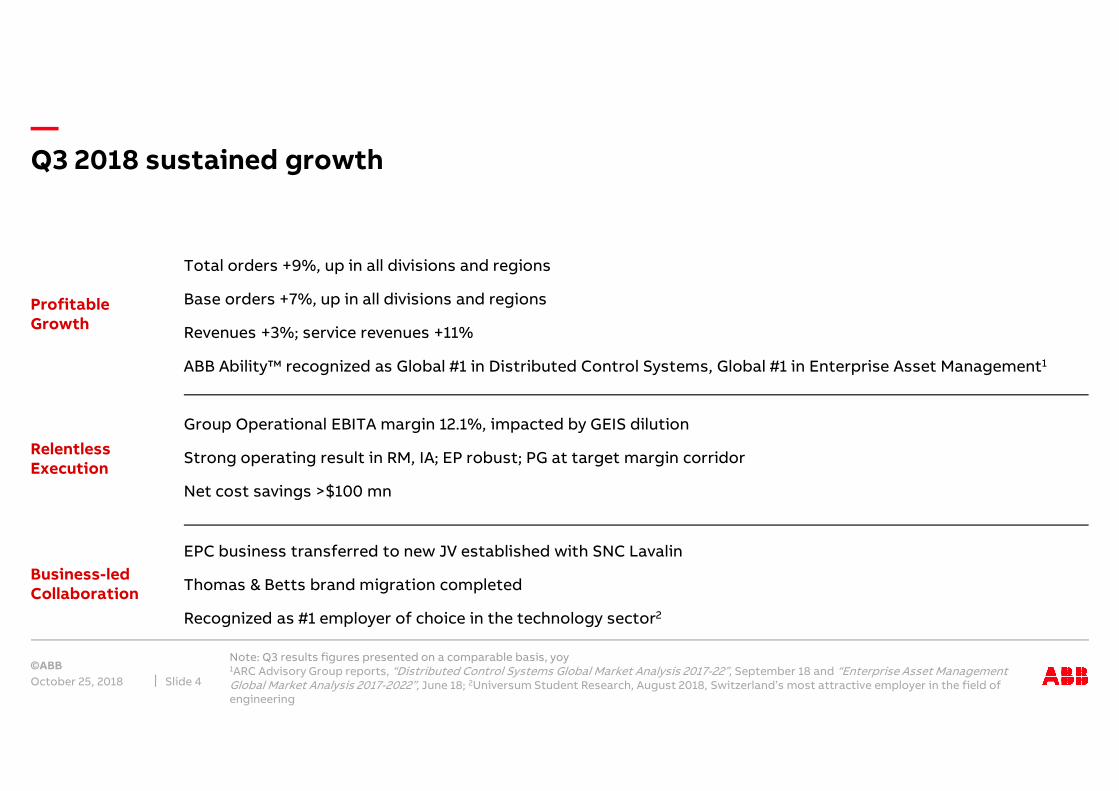
—Q3 2018 sustained growth
October 25, 2018
Note: Q3 results figures presented on a comparable basis, yoy1ARC Advisory Group reports, “Distributed Control Systems Global Market Analysis 2017-22”, September 18 and “Enterprise Asset Management Global Market Analysis 2017-2022”, June 18; 2Universum Student Research, August 2018, Switzerland’s most attractive employer in the field of engineering
Slide 4
Total orders +9%, up in all divisions and regions
Base orders +7%, up in all divisions and regions
Revenues +3%; service revenues +11%
ABB Ability™ recognized as Global #1 in Distributed Control Systems, Global #1 in Enterprise Asset Management1
Group Operational EBITA margin 12.1%, impacted by GEIS dilution
Strong operating result in RM, IA; EP robust; PG at target margin corridor
Net cost savings >$100 mn
EPC business transferred to new JV established with SNC Lavalin
Thomas & Betts brand migration completed
Recognized as #1 employer of choice in the technology sector2
Profitable Growth
Relentless Execution
Business-led Collaboration
—
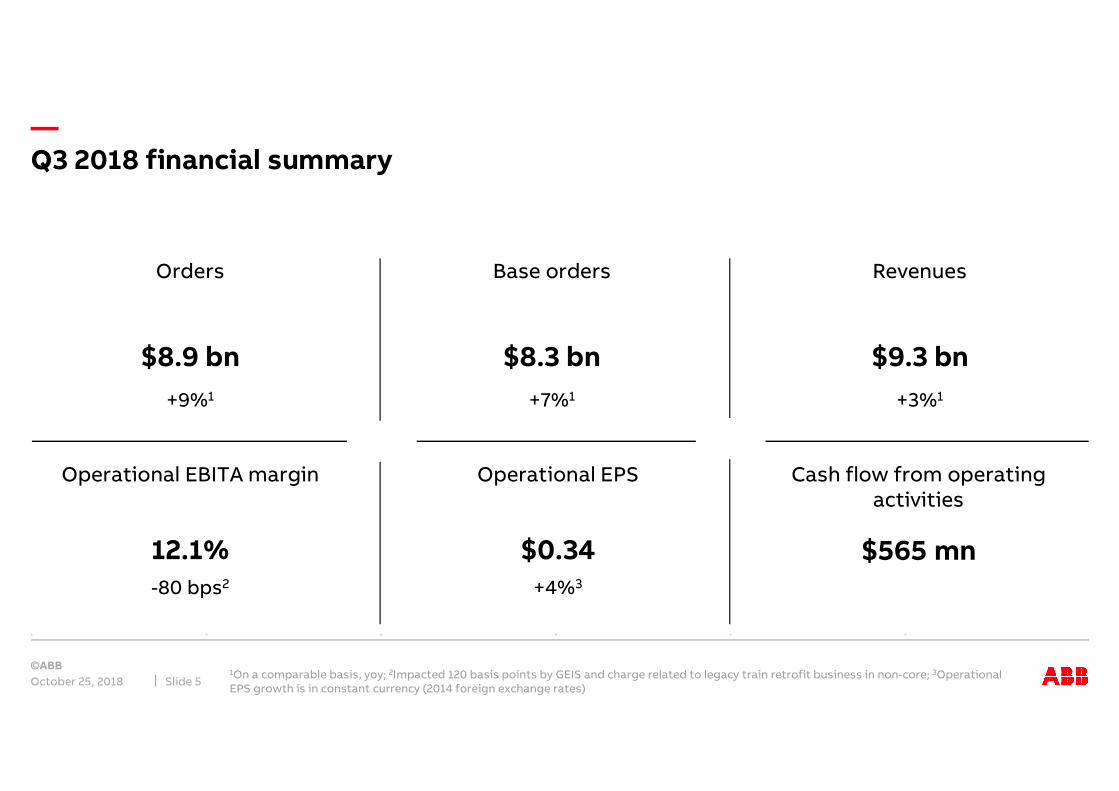
+4%3
Orders Base orders Revenues
Operational EBITA margin Operational EPS Cash flow from operating activities
$8.9 bn $8.3 bn $9.3 bn
+9%1 +7%1 +3%1
$565 mn12.1% $0.34
-80 bps2
Q3 2018 financial summary
October 25, 20181On a comparable basis, yoy; 2Impacted 120 basis points by GEIS and charge related to legacy train retrofit business in non-core; 3Operational EPS growth is in constant currency (2014 foreign exchange rates)
Slide 5

—
7.7 7.47.9
8.8 8.88.3
Q2 17 Q3 17 Q4 17 Q1 18 Q2 18 Q3 18
Base orders ($ bn) Large orders ($ bn)
Q3 2018 orders
October 25, 2018 1On a comparable basis; 2Defined as orders above $15 mn; 3AMEA: Asia, Middle East and AfricaSlide 6
Order growth in all regions
Total orders +9% yoy1 Base orders +7% yoy1
Growth by region and top 3 country markets in $ terms1
8.3 8.2 8.5
9.8 9.5 8.9USA
Canada
Brazil
AMERICAS
Germany
Italy
Sweden
EUROPE
China
India
S. Korea
AMEA3
+5%
+7%
+35%
+9%
+17%
+4%
-28%
+5%
+9%
+1%
+7%
+6%
2
—
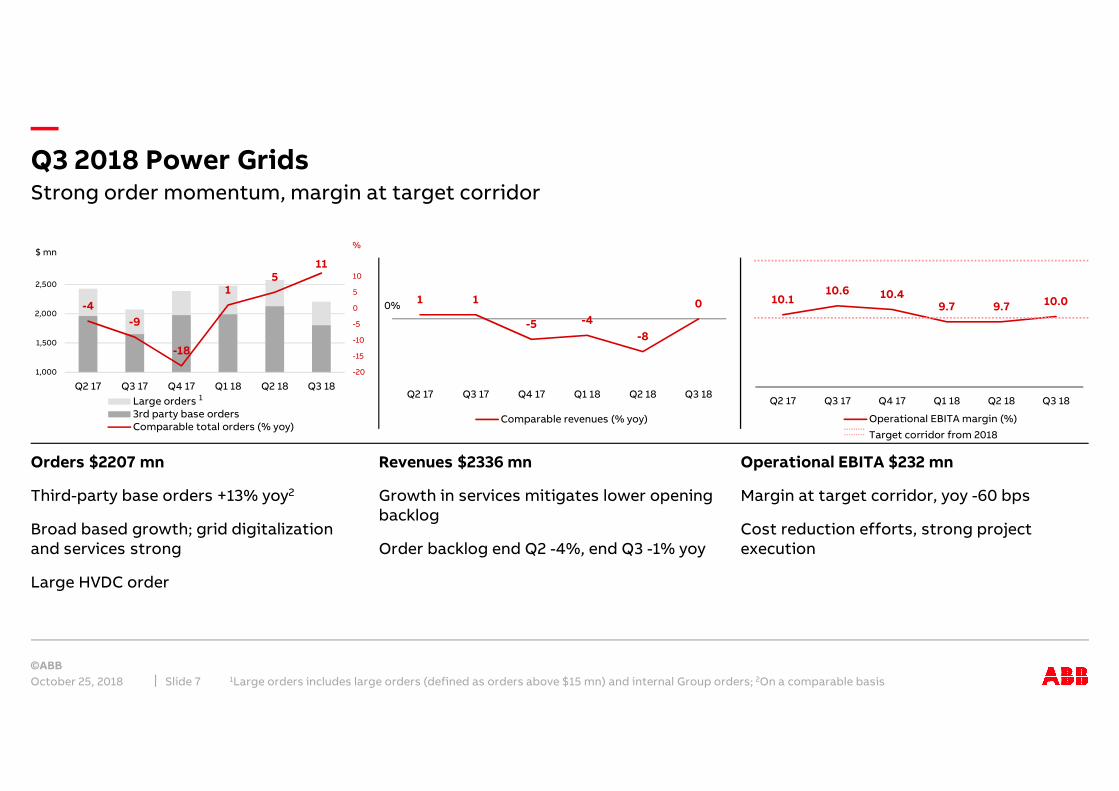
10.110.6 10.4
9.7 9.7 10.0
Q2 17 Q3 17 Q4 17 Q1 18 Q2 18 Q3 18
Operational EBITA margin (%)
Target corridor from 2018
Q3 2018 Power Grids
October 25, 2018 1Large orders includes large orders (defined as orders above $15 mn) and internal Group orders; 2On a comparable basisSlide 7
Strong order momentum, margin at target corridor
Orders $2207 mn
Third-party base orders +13% yoy2
Broad based growth; grid digitalization and services strong
Large HVDC order
Revenues $2336 mn
Growth in services mitigates lower opening backlog
Order backlog end Q2 -4%, end Q3 -1% yoy
Operational EBITA $232 mn
Margin at target corridor, yoy -60 bps
Cost reduction efforts, strong project execution
%$ mn
0%
1
-4
-9
-18
15
11
-20
-15
-10
-5
0
5
10
1,000
1,500
2,000
2,500
Q2 17 Q3 17 Q4 17 Q1 18 Q2 18 Q3 18
Large orders3rd party base ordersComparable total orders (% yoy)
1 1
-5 -4
-8
0
Q2 17 Q3 17 Q4 17 Q1 18 Q2 18 Q3 18
Comparable revenues (% yoy)
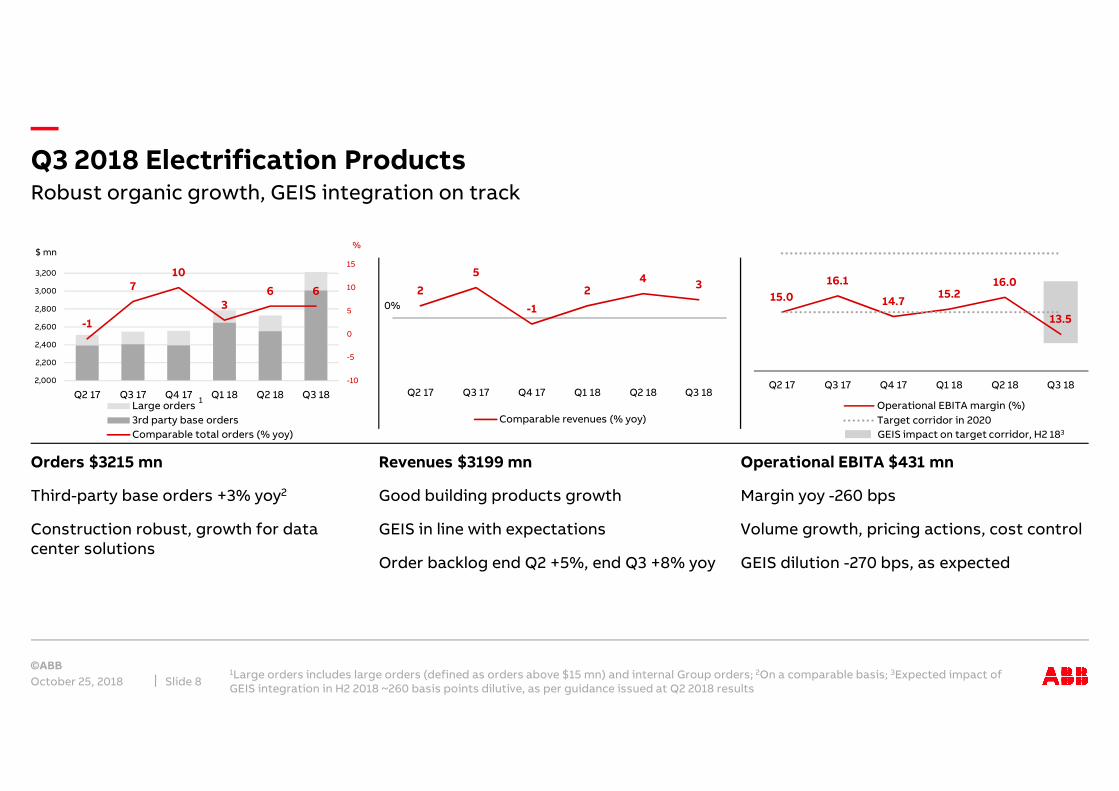
—Q3 2018 Electrification Products
October 25, 20181Large orders includes large orders (defined as orders above $15 mn) and internal Group orders; 2On a comparable basis; 3Expected impact of GEIS integration in H2 2018 ~260 basis points dilutive, as per guidance issued at Q2 2018 results
Slide 8
Robust organic growth, GEIS integration on track
Orders $3215 mn
Third-party base orders +3% yoy2
Construction robust, growth for data center solutions
Revenues $3199 mn
Good building products growth
GEIS in line with expectations
Order backlog end Q2 +5%, end Q3 +8% yoy
Operational EBITA $431 mn
Margin yoy -260 bps
Volume growth, pricing actions, cost control
GEIS dilution -270 bps, as expected
%$ mn
0%
1
-1
710
36 6
-10
-5
0
5
10
15
2,000
2,200
2,400
2,600
2,800
3,000
3,200
Q2 17 Q3 17 Q4 17 Q1 18 Q2 18 Q3 18Large orders
3rd party base orders
Comparable total orders (% yoy)
2
5
-1
24
3
Q2 17 Q3 17 Q4 17 Q1 18 Q2 18 Q3 18
Comparable revenues (% yoy)
GEIS impact on target corridor, H2 183
15.0
16.1
14.715.2
16.0
13.5
Q2 17 Q3 17 Q4 17 Q1 18 Q2 18 Q3 18
Operational EBITA margin (%)
Target corridor in 2020
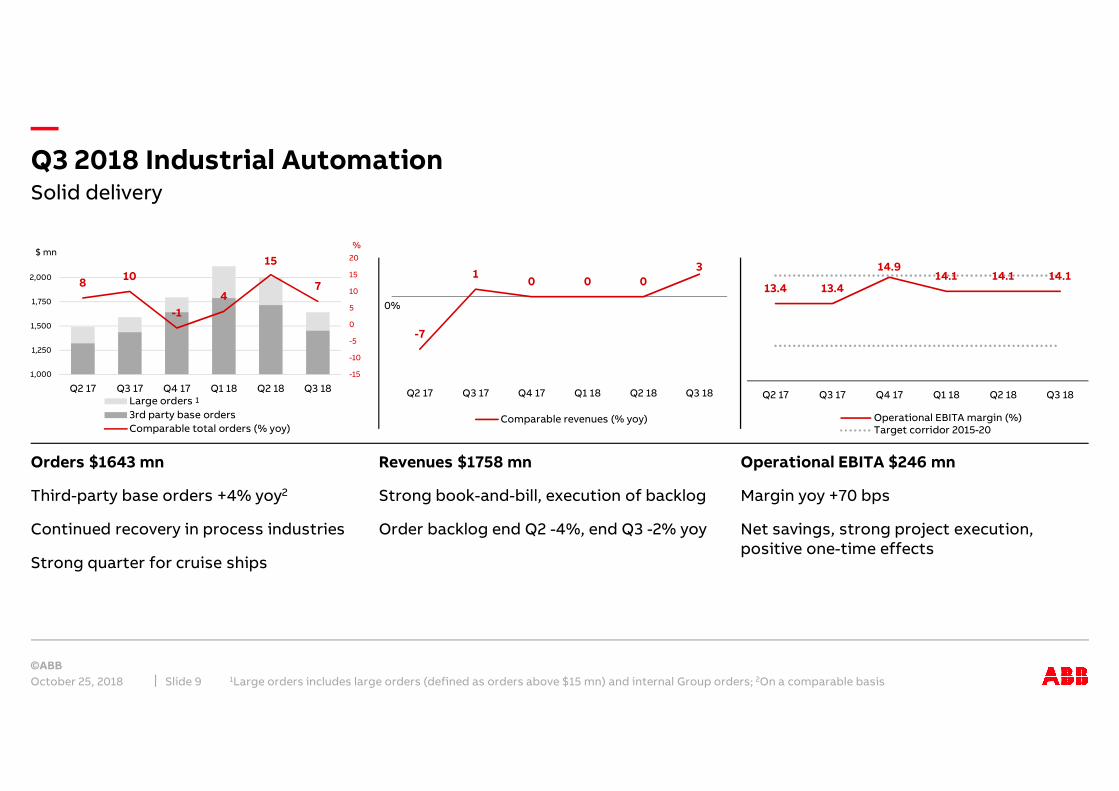
—Q3 2018 Industrial Automation
October 25, 2018 1Large orders includes large orders (defined as orders above $15 mn) and internal Group orders; 2On a comparable basisSlide 9
Solid delivery
Orders $1643 mn
Third-party base orders +4% yoy2
Continued recovery in process industries
Strong quarter for cruise ships
Revenues $1758 mn
Strong book-and-bill, execution of backlog
Order backlog end Q2 -4%, end Q3 -2% yoy
Operational EBITA $246 mn
Margin yoy +70 bps
Net savings, strong project execution, positive one-time effects
%$ mn
0%
1
810
-1
4
15
7
-15
-10
-5
0
5
10
15
20
1,000
1,250
1,500
1,750
2,000
Q2 17 Q3 17 Q4 17 Q1 18 Q2 18 Q3 18Large orders
3rd party base orders
Comparable total orders (% yoy)
-7
10 0 0
3
Q2 17 Q3 17 Q4 17 Q1 18 Q2 18 Q3 18
Comparable revenues (% yoy)
13.4 13.4
14.914.1 14.1 14.1
Q2 17 Q3 17 Q4 17 Q1 18 Q2 18 Q3 18
Operational EBITA margin (%)Target corridor 2015-20
—
5
86
8 87
Q2 17 Q3 17 Q4 17 Q1 18 Q2 18 Q3 18
Comparable revenues (% yoy)
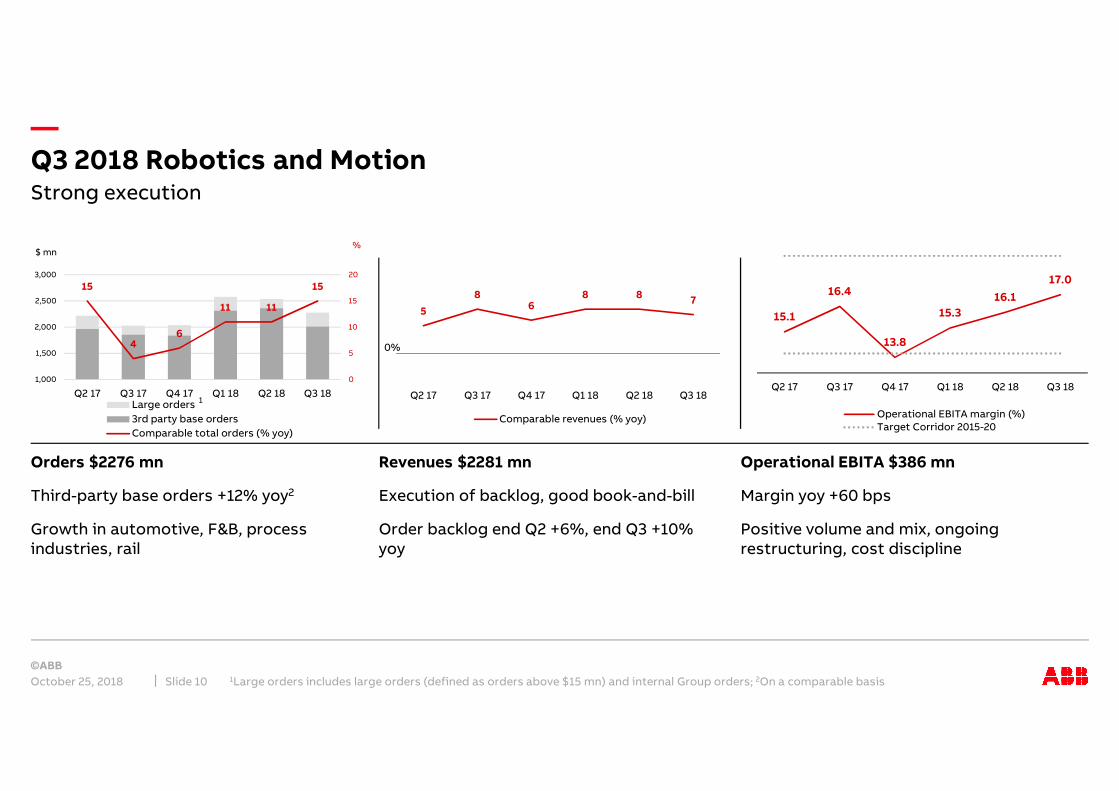
Q3 2018 Robotics and Motion
October 25, 2018 1Large orders includes large orders (defined as orders above $15 mn) and internal Group orders; 2On a comparable basisSlide 10
Strong execution
Orders $2276 mn
Third-party base orders +12% yoy2
Growth in automotive, F&B, process industries, rail
Revenues $2281 mn
Execution of backlog, good book-and-bill
Order backlog end Q2 +6%, end Q3 +10% yoy
Operational EBITA $386 mn
Margin yoy +60 bps
Positive volume and mix, ongoing restructuring, cost discipline
%$ mn
0%
1
15
46
11 11
15
0
5
10
15
20
1,000
1,500
2,000
2,500
3,000
Q2 17 Q3 17 Q4 17 Q1 18 Q2 18 Q3 18Large orders
3rd party base orders
Comparable total orders (% yoy)
15.1
16.4
13.8
15.3
16.1
17.0
Q2 17 Q3 17 Q4 17 Q1 18 Q2 18 Q3 18
Operational EBITA margin (%)Target Corridor 2015-20
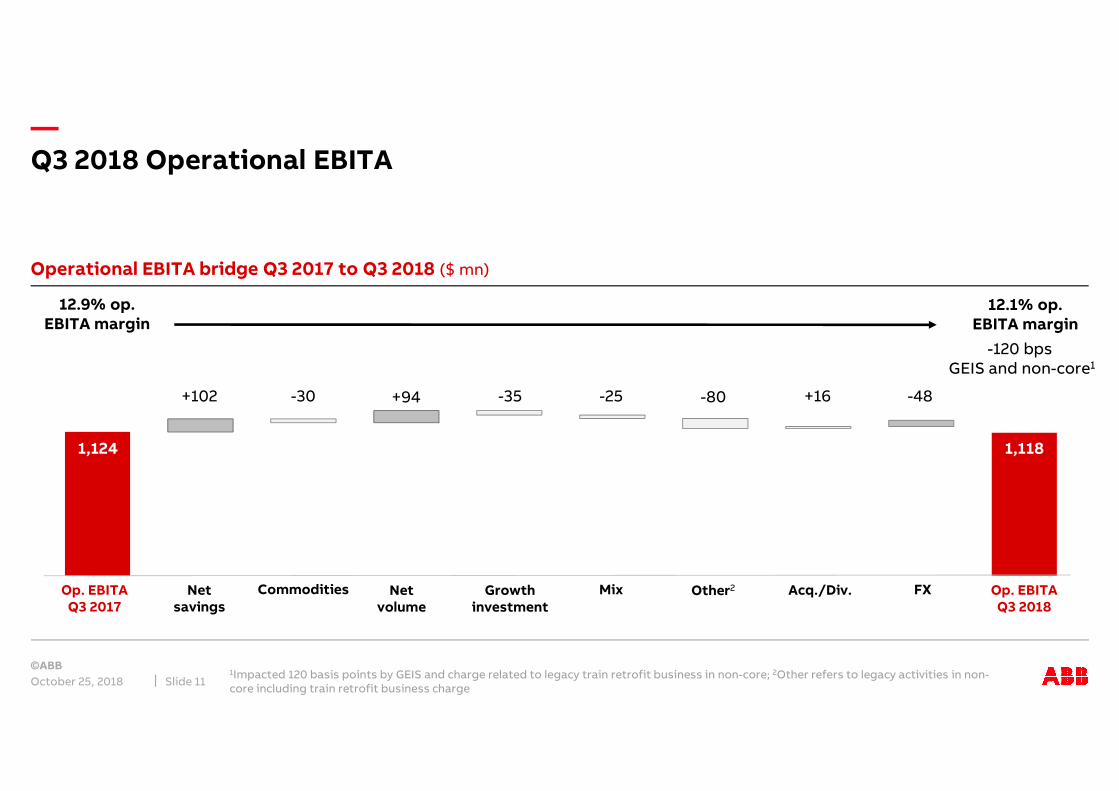
—Q3 2018 Operational EBITA
October 25, 20181Impacted 120 basis points by GEIS and charge related to legacy train retrofit business in non-core; 2Other refers to legacy activities in non-core including train retrofit business charge
Slide 11
Operational EBITA bridge Q3 2017 to Q3 2018 ($ mn)
12.9% op. EBITA margin
12.1% op. EBITA margin
Netsavings
Commodities Growthinvestment
FXOp. EBITAQ3 2017
-30 +16-35+102 -25
1,124
Mix Acq./Div.
-48
Net volume
+94
Op. EBITAQ3 2018
-80
Other2
1,118
-120 bps GEIS and non-core1

—Other financial items
October 25, 2018 Slide 12
$ mn unless otherwise stated 9M 18A FY 18framework
Corporate & Other Operational EBITA (455) ~(600)
Key non-operating items:
PPA-related amortization (225) ~(315)
Normal restructuring (61) ~(150)
Acquisition-related expenses and integration costs
(152) ~(182)
$ mn unless otherwise stated 9M 18A FY 18 framework
Net finance expense (180) (250)
Effective tax rate 27% 27%
Cash flow from operating activities 1,057 Solid
Capex (674) ~(1,000)
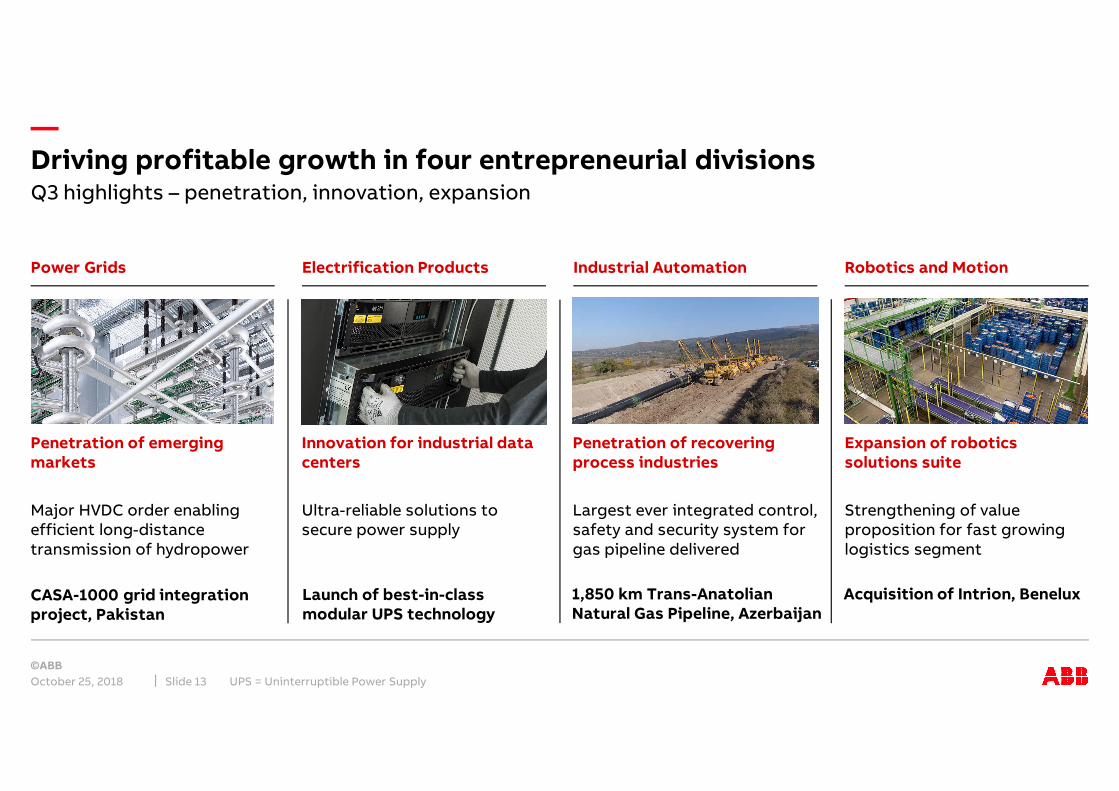
—Driving profitable growth in four entrepreneurial divisions
October 25, 2018 UPS = Uninterruptible Power SupplySlide 13
Q3 highlights – penetration, innovation, expansion
Expansion of robotics solutions suite
Acquisition of Intrion, Benelux
Penetration of recovering process industries
1,850 km Trans-Anatolian Natural Gas Pipeline, Azerbaijan
Power Grids Electrification Products Industrial Automation Robotics and Motion
Strengthening of value proposition for fast growing logistics segment
Largest ever integrated control, safety and security system for gas pipeline delivered
Penetration of emerging markets
Innovation for industrial data centers
CASA-1000 grid integration project, Pakistan
Launch of best-in-class modular UPS technology
Major HVDC order enabling efficient long-distance transmission of hydropower
Ultra-reliable solutions to secure power supply
—
Electrical Power High-end robotics Next Gen IT & AI
New EVs & equipment Rail transportation Maritime engineering
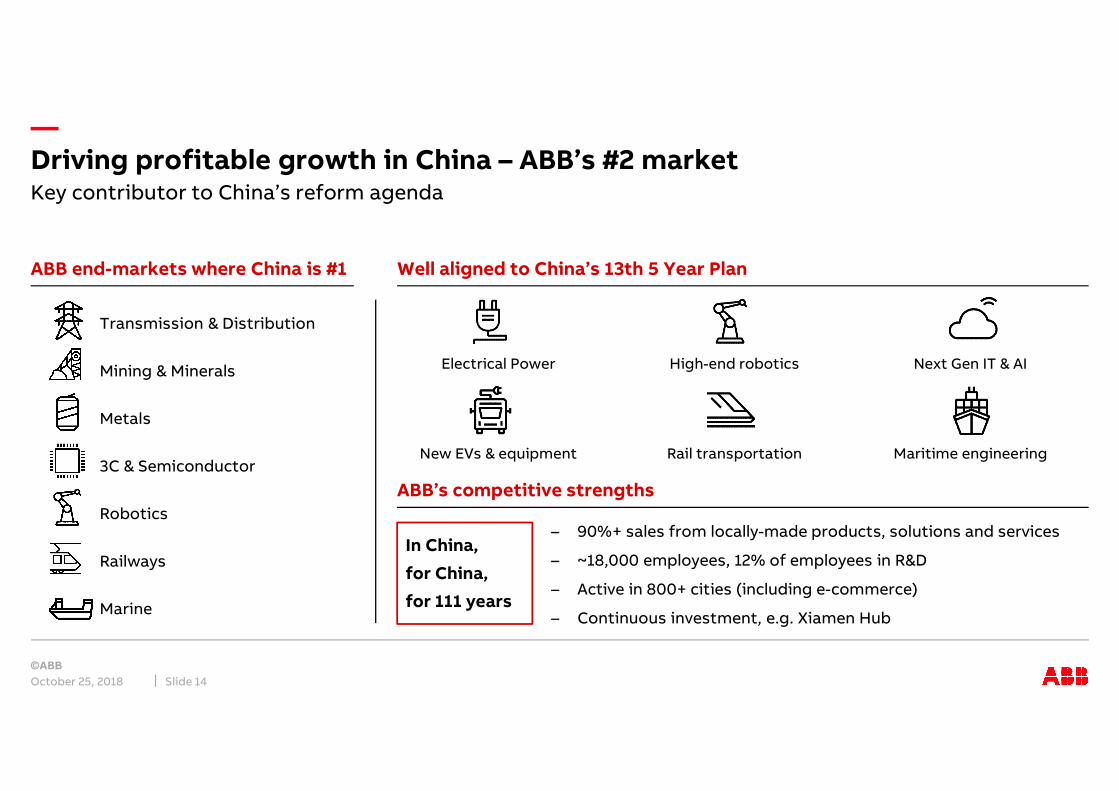
Driving profitable growth in China – ABB’s #2 market
October 25, 2018 Slide 14
Well aligned to China’s 13th 5 Year Plan
Key contributor to China’s reform agenda
ABB end-markets where China is #1
Transmission & Distribution
Mining & Minerals
Metals
3C & Semiconductor
Robotics
Railways
Marine
ABB’s competitive strengths
In China,
for China,
for 111 years
– 90%+ sales from locally-made products, solutions and services
– ~18,000 employees, 12% of employees in R&D
– Active in 800+ cities (including e-commerce)
– Continuous investment, e.g. Xiamen Hub
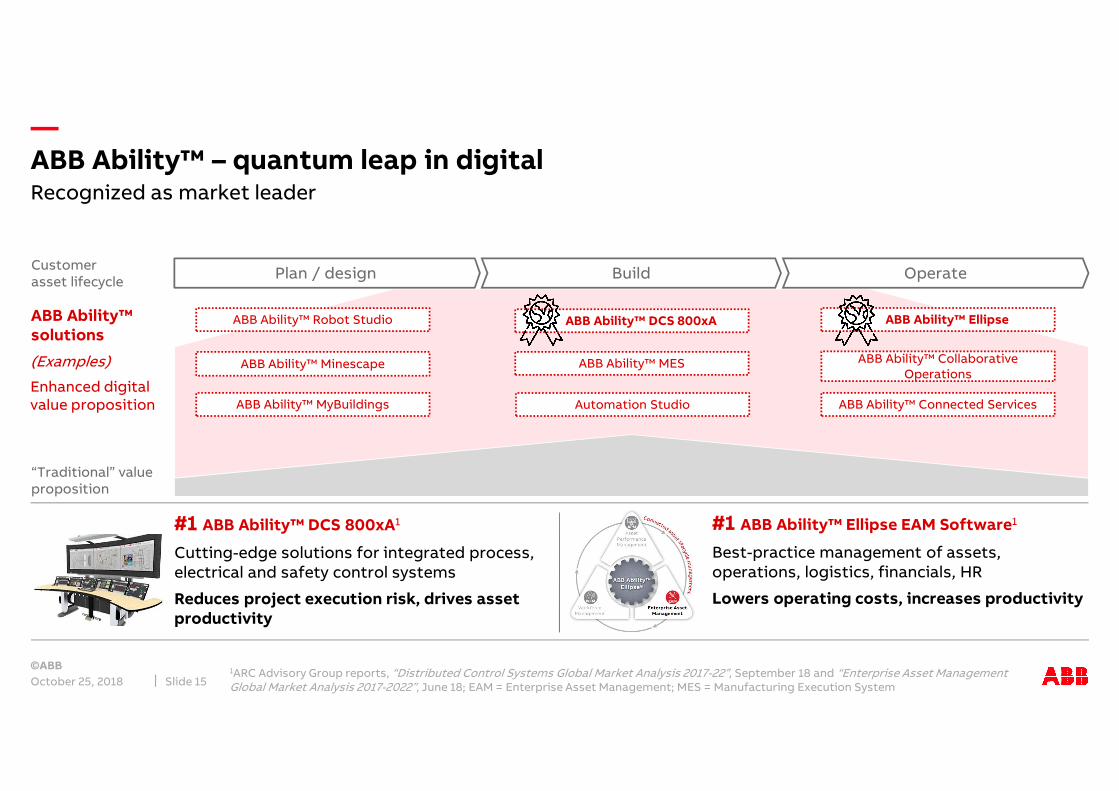
—ABB Ability™ – quantum leap in digital
October 25, 2018 Slide 15
Customerasset lifecycle
Plan / design Build Operate
“Traditional” value proposition
ABB Ability™ EllipseABB Ability™ DCS 800xA
1ARC Advisory Group reports, “Distributed Control Systems Global Market Analysis 2017-22”, September 18 and “Enterprise Asset Management Global Market Analysis 2017-2022”, June 18; EAM = Enterprise Asset Management; MES = Manufacturing Execution System
ABB Ability™ MyBuildings
ABB Ability™ Minescape ABB Ability™ MES ABB Ability™ Collaborative Operations
ABB Ability™ Connected Services
Recognized as market leader
Automation Studio
ABB Ability™ Robot Studio
(Examples)
Enhanced digital value proposition
ABB Ability™ solutions
#1 ABB Ability™ DCS 800xA1
Cutting-edge solutions for integrated process, electrical and safety control systems
Reduces project execution risk, drives asset productivity
#1 ABB Ability™ Ellipse EAM Software1
Best-practice management of assets, operations, logistics, financials, HR
Lowers operating costs, increases productivity
—ABB better positioned in a better market
October 25, 2018 Slide 16
Summary
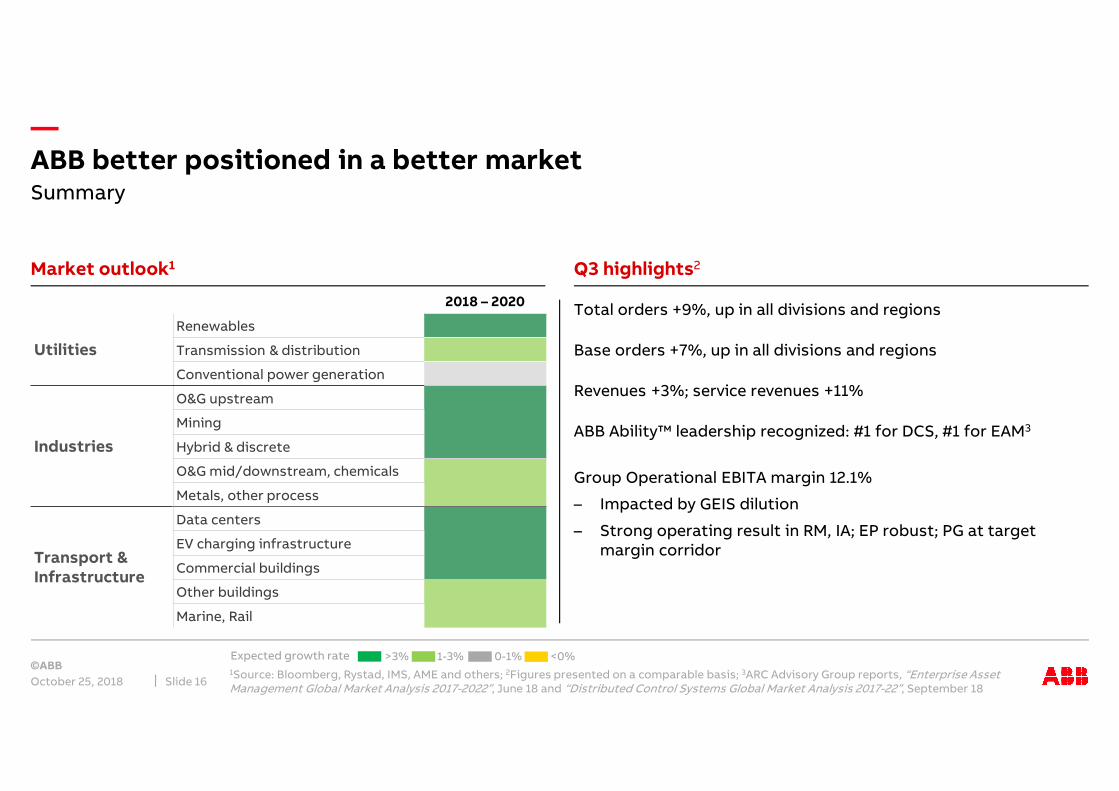
Market outlook1 Q3 highlights2
Total orders +9%, up in all divisions and regions
Base orders +7%, up in all divisions and regions
Revenues +3%; service revenues +11%
ABB Ability™ leadership recognized: #1 for DCS, #1 for EAM3
Group Operational EBITA margin 12.1%
– Impacted by GEIS dilution
– Strong operating result in RM, IA; EP robust; PG at target margin corridor
1Source: Bloomberg, Rystad, IMS, AME and others; 2Figures presented on a comparable basis; 3ARC Advisory Group reports, “Enterprise Asset Management Global Market Analysis 2017-2022”, June 18 and “Distributed Control Systems Global Market Analysis 2017-22”, September 18
>3% 1-3% <0%0-1%Expected growth rate
2018 – 2020
Utilities
Renewables
Transmission & distribution
Conventional power generation
Industries
O&G upstream
Mining
Hybrid & discrete
O&G mid/downstream, chemicals
Metals, other process
Transport & Infrastructure
Data centers
EV charging infrastructure
Commercial buildings
Other buildings
Marine, Rail

—Key figures Q3 2018
October 25, 20181Calculated on earnings per share before rounding 2Operational EPS growth rate is in constant currency (2014 foreign exchange rates)
Slide 18
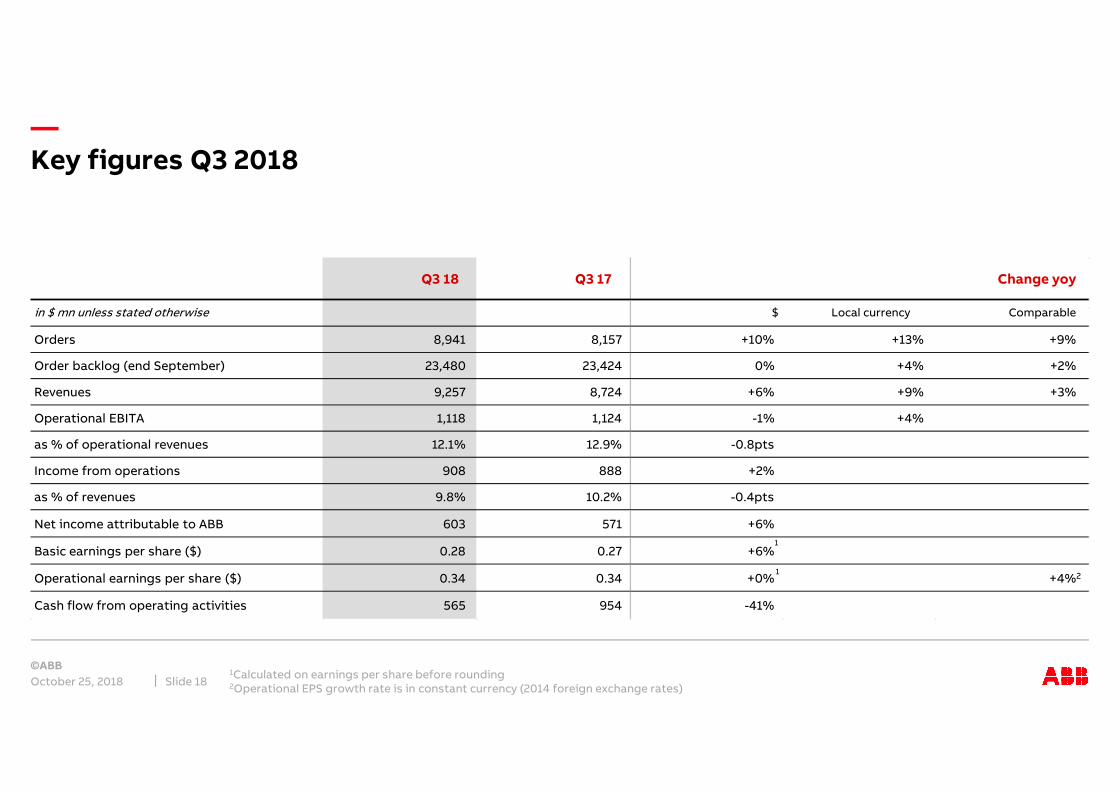
Q3 18 Q3 17
Orders 8,941 8,157 +10% +13% +9%
Order backlog (end September) 23,480 23,424 0% +4% +2%
Revenues 9,257 8,724 +6% +9% +3%
Operational EBITA 1,118 1,124 -1% +4%
as % of operational revenues 12.1% 12.9% -0.8pts
Income from operations 908 888 +2%
as % of revenues 9.8% 10.2% -0.4pts
Net income attributable to ABB 603 571 +6%
Basic earnings per share ($) 0.28 0.27 +6%
Operational earnings per share ($) 0.34 0.34 +0% +4%2
Cash flow from operating activities 565 954 -41%
Change yoy
$ Local currency Comparablein $ mn unless stated otherwise
1
1
—Total and base orders
October 25, 2018 Slide 19
By division
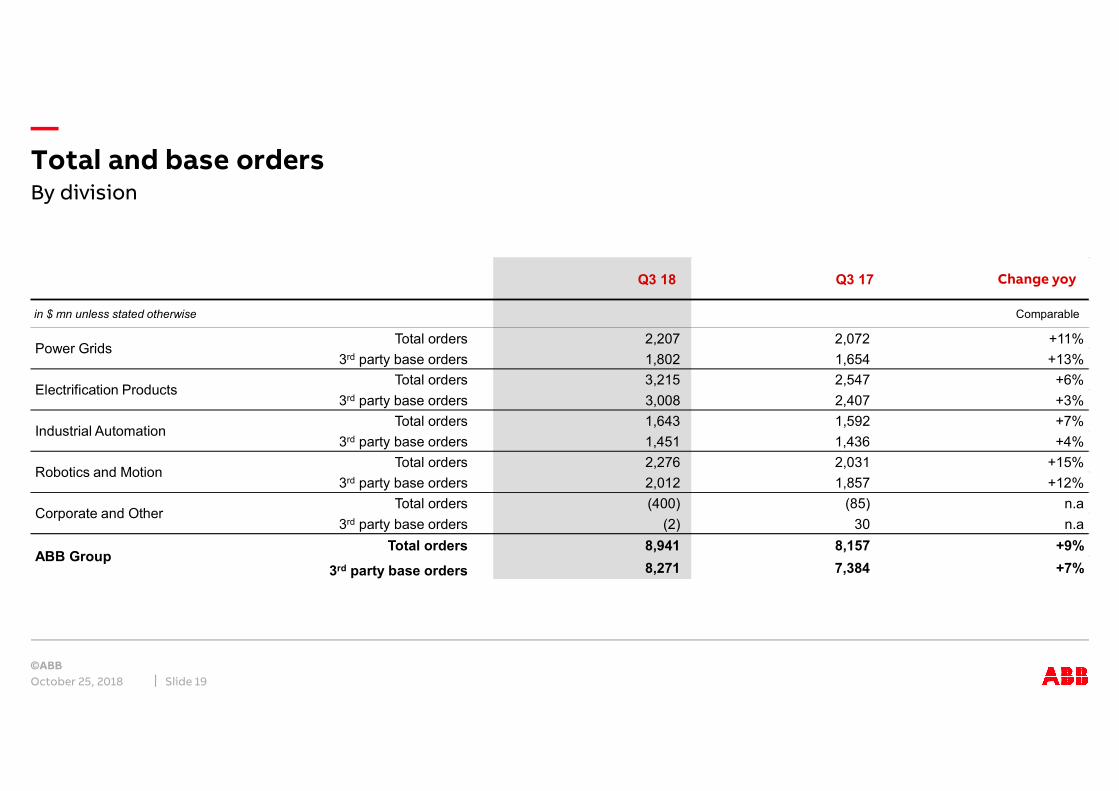
Q3 18 Q3 17
in $ mn unless stated otherwise Comparable
Total orders 2,207 2,072 +11%
3rd party base orders 1,802 1,654 +13%
Total orders 3,215 2,547 +6%
3rd party base orders 3,008 2,407 +3%
Total orders 1,643 1,592 +7%
3rd party base orders 1,451 1,436 +4%
Total orders 2,276 2,031 +15%
3rd party base orders 2,012 1,857 +12%
Total orders (400) (85) n.a
3rd party base orders (2) 30 n.a
Total orders 8,941 8,157 +9%
3rd party base orders 8,271 7,384 +7%
Power Grids
Industrial Automation
Robotics and Motion
ABB Group
Electrification Products
Corporate and Other
Change yoy
—Total and base orders
October 25, 2018 1Change on a comparable basis; 2Defined as orders below $15 mn; 3AMEA: Asia, Middle East and AfricaSlide 20
By region
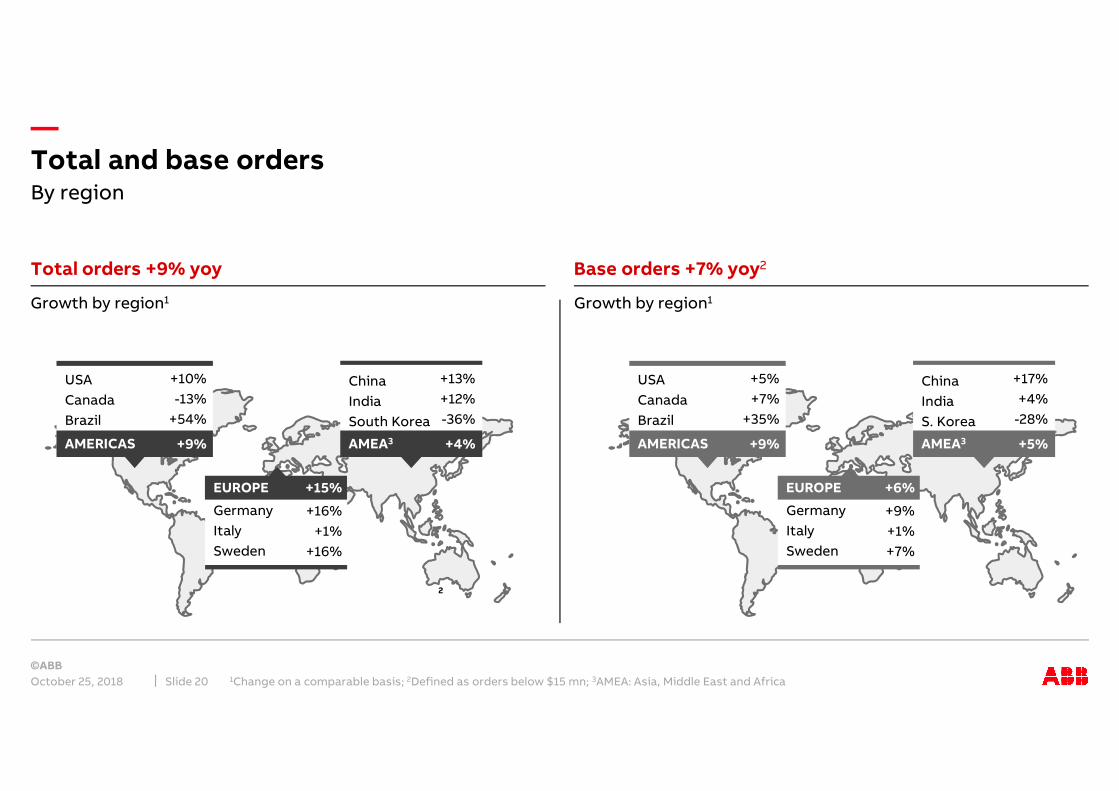
Total orders +9% yoy Base orders +7% yoy2
Growth by region1
USA
Canada
Brazil
AMERICAS
Germany
Italy
Sweden
EUROPE
China
India
S. Korea
AMEA3
+5%
+7%
+35%
+9%
+17%
+4%
-28%
+5%
+9%
+1%
+7%
+6%
2
Growth by region1
USA
Canada
Brazil
AMERICAS
Germany
Italy
Sweden
EUROPE
China
India
South Korea
AMEA3
+10%
-13%
+54%
+9%
+13%
+12%
-36%
+4%
+16%
+1%
+16%
+15%
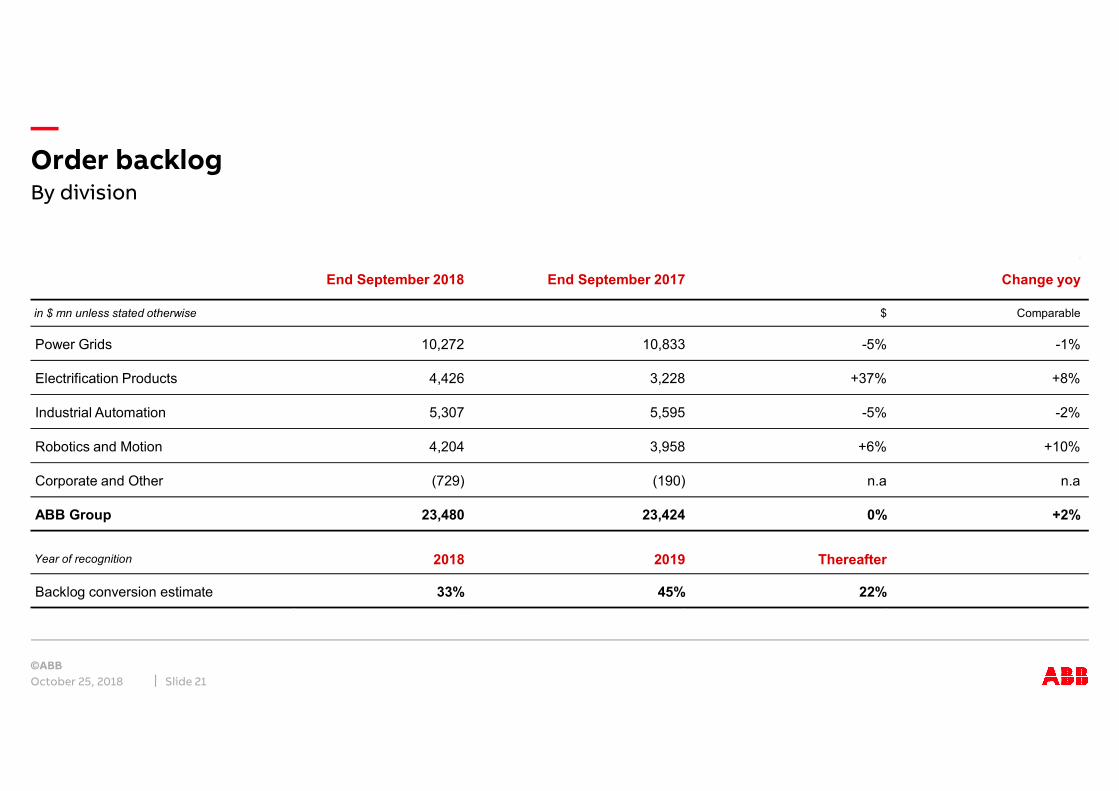
—Order backlog
October 25, 2018 Slide 21
By division
End September 2018 End September 2017
in $ mn unless stated otherwise $ Comparable
Power Grids 10,272 10,833 -5% -1%
Electrification Products 4,426 3,228 +37% +8%
Industrial Automation 5,307 5,595 -5% -2%
Robotics and Motion 4,204 3,958 +6% +10%
Corporate and Other (729) (190) n.a n.a
ABB Group 23,480 23,424 0% +2%
Year of recognition 2018 2019 Thereafter
Backlog conversion estimate 33% 45% 22%
Change yoy
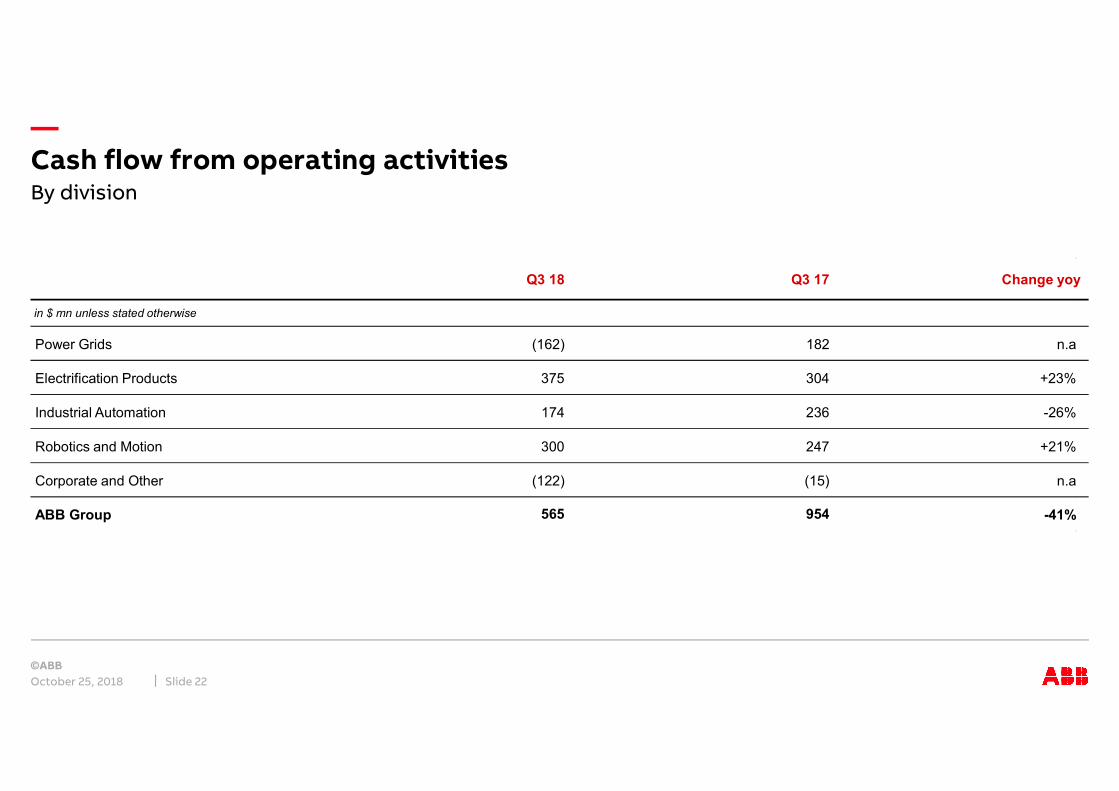
—Cash flow from operating activities
October 25, 2018 Slide 22
By division
in $ mn unless stated otherwise
Power Grids n.a
Electrification Products +23%
Industrial Automation -26%
Robotics and Motion +21%
Corporate and Other n.a
ABB Group -41%954
Q3 17
182
304
236
247
(15)
565
Q3 18
(162)
375
174
300
(122)
Change yoy
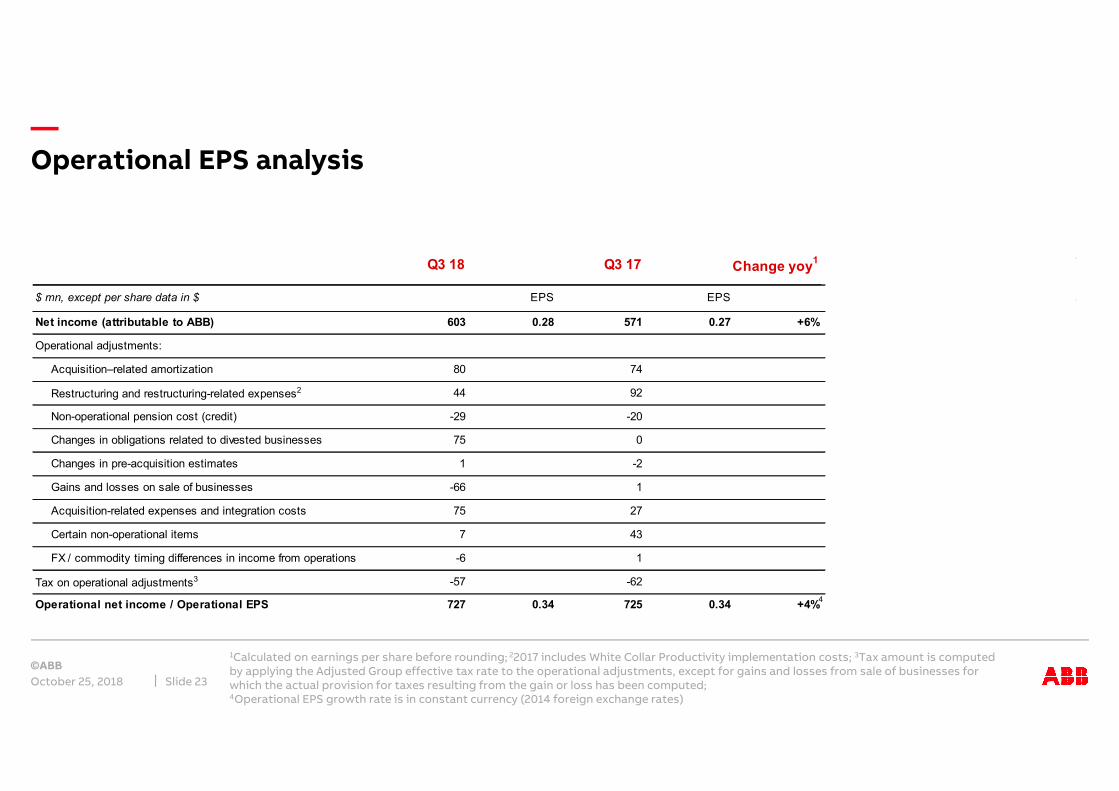
—Operational EPS analysis
October 25, 2018
1Calculated on earnings per share before rounding; 22017 includes White Collar Productivity implementation costs; 3Tax amount is computed by applying the Adjusted Group effective tax rate to the operational adjustments, except for gains and losses from sale of businesses for which the actual provision for taxes resulting from the gain or loss has been computed; 4Operational EPS growth rate is in constant currency (2014 foreign exchange rates)
Slide 23
Q3 18 Q3 17
$ mn, except per share data in $ EPS EPS
Net income (attributable to ABB) 603 0.28 571 0.27 +6%
Operational adjustments:
Acquisition–related amortization 80 74
Restructuring and restructuring-related expenses2 44 92
Non-operational pension cost (credit) -29 -20
Changes in obligations related to divested businesses 75 0
Changes in pre-acquisition estimates 1 -2
Gains and losses on sale of businesses -66 1
Acquisition-related expenses and integration costs 75 27
Certain non-operational items 7 43
FX / commodity timing differences in income from operations -6 1
Tax on operational adjustments3 -57 -62
Operational net income / Operational EPS 727 0.34 725 0.34 +4%
Change yoy1
4
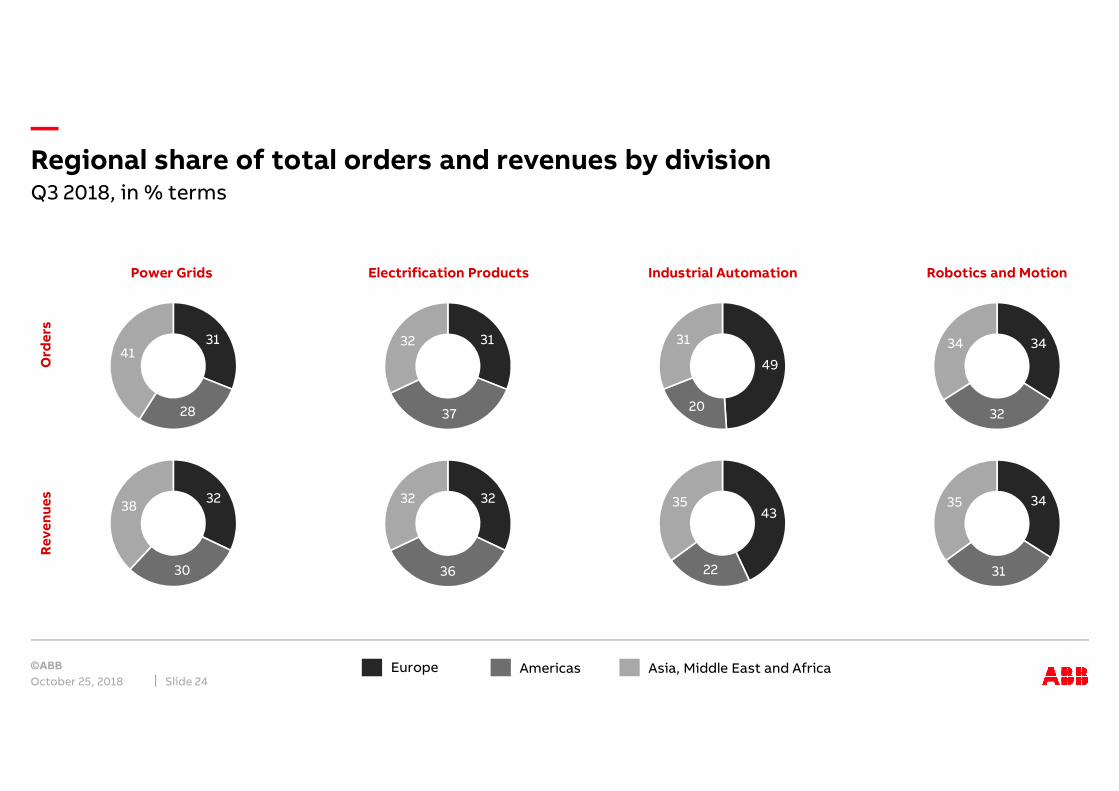
—Regional share of total orders and revenues by division
October 25, 2018 Slide 24
Q3 2018, in % terms
Europe Americas Asia, Middle East and Africa
Ord
ers
Re
ve
nu
es
Power Grids Electrification Products Industrial Automation Robotics and Motion
31
28
4131
37
32
32
30
3832
36
32
49
20
31 34
32
34
43
22
35 34
31
35
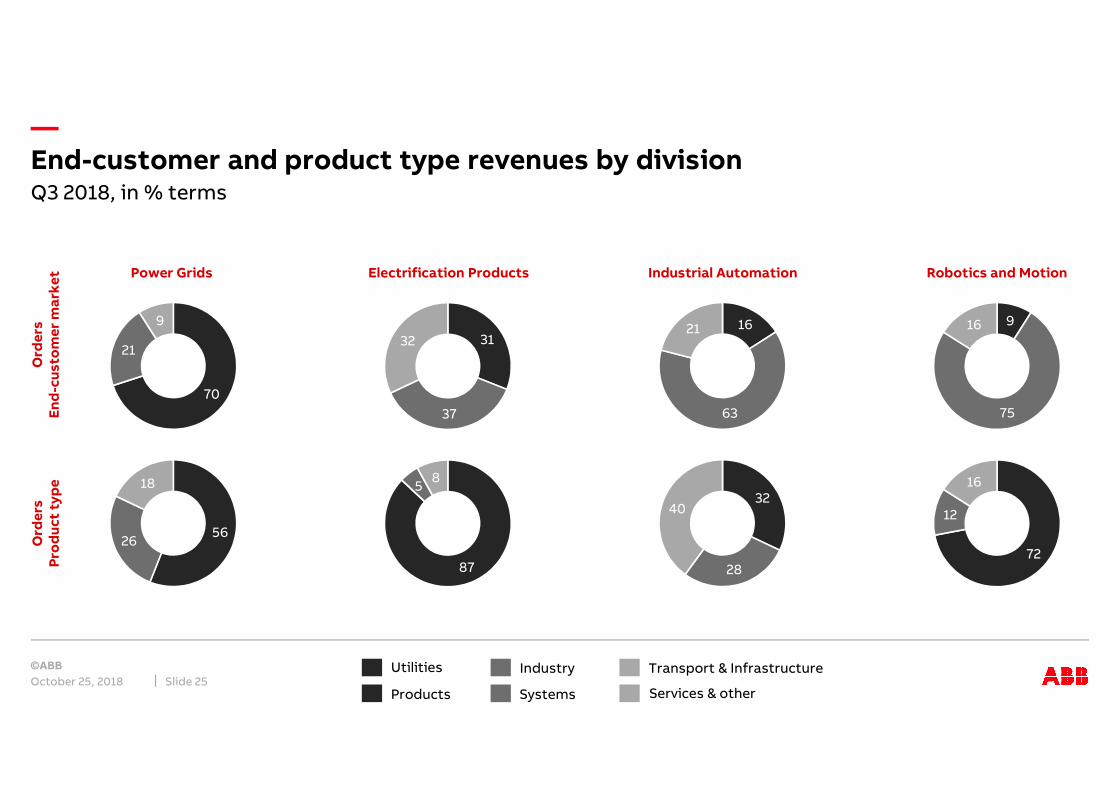
—End-customer and product type revenues by division
October 25, 2018 Slide 25
Q3 2018, in % terms
Utilities Industry Transport & Infrastructure
Products Systems Services & other
70
21
9
31
37
32
5626
18
87
58
16
63
219
75
16
32
28
40
72
12
16
Ord
ers
En
d-c
us
tom
er
ma
rke
tO
rde
rsP
rod
uc
t ty
pe
Power Grids Electrification Products Industrial Automation Robotics and Motion