Embed Size (px)
Citation preview
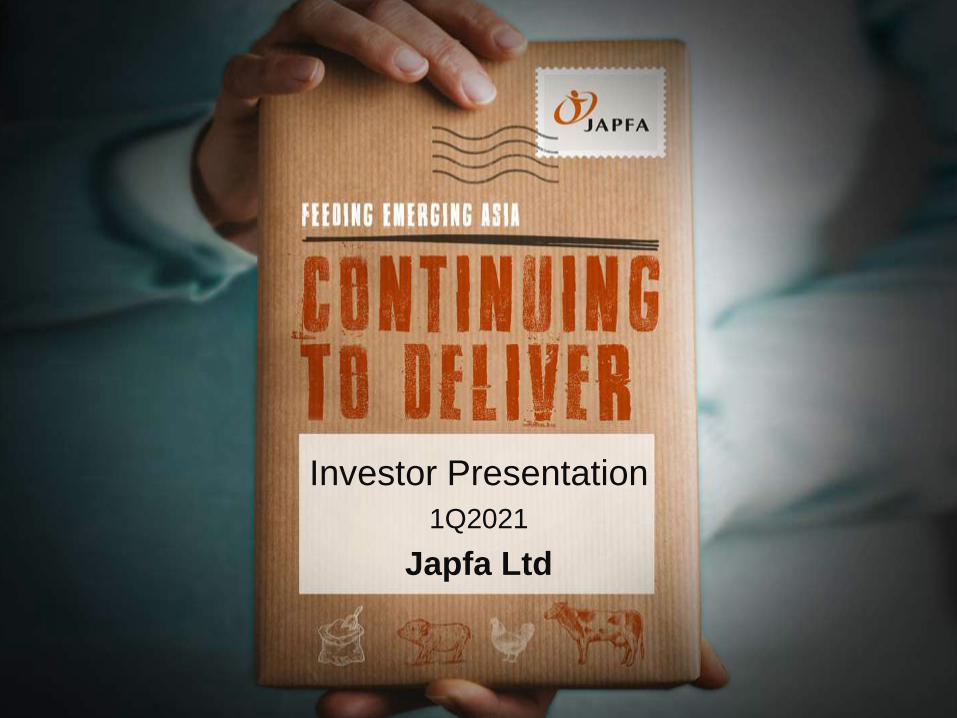
Japfa Ltd
Investor Presentation
1Q2021
Index
1
Other Financial Highlights4
1Q2021 Financial & Operational Analysis3
2 Key Highlights
1 Group Overview
Covid-19 Update6
Appendix: Segment Information and Other Information5
GROUP OVERVIEW
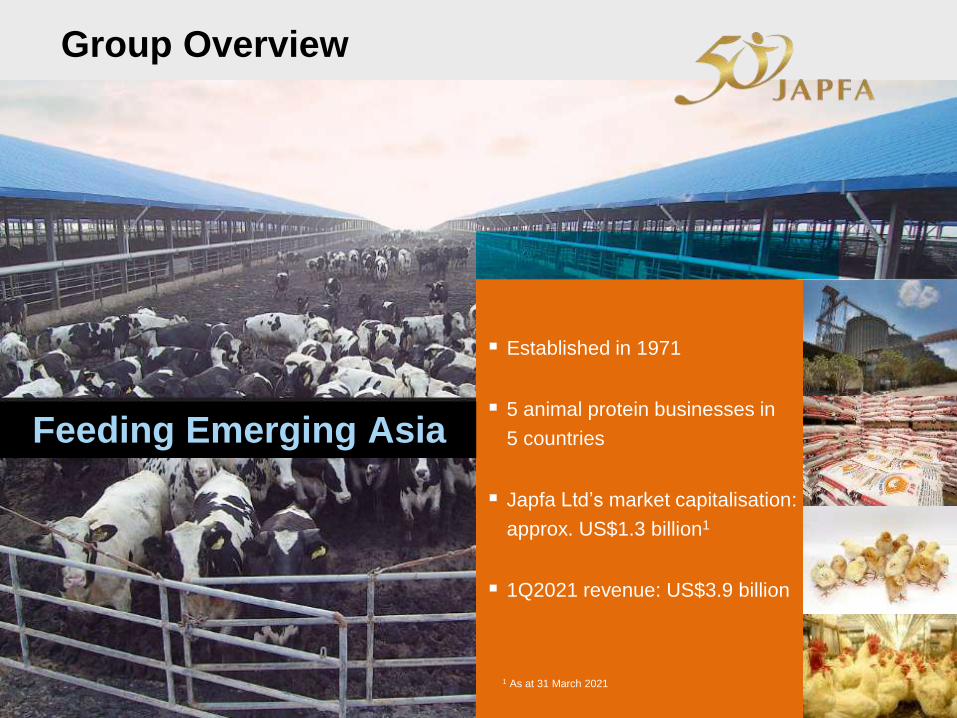
Group Overview
3
Feeding Emerging Asia
Established in 1971
5 animal protein businesses in
5 countries
Japfa Ltd’s market capitalisation:
approx. US$1.3 billion1
1Q2021 revenue: US$3.9 billion
1 As at 31 March 2021
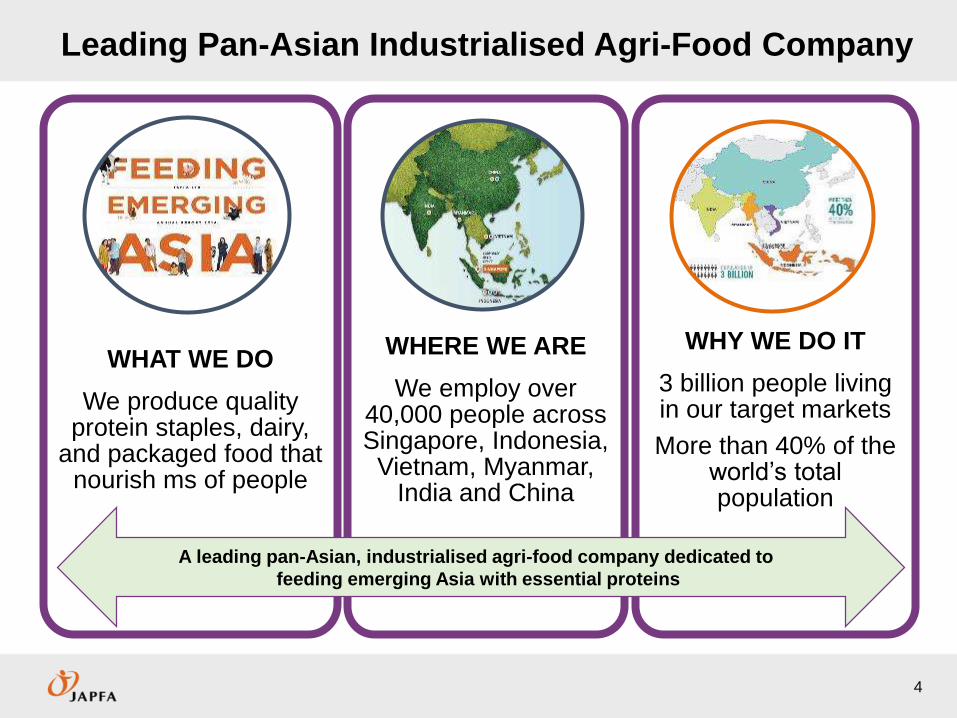
Leading Pan-Asian Industrialised Agri-Food Company
4
WHAT WE DO
We produce quality protein staples, dairy,
and packaged food that nourish ms of people
WHERE WE ARE
We employ over 40,000 people across Singapore, Indonesia,
Vietnam, Myanmar, India and China
WHY WE DO IT
3 billion people living in our target markets
More than 40% of the world’s total population
A leading pan-Asian, industrialised agri-food company dedicated to
feeding emerging Asia with essential proteins
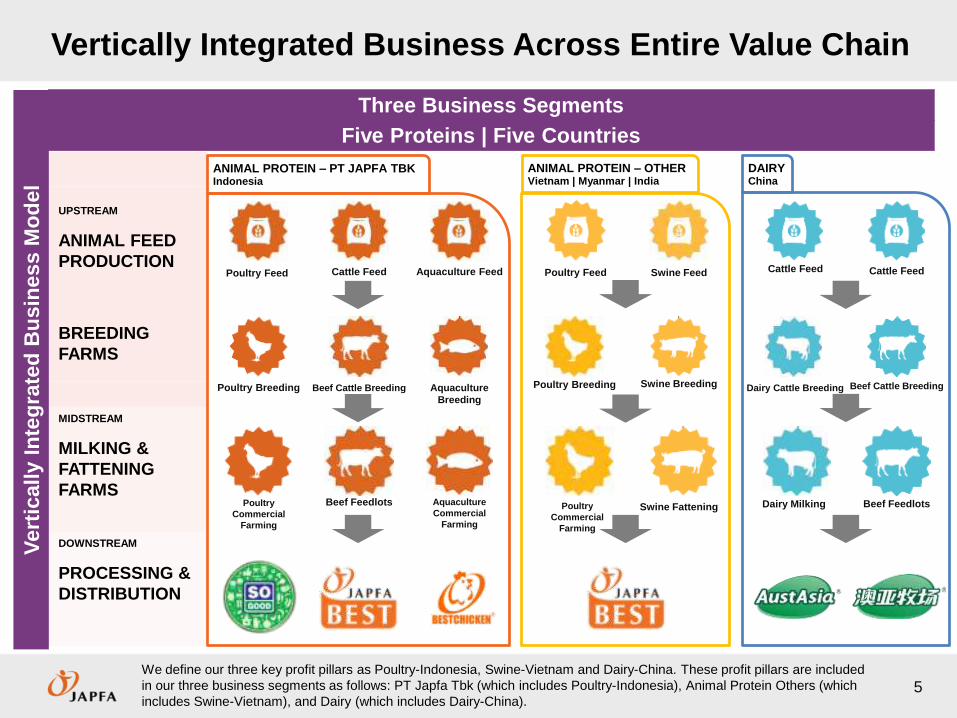
Vertically Integrated Business Across Entire Value Chain
5
UPSTREAM
ANIMAL FEED
PRODUCTION
BREEDING
FARMS
MIDSTREAM
MILKING &
FATTENING
FARMS
DOWNSTREAM
PROCESSING &
DISTRIBUTION
Three Business Segments
Vert
ically I
nte
gra
ted
Bu
sin
ess M
od
el
ANIMAL PROTEIN – PT JAPFA TBKIndonesia
ANIMAL PROTEIN – OTHERVietnam | Myanmar | India
DAIRYChina
Poultry Feed
Poultry Breeding
Poultry
Commercial
Farming
Aquaculture Feed
Aquaculture
Breeding
Aquaculture
Commercial
Farming
Cattle Feed
Beef Cattle Breeding
Beef Feedlots
Swine Feed
Swine Breeding
Swine Fattening
Poultry Feed
Poultry Breeding
Poultry
Commercial
Farming
Cattle Feed
Beef Cattle Breeding
Beef Feedlots
Cattle Feed
Dairy Cattle Breeding
Dairy Milking
We define our three key profit pillars as Poultry-Indonesia, Swine-Vietnam and Dairy-China. These profit pillars are included
in our three business segments as follows: PT Japfa Tbk (which includes Poultry-Indonesia), Animal Protein Others (which
includes Swine-Vietnam), and Dairy (which includes Dairy-China).
Five Proteins | Five Countries
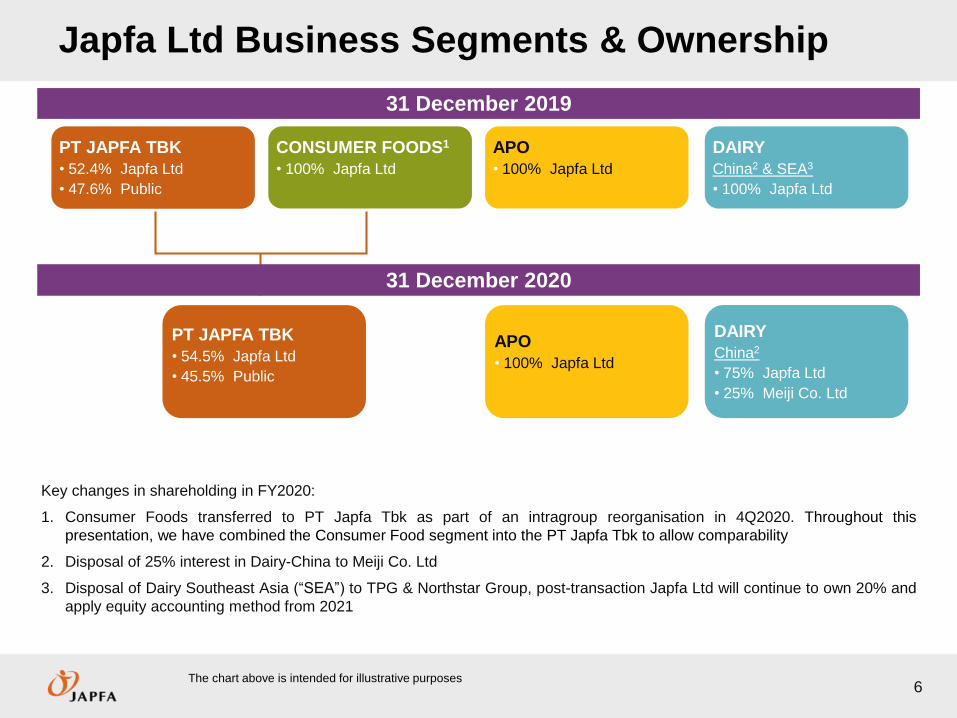
Japfa Ltd Business Segments & Ownership
6
APO
• 100% Japfa Ltd
PT JAPFA TBK
• 52.4% Japfa Ltd
• 47.6% Public
DAIRY
China2 & SEA3
• 100% Japfa Ltd
CONSUMER FOODS1
• 100% Japfa Ltd
APO
• 100% Japfa Ltd
PT JAPFA TBK
• 54.5% Japfa Ltd
• 45.5% Public
DAIRY
China2
• 75% Japfa Ltd
• 25% Meiji Co. Ltd
Key changes in shareholding in FY2020:
1. Consumer Foods transferred to PT Japfa Tbk as part of an intragroup reorganisation in 4Q2020. Throughout this
presentation, we have combined the Consumer Food segment into the PT Japfa Tbk to allow comparability
2. Disposal of 25% interest in Dairy-China to Meiji Co. Ltd
3. Disposal of Dairy Southeast Asia (“SEA”) to TPG & Northstar Group, post-transaction Japfa Ltd will continue to own 20% and
apply equity accounting method from 2021
The chart above is intended for illustrative purposes
31 December 2019
31 December 2020
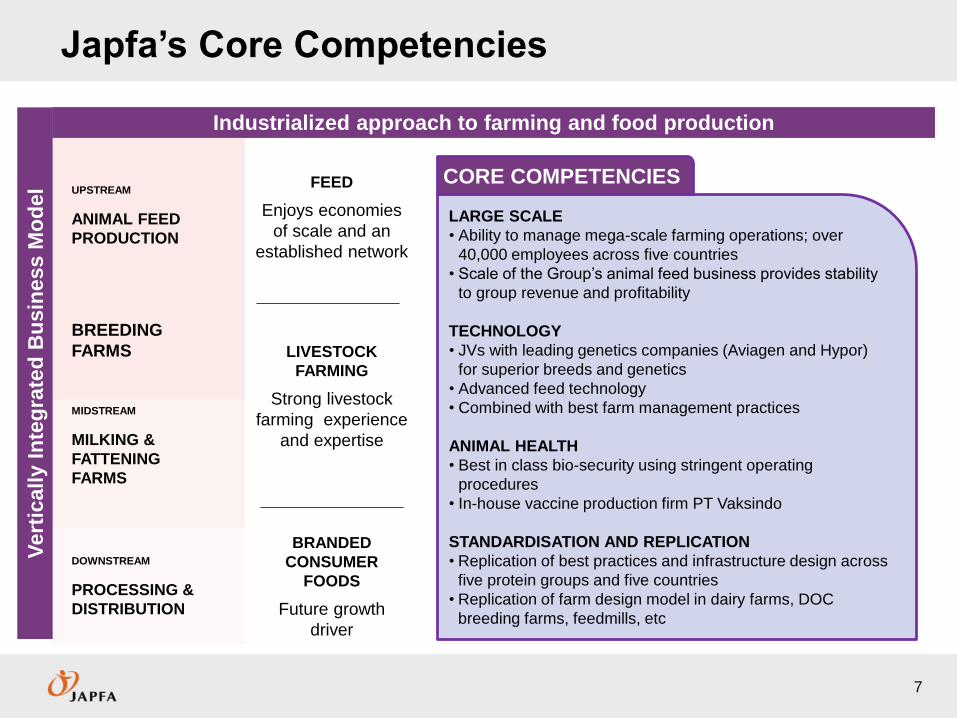
Japfa’s Core Competencies
7
UPSTREAM
ANIMAL FEED
PRODUCTION
BREEDING
FARMS
FEED
Enjoys economies
of scale and an
established network
LIVESTOCK
FARMING
Strong livestock
farming experience
and expertise
MIDSTREAM
MILKING &
FATTENING
FARMS
DOWNSTREAM
PROCESSING &
DISTRIBUTION
BRANDED
CONSUMER
FOODS
Future growth
driver
Industrialized approach to farming and food production
Vert
ically I
nte
gra
ted
Bu
sin
ess M
od
el
LARGE SCALE
• Ability to manage mega-scale farming operations; over
40,000 employees across five countries
• Scale of the Group’s animal feed business provides stability
to group revenue and profitability
TECHNOLOGY
• JVs with leading genetics companies (Aviagen and Hypor)
for superior breeds and genetics
• Advanced feed technology
• Combined with best farm management practices
ANIMAL HEALTH
• Best in class bio-security using stringent operating
procedures
• In-house vaccine production firm PT Vaksindo
STANDARDISATION AND REPLICATION
• Replication of best practices and infrastructure design across
five protein groups and five countries
• Replication of farm design model in dairy farms, DOC
breeding farms, feedmills, etc
CORE COMPETENCIES
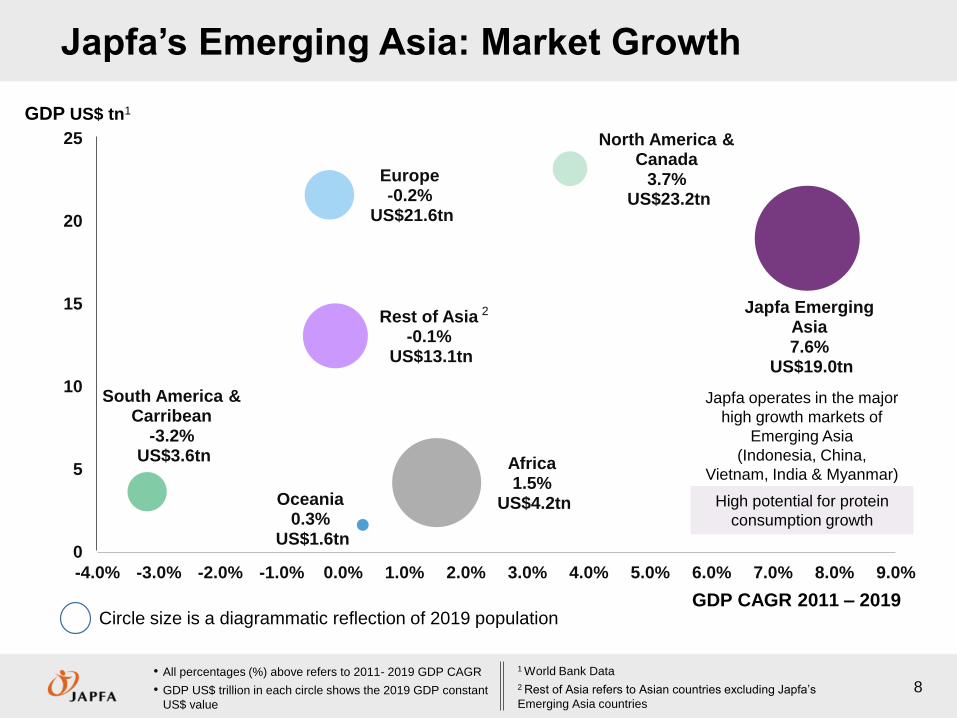
South America & Carribean
-3.2%US$3.6tn
Europe-0.2%
US$21.6tn
North America & Canada
3.7%US$23.2tn
Rest of Asia-0.1%
US$13.1tn
Oceania0.3%
US$1.6tn
Africa1.5%
US$4.2tn
Japfa Emerging Asia7.6%
US$19.0tn
0
5
10
15
20
25
-4.0% -3.0% -2.0% -1.0% 0.0% 1.0% 2.0% 3.0% 4.0% 5.0% 6.0% 7.0% 8.0% 9.0%
Japfa’s Emerging Asia: Market Growth
8
Circle size is a diagrammatic reflection of 2019 population
GDP US$ tn1
Japfa operates in the major
high growth markets of
Emerging Asia
(Indonesia, China,
Vietnam, India & Myanmar)
GDP CAGR 2011 – 2019
High potential for protein
consumption growth
• All percentages (%) above refers to 2011- 2019 GDP CAGR
• GDP US$ trillion in each circle shows the 2019 GDP constant
US$ value
1 World Bank Data
2 Rest of Asia refers to Asian countries excluding Japfa’s
Emerging Asia countries
2
KEY HIGHLIGHTS
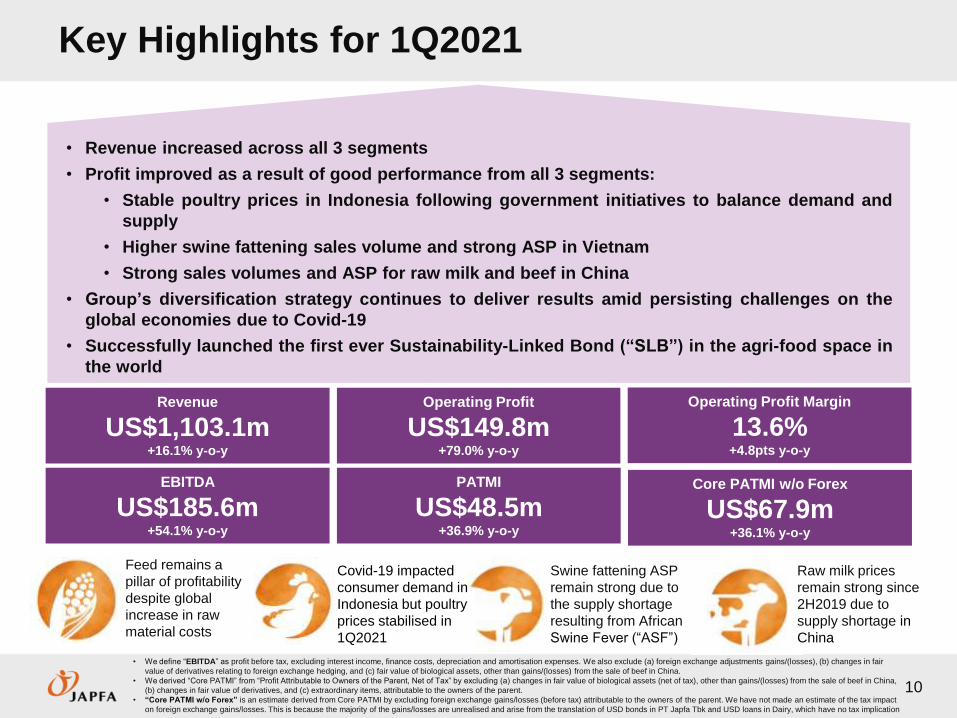
Key Highlights for 1Q2021
10
• We define “EBITDA” as profit before tax, excluding interest income, finance costs, depreciation and amortisation expenses. We also exclude (a) foreign exchange adjustments gains/(losses), (b) changes in fair
value of derivatives relating to foreign exchange hedging, and (c) fair value of biological assets, other than gains/(losses) from the sale of beef in China.
• We derived “Core PATMI” from “Profit Attributable to Owners of the Parent, Net of Tax” by excluding (a) changes in fair value of biological assets (net of tax), other than gains/(losses) from the sale of beef in China,
(b) changes in fair value of derivatives, and (c) extraordinary items, attributable to the owners of the parent.
• “Core PATMI w/o Forex” is an estimate derived from Core PATMI by excluding foreign exchange gains/losses (before tax) attributable to the owners of the parent. We have not made an estimate of the tax impact
on foreign exchange gains/losses. This is because the majority of the gains/losses are unrealised and arise from the translat ion of USD bonds in PT Japfa Tbk and USD loans in Dairy, which have no tax implication
Operating Profit
US$149.8m+79.0% y-o-y
PATMI
US$48.5m+36.9% y-o-y
Revenue
US$1,103.1m+16.1% y-o-y
Operating Profit Margin
13.6%+4.8pts y-o-y
Core PATMI w/o Forex
US$67.9m+36.1% y-o-y
EBITDA
US$185.6m+54.1% y-o-y
Feed remains a
pillar of profitability
despite global
increase in raw
material costs
Covid-19 impacted
consumer demand in
Indonesia but poultry
prices stabilised in
1Q2021
Swine fattening ASP
remain strong due to
the supply shortage
resulting from African
Swine Fever (“ASF”)
• Revenue increased across all 3 segments
• Profit improved as a result of good performance from all 3 segments:
• Stable poultry prices in Indonesia following government initiatives to balance demand and
supply
• Higher swine fattening sales volume and strong ASP in Vietnam
• Strong sales volumes and ASP for raw milk and beef in China
• Group’s diversification strategy continues to deliver results amid persisting challenges on the
global economies due to Covid-19
• Successfully launched the first ever Sustainability-Linked Bond (“SLB”) in the agri-food space in
the world
Raw milk prices
remain strong since
2H2019 due to
supply shortage in
China
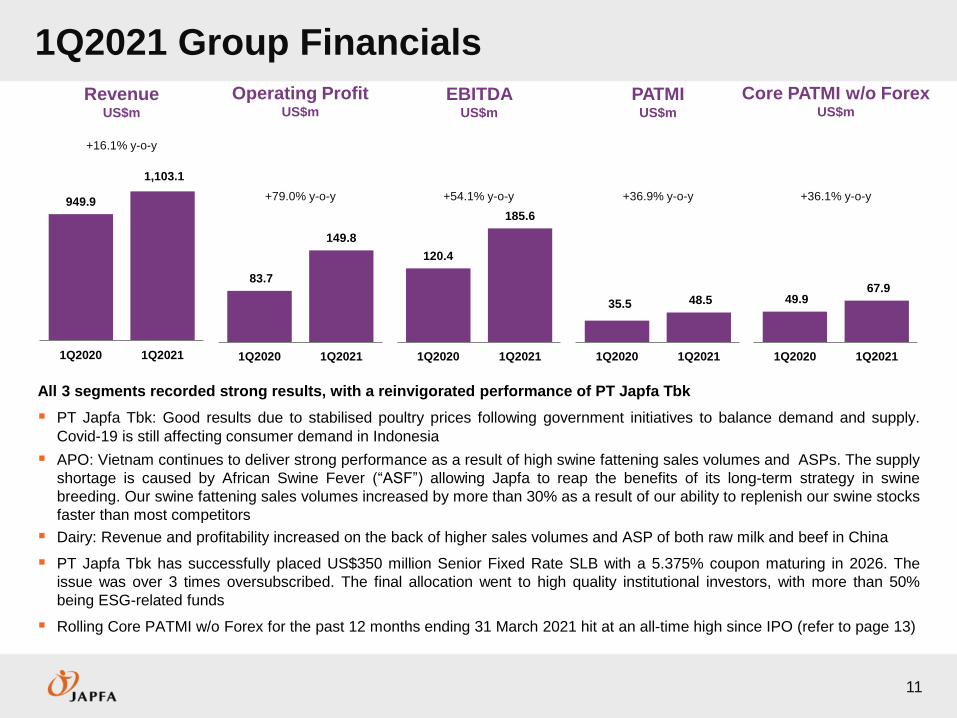
949.9
1,103.1
1Q2020 1Q2021
83.7
149.8
1Q2020 1Q2021
120.4
185.6
1Q2020 1Q2021
35.5 48.5
1Q2020 1Q2021
49.9 67.9
1Q2020 1Q2021
1Q2021 Group Financials
11
RevenueUS$m
Operating ProfitUS$m
PATMIUS$m
Core PATMI w/o ForexUS$m
EBITDAUS$m
All 3 segments recorded strong results, with a reinvigorated performance of PT Japfa Tbk
PT Japfa Tbk: Good results due to stabilised poultry prices following government initiatives to balance demand and supply.
Covid-19 is still affecting consumer demand in Indonesia
APO: Vietnam continues to deliver strong performance as a result of high swine fattening sales volumes and ASPs. The supply
shortage is caused by African Swine Fever (“ASF”) allowing Japfa to reap the benefits of its long-term strategy in swine
breeding. Our swine fattening sales volumes increased by more than 30% as a result of our ability to replenish our swine stocks
faster than most competitors
Dairy: Revenue and profitability increased on the back of higher sales volumes and ASP of both raw milk and beef in China
PT Japfa Tbk has successfully placed US$350 million Senior Fixed Rate SLB with a 5.375% coupon maturing in 2026. The
issue was over 3 times oversubscribed. The final allocation went to high quality institutional investors, with more than 50%
being ESG-related funds
Rolling Core PATMI w/o Forex for the past 12 months ending 31 March 2021 hit at an all-time high since IPO (refer to page 13)
+16.1% y-o-y
+36.9% y-o-y+79.0% y-o-y +54.1% y-o-y +36.1% y-o-y
CORE PATMI w/o FOREXROLLING BASIS
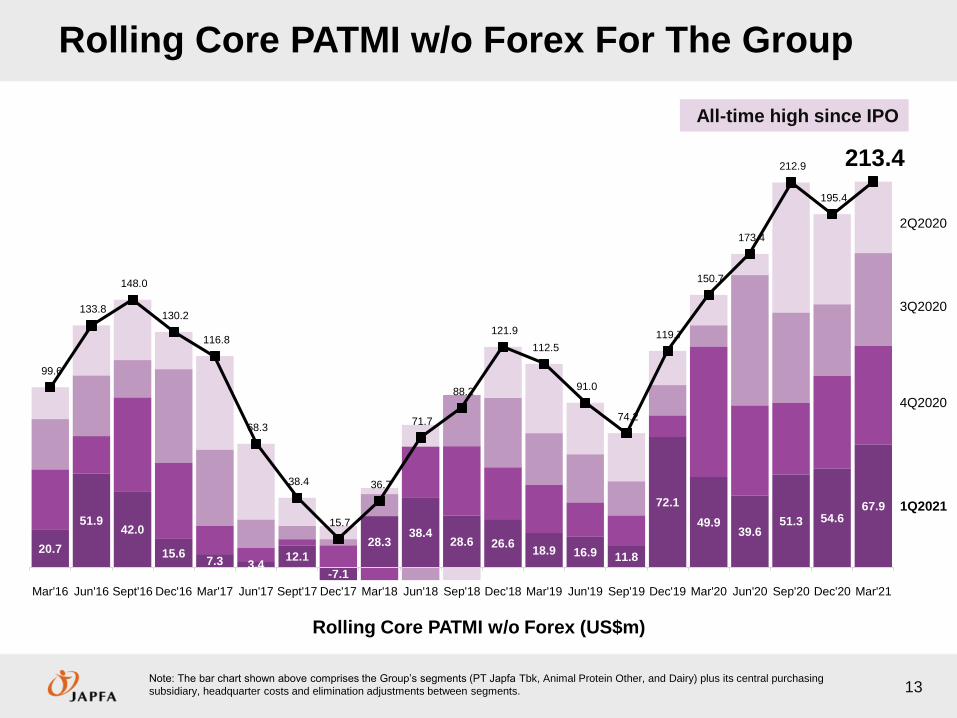
20.7
51.942.0
15.67.3 3.4
12.1
-7.1
28.338.4
28.6 26.618.9 16.9 11.8
72.1
49.939.6
51.3 54.667.9
99.6
133.8
148.0
130.2
116.8
68.3
38.4
15.7
36.7
71.7
88.2
121.9
112.5
91.0
74.2
119.7
150.7
173.4
212.9
195.4
213.4
Mar'16 Jun'16 Sept'16 Dec'16 Mar'17 Jun'17 Sept'17 Dec'17 Mar'18 Jun'18 Sep'18 Dec'18 Mar'19 Jun'19 Sep'19 Dec'19 Mar'20 Jun'20 Sep'20 Dec'20 Mar'21
Rolling Core PATMI w/o Forex For The Group
13Note: The bar chart shown above comprises the Group’s segments (PT Japfa Tbk, Animal Protein Other, and Dairy) plus its central purchasing
subsidiary, headquarter costs and elimination adjustments between segments.
4Q2020
3Q2020
2Q2020
1Q2021
All-time high since IPO
Rolling Core PATMI w/o Forex (US$m)
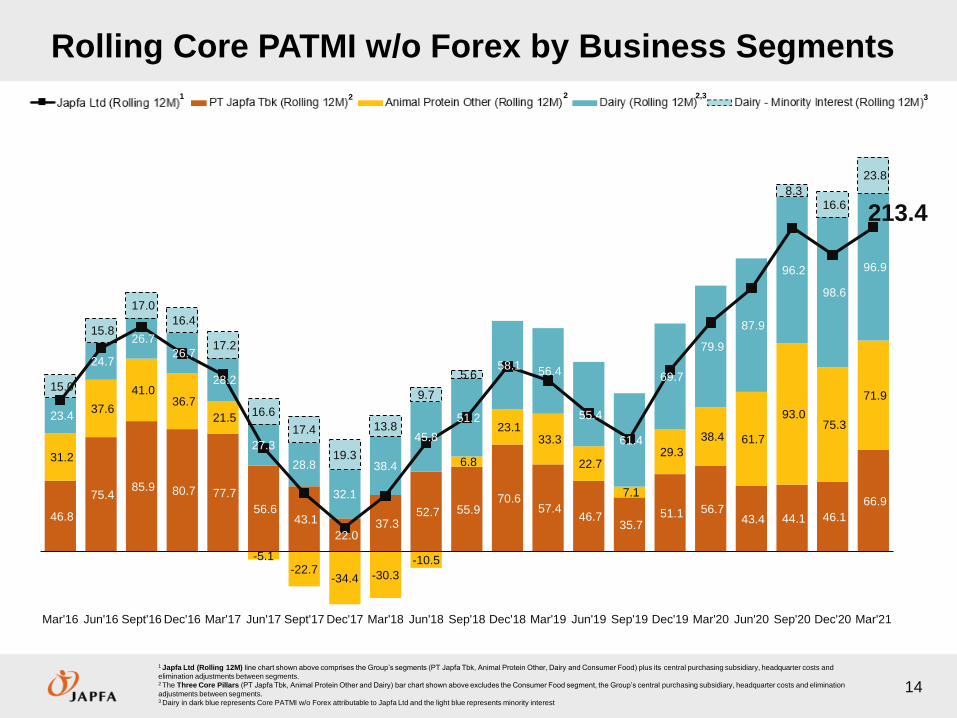
Rolling Core PATMI w/o Forex by Business Segments
14
1 Japfa Ltd (Rolling 12M) line chart shown above comprises the Group’s segments (PT Japfa Tbk, Animal Protein Other, Dairy and Consumer Food) plus its central purchasing subsidiary, headquarter costs and
elimination adjustments between segments.2 The Three Core Pillars (PT Japfa Tbk, Animal Protein Other and Dairy) bar chart shown above excludes the Consumer Food segment, the Group’s central purchasing subsidiary, headquarter costs and elimination
adjustments between segments.3 Dairy in dark blue represents Core PATMI w/o Forex attributable to Japfa Ltd and the light blue represents minority interest
1 2 2 2,3 3
46.8
75.4 85.9 80.7 77.7
56.6 43.1
22.0 37.3
52.7 55.9 70.6
57.4 46.7
35.7 51.1 56.7
43.4 44.1 46.1
66.9
31.2
37.6
41.0 36.7
21.5
-5.1-22.7
-34.4 -30.3
-10.5
6.8
23.1 33.3
22.7
7.1
29.3
38.4 61.7
93.0 75.3
71.9
23.4
24.7
26.7
26.7
28.2
27.3
28.8
32.1
38.4
45.8
51.2
58.1 56.4
55.4
61.4
69.7
79.9
87.9
96.2
98.6
96.9
15.0
15.8
17.0
16.4
17.2
16.6
17.4
19.3
13.8
9.7
5.6
8.3 16.6
23.8
213.4
Mar'16 Jun'16 Sept'16 Dec'16 Mar'17 Jun'17 Sept'17 Dec'17 Mar'18 Jun'18 Sep'18 Dec'18 Mar'19 Jun'19 Sep'19 Dec'19 Mar'20 Jun'20 Sep'20 Dec'20 Mar'21
1Q2021
FINANCIAL & OPERATIONAL
ANALYSIS
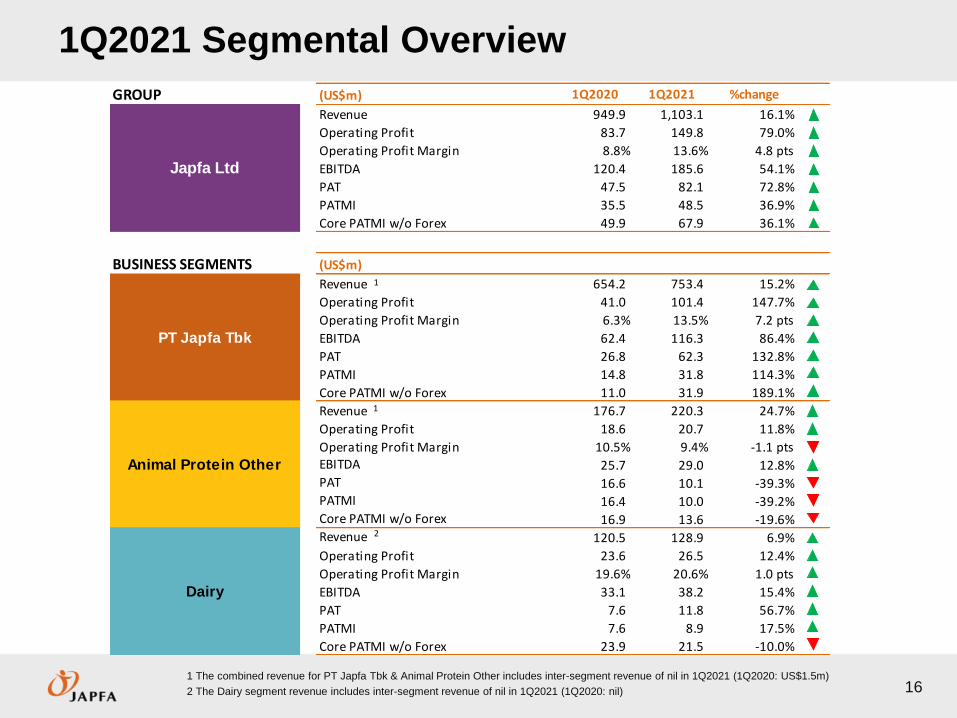
1Q2021 Segmental Overview
161 The combined revenue for PT Japfa Tbk & Animal Protein Other includes inter-segment revenue of nil in 1Q2021 (1Q2020: US$1.5m)
2 The Dairy segment revenue includes inter-segment revenue of nil in 1Q2021 (1Q2020: nil)
GROUP (US$m) 1Q2020 1Q2021 %change
Revenue 949.9 1,103.1 16.1%
Operating Profit 83.7 149.8 79.0%
Operating Profit Margin 8.8% 13.6% 4.8 pts
EBITDA 120.4 185.6 54.1%
PAT 47.5 82.1 72.8%
PATMI 35.5 48.5 36.9%
Core PATMI w/o Forex 49.9 67.9 36.1%
BUSINESS SEGMENTS (US$m)
Revenue 654.2 753.4 15.2%
Operating Profit 41.0 101.4 147.7%
Operating Profit Margin 6.3% 13.5% 7.2 pts
EBITDA 62.4 116.3 86.4%
PAT 26.8 62.3 132.8%
PATMI 14.8 31.8 114.3%
Core PATMI w/o Forex 11.0 31.9 189.1%
Revenue 176.7 220.3 24.7%
Operating Profit 18.6 20.7 11.8%
Operating Profit Margin 10.5% 9.4% -1.1 ptsEBITDA 25.7 29.0 12.8%PAT 16.6 10.1 -39.3%PATMI 16.4 10.0 -39.2%Core PATMI w/o Forex 16.9 13.6 -19.6%Revenue 120.5 128.9 6.9%
Operating Profit 23.6 26.5 12.4%
Operating Profit Margin 19.6% 20.6% 1.0 pts
EBITDA 33.1 38.2 15.4%
PAT 7.6 11.8 56.7%
PATMI 7.6 8.9 17.5%
Core PATMI w/o Forex 23.9 21.5 -10.0%
Japfa Ltd
PT Japfa Tbk
Animal Protein Other
Dairy
1
1
2
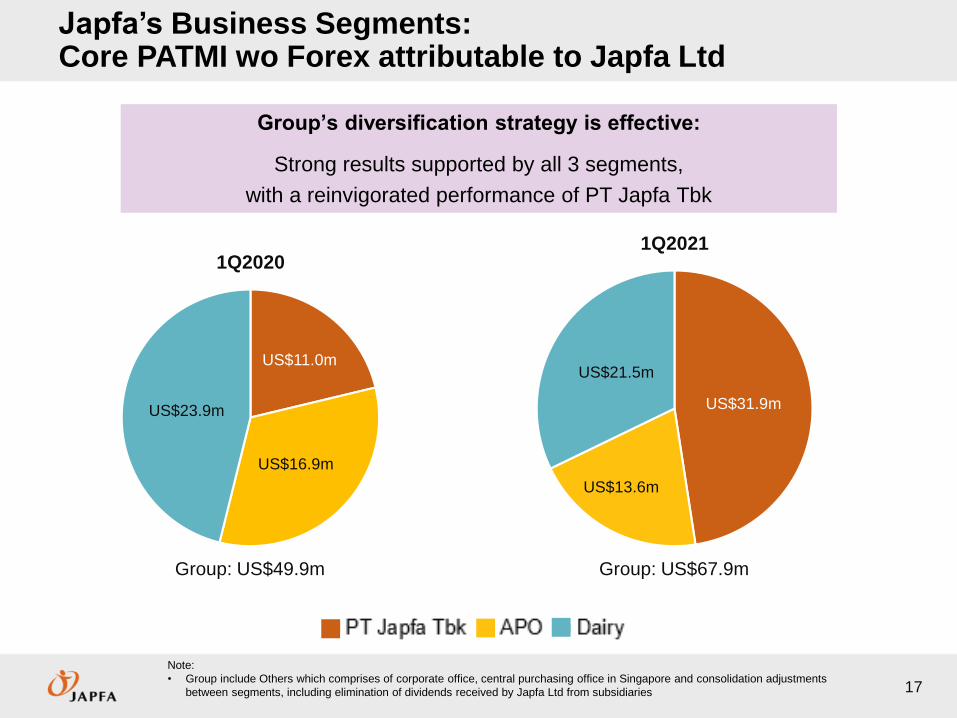
Japfa’s Business Segments: Core PATMI wo Forex attributable to Japfa Ltd
17
Note:
• Group include Others which comprises of corporate office, central purchasing office in Singapore and consolidation adjustments
between segments, including elimination of dividends received by Japfa Ltd from subsidiaries
1Q2021
Group:US$195m
Group: US$49.9m Group: US$67.9m
Group’s diversification strategy is effective:
Strong results supported by all 3 segments,
with a reinvigorated performance of PT Japfa Tbk
US$11.0m
US$16.9m
US$23.9m
1Q2020
US$31.9m
US$13.6m
US$21.5m
1Q2021
654.2
753.4
1Q2020 1Q2021
41.0
101.4
1Q2020 1Q2021
62.4
116.3
1Q2020 1Q2021
26.8
62.3
1Q2020 1Q2021
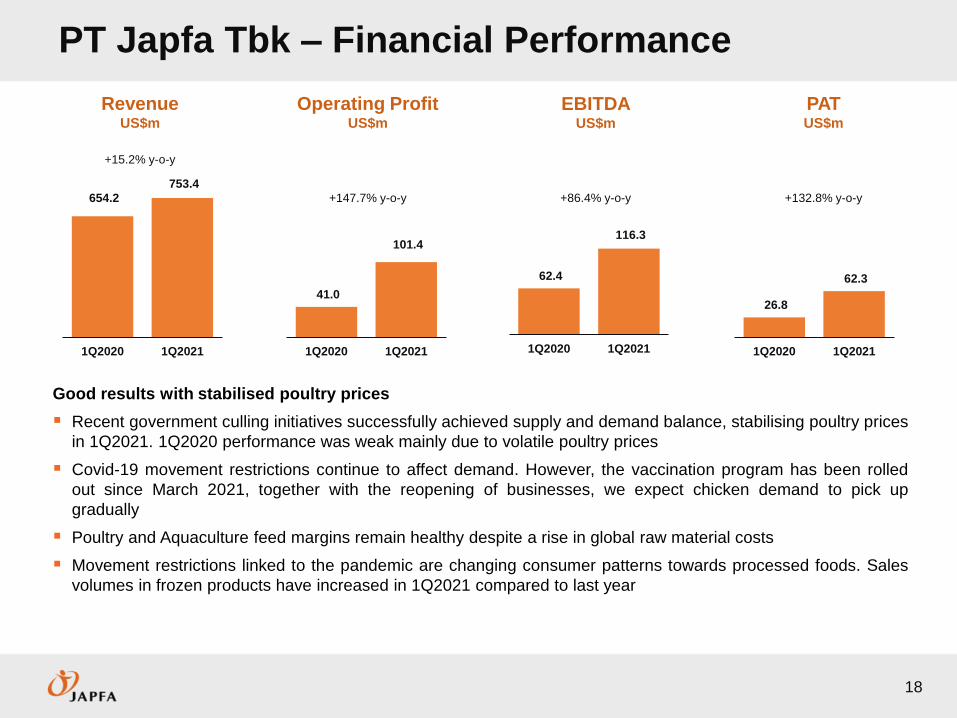
PT Japfa Tbk – Financial Performance
18
RevenueUS$m
PATUS$m
Operating ProfitUS$m
EBITDAUS$m
+15.2% y-o-y
Good results with stabilised poultry prices
Recent government culling initiatives successfully achieved supply and demand balance, stabilising poultry prices
in 1Q2021. 1Q2020 performance was weak mainly due to volatile poultry prices
Covid-19 movement restrictions continue to affect demand. However, the vaccination program has been rolled
out since March 2021, together with the reopening of businesses, we expect chicken demand to pick up
gradually
Poultry and Aquaculture feed margins remain healthy despite a rise in global raw material costs
Movement restrictions linked to the pandemic are changing consumer patterns towards processed foods. Sales
volumes in frozen products have increased in 1Q2021 compared to last year
+147.7% y-o-y +86.4% y-o-y +132.8% y-o-y
18.6 20.7
1Q2020 1Q2021
25.7 29.0
1Q2020 1Q2021
16.6 10.1
1Q2020 1Q2021
176.7
220.3
1Q2020 1Q2021
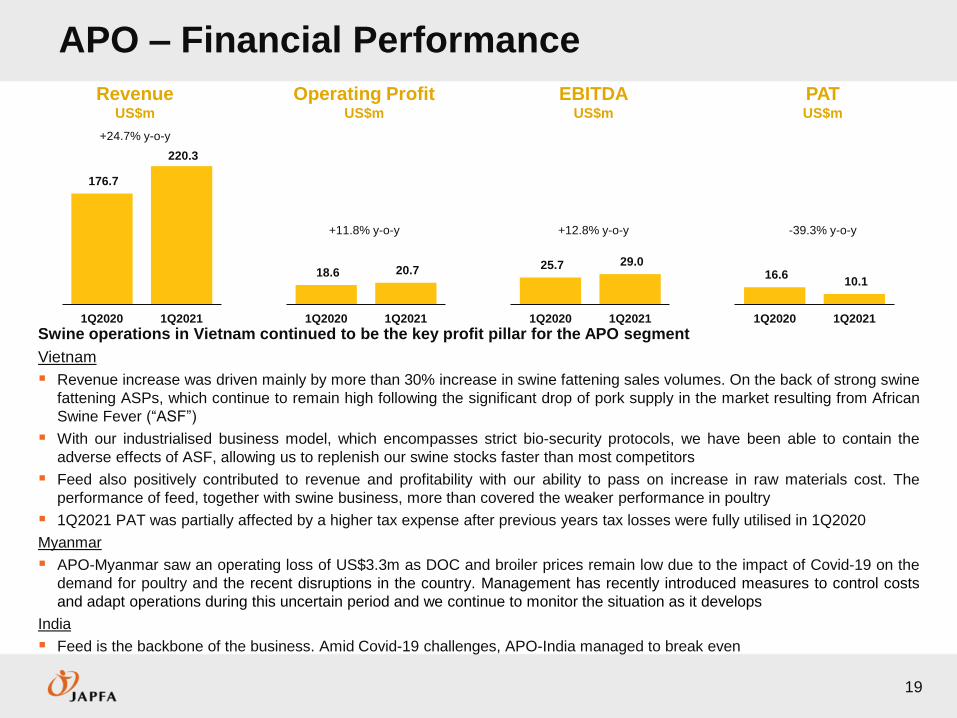
APO – Financial Performance
19
+24.7% y-o-y
+11.8% y-o-y +12.8% y-o-y
RevenueUS$m
PATUS$m
Operating ProfitUS$m
EBITDAUS$m
-39.3% y-o-y
Swine operations in Vietnam continued to be the key profit pillar for the APO segment
Vietnam
Revenue increase was driven mainly by more than 30% increase in swine fattening sales volumes. On the back of strong swine
fattening ASPs, which continue to remain high following the significant drop of pork supply in the market resulting from African
Swine Fever (“ASF”)
With our industrialised business model, which encompasses strict bio-security protocols, we have been able to contain the
adverse effects of ASF, allowing us to replenish our swine stocks faster than most competitors
Feed also positively contributed to revenue and profitability with our ability to pass on increase in raw materials cost. The
performance of feed, together with swine business, more than covered the weaker performance in poultry
1Q2021 PAT was partially affected by a higher tax expense after previous years tax losses were fully utilised in 1Q2020
Myanmar
APO-Myanmar saw an operating loss of US$3.3m as DOC and broiler prices remain low due to the impact of Covid-19 on the
demand for poultry and the recent disruptions in the country. Management has recently introduced measures to control costs
and adapt operations during this uncertain period and we continue to monitor the situation as it develops
India
Feed is the backbone of the business. Amid Covid-19 challenges, APO-India managed to break even
0
20
40
60
0
200
400
600
2018 2019f 2020f 2021f 2022f 2023f 2024f 2025f post2025
mill
ion
Hea
ds
Mill
ion
he
ad
s
Total herd (LHS) Sows (RHS)
Initial
restocking
Rapid
restocking
Stabilizing
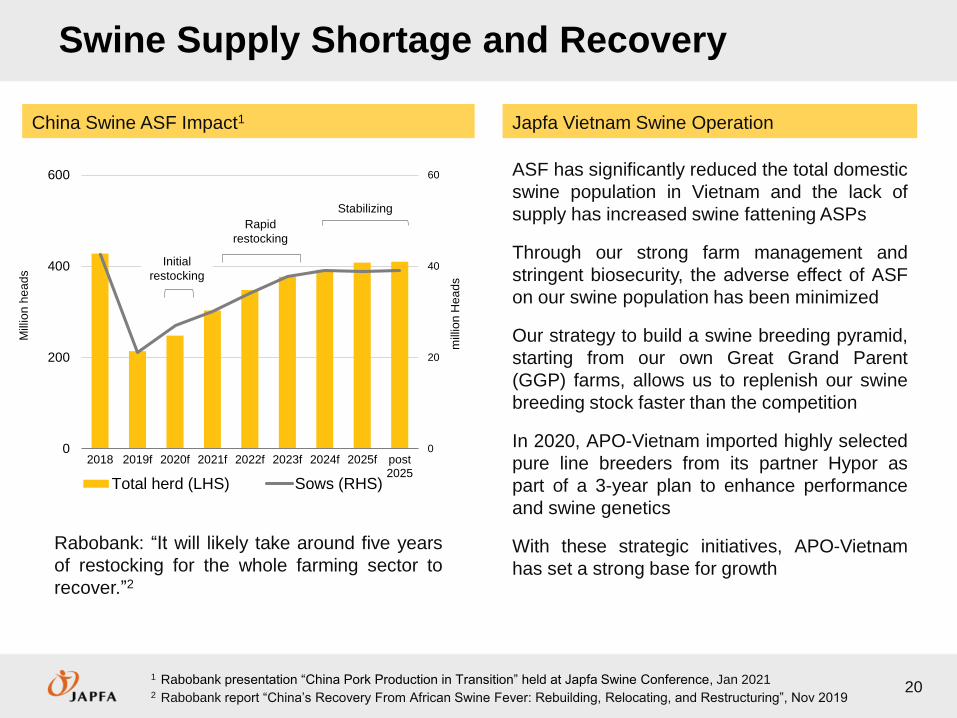
Swine Supply Shortage and Recovery
Rabobank: “It will likely take around five years
of restocking for the whole farming sector to
recover.”2
1 Rabobank presentation “China Pork Production in Transition” held at Japfa Swine Conference, Jan 20212 Rabobank report “China’s Recovery From African Swine Fever: Rebuilding, Relocating, and Restructuring”, Nov 2019
ASF has significantly reduced the total domestic
swine population in Vietnam and the lack of
supply has increased swine fattening ASPs
Through our strong farm management and
stringent biosecurity, the adverse effect of ASF
on our swine population has been minimized
Our strategy to build a swine breeding pyramid,
starting from our own Great Grand Parent
(GGP) farms, allows us to replenish our swine
breeding stock faster than the competition
In 2020, APO-Vietnam imported highly selected
pure line breeders from its partner Hypor as
part of a 3-year plan to enhance performance
and swine genetics
With these strategic initiatives, APO-Vietnam
has set a strong base for growth
Japfa Vietnam Swine OperationChina Swine ASF Impact1
20
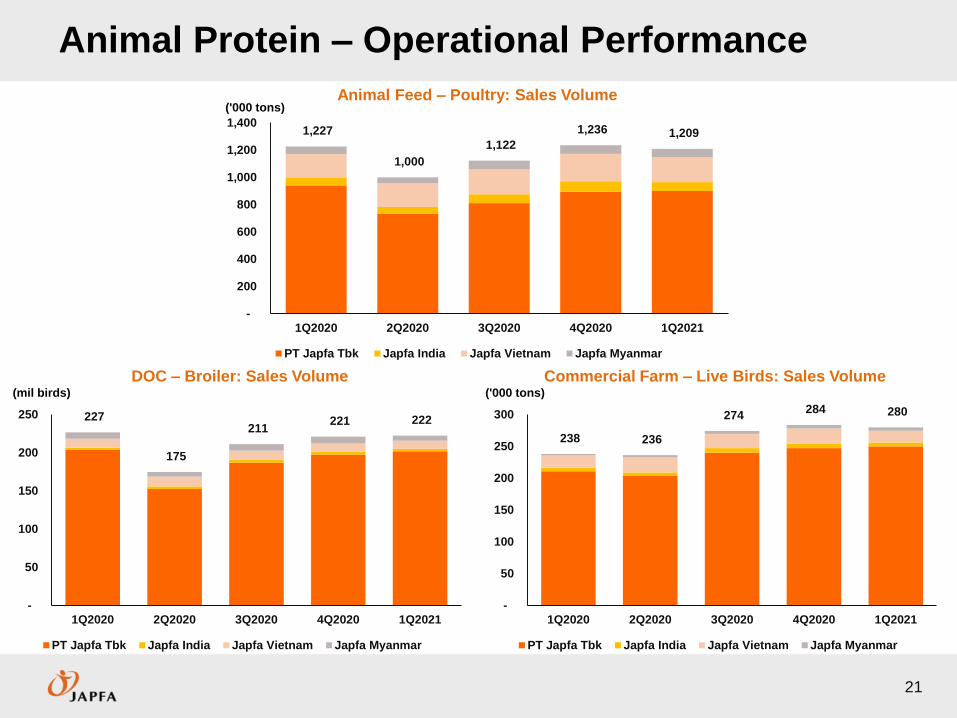
Animal Protein – Operational Performance
21
(mil birds) ('000 tons)
Animal Feed – Poultry: Sales Volume
DOC – Broiler: Sales Volume Commercial Farm – Live Birds: Sales Volume
('000 tons)
7x13 or 12.5
1,227
1,000
1,122
1,236 1,209
-
200
400
600
800
1,000
1,200
1,400
1Q2020 2Q2020 3Q2020 4Q2020 1Q2021
PT Japfa Tbk Japfa India Japfa Vietnam Japfa Myanmar
227
175
211 221 222
-
50
100
150
200
250
1Q2020 2Q2020 3Q2020 4Q2020 1Q2021
PT Japfa Tbk Japfa India Japfa Vietnam Japfa Myanmar
238 236
274 284 280
-
50
100
150
200
250
300
1Q2020 2Q2020 3Q2020 4Q2020 1Q2021
PT Japfa Tbk Japfa India Japfa Vietnam Japfa Myanmar
Animal Protein – Operational Performance
22
Aquaculture – Aqua-feed: Sales Volume
Swine Fattening: Sales Volume Animal Feed – Swine: Sales Volume
('000 tons)
('000 tons) ('000 tons)
73.8 67.9
76.4 80.8 77.0
0
10
20
30
40
50
60
70
80
90
1Q2020 2Q2020 3Q2020 4Q2020 1Q2021
PT Japfa Tbk
14.4 15.8 16.5
19.6 19.2
0
5
10
15
20
1Q2020 2Q2020 3Q2020 4Q2020 1Q2021
Japfa Vietnam
78.0 82.1 88.4 103.0 107.2
0
20
40
60
80
100
120
1Q2020 2Q2020 3Q2020 4Q2020 1Q2021
Japfa Vietnam
23.6 26.5
1Q2020 1Q2021
33.1 38.2
1Q2020 1Q2021
7.6 11.8
1Q2020 1Q2021
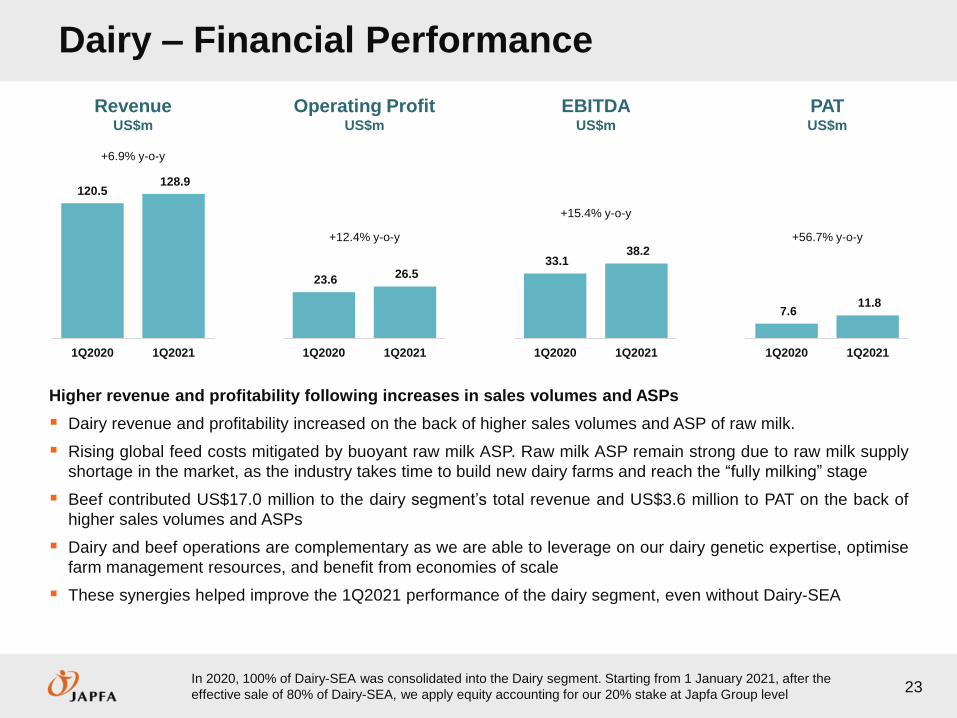
Dairy – Financial Performance
23
+12.4% y-o-y
+15.4% y-o-y
+56.7% y-o-y
RevenueUS$m
PATUS$m
Operating ProfitUS$m
EBITDAUS$m
+6.9% y-o-y
Higher revenue and profitability following increases in sales volumes and ASPs
Dairy revenue and profitability increased on the back of higher sales volumes and ASP of raw milk.
Rising global feed costs mitigated by buoyant raw milk ASP. Raw milk ASP remain strong due to raw milk supply
shortage in the market, as the industry takes time to build new dairy farms and reach the “fully milking” stage
Beef contributed US$17.0 million to the dairy segment’s total revenue and US$3.6 million to PAT on the back of
higher sales volumes and ASPs
Dairy and beef operations are complementary as we are able to leverage on our dairy genetic expertise, optimise
farm management resources, and benefit from economies of scale
These synergies helped improve the 1Q2021 performance of the dairy segment, even without Dairy-SEA
120.5 128.9
1Q2020 1Q2021
In 2020, 100% of Dairy-SEA was consolidated into the Dairy segment. Starting from 1 January 2021, after the
effective sale of 80% of Dairy-SEA, we apply equity accounting for our 20% stake at Japfa Group level
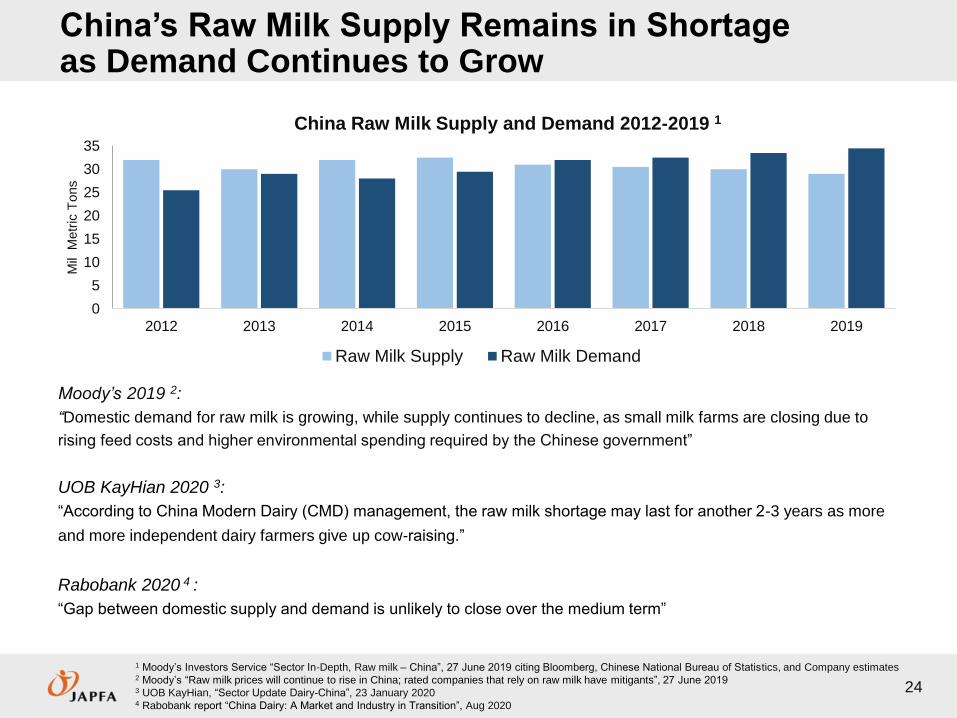
China’s Raw Milk Supply Remains in Shortage as Demand Continues to Grow
0
5
10
15
20
25
30
35
2012 2013 2014 2015 2016 2017 2018 2019
Mil
Metr
ic T
ons
China Raw Milk Supply and Demand 2012-2019 1
Raw Milk Supply Raw Milk Demand
1 Moody’s Investors Service “Sector In-Depth, Raw milk – China”, 27 June 2019 citing Bloomberg, Chinese National Bureau of Statistics, and Company estimates2 Moody’s “Raw milk prices will continue to rise in China; rated companies that rely on raw milk have mitigants”, 27 June 20193 UOB KayHian, “Sector Update Dairy-China”, 23 January 2020 4 Rabobank report “China Dairy: A Market and Industry in Transition”, Aug 2020
Moody’s 2019 2:
“Domestic demand for raw milk is growing, while supply continues to decline, as small milk farms are closing due to
rising feed costs and higher environmental spending required by the Chinese government”
UOB KayHian 2020 3:
“According to China Modern Dairy (CMD) management, the raw milk shortage may last for another 2-3 years as more
and more independent dairy farmers give up cow-raising.”
Rabobank 2020 4 :
“Gap between domestic supply and demand is unlikely to close over the medium term”
24
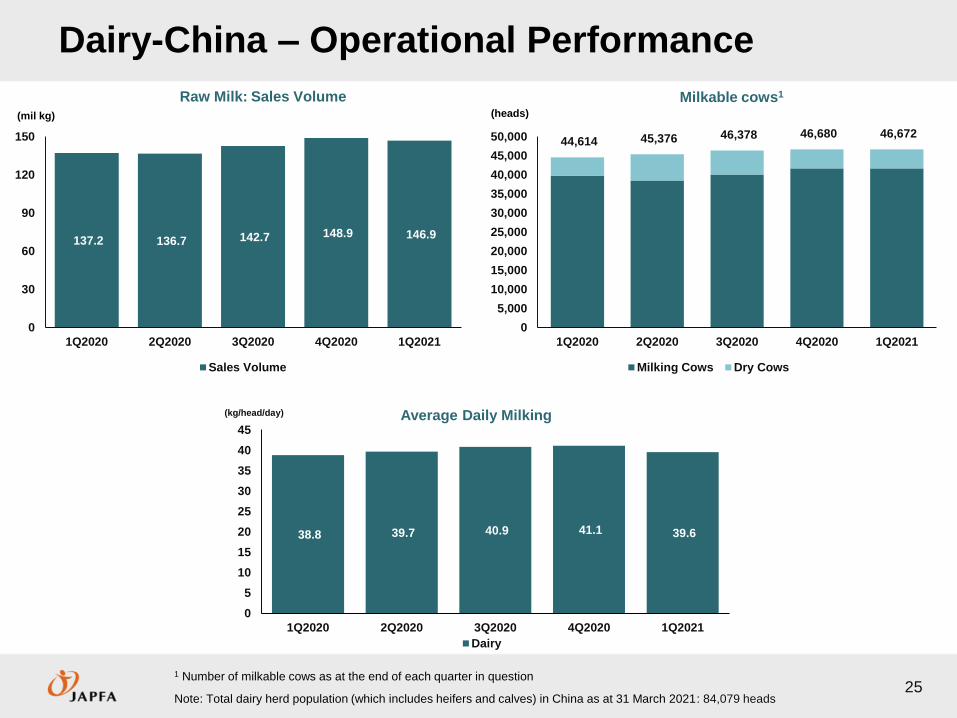
Dairy-China – Operational Performance
251 Number of milkable cows as at the end of each quarter in question
Note: Total dairy herd population (which includes heifers and calves) in China as at 31 March 2021: 84,079 heads
Raw Milk: Sales Volume Milkable cows1
(mil kg) (heads)
Average Daily Milking
137.2 136.7 142.7 148.9 146.9
0
30
60
90
120
150
1Q2020 2Q2020 3Q2020 4Q2020 1Q2021
Sales Volume
44,614 45,376 46,378 46,680 46,672
0
5,000
10,000
15,000
20,000
25,000
30,000
35,000
40,000
45,000
50,000
1Q2020 2Q2020 3Q2020 4Q2020 1Q2021
Milking Cows Dry Cows
38.8 39.7 40.9 41.1 39.6
0
5
10
15
20
25
30
35
40
45
1Q2020 2Q2020 3Q2020 4Q2020 1Q2021
Dairy
(kg/head/day)
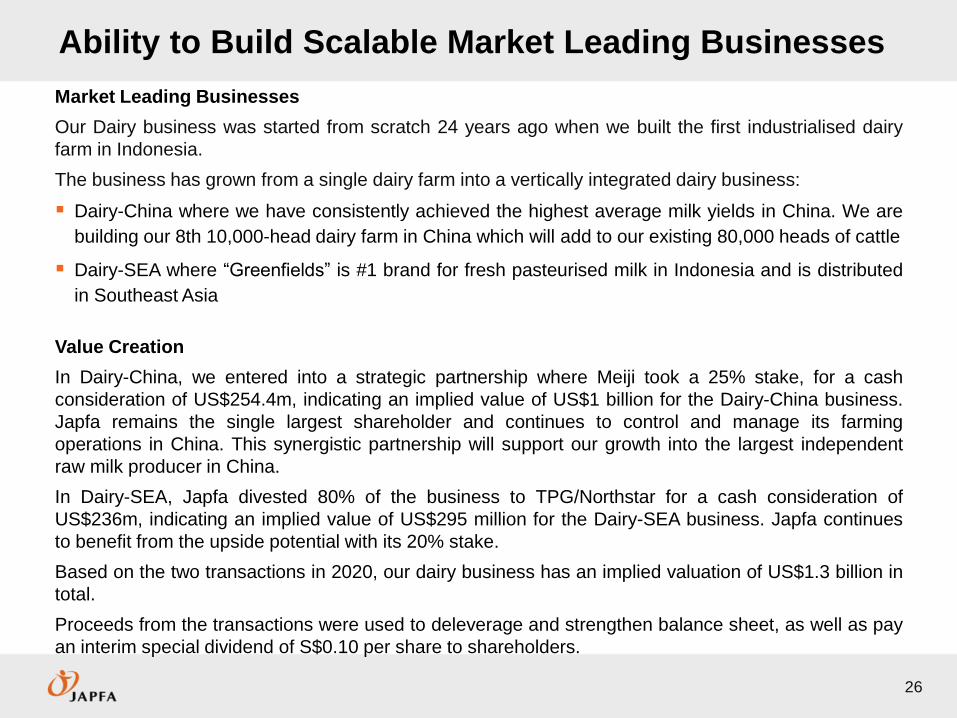
Ability to Build Scalable Market Leading Businesses
Market Leading Businesses
Our Dairy business was started from scratch 24 years ago when we built the first industrialised dairy
farm in Indonesia.
The business has grown from a single dairy farm into a vertically integrated dairy business:
Dairy-China where we have consistently achieved the highest average milk yields in China. We are
building our 8th 10,000-head dairy farm in China which will add to our existing 80,000 heads of cattle
Dairy-SEA where “Greenfields” is #1 brand for fresh pasteurised milk in Indonesia and is distributed
in Southeast Asia
Value Creation
In Dairy-China, we entered into a strategic partnership where Meiji took a 25% stake, for a cash
consideration of US$254.4m, indicating an implied value of US$1 billion for the Dairy-China business.
Japfa remains the single largest shareholder and continues to control and manage its farming
operations in China. This synergistic partnership will support our growth into the largest independent
raw milk producer in China.
In Dairy-SEA, Japfa divested 80% of the business to TPG/Northstar for a cash consideration of
US$236m, indicating an implied value of US$295 million for the Dairy-SEA business. Japfa continues
to benefit from the upside potential with its 20% stake.
Based on the two transactions in 2020, our dairy business has an implied valuation of US$1.3 billion in
total.
Proceeds from the transactions were used to deleverage and strengthen balance sheet, as well as pay
an interim special dividend of S$0.10 per share to shareholders.
26
OTHER FINANCIAL HIGHLIGHTS
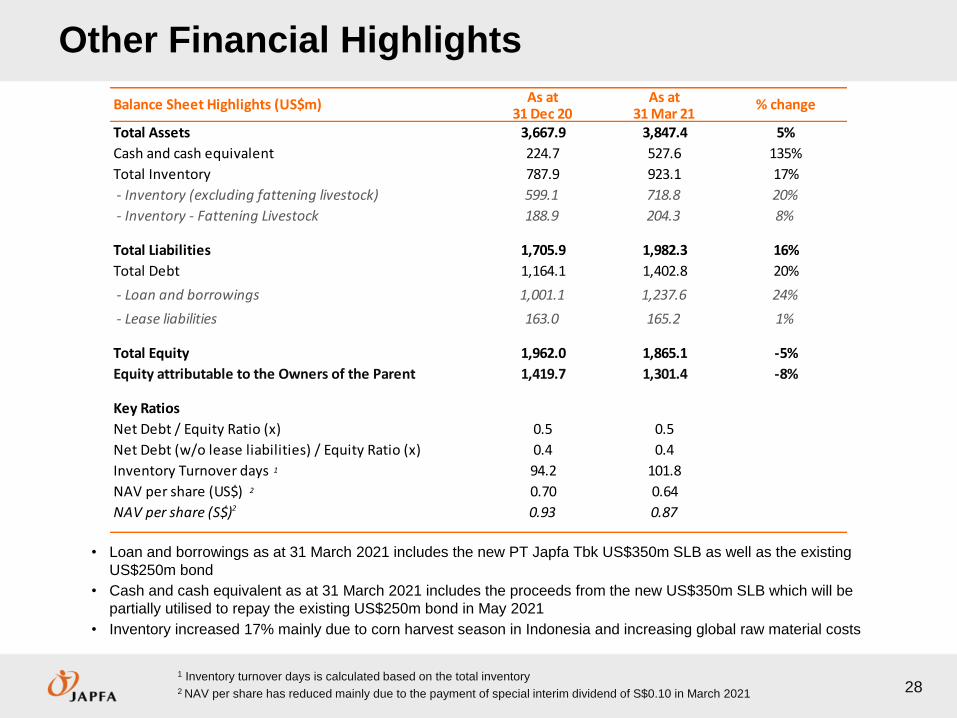
Other Financial Highlights
281 Inventory turnover days is calculated based on the total inventory2 NAV per share has reduced mainly due to the payment of special interim dividend of S$0.10 in March 2021
• Loan and borrowings as at 31 March 2021 includes the new PT Japfa Tbk US$350m SLB as well as the existing
US$250m bond
• Cash and cash equivalent as at 31 March 2021 includes the proceeds from the new US$350m SLB which will be
partially utilised to repay the existing US$250m bond in May 2021
• Inventory increased 17% mainly due to corn harvest season in Indonesia and increasing global raw material costs
As at As at31 Dec 20 31 Mar 21
Total Assets 3,667.9 3,847.4 5%
Cash and cash equivalent 224.7 527.6 135%
Total Inventory 787.9 923.1 17%
- Inventory (excluding fattening livestock) 599.1 718.8 20%
- Inventory - Fattening Livestock 188.9 204.3 8%
Total Liabilities 1,705.9 1,982.3 16%
Total Debt 1,164.1 1,402.8 20%
- Loan and borrowings 1,001.1 1,237.6 24%
- Lease liabilities 163.0 165.2 1%
Total Equity 1,962.0 1,865.1 -5%
Equity attributable to the Owners of the Parent 1,419.7 1,301.4 -8%
Key Ratios
Net Debt / Equity Ratio (x) 0.5 0.5
Net Debt (w/o lease liabilities) / Equity Ratio (x) 0.4 0.4
Inventory Turnover days 94.2 101.8
NAV per share (US$) 0.70 0.64
NAV per share (S$) 0.93 0.87
% changeBalance Sheet Highlights (US$m)
2
2
1
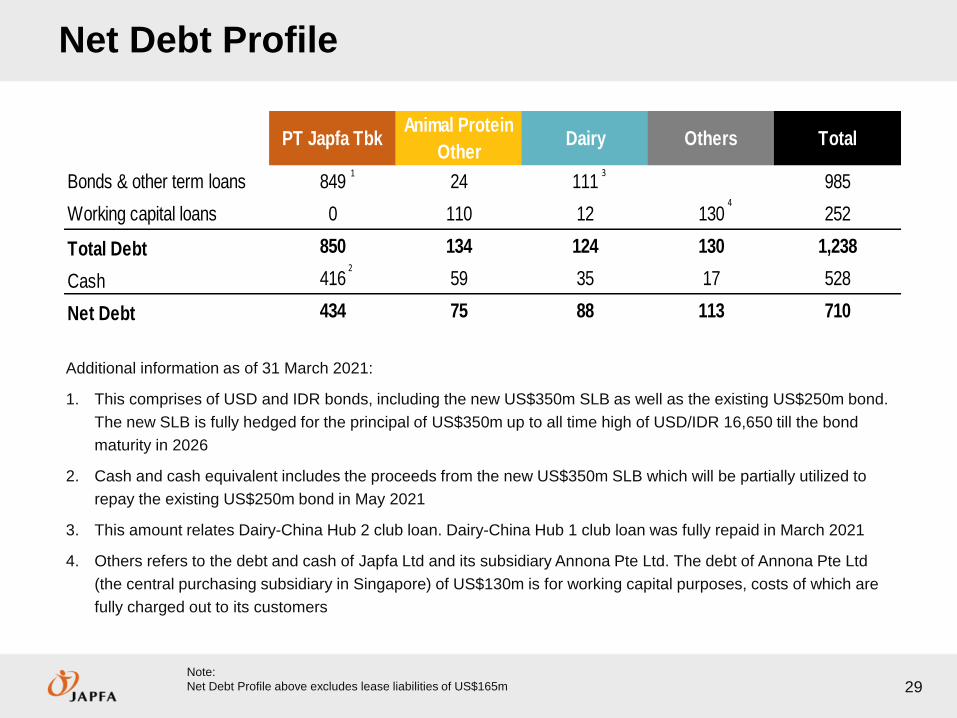
Net Debt Profile
29
Additional information as of 31 March 2021:
1. This comprises of USD and IDR bonds, including the new US$350m SLB as well as the existing US$250m bond.
The new SLB is fully hedged for the principal of US$350m up to all time high of USD/IDR 16,650 till the bond
maturity in 2026
2. Cash and cash equivalent includes the proceeds from the new US$350m SLB which will be partially utilized to
repay the existing US$250m bond in May 2021
3. This amount relates Dairy-China Hub 2 club loan. Dairy-China Hub 1 club loan was fully repaid in March 2021
4. Others refers to the debt and cash of Japfa Ltd and its subsidiary Annona Pte Ltd. The debt of Annona Pte Ltd
(the central purchasing subsidiary in Singapore) of US$130m is for working capital purposes, costs of which are
fully charged out to its customers
Note:
Net Debt Profile above excludes lease liabilities of US$165m
PT Japfa TbkAnimal Protein
OtherDairy Others Total
Bonds & other term loans 849 24 111 985
Working capital loans 0 110 12 130 252
Total Debt 850 134 124 130 1,238
Cash 416 59 35 17 528
Net Debt 434 75 88 113 710
1
2
3
4
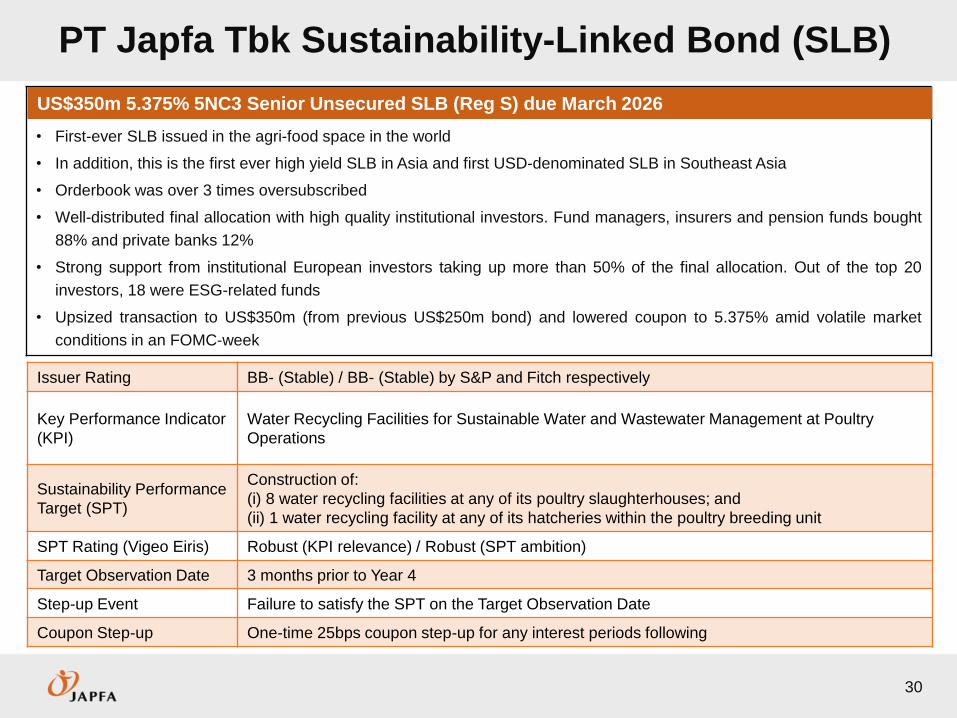
PT Japfa Tbk Sustainability-Linked Bond (SLB)
30
Tbk –
• First-ever SLB issued in the agri-food space in the world
• In addition, this is the first ever high yield SLB in Asia and first USD-denominated SLB in Southeast Asia
• Orderbook was over 3 times oversubscribed
• Well-distributed final allocation with high quality institutional investors. Fund managers, insurers and pension funds bought
88% and private banks 12%
• Strong support from institutional European investors taking up more than 50% of the final allocation. Out of the top 20
investors, 18 were ESG-related funds
• Upsized transaction to US$350m (from previous US$250m bond) and lowered coupon to 5.375% amid volatile market
conditions in an FOMC-week
US$350m 5.375% 5NC3 Senior Unsecured SLB (Reg S) due March 2026
Issuer Rating BB- (Stable) / BB- (Stable) by S&P and Fitch respectively
Key Performance Indicator
(KPI)
Water Recycling Facilities for Sustainable Water and Wastewater Management at Poultry
Operations
Sustainability Performance
Target (SPT)
Construction of:
(i) 8 water recycling facilities at any of its poultry slaughterhouses; and
(ii) 1 water recycling facility at any of its hatcheries within the poultry breeding unit
SPT Rating (Vigeo Eiris) Robust (KPI relevance) / Robust (SPT ambition)
Target Observation Date 3 months prior to Year 4
Step-up Event Failure to satisfy the SPT on the Target Observation Date
Coupon Step-up One-time 25bps coupon step-up for any interest periods following
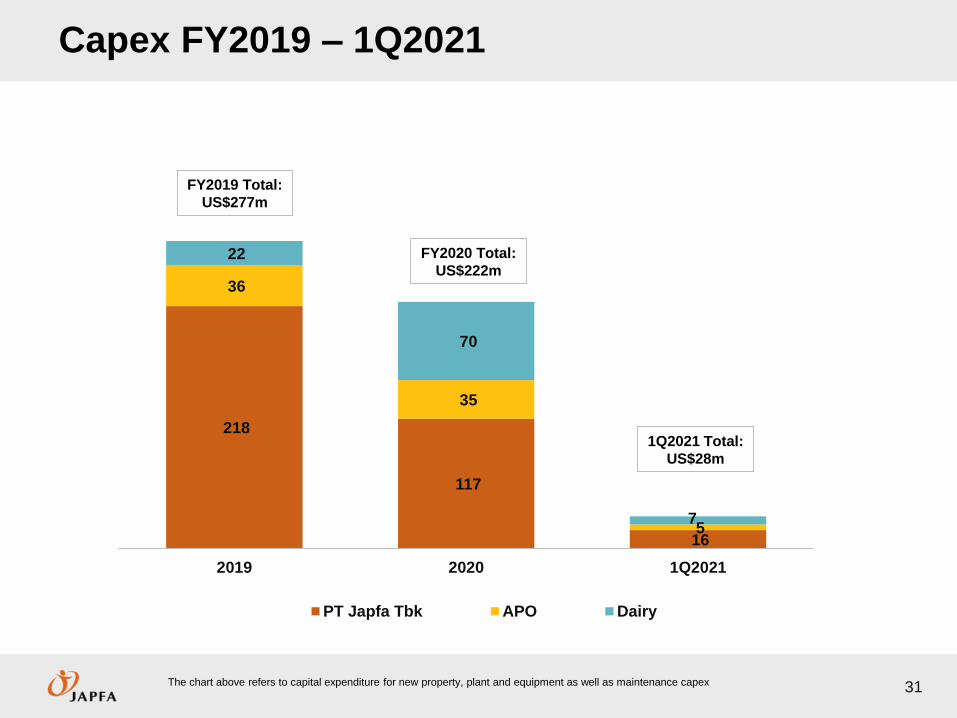
218
117
16
36
35
5
22
70
7
2019 2020 1Q2021
PT Japfa Tbk APO Dairy
Capex FY2019 – 1Q2021
31
FY2020 Total:
US$222m
FY2019 Total:
US$277m
The chart above refers to capital expenditure for new property, plant and equipment as well as maintenance capex
1Q2021 Total:
US$28m
APPENDIX
Agri-food Business Cyclicality
33
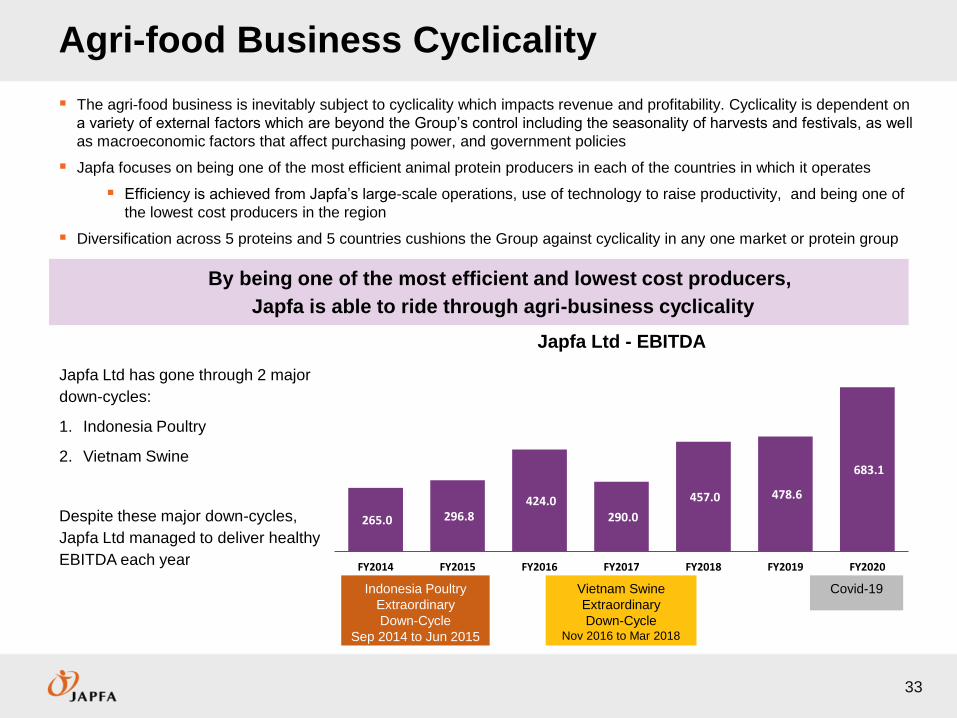
The agri-food business is inevitably subject to cyclicality which impacts revenue and profitability. Cyclicality is dependent on
a variety of external factors which are beyond the Group’s control including the seasonality of harvests and festivals, as well
as macroeconomic factors that affect purchasing power, and government policies
Japfa focuses on being one of the most efficient animal protein producers in each of the countries in which it operates
Efficiency is achieved from Japfa’s large-scale operations, use of technology to raise productivity, and being one of
the lowest cost producers in the region
Diversification across 5 proteins and 5 countries cushions the Group against cyclicality in any one market or protein group
Japfa Ltd has gone through 2 major
down-cycles:
1. Indonesia Poultry
2. Vietnam Swine
Despite these major down-cycles,
Japfa Ltd managed to deliver healthy
EBITDA each year
Indonesia Poultry
Extraordinary
Down-Cycle
Sep 2014 to Jun 2015
Vietnam Swine
Extraordinary
Down-Cycle Nov 2016 to Mar 2018
By being one of the most efficient and lowest cost producers,
Japfa is able to ride through agri-business cyclicality
265.0 296.8 424.0
290.0
457.0 478.6
683.1
FY2014 FY2015 FY2016 FY2017 FY2018 FY2019 FY2020
Japfa Ltd - EBITDA
Covid-19
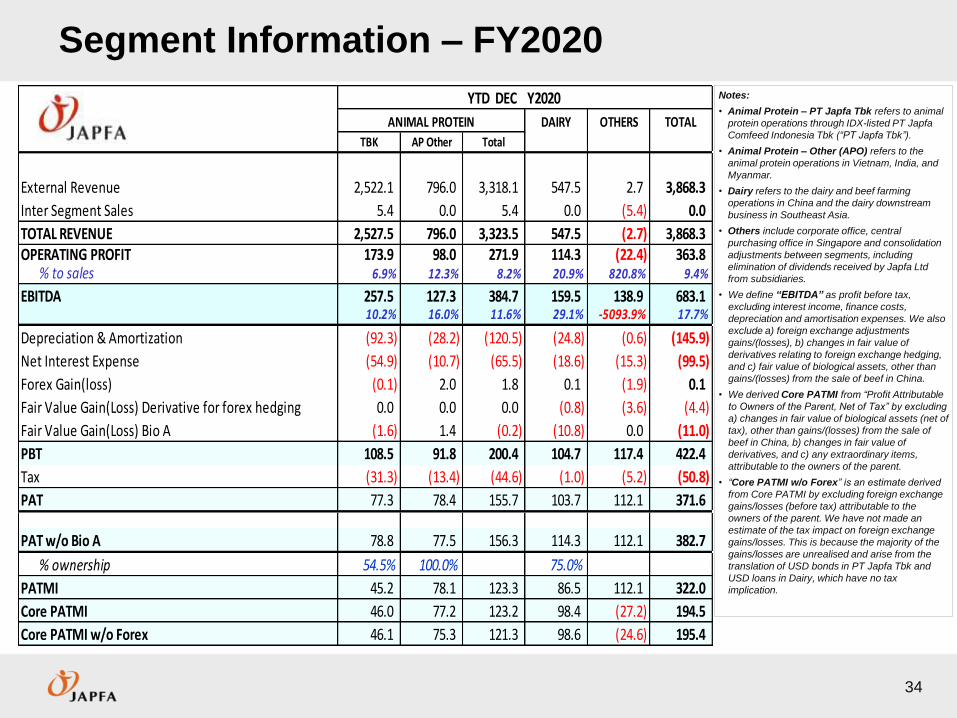
Segment Information – FY2020
34
Notes:
• Animal Protein – PT Japfa Tbk refers to animal
protein operations through IDX-listed PT Japfa
Comfeed Indonesia Tbk (“PT Japfa Tbk”).
• Animal Protein – Other (APO) refers to the
animal protein operations in Vietnam, India, and
Myanmar.
• Dairy refers to the dairy and beef farming
operations in China and the dairy downstream
business in Southeast Asia.
• Others include corporate office, central
purchasing office in Singapore and consolidation
adjustments between segments, including
elimination of dividends received by Japfa Ltd
from subsidiaries.
• We define “EBITDA” as profit before tax,
excluding interest income, finance costs,
depreciation and amortisation expenses. We also
exclude a) foreign exchange adjustments
gains/(losses), b) changes in fair value of
derivatives relating to foreign exchange hedging,
and c) fair value of biological assets, other than
gains/(losses) from the sale of beef in China.
• We derived Core PATMI from “Profit Attributable
to Owners of the Parent, Net of Tax” by excluding
a) changes in fair value of biological assets (net of
tax), other than gains/(losses) from the sale of
beef in China, b) changes in fair value of
derivatives, and c) any extraordinary items,
attributable to the owners of the parent.
• “Core PATMI w/o Forex” is an estimate derived
from Core PATMI by excluding foreign exchange
gains/losses (before tax) attributable to the
owners of the parent. We have not made an
estimate of the tax impact on foreign exchange
gains/losses. This is because the majority of the
gains/losses are unrealised and arise from the
translation of USD bonds in PT Japfa Tbk and
USD loans in Dairy, which have no tax
implication.
YTD DEC Y2020
DAIRY OTHERS TOTAL
TBK AP Other Total
External Revenue 2,522.1 796.0 3,318.1 547.5 2.7 3,868.3
Inter Segment Sales 5.4 0.0 5.4 0.0 (5.4) 0.0
TOTAL REVENUE 2,527.5 796.0 3,323.5 547.5 (2.7) 3,868.3OPERATING PROFIT 173.9 98.0 271.9 114.3 (22.4) 363.8
% to sales 6.9% 12.3% 8.2% 20.9% 820.8% 9.4%
EBITDA 257.5 127.3 384.7 159.5 138.9 683.110.2% 16.0% 11.6% 29.1% -5093.9% 17.7%
Depreciation & Amortization (92.3) (28.2) (120.5) (24.8) (0.6) (145.9)
Net Interest Expense (54.9) (10.7) (65.5) (18.6) (15.3) (99.5)
Forex Gain(loss) (0.1) 2.0 1.8 0.1 (1.9) 0.1
Fair Value Gain(Loss) Derivative for forex hedging 0.0 0.0 0.0 (0.8) (3.6) (4.4)
Fair Value Gain(Loss) Bio A (1.6) 1.4 (0.2) (10.8) 0.0 (11.0)
PBT 108.5 91.8 200.4 104.7 117.4 422.4
Tax (31.3) (13.4) (44.6) (1.0) (5.2) (50.8)
PAT 77.3 78.4 155.7 103.7 112.1 371.6
PAT w/o Bio A 78.8 77.5 156.3 114.3 112.1 382.7
% ownership 54.5% 100.0% 75.0%
PATMI 45.2 78.1 123.3 86.5 112.1 322.0
Core PATMI 46.0 77.2 123.2 98.4 (27.2) 194.5
Core PATMI w/o Forex 46.1 75.3 121.3 98.6 (24.6) 195.4
ANIMAL PROTEIN
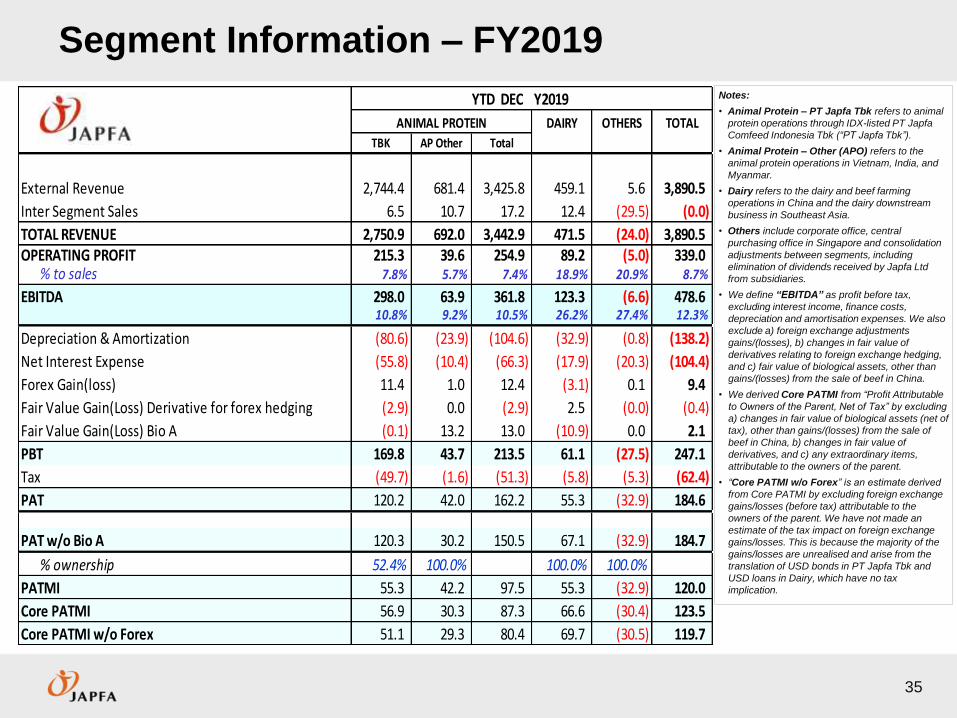
Segment Information – FY2019
35
Notes:
• Animal Protein – PT Japfa Tbk refers to animal
protein operations through IDX-listed PT Japfa
Comfeed Indonesia Tbk (“PT Japfa Tbk”).
• Animal Protein – Other (APO) refers to the
animal protein operations in Vietnam, India, and
Myanmar.
• Dairy refers to the dairy and beef farming
operations in China and the dairy downstream
business in Southeast Asia.
• Others include corporate office, central
purchasing office in Singapore and consolidation
adjustments between segments, including
elimination of dividends received by Japfa Ltd
from subsidiaries.
• We define “EBITDA” as profit before tax,
excluding interest income, finance costs,
depreciation and amortisation expenses. We also
exclude a) foreign exchange adjustments
gains/(losses), b) changes in fair value of
derivatives relating to foreign exchange hedging,
and c) fair value of biological assets, other than
gains/(losses) from the sale of beef in China.
• We derived Core PATMI from “Profit Attributable
to Owners of the Parent, Net of Tax” by excluding
a) changes in fair value of biological assets (net of
tax), other than gains/(losses) from the sale of
beef in China, b) changes in fair value of
derivatives, and c) any extraordinary items,
attributable to the owners of the parent.
• “Core PATMI w/o Forex” is an estimate derived
from Core PATMI by excluding foreign exchange
gains/losses (before tax) attributable to the
owners of the parent. We have not made an
estimate of the tax impact on foreign exchange
gains/losses. This is because the majority of the
gains/losses are unrealised and arise from the
translation of USD bonds in PT Japfa Tbk and
USD loans in Dairy, which have no tax
implication.
YTD DEC Y2019
DAIRY OTHERS TOTAL
TBK AP Other Total
External Revenue 2,744.4 681.4 3,425.8 459.1 5.6 3,890.5
Inter Segment Sales 6.5 10.7 17.2 12.4 (29.5) (0.0)
TOTAL REVENUE 2,750.9 692.0 3,442.9 471.5 (24.0) 3,890.5OPERATING PROFIT 215.3 39.6 254.9 89.2 (5.0) 339.0
% to sales 7.8% 5.7% 7.4% 18.9% 20.9% 8.7%
EBITDA 298.0 63.9 361.8 123.3 (6.6) 478.610.8% 9.2% 10.5% 26.2% 27.4% 12.3%
Depreciation & Amortization (80.6) (23.9) (104.6) (32.9) (0.8) (138.2)
Net Interest Expense (55.8) (10.4) (66.3) (17.9) (20.3) (104.4)
Forex Gain(loss) 11.4 1.0 12.4 (3.1) 0.1 9.4
Fair Value Gain(Loss) Derivative for forex hedging (2.9) 0.0 (2.9) 2.5 (0.0) (0.4)
Fair Value Gain(Loss) Bio A (0.1) 13.2 13.0 (10.9) 0.0 2.1
PBT 169.8 43.7 213.5 61.1 (27.5) 247.1
Tax (49.7) (1.6) (51.3) (5.8) (5.3) (62.4)
PAT 120.2 42.0 162.2 55.3 (32.9) 184.6
PAT w/o Bio A 120.3 30.2 150.5 67.1 (32.9) 184.7
% ownership 52.4% 100.0% 100.0% 100.0%
PATMI 55.3 42.2 97.5 55.3 (32.9) 120.0
Core PATMI 56.9 30.3 87.3 66.6 (30.4) 123.5
Core PATMI w/o Forex 51.1 29.3 80.4 69.7 (30.5) 119.7
ANIMAL PROTEIN
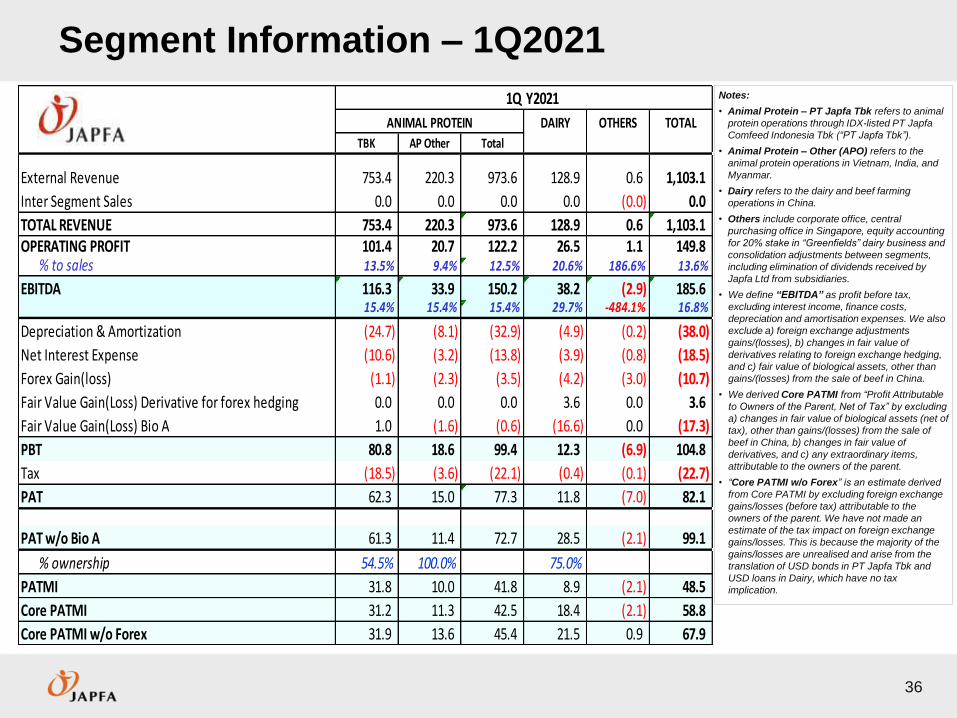
Segment Information – 1Q2021
36
Notes:
• Animal Protein – PT Japfa Tbk refers to animal
protein operations through IDX-listed PT Japfa
Comfeed Indonesia Tbk (“PT Japfa Tbk”).
• Animal Protein – Other (APO) refers to the
animal protein operations in Vietnam, India, and
Myanmar.
• Dairy refers to the dairy and beef farming
operations in China.
• Others include corporate office, central
purchasing office in Singapore, equity accounting
for 20% stake in “Greenfields” dairy business and
consolidation adjustments between segments,
including elimination of dividends received by
Japfa Ltd from subsidiaries.
• We define “EBITDA” as profit before tax,
excluding interest income, finance costs,
depreciation and amortisation expenses. We also
exclude a) foreign exchange adjustments
gains/(losses), b) changes in fair value of
derivatives relating to foreign exchange hedging,
and c) fair value of biological assets, other than
gains/(losses) from the sale of beef in China.
• We derived Core PATMI from “Profit Attributable
to Owners of the Parent, Net of Tax” by excluding
a) changes in fair value of biological assets (net of
tax), other than gains/(losses) from the sale of
beef in China, b) changes in fair value of
derivatives, and c) any extraordinary items,
attributable to the owners of the parent.
• “Core PATMI w/o Forex” is an estimate derived
from Core PATMI by excluding foreign exchange
gains/losses (before tax) attributable to the
owners of the parent. We have not made an
estimate of the tax impact on foreign exchange
gains/losses. This is because the majority of the
gains/losses are unrealised and arise from the
translation of USD bonds in PT Japfa Tbk and
USD loans in Dairy, which have no tax
implication.
1Q Y2021
DAIRY OTHERS TOTAL
TBK AP Other Total
External Revenue 753.4 220.3 973.6 128.9 0.6 1,103.1
Inter Segment Sales 0.0 0.0 0.0 0.0 (0.0) 0.0
TOTAL REVENUE 753.4 220.3 973.6 128.9 0.6 1,103.1OPERATING PROFIT 101.4 20.7 122.2 26.5 1.1 149.8
% to sales 13.5% 9.4% 12.5% 20.6% 186.6% 13.6%
EBITDA 116.3 33.9 150.2 38.2 (2.9) 185.615.4% 15.4% 15.4% 29.7% -484.1% 16.8%
Depreciation & Amortization (24.7) (8.1) (32.9) (4.9) (0.2) (38.0)
Net Interest Expense (10.6) (3.2) (13.8) (3.9) (0.8) (18.5)
Forex Gain(loss) (1.1) (2.3) (3.5) (4.2) (3.0) (10.7)
Fair Value Gain(Loss) Derivative for forex hedging 0.0 0.0 0.0 3.6 0.0 3.6
Fair Value Gain(Loss) Bio A 1.0 (1.6) (0.6) (16.6) 0.0 (17.3)
PBT 80.8 18.6 99.4 12.3 (6.9) 104.8
Tax (18.5) (3.6) (22.1) (0.4) (0.1) (22.7)
PAT 62.3 15.0 77.3 11.8 (7.0) 82.1
PAT w/o Bio A 61.3 11.4 72.7 28.5 (2.1) 99.1
% ownership 54.5% 100.0% 75.0%
PATMI 31.8 10.0 41.8 8.9 (2.1) 48.5
Core PATMI 31.2 11.3 42.5 18.4 (2.1) 58.8
Core PATMI w/o Forex 31.9 13.6 45.4 21.5 0.9 67.9
ANIMAL PROTEIN
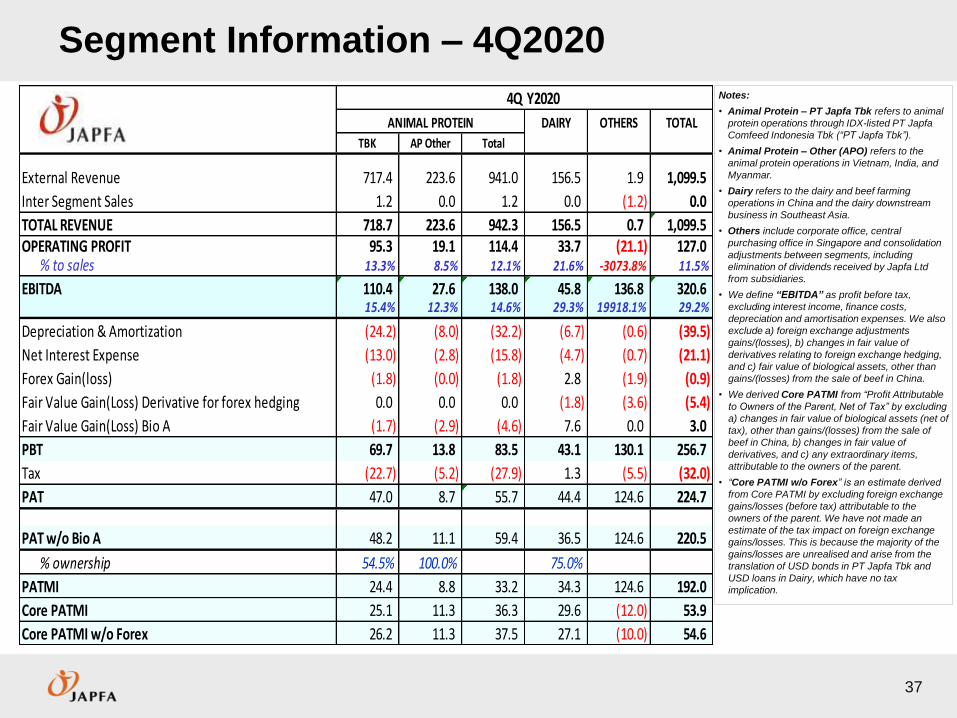
Segment Information – 4Q2020
37
Notes:
• Animal Protein – PT Japfa Tbk refers to animal
protein operations through IDX-listed PT Japfa
Comfeed Indonesia Tbk (“PT Japfa Tbk”).
• Animal Protein – Other (APO) refers to the
animal protein operations in Vietnam, India, and
Myanmar.
• Dairy refers to the dairy and beef farming
operations in China and the dairy downstream
business in Southeast Asia.
• Others include corporate office, central
purchasing office in Singapore and consolidation
adjustments between segments, including
elimination of dividends received by Japfa Ltd
from subsidiaries.
• We define “EBITDA” as profit before tax,
excluding interest income, finance costs,
depreciation and amortisation expenses. We also
exclude a) foreign exchange adjustments
gains/(losses), b) changes in fair value of
derivatives relating to foreign exchange hedging,
and c) fair value of biological assets, other than
gains/(losses) from the sale of beef in China.
• We derived Core PATMI from “Profit Attributable
to Owners of the Parent, Net of Tax” by excluding
a) changes in fair value of biological assets (net of
tax), other than gains/(losses) from the sale of
beef in China, b) changes in fair value of
derivatives, and c) any extraordinary items,
attributable to the owners of the parent.
• “Core PATMI w/o Forex” is an estimate derived
from Core PATMI by excluding foreign exchange
gains/losses (before tax) attributable to the
owners of the parent. We have not made an
estimate of the tax impact on foreign exchange
gains/losses. This is because the majority of the
gains/losses are unrealised and arise from the
translation of USD bonds in PT Japfa Tbk and
USD loans in Dairy, which have no tax
implication.
4Q Y2020
DAIRY OTHERS TOTAL
TBK AP Other Total
External Revenue 717.4 223.6 941.0 156.5 1.9 1,099.5
Inter Segment Sales 1.2 0.0 1.2 0.0 (1.2) 0.0
TOTAL REVENUE 718.7 223.6 942.3 156.5 0.7 1,099.5OPERATING PROFIT 95.3 19.1 114.4 33.7 (21.1) 127.0
% to sales 13.3% 8.5% 12.1% 21.6% -3073.8% 11.5%
EBITDA 110.4 27.6 138.0 45.8 136.8 320.615.4% 12.3% 14.6% 29.3% 19918.1% 29.2%
Depreciation & Amortization (24.2) (8.0) (32.2) (6.7) (0.6) (39.5)
Net Interest Expense (13.0) (2.8) (15.8) (4.7) (0.7) (21.1)
Forex Gain(loss) (1.8) (0.0) (1.8) 2.8 (1.9) (0.9)
Fair Value Gain(Loss) Derivative for forex hedging 0.0 0.0 0.0 (1.8) (3.6) (5.4)
Fair Value Gain(Loss) Bio A (1.7) (2.9) (4.6) 7.6 0.0 3.0
PBT 69.7 13.8 83.5 43.1 130.1 256.7
Tax (22.7) (5.2) (27.9) 1.3 (5.5) (32.0)
PAT 47.0 8.7 55.7 44.4 124.6 224.7
PAT w/o Bio A 48.2 11.1 59.4 36.5 124.6 220.5
% ownership 54.5% 100.0% 75.0%
PATMI 24.4 8.8 33.2 34.3 124.6 192.0
Core PATMI 25.1 11.3 36.3 29.6 (12.0) 53.9
Core PATMI w/o Forex 26.2 11.3 37.5 27.1 (10.0) 54.6
ANIMAL PROTEIN

Segment Information – 3Q2020
38
Notes:
• Animal Protein – PT Japfa Tbk refers to animal
protein operations through IDX-listed PT Japfa
Comfeed Indonesia Tbk (“PT Japfa Tbk”).
• Animal Protein – Other (APO) refers to the
animal protein operations in Vietnam, India, and
Myanmar.
• Dairy refers to the dairy and beef farming
operations in China and the dairy downstream
business in Southeast Asia.
• Others include corporate office, central
purchasing office in Singapore and consolidation
adjustments between segments, including
elimination of dividends received by Japfa Ltd
from subsidiaries.
• We define “EBITDA” as profit before tax,
excluding interest income, finance costs,
depreciation and amortisation expenses. We also
exclude a) foreign exchange adjustments
gains/(losses), b) changes in fair value of
derivatives relating to foreign exchange hedging,
and c) fair value of biological assets, other than
gains/(losses) from the sale of beef in China.
• We derived Core PATMI from “Profit Attributable
to Owners of the Parent, Net of Tax” by excluding
a) changes in fair value of biological assets (net of
tax), other than gains/(losses) from the sale of
beef in China, b) changes in fair value of
derivatives, and c) any extraordinary items,
attributable to the owners of the parent.
• “Core PATMI w/o Forex” is an estimate derived
from Core PATMI by excluding foreign exchange
gains/losses (before tax) attributable to the
owners of the parent. We have not made an
estimate of the tax impact on foreign exchange
gains/losses. This is because the majority of the
gains/losses are unrealised and arise from the
translation of USD bonds in PT Japfa Tbk and
USD loans in Dairy, which have no tax
implication.
3Q Y2020
DAIRY OTHERS TOTAL
TBK AP Other Total
External Revenue 581.2 207.8 788.9 146.5 (0.0) 935.4
Inter Segment Sales 1.6 0.0 1.6 0.0 (1.6) 0.0
TOTAL REVENUE 582.8 207.8 790.5 146.5 (1.6) 935.4OPERATING PROFIT 26.1 31.5 57.6 34.0 (1.4) 90.2
% to sales 4.5% 15.2% 7.3% 23.2% 86.5% 9.6%
EBITDA 52.7 38.5 91.2 47.3 3.1 141.69.0% 18.5% 11.5% 32.3% -191.2% 15.1%
Depreciation & Amortization (23.7) (7.0) (30.7) (6.3) (0.0) (37.1)
Net Interest Expense (14.9) (2.6) (17.5) (5.0) (6.3) (28.9)
Forex Gain(loss) 1.3 1.1 2.4 0.5 (0.2) 2.6
Fair Value Gain(Loss) Derivative for forex hedging 0.0 0.0 0.0 (0.4) 0.0 (0.4)
Fair Value Gain(Loss) Bio A 1.0 (0.3) 0.7 (5.5) 0.0 (4.7)
PBT 16.4 29.7 46.0 30.6 (3.5) 73.1
Tax (4.5) (3.0) (7.5) (0.6) (0.7) (8.8)
PAT 11.9 26.6 38.5 30.0 (4.2) 64.3
PAT w/o Bio A 11.3 26.9 38.2 35.4 (4.2) 69.4
% ownership 53.5% 100.0% 75.0%
PATMI 7.9 26.5 34.4 22.9 (4.2) 53.1
Core PATMI 7.6 26.8 34.4 26.9 (8.4) 52.9
Core PATMI w/o Forex 6.9 25.7 32.5 26.6 (7.8) 51.3
ANIMAL PROTEIN
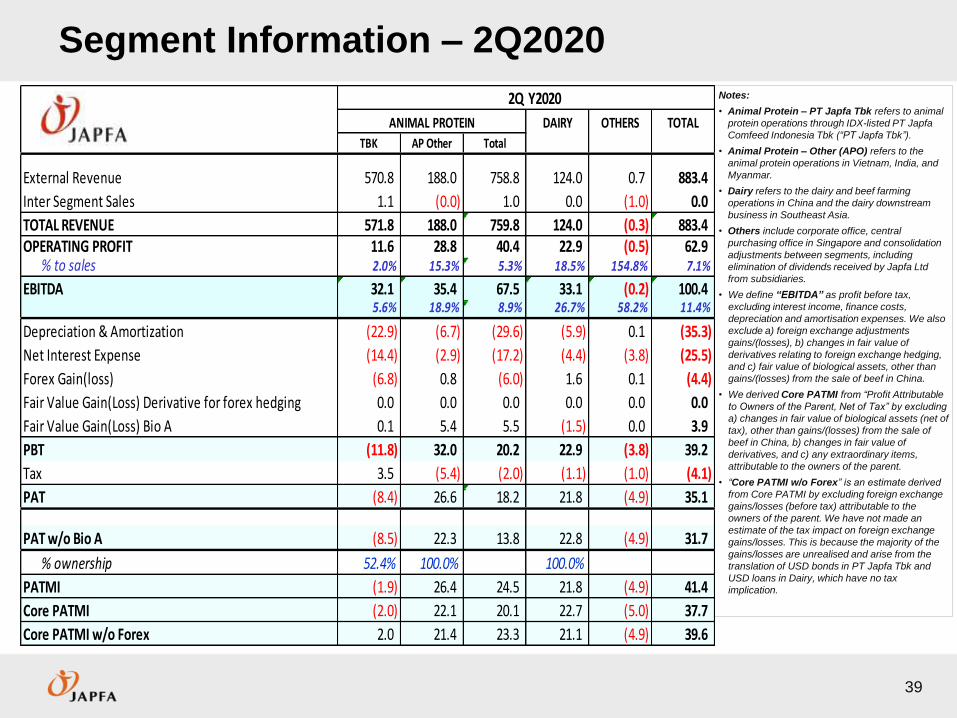
Segment Information – 2Q2020
39
Notes:
• Animal Protein – PT Japfa Tbk refers to animal
protein operations through IDX-listed PT Japfa
Comfeed Indonesia Tbk (“PT Japfa Tbk”).
• Animal Protein – Other (APO) refers to the
animal protein operations in Vietnam, India, and
Myanmar.
• Dairy refers to the dairy and beef farming
operations in China and the dairy downstream
business in Southeast Asia.
• Others include corporate office, central
purchasing office in Singapore and consolidation
adjustments between segments, including
elimination of dividends received by Japfa Ltd
from subsidiaries.
• We define “EBITDA” as profit before tax,
excluding interest income, finance costs,
depreciation and amortisation expenses. We also
exclude a) foreign exchange adjustments
gains/(losses), b) changes in fair value of
derivatives relating to foreign exchange hedging,
and c) fair value of biological assets, other than
gains/(losses) from the sale of beef in China.
• We derived Core PATMI from “Profit Attributable
to Owners of the Parent, Net of Tax” by excluding
a) changes in fair value of biological assets (net of
tax), other than gains/(losses) from the sale of
beef in China, b) changes in fair value of
derivatives, and c) any extraordinary items,
attributable to the owners of the parent.
• “Core PATMI w/o Forex” is an estimate derived
from Core PATMI by excluding foreign exchange
gains/losses (before tax) attributable to the
owners of the parent. We have not made an
estimate of the tax impact on foreign exchange
gains/losses. This is because the majority of the
gains/losses are unrealised and arise from the
translation of USD bonds in PT Japfa Tbk and
USD loans in Dairy, which have no tax
implication.
2Q Y2020
DAIRY OTHERS TOTAL
TBK AP Other Total
External Revenue 570.8 188.0 758.8 124.0 0.7 883.4
Inter Segment Sales 1.1 (0.0) 1.0 0.0 (1.0) 0.0
TOTAL REVENUE 571.8 188.0 759.8 124.0 (0.3) 883.4OPERATING PROFIT 11.6 28.8 40.4 22.9 (0.5) 62.9
% to sales 2.0% 15.3% 5.3% 18.5% 154.8% 7.1%
EBITDA 32.1 35.4 67.5 33.1 (0.2) 100.45.6% 18.9% 8.9% 26.7% 58.2% 11.4%
Depreciation & Amortization (22.9) (6.7) (29.6) (5.9) 0.1 (35.3)
Net Interest Expense (14.4) (2.9) (17.2) (4.4) (3.8) (25.5)
Forex Gain(loss) (6.8) 0.8 (6.0) 1.6 0.1 (4.4)
Fair Value Gain(Loss) Derivative for forex hedging 0.0 0.0 0.0 0.0 0.0 0.0
Fair Value Gain(Loss) Bio A 0.1 5.4 5.5 (1.5) 0.0 3.9
PBT (11.8) 32.0 20.2 22.9 (3.8) 39.2
Tax 3.5 (5.4) (2.0) (1.1) (1.0) (4.1)
PAT (8.4) 26.6 18.2 21.8 (4.9) 35.1
PAT w/o Bio A (8.5) 22.3 13.8 22.8 (4.9) 31.7
% ownership 52.4% 100.0% 100.0%
PATMI (1.9) 26.4 24.5 21.8 (4.9) 41.4
Core PATMI (2.0) 22.1 20.1 22.7 (5.0) 37.7
Core PATMI w/o Forex 2.0 21.4 23.3 21.1 (4.9) 39.6
ANIMAL PROTEIN
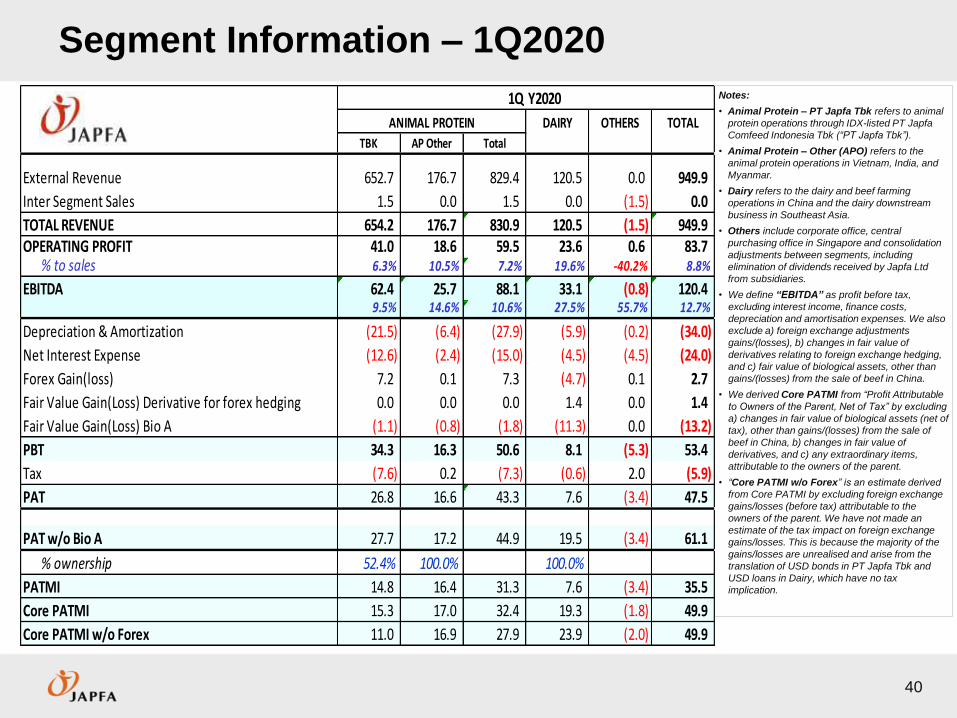
Segment Information – 1Q2020
40
Notes:
• Animal Protein – PT Japfa Tbk refers to animal
protein operations through IDX-listed PT Japfa
Comfeed Indonesia Tbk (“PT Japfa Tbk”).
• Animal Protein – Other (APO) refers to the
animal protein operations in Vietnam, India, and
Myanmar.
• Dairy refers to the dairy and beef farming
operations in China and the dairy downstream
business in Southeast Asia.
• Others include corporate office, central
purchasing office in Singapore and consolidation
adjustments between segments, including
elimination of dividends received by Japfa Ltd
from subsidiaries.
• We define “EBITDA” as profit before tax,
excluding interest income, finance costs,
depreciation and amortisation expenses. We also
exclude a) foreign exchange adjustments
gains/(losses), b) changes in fair value of
derivatives relating to foreign exchange hedging,
and c) fair value of biological assets, other than
gains/(losses) from the sale of beef in China.
• We derived Core PATMI from “Profit Attributable
to Owners of the Parent, Net of Tax” by excluding
a) changes in fair value of biological assets (net of
tax), other than gains/(losses) from the sale of
beef in China, b) changes in fair value of
derivatives, and c) any extraordinary items,
attributable to the owners of the parent.
• “Core PATMI w/o Forex” is an estimate derived
from Core PATMI by excluding foreign exchange
gains/losses (before tax) attributable to the
owners of the parent. We have not made an
estimate of the tax impact on foreign exchange
gains/losses. This is because the majority of the
gains/losses are unrealised and arise from the
translation of USD bonds in PT Japfa Tbk and
USD loans in Dairy, which have no tax
implication.
1Q Y2020
DAIRY OTHERS TOTAL
TBK AP Other Total
External Revenue 652.7 176.7 829.4 120.5 0.0 949.9
Inter Segment Sales 1.5 0.0 1.5 0.0 (1.5) 0.0
TOTAL REVENUE 654.2 176.7 830.9 120.5 (1.5) 949.9OPERATING PROFIT 41.0 18.6 59.5 23.6 0.6 83.7
% to sales 6.3% 10.5% 7.2% 19.6% -40.2% 8.8%
EBITDA 62.4 25.7 88.1 33.1 (0.8) 120.49.5% 14.6% 10.6% 27.5% 55.7% 12.7%
Depreciation & Amortization (21.5) (6.4) (27.9) (5.9) (0.2) (34.0)
Net Interest Expense (12.6) (2.4) (15.0) (4.5) (4.5) (24.0)
Forex Gain(loss) 7.2 0.1 7.3 (4.7) 0.1 2.7
Fair Value Gain(Loss) Derivative for forex hedging 0.0 0.0 0.0 1.4 0.0 1.4
Fair Value Gain(Loss) Bio A (1.1) (0.8) (1.8) (11.3) 0.0 (13.2)
PBT 34.3 16.3 50.6 8.1 (5.3) 53.4
Tax (7.6) 0.2 (7.3) (0.6) 2.0 (5.9)
PAT 26.8 16.6 43.3 7.6 (3.4) 47.5
PAT w/o Bio A 27.7 17.2 44.9 19.5 (3.4) 61.1
% ownership 52.4% 100.0% 100.0%
PATMI 14.8 16.4 31.3 7.6 (3.4) 35.5
Core PATMI 15.3 17.0 32.4 19.3 (1.8) 49.9
Core PATMI w/o Forex 11.0 16.9 27.9 23.9 (2.0) 49.9
ANIMAL PROTEIN
COVID-19 UPDATE
42
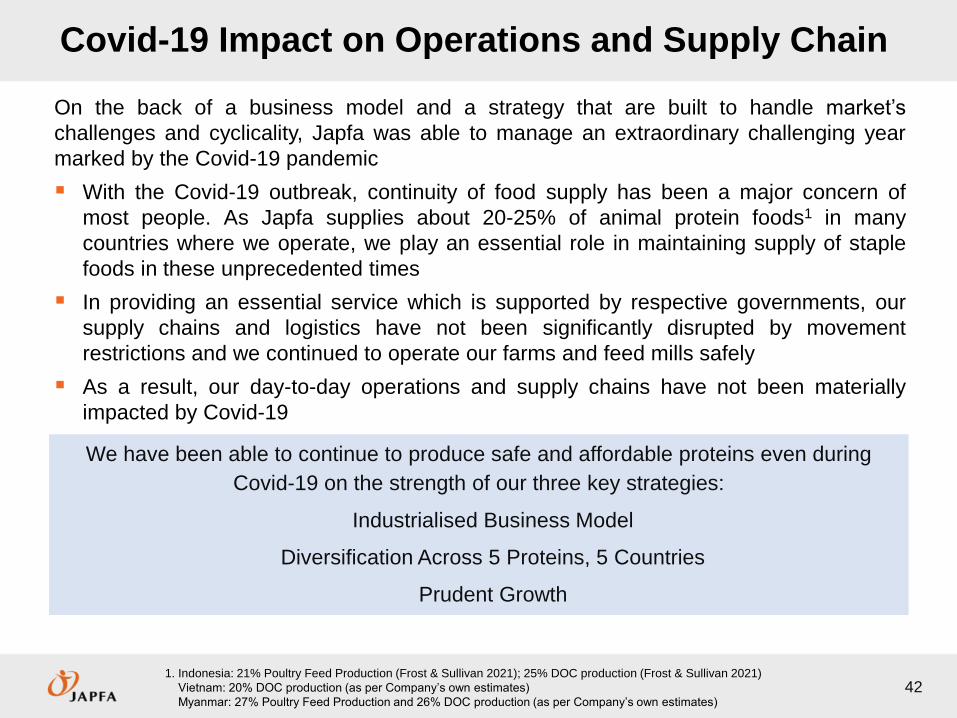
On the back of a business model and a strategy that are built to handle market’s
challenges and cyclicality, Japfa was able to manage an extraordinary challenging year
marked by the Covid-19 pandemic
With the Covid-19 outbreak, continuity of food supply has been a major concern of
most people. As Japfa supplies about 20-25% of animal protein foods1 in many
countries where we operate, we play an essential role in maintaining supply of staple
foods in these unprecedented times
In providing an essential service which is supported by respective governments, our
supply chains and logistics have not been significantly disrupted by movement
restrictions and we continued to operate our farms and feed mills safely
As a result, our day-to-day operations and supply chains have not been materially
impacted by Covid-19
Covid-19 Impact on Operations and Supply Chain
1. Indonesia: 21% Poultry Feed Production (Frost & Sullivan 2021); 25% DOC production (Frost & Sullivan 2021)
Vietnam: 20% DOC production (as per Company’s own estimates)
Myanmar: 27% Poultry Feed Production and 26% DOC production (as per Company’s own estimates)
We have been able to continue to produce safe and affordable proteins even during
Covid-19 on the strength of our three key strategies:
Industrialised Business Model
Diversification Across 5 Proteins, 5 Countries
Prudent Growth
0
5,000
10,000
15,000
20,000
25,000
0
2,000
4,000
6,000
8,000
10,000
Jul
Au
gS
ep
Oct
Nov
Dec
Jan
Fe
bM
ar
Ap
rM
ay
Jun
Jul
Au
gS
ep
Oct
Nov
Dec
Jan
Fe
bM
ar
Ap
rM
ay
Jun
Jul
Au
gS
ep
Oct
Nov
Dec
Jan
Fe
bM
ar
2019 2020 2021
DOC (LHS) Broiler (RHS)
43
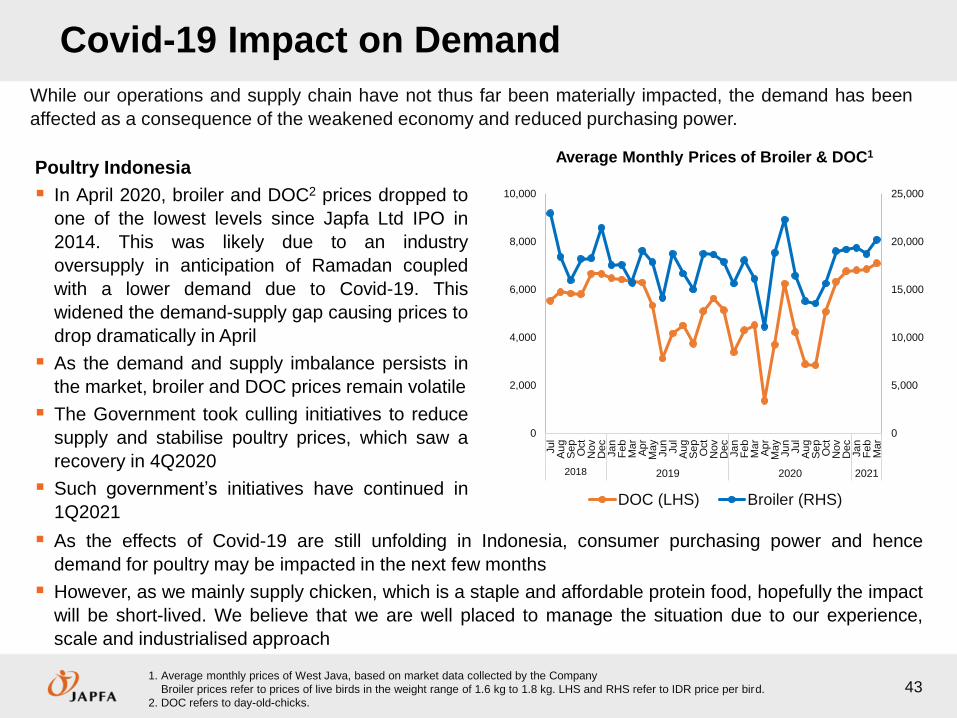
Poultry Indonesia
In April 2020, broiler and DOC2 prices dropped to
one of the lowest levels since Japfa Ltd IPO in
2014. This was likely due to an industry
oversupply in anticipation of Ramadan coupled
with a lower demand due to Covid-19. This
widened the demand-supply gap causing prices to
drop dramatically in April
As the demand and supply imbalance persists in
the market, broiler and DOC prices remain volatile
The Government took culling initiatives to reduce
supply and stabilise poultry prices, which saw a
recovery in 4Q2020
Such government’s initiatives have continued in
1Q2021
Covid-19 Impact on Demand
As the effects of Covid-19 are still unfolding in Indonesia, consumer purchasing power and hence
demand for poultry may be impacted in the next few months
However, as we mainly supply chicken, which is a staple and affordable protein food, hopefully the impact
will be short-lived. We believe that we are well placed to manage the situation due to our experience,
scale and industrialised approach
Average Monthly Prices of Broiler & DOC1
1. Average monthly prices of West Java, based on market data collected by the Company
Broiler prices refer to prices of live birds in the weight range of 1.6 kg to 1.8 kg. LHS and RHS refer to IDR price per bird.
2. DOC refers to day-old-chicks.
While our operations and supply chain have not thus far been materially impacted, the demand has been
affected as a consequence of the weakened economy and reduced purchasing power.
2018
44
Dairy-China: We see a recovery in the demand for raw milk and we believe that there should not
be a major impact over the medium and long-term. With the general shortage of raw milk in
China, as an independent raw milk producer, we are poised to benefit in future.
Swine Vietnam: The Covid-19 situation appears to be relatively under control. Demand for pork
is relatively stable as a consequence of the substantial drop in pork supply due to African Swine
Fever (“ASF”) and pork prices remain strong. We have minimised the adverse effect of ASF
through strict biosecurity protocols, and replenished our swine breeding stock faster than most
competitors, thus setting a strong base for the future growth.
The performance of Japfa is mainly driven by the above-mentioned key three pillars: Poultry
Indonesia, Dairy-China and Swine Vietnam.
Our two key pillars Swine Vietnam and Dairy-China have delivered strong results that more than
offset the weaker performance of Poultry Indonesia.
However, as this outbreak is an unprecedented event, the impact going forward cannot be reliably
estimated with certainty. The Group continues to keep a close watch on the evolving situation.
Covid-19 Impact on Demand
THANK YOUIMPORTANT NOTICE: This investor presentation is for information only and should not be relied upon to make any
investment or divestment decision with respect to securities of the Japfa Group. Shareholders and potential investors
are advised to seek independent advice in the making of any investment or divestment decision. Where this investor
presentation includes opinions, judgements or forward-looking statements, these involve assumptions, risks and
uncertainties that may or may not be realised. Any references to industry prices or price trends are Company estimates
due to the absence of centralised public sources. Industry related data quoted has not been independently verified.
For further information, please refer to the Company’s website www.japfa.com.