Embed Size (px)
Citation preview

Group LTD Credibility Study Results from Stage 1
April 2018

2
© 2018 Society of Actuaries
Group LTD Credibility Study
Results from Stage 1
AUTHOR
Paul Correia, FSA, MAAA
Principal and Consulting Actuary
Milliman, Inc.
Tasha S. Khan, FSA, MAAA
Principal and Consulting Actuary
Milliman, Inc.
SPONSOR SOA Group Long-Term Disability
Experience Committee
Caveat and Disclaimer
This study is published by the Society of Actuaries (SOA) and contains information from a variety of sources.
It may or may not reflect the experience of any individual company. The study is for informational purposes
only and should not be construed as professional or financial advice. The SOA does not recommend or
endorse any particular use of the information provided in this study. The SOA makes no warranty, express or
implied, or representation whatsoever and assumes no liability in connection with the use or misuse of this
study.
The opinions expressed and conclusions reached by the authors are their own and do not represent any
official position or opinion of the Society of Actuaries or its members. The Society of Actuaries makes no
representation or warranty to the accuracy of the information.

3
© 2018 Society of Actuaries
TABLE OF CONTENTS
Section 1: Introduction ............................................................................................................................................. 4
Section 2: Acknowledgements and Resources ........................................................................................................... 6 2.1 Participating Companies ......................................................................................................................................... 6 2.2 Group LTD Credibility Study Committee ............................................................................................................... 6 2.3 Other Resources ..................................................................................................................................................... 7
Section 3: Executive Summary .................................................................................................................................. 8
Section 4: Correlation Coefficient Analysis .............................................................................................................. 10 4.1 Analytical Methods ............................................................................................................................................... 10 4.2 Test Results ........................................................................................................................................................... 13
Section 5: Relative Error Analysis ............................................................................................................................ 34 5.1 Analytical Methods ................................................................................................................................................ 34 5.2 Test Results ........................................................................................................................................................... 36
Section 6: Reliance and Limitations ........................................................................................................................ 42
About The Society of Actuaries ............................................................................................................................... 43
Appendix: Group LTD Credibility Study Stage 1 – Appendix.xlsx

4
© 2018 Society of Actuaries
Section 1: Introduction
In 2013, the Society of Actuaries Health Section published a report on credibility applications in
group long term disability insurance (www.soa.org/resources/research-reports/2013/research-
2013-iss-app-cred). The report discusses credibility applications in pricing, rate making, and
valuation, and features results from a survey of group long-term disability (LTD) insurers on how
they use credibility. It also includes a bibliography of papers, reports and other sources that
specifically address credibility applications across all group insurance products. The report
observed that the existing theory represented in the literature was based on independent
variables, and there was little to guide applications for insurance benefits like group LTD that
include non-independent variables. There was also little underlying theory or practical applications
discussed in the existing literature to help evaluate whether a particular approach was “better” or
“worse” for a given purpose. The survey results contained in the report are particularly interesting
because they reveal that the methods for applying credibility vary widely across the LTD industry.
The primary objective of the Group Long-Term Disability Credibility Experience Study is to give
actuaries practical information and guidance on LTD claim credibility for case level pricing and
underwriting. It is not intended to support other credibility applications for LTD including the
development of underlying base rates or the development of experience-based adjustments to
industry tables for valuation purposes. As noted in the 2013 report, traditional credibility methods
may not be applicable in the pricing of LTD insurance due to group dynamics (e.g. non-independent
claims) and variable benefit payment patterns. Actuaries who work with LTD benefits often have
to make special considerations for applying credibility in their work.
Furthermore, traditional approaches to credibility have concentrated largely on statistical
variance—the degree to which historical experience differs from a hypothetical “true” expected
value (which is unknown). However, credibility applications in LTD require additional
considerations such as experience drift (changes in experience driven by the passage of time, such
as changes in industry experience, changes in company practices, etc.) and modeling bias (degree
to which the hypothetical “true” expected values differ from modeled expected values). Therefore,
actuaries who work with LTD benefits should not only recognize the limitations of traditional
credibility methods, but they should also recognize the multiple sources of variance that can impact
credibility in LTD.
In this study, researchers tested the correlation of historical experience to future experience by
modeling claim cost ratios calculated from industry data. Two different approaches were used for
testing the predictive quality of LTD experience:
Approach 1: Correlation Coefficients
This approach involved an application of statistical methods discussed in the paper “On the
Credibility of Group Insurance Claim Experience” by Myron Margolin1. Industry data was
1 • Myron H. Margolin, On the Credibility of Group Insurance Claim Experience, Transactions of the Society of Actuaries, 1971, Vol. 23 Pt. 1 No. 67

5
© 2018 Society of Actuaries
used to compute correlation coefficients between experience from an initial period (e.g.,
three consecutive years) and a subsequent period (e.g., the next two consecutive years).
Approach 2: Relative Errors
This approach involved calculating the relative error between historical LTD experience and
experience from a subsequent period. The relative errors were calculated at the policy
level and then grouped by life years of exposure (LYE) to observe how the average relative
error changes with increasing LYE.
The analyses were performed using experience from LTD policies inforce for at least five
consecutive years between January 1, 2004 and December 31, 2011. This data was supplied by 14
disability insurers who participated in the study, and included 300,020 LTD claims incurred
between January 1, 2004 and December 31, 2011. A list of the 14 study participants is provided in
Section 2 of this report.
The correlation coefficients and relative errors are based on incurred claim cost ratios. Covered
payroll was used as the exposure basis in the denominator of the claim cost ratio. In the numerator,
claim costs were calculated as the present value of expected payments on each claim, as of the
end of the elimination period, using the 2012 GLTD Basic Table, the gross benefit amount payable
under the policy with no offsets, and a 3.5% interest rate assumption.
Any reader of this report should keep in mind that the results presented in this report do not give
specific guidance on the level of credibility that should be assumed for pricing LTD cases. The results
are more informative when interpreted as relativities as opposed to absolute values. For instance,
the results in Section 4 of this report demonstrate that the correlation between LTD experience
from two periods depends on several factors, such as life years of exposure, incidence rates, etc.
While these results can be useful in forming an opinion of the type of experience and characteristics
that are most predictive, they should not be translated directly into credibility estimates.
Readers should also keep in mind that this study focused primarily on measuring the predictive
attributes of LTD experience in the absence of a prior estimate (i.e. manual rate). However,
credibility applications in the pricing of LTD cases are designed to minimize the variance of future
claim costs versus a prior estimate made up of blending a manual rate and observed experience.
Therefore, as applied in practice, credibility is not only a function of the predictive power of past
experience, but also a function of the quality and accuracy of the manual rate.
Finally, because claim costs were calculated based on expected future benefit payments and with
no offsets, the correlation coefficients may be overstated because these claim cost estimates
ignore the volatility associated with actual termination rates and LTD benefit patterns. In Section 4
of this report, the results of a waterfall analysis are provided which illustrate the impact of
reflecting actual claim terminations in the claim cost calculations. The results also show the impact
of assuming a $1 monthly benefit amount for all claims versus the actual gross monthly benefit
amount.

6
© 2018 Society of Actuaries
Section 2: Acknowledgements and Resources
2.1 Participating Companies
The Society of Actuaries would like to thank the following 14 companies who contributed data to
this study:
AIG
Anthem
Cigna
Guardian
Liberty Mutual
MetLife
Mutual of Omaha
Northwestern Mutual
OneAmerica
Prudential
Reliance Standard
Standard
The Hartford
Unum
2.2 Group LTD Credibility Study Committee
The SOA extends its gratitude to the Group LTD Credibility Study Committee for designing the
project, overseeing the analyses, and authoring and peer reviewing this report. The Group LTD
Credibility Study Committee members are:
Avtar Singh, FSA, MAAA
Bram Spector, FSA, MAAA
Jiayu Guo, FSA, MAAA
Jinn Lin, FSA, MAAA
Julie Shuman, FSA, MAAA
Kari Stokely, FSA, MAAA
Mark Mortensen, FSA, MAAA
Matthew Desfosses, ASA, MAAA
Rick Leavitt, ASA, MAAA
Scott Carter, FSA, MAAA
Tom Corcoran, FSA, MAAA (Co-chair)
Warren Cohen, FSA, MAAA (Co-chair)
Zheng Bai, FSA, MAAA

7
© 2018 Society of Actuaries
2.3 Other Resources
The SOA contracted with MIB’s Actuarial and Statistical Research Group to collect, validate, and
compile the data for this report. Also Erika Schulty, SOA Research Associate, and Pete Miller, SOA
Experience Studies Actuary, supplied project management support. Significant analytical support
was provided by Adelina Koseva, an actuarial assistant at Milliman.

8
© 2018 Society of Actuaries
Section 3: Executive Summary
This section contains a summary of the key findings from the LTD Credibility Study, which are
discussed in greater detail in other sections of this report. Unless specifically stated otherwise, the
results below are based on life years exposed and claim costs that reflect gross benefit amounts
and expected claim termination rates as of the end of the elimination period.
Correlation Coefficients
Correlation coefficients measure the extent to which the cost of LTD claims in a “lookback
period” (e.g., 3 years) is correlated to the cost of LTD claims in a “subsequent period” (e.g.,
2 years). The correlation coefficients generally increase with life years of exposure (LYE)
up to about 5,000 LYE. Beyond this point, the correlation coefficients increase at a much
slower rate, or in some cases level off, reaching maximum values in the range of 80% to
90%. Note that this does not imply that experience which includes 5,000 LYE is 80% to 90%
credible, as discussed in the introduction of this report.
Higher correlation coefficients were observed when the experience in the lookback and
subsequent periods was based on claim incidence only, versus total incurred claim costs.
For example, for groups whose experience includes 5,000 to 7,499 LYE, the correlation
coefficients were 80% when based on claim incidence only and 65% when based on total
claim costs (see Table 1.c). In general, the coefficients follow a hierarchy that suggests LTD
credibility is impacted by variable benefit amounts and actual claim terminations.
Furthermore, in a separate test, higher correlations were observed from groups whose
experience included higher incidence rates.
The correlation coefficients vary by length of lookback period and by length of the gap
between lookback and subsequent experience periods. In general, correlation coefficients
are higher when the experience is based on a shorter lookback period and a shorter gap
(or no gap) between the lookback and subsequent periods, suggesting that more recent
experience is more credible for predicting future experience. For example, the results of
Test 1.a imply that one year of experience for a 4,000 life group demonstrates higher
correlation than four years of experience for a 1,000 life group. However, for a particular
case size, results show greater correlations for longer lookback periods (which increase
LYE) as shown in Table 1.b.
The correlations are relatively low for groups in Finance, Insurance, and Real Estate
industries relative to the other industries. However, when volatility from variable benefit
amounts was eliminated (by restating claim costs using a $1 gross benefit amount for all
claims), the correlation coefficients were more similar among different industries. This
result suggests that credibility may be impacted by a greater variability in benefit amounts
and/or a higher prevalence of large outlier claims from groups in the Finance, Insurance,
and Real Estate industry segment.

9
© 2018 Society of Actuaries
The correlation coefficients tend to be higher for LTD experience corresponding to
coverage that is either partially or 100% employee-paid, which may be partly due to higher
claim incidence rates often observed on contributory policies.
Relative Error
The relative error between experience from a lookback period and subsequent period
generally decreases as LYE increases, which is consistent with the pattern seen in the
correlation coefficients. A similar slope was also observed, where the relative error is
decreasing rapidly up to 5,000 LYE and then decreases at a much slower rate.
Even at the highest LYE groups, the relative error between historical experience and
subsequent experience does not drop below 26%. This confirms that there is significant
volatility in LTD claim experience, even when the group is large and where most carriers
would currently assign full credibility. This may be an indication of volatility arising from
experience drift or other issues beyond mere statistical fluctuation.
An interesting result emerged when studying the relative error as a function of credibility and LYE group. These results are presented in Table 14. The results presented illustrate a process of minimizing the relative error between the case rate (i.e. credibility weighted average of manual and experience rates) and future experience for each LYE group. For this purpose we used a simplified approach to establish a manual rate, using industry experience from 2004 through 2011. For lower LYE groups, a lower credibility factor is found to minimize error, and the optimal credibility weighting increases with increasing LYE. This result reminds us that volatility and credibility are two separate concepts, and that assigning high levels of credibility to prior experience may still be optimal for larger groups, despite the underlying volatility of LTD claims experience.

10
© 2018 Society of Actuaries
Section 4: Correlation Coefficient Analysis
4.1 Analytical Methods
LTD underwriting typically includes experience rating methods in which the group’s experience from a lookback period (usually three to five years) combined with a prior estimate (manual rate) is used to estimate future experience. The credibility assigned to the historical experience is a key factor in the experience rating process. However, because traditional credibility formulas may not be appropriate for group LTD insurance, actuaries are faced with the question of the degree to which experience from the lookback period is correlated to future experience.
This section of the report provides results from an analysis of correlation coefficients corresponding to LTD claim cost ratios from a lookback experience period and a subsequent period. Correlation coefficients are unitless measures of the linear association between two variables and they do not imply causation.
Specifically, the correlation coefficients were calculated as follows2:
Correlation Coefficient = 𝐶𝑜𝑣(𝐶𝐶1,𝐶𝐶2)
𝜎(𝐶𝐶1)∙𝜎(𝐶𝐶2)
In the above equation Covariance represents the expected value of the product of deviations of CC1 and CC2 from their respective population means. CC1 represents the claim cost ratio from the lookback experience period, and CC2 represents the claim cost ratio corresponding to a subsequent experience period, where claim cost ratios were calculated at the policy level. Expected values (population means of E(CC1) and E(CC2)) were calculated separately for each LYE segment based on the weighted average claim cost ratio for all policies included in that segment. The LYE segment was determined from life years in the lookback period for each policy.
Covariance was calculated as follows:
𝐶𝑜v(𝐶𝐶1,𝐶𝐶2)= ∑(CC1𝑖−E(CC1))×(CC2𝑖−E(CC2))
𝑛−1
𝑛𝑖=1
And standard deviations as follows:
𝜎 (𝐶𝐶1)=√∑(CC1𝑖−E(CC1))
2
𝑛−1
𝑛𝑖=1
𝜎 (𝐶𝐶2) =√∑(CC2𝑖−E(CC2))
2
𝑛−1
𝑛𝑖=1
2 Various weighting methods were considered and tested for calculating the correlation coefficients reflected in this report. Results are implicitly weighted on covered payroll, which we determined to be a reasonable approach for this purpose.

11
© 2018 Society of Actuaries
Claim costs were calculated as the present value of expected payments on each claim, as of the end of the elimination period, using the 2012 GLTD Basic Table with no offsets and a 3.5% interest rate assumption. This approach ensures that claim costs are calculated consistently for every claim in the study, and are not biased by different approaches for calculating incurred claims among companies that participated in the study, nor by different claim management practices among those companies. We recognize, however, that the use of expected termination rates may overstate correlation coefficients by ignoring the volatility associated with actual termination rates. To assess the impact of this approach, we performed a test (Test 1.c described below) in which we reflected actual terminations in the claim cost calculations and then compared the corresponding correlation coefficients to those computed using expected terminations. Not surprisingly, the correlation coefficients were lower when claim costs reflected actual claim terminations. This is an important result to keep in mind when interpreting other results from this section.
We excluded data from groups whose plan design changed within the study period to ensure meaningful and unbiased comparisons between lookback and subsequent experience periods. Also, certain groups were excluded from the study if there were data quality issues that could impact study results, such as illogical exposure patterns or missing data.
The following tests were performed using the approaches described above (unless explicitly stated
otherwise in the description):
Test 1.a – Test whether longer lookback periods demonstrate higher correlation than shorter periods, or vice versa (lookback periods ranging from 1 to 5 years). Results summarized by LYE group.
Test 1.b – Similar to Test 1.a (i.e. whether longer lookback periods demonstrate higher correlation than shorter periods), but results are summarized by case size.
Test 1.c – Test the impact of claim incidence, variable benefit amounts, and duration on the correlation coefficients.
Test 2 – Test the impact of including a gap between the lookback and subsequent periods (no gap, 1 year, 2 years, 3 years and 4 years).
Test 3 – Test whether more recent experience demonstrates higher correlation than older experience, or vice versa.
Test 4 – Test experience across different calendar periods using experience from 2004-2008 versus 2005-2009 versus 2006-2010 versus 2007-2011.
Test 5 – Test whether shorter elimination periods demonstrate higher correlation than longer elimination periods, or vice versa.
Test 6.a and 6.b – Test whether the experience from certain industries demonstrates higher correlation than other industries.
Test 7 – Test whether the experience from certain geographical regions demonstrates higher correlation than other regions.

12
© 2018 Society of Actuaries
Test 8.a and 8.b – Test whether experience from groups with higher incidence rates demonstrates higher correlation than experience from groups with lower incidence rates, or vice versa.
Test 9 – Test whether the experience from employee-paid coverage demonstrates higher correlation than employer-paid.
Test 10 – Test whether the experience from policies integrated with STD demonstrates higher correlation than non-integrated policies.
The results from these tests are shown below in Section 4.2. The results have also been provided
in the Appendix (Group LTD Credibility Study Stage 1 – Appendix.xlsx) in greater detail, by including
additional information such as exposures and confidence intervals with suggested upper and lower
bounds for interpreting results. The confidence intervals are estimated using a Fisher
transformation. Additional details of the calculation are included on the ‘Formulas’ tab of the
Appendix.

13
© 2018 Society of Actuaries
4.2 Test Results Test 1.a The following table shows correlation coefficients based on LYE segment and length of lookback
period, ranging from one to five years. The length of the subsequent period is two years in every
case, and there is no gap between lookback and subsequent periods. Policies were grouped by LYE
segment based on total exposure in the lookback period.
Table 1.a: Correlation Coefficients by Length of Lookback Period and Life Years of Exposure
Lookback period 5 Years 4 Years 3 Years 2 Years 1 Year
Subsequent period 2 Years 2 Years 2 Years 2 Years 2 Years
LYE
0-99 5.0% 6.1% 6.7% 6.5% 5.2%
100-499 18.3% 19.3% 20.2% 22.1% 28.2% 500-999 35.9% 37.5% 43.2% 52.6% 52.8%
1,000-1,999 49.0% 56.6% 60.7% 61.8% 66.6%
2,000-2,999 67.1% 62.5% 65.8% 74.4% 72.5%
3,000-3,999 56.7% 68.4% 76.8% 76.8% 76.1%
4,000-4,999 73.4% 81.5% 78.4% 71.8% 87.0% 5,000-7,499 80.0% 78.6% 74.5% 81.8% 81.0%
7,500-9,999 84.0% 80.0% 83.3% 83.7% 82.7%
10,000-19,999 83.0% 82.2% 81.6% 86.2% 87.0%
20,000-29,999 79.9% 87.1% 85.6% 84.6% 93.3%
30,000-39,999 88.8% 87.3% 77.3% 91.3% 74.4%
40,000-49,999 94.3% 74.6% 94.3% 91.6% 70.2% 50,000+ 64.3% 74.9% 82.9% 87.7% 87.1%
0.0%
10.0%
20.0%
30.0%
40.0%
50.0%
60.0%
70.0%
80.0%
90.0%
100.0%
Co
rrel
atio
n C
oef
fici
ent
LYE Group
Graph 1.a: Correlation by Length of Lookback Period and LYE
5 Years 4 Years 3 Years 2 Years 1 Year

14
© 2018 Society of Actuaries
The correlation coefficients increase rapidly with increasing life years of exposure up to about 5,000
LYE, then they follow a less predictable pattern. Generally speaking, the correlations are higher for
shorter lookback periods. Note that the LYE groups are recalculated for each column in Table 1.a
based on the length of the lookback period. This test therefore implies that one year of experience
for a 4,000 life group demonstrates higher correlation than four years of experience for a 1,000 life
group. The results corresponding to the groups of 30,000 LYE and greater are more volatile because
exposure (i.e., the number of policies represented) in these segments is relatively low (see
Appendix for exposures and confidence intervals).

15
© 2018 Society of Actuaries
Test 1.b To see how results vary when correlations are based on case size rather than LYE, Test 1.a was
repeated and results were summarized by case size, which represents the number of covered
employees reported in the last year of the lookback period. These results are shown below.
Table 1.b: Correlation Coefficients by Length of Lookback Period and Case Size
Lookback period 5 Years 4 Years 3 Years 2 Years 1 Year
Subsequent period 2 Years 2 Years 2 Years 2 Years 2 Years
Case Size
0-99 10.5% 9.8% 8.9% 7.4% 5.1%
100-499 43.8% 41.0% 38.1% 34.3% 26.5% 500-999 62.6% 64.6% 63.3% 60.8% 49.1%
1,000-1,999 80.3% 78.6% 77.6% 74.5% 65.5%
2,000-2,999 83.2% 80.0% 78.3% 76.2% 70.3%
3,000-3,999 83.6% 85.7% 80.7% 80.0% 76.1%
4,000-4,999 78.3% 74.2% 85.0% 87.7% 84.7% 5,000-7,499 88.3% 85.5% 81.9% 81.3% 77.6%
7,500-9,999 83.5% 88.7% 84.8% 86.2% 83.4%
10,000-19,999 84.0% 86.2% 88.3% 86.5% 86.9%
20,000-29,999 94.4% 94.8% 95.6% 94.1% 93.2%
30,000-39,999 82.4% 69.8% 71.3% 63.1% 78.4% 40,000-49,999 N/A N/A 85.6% 69.4% 70.2%
50,000+ 15.9% 25.3% 63.9% 81.8% 88.0%
The patterns seen in Graph 1.a are reversed in Graph 1.b. When we switch to groupings by case
size, the 4,000 case size group now represents 4,000 LYE for the one-year lookback period, and
16,000 LYE for the four-year lookback period. In general, correlation coefficients in this test are
higher for smaller case sizes when the experience is based on a longer lookback period, which
0.0%
10.0%
20.0%
30.0%
40.0%
50.0%
60.0%
70.0%
80.0%
90.0%
100.0%
Co
rrel
atio
n C
oef
fici
ent
Case Size
Graph 1.b: Correlation by Length of Lookback Period and Case Size
5 Years 4 Years 3 Years 2 Years 1 Year
16
© 2018 Society of Actuaries
corresponds to higher LYE. Note that the exposure for larger case size segments is very low, and
the results for these groups are volatile.
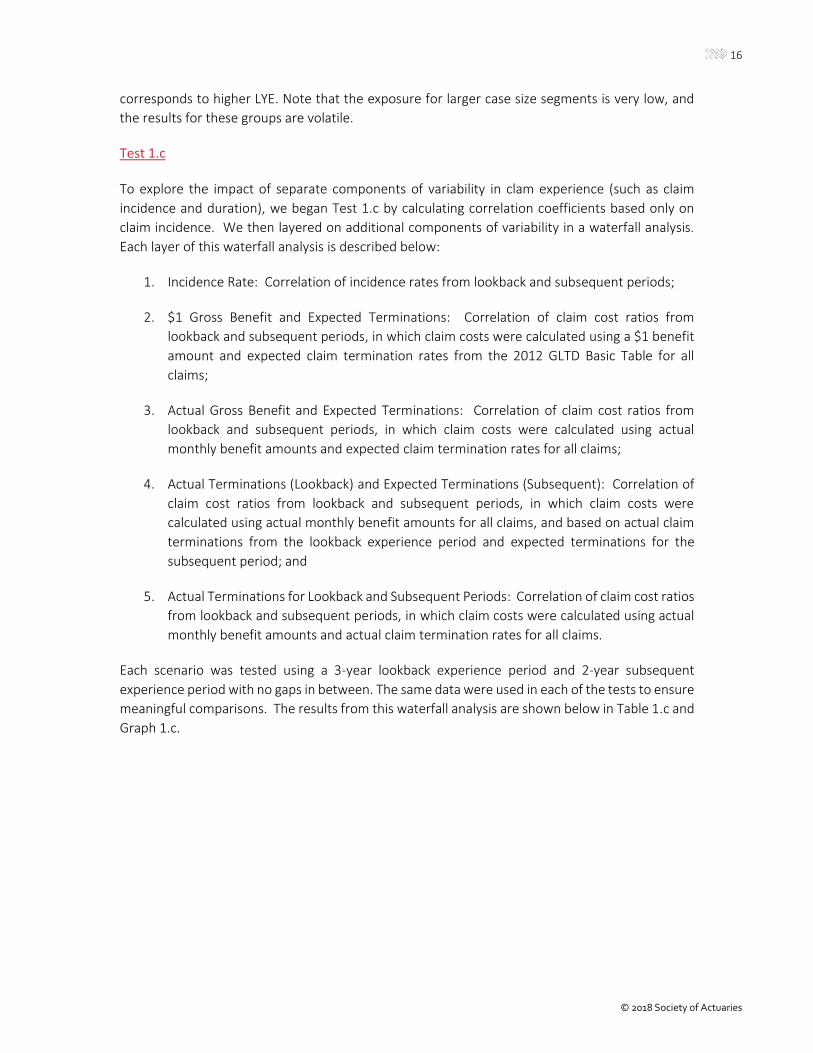
Test 1.c To explore the impact of separate components of variability in clam experience (such as claim
incidence and duration), we began Test 1.c by calculating correlation coefficients based only on
claim incidence. We then layered on additional components of variability in a waterfall analysis.
Each layer of this waterfall analysis is described below:
1. Incidence Rate: Correlation of incidence rates from lookback and subsequent periods;
2. $1 Gross Benefit and Expected Terminations: Correlation of claim cost ratios from
lookback and subsequent periods, in which claim costs were calculated using a $1 benefit
amount and expected claim termination rates from the 2012 GLTD Basic Table for all
claims;
3. Actual Gross Benefit and Expected Terminations: Correlation of claim cost ratios from
lookback and subsequent periods, in which claim costs were calculated using actual
monthly benefit amounts and expected claim termination rates for all claims;
4. Actual Terminations (Lookback) and Expected Terminations (Subsequent): Correlation of
claim cost ratios from lookback and subsequent periods, in which claim costs were
calculated using actual monthly benefit amounts for all claims, and based on actual claim
terminations from the lookback experience period and expected terminations for the
subsequent period; and
5. Actual Terminations for Lookback and Subsequent Periods: Correlation of claim cost ratios
from lookback and subsequent periods, in which claim costs were calculated using actual
monthly benefit amounts and actual claim termination rates for all claims.
Each scenario was tested using a 3-year lookback experience period and 2-year subsequent
experience period with no gaps in between. The same data were used in each of the tests to ensure
meaningful comparisons. The results from this waterfall analysis are shown below in Table 1.c and
Graph 1.c.

17
© 2018 Society of Actuaries
Table 1.c: Waterfall Analysis Correlation Coefficients Vary by Experience Basis and LYE Group
LYE Group
Experience Basis
Incidence Rate
$1 Gross and Expected Terms
Actual Gross and Expected
Terms
Actual and Expected
Terms
Actual Terms
0-99 12.9% 12.9% 6.7% 3.3% 1.9%
100-499 35.8% 30.8% 20.2% 13.6% 10.4%
500-999 58.8% 57.6% 43.2% 33.2% 29.0%
1,000-1,999 72.6% 68.4% 60.7% 55.7% 50.3%
2,000-2,999 77.8% 81.8% 65.8% 53.6% 51.2% 3,000-3,999 79.1% 88.5% 76.8% 65.9% 63.0%
4,000-4,999 86.1% 81.5% 78.4% 66.5% 67.3%
5,000-7,499 79.5% 81.5% 74.5% 68.4% 64.6%
7,500-9,999 93.4% 88.4% 83.3% 79.0% 80.3%
10,000-19,999 90.6% 86.2% 81.6% 66.8% 66.6% 20,000-29,999 89.0% 90.1% 85.6% 79.7% 76.7%
30,000-39,999 85.1% 83.2% 77.3% 65.7% 75.9%
40,000-49,999 97.7% 96.8% 94.3% 90.7% 92.3%
50,000+ 93.7% 79.6% 82.9% 78.5% 82.3%
When we look at the correlation coefficients calculated using incidence rates only, we see
coefficients in excess of 90% for many of the larger LYE groups. Adding expected terminations in
the “$1 Gross and Expected Terms” scenario decreases the correlation coefficients slightly for
many LYE groups, but does not appear to produce a significant drop, as the red and blue lines in
the table above are close to overlapping for many LYE groups. Including actual gross benefit
0.0%
10.0%
20.0%
30.0%
40.0%
50.0%
60.0%
70.0%
80.0%
90.0%
100.0%
Co
rrel
atio
n C
oef
fici
ent
LYE Group
Graph 1.c: Waterfall Analysis
Incidence Rate
$1 Gross and Expected Terms
Actual Gross and Expected Terms
Actual and Expected Terms
Actual Terms

18
© 2018 Society of Actuaries
amounts drops the correlation coefficients more significantly, generally producing coefficients
between 75% and 85% for most of the higher LYE groups. This suggests that variations in benefit
amounts among members of a group add volatility and reduce the credibility of LTD claim
experience. We observe another significant drop when we include the impact of actual claim
terminations in the lookback period, further suggesting that actual claim termination experience
also adds volatility and reduces credibility for LTD. In this scenario the correlation coefficients are
generally between 65% and 80% for most of the higher LYE groups. Finally, including actual claim
terminations in the subsequent period produces a relatively small change in the correlation
coefficients.

19
© 2018 Society of Actuaries
Test 2 Test 2 is aimed at evaluating whether a gap between the lookback and subsequent periods has an
impact on credibility. The correlation coefficients are shown below by LYE segment and length of
gap (i.e. no gap, 1 year, 2 years, 3 years and 4 years). Note that the length of the lookback period
is one year and the length of the subsequent period is two years in every case (in order to normalize
results).
Table 2: Variable Length of Time Between Lookback Period and Subsequent Period
Gap b/w Lookback Period and Subsequent Period
Four Years Three Years Two Years One Year No Gap
LYE
0-99 3.7% 4.8% 4.7% 4.8% 5.2%
100-499 22.7% 21.3% 24.1% 25.8% 28.2%
500-999 41.0% 38.3% 44.0% 48.5% 52.8%
1,000-1,999 60.8% 60.3% 59.0% 62.1% 66.6% 2,000-2,999 69.3% 69.7% 65.1% 68.6% 72.5%
3,000-3,999 75.2% 70.1% 71.6% 73.9% 76.1%
4,000-4,999 53.6% 58.8% 72.7% 77.4% 87.0%
5,000-7,499 58.6% 65.0% 73.2% 79.8% 81.0%
7,500-9,999 47.1% 72.2% 72.6% 78.5% 82.7%
10,000-19,999 65.4% 73.7% 77.5% 81.0% 87.0% 20,000-29,999 70.6% 81.7% 93.5% 92.3% 93.3%
30,000-39,999 N/A 89.5% 47.7% 48.6% 74.4%
40,000-49,999 -99.3% -16.4% 79.4% 65.1% 70.2%
50,000+ -48.9% 12.4% 53.0% 76.2% 87.1%
0.0%
10.0%
20.0%
30.0%
40.0%
50.0%
60.0%
70.0%
80.0%
90.0%
100.0%
Co
rrel
atio
n C
oef
fici
ent
LYE Group
Graph 2: Correlation by LYE and Gap Between Experience Periods
Four Years Three Years Two Years One Year No Gap

20
© 2018 Society of Actuaries
The correlation coefficients are higher and less volatile when there is either no gap or a 1-year gap
between the lookback and subsequent periods, suggesting that more recent experience may be
more credible than older experience. It is worth noting that exposure decreases significantly as the
length of the gap increases (see ’Test 2’ tab of the Appendix) which contributes, in part, to the
volatility in results corresponding to 3-year and 4-year gaps.

21
© 2018 Society of Actuaries
Test 3 A similar test was performed to evaluate whether recent experience demonstrates higher
correlation than older experience, in which the lookback period varies by calendar year (2004-2006
versus 2005-2007 versus 2006-2008 versus 2007-2009) and the subsequent period is always based
on experience from 2010-2011. The results from this test are shown below.
Table 3: Recent Experience versus Older Experience Subsequent Period = 2010–2011 in All Scenarios
Lookback period 2004-2006 2005-2007 2006-2008 2007-2009
Subsequent period 2010-2011 2010-2011 2010-2011 2010-2011
LYE
0-99 6.7% 6.4% 9.0% 8.3%
100-499 19.3% 23.8% 24.1% 19.8%
500-999 35.3% 36.1% 40.7% 43.9% 1,000-1,999 34.1% 51.1% 63.6% 60.6%
2,000-2,999 59.7% 68.7% 54.9% 71.4%
3,000-3,999 66.7% 64.8% 79.7% 75.9%
4,000-4,999 82.3% 83.9% 71.5% 77.5%
5,000-7,499 77.5% 78.7% 73.2% 67.7%
7,500-9,999 76.5% 80.9% 82.2% 82.4% 10,000-19,999 62.2% 70.9% 74.1% 82.0%
20,000-29,999 65.1% 88.8% 87.3% 86.3%
30,000-39,999 19.6% 63.2% 80.2% 80.9%
40,000-49,999 92.8% 95.2% 95.3% 85.3%
50,000+ 29.7% 35.9% 65.6% 81.7%
Once again, the results suggest that recent periods are more highly correlated with subsequent
experience than are older periods.
0.0%
10.0%
20.0%
30.0%
40.0%
50.0%
60.0%
70.0%
80.0%
90.0%
100.0%
Co
rrel
atio
n C
oef
fici
ent
LYE Group
Graph 3: Recent Experience versus Older Experience
2004-2006 2005-2007 2006-2008 2007-2009

22
© 2018 Society of Actuaries
Test 4 Test 4 was performed to evaluate differences in correlation coefficients by calendar period, using
experience from 2004 through 2011. Rolling 5-year periods were used in every case, with no gaps
between the 3-year lookback period and 2-year subsequent period.
Table 4: Rolling Five Year Experience Periods (Lookback Period = First Three Years, Subsequent Period = Next Two Years)
Lookback period 2004-2006 2005-2007 2006-2008 2007-2009
Subsequent period 2007-2008 2008-2009 2009-2010 2010-2011
LYE
0-99 5.4% 5.2% 7.8% 8.3%
100-499 19.7% 19.4% 22.0% 19.8% 500-999 44.9% 40.6% 44.1% 43.9%
1,000-1,999 54.8% 63.0% 65.6% 60.6%
2,000-2,999 66.9% 70.0% 55.5% 71.4%
3,000-3,999 74.2% 75.6% 80.4% 75.9%
4,000-4,999 81.2% 85.5% 71.6% 77.5%
5,000-7,499 73.8% 80.6% 80.0% 67.7%
7,500-9,999 86.5% 83.8% 83.3% 82.4%
10,000-19,999 81.6% 81.1% 81.4% 82.0%
20,000-29,999 79.1% 84.3% 88.6% 86.3%
30,000-39,999 75.7% 72.6% 78.8% 80.9%
40,000-49,999 92.5% 96.3% 98.8% 85.3%
50,000+ 96.8% 60.4% 85.0% 81.7%
Despite the economic recession in the U.S. which began in 2007, there do not appear to be material
differences in correlation coefficients by calendar period.
0.0%
10.0%
20.0%
30.0%
40.0%
50.0%
60.0%
70.0%
80.0%
90.0%
100.0%
Co
rrel
atio
n C
oef
fici
ent
LYE Group
Graph 4: Rolling 5-Year Experience Periods
2004-2008 2005-2009 2006-2010 2007-2011
23
© 2018 Society of Actuaries
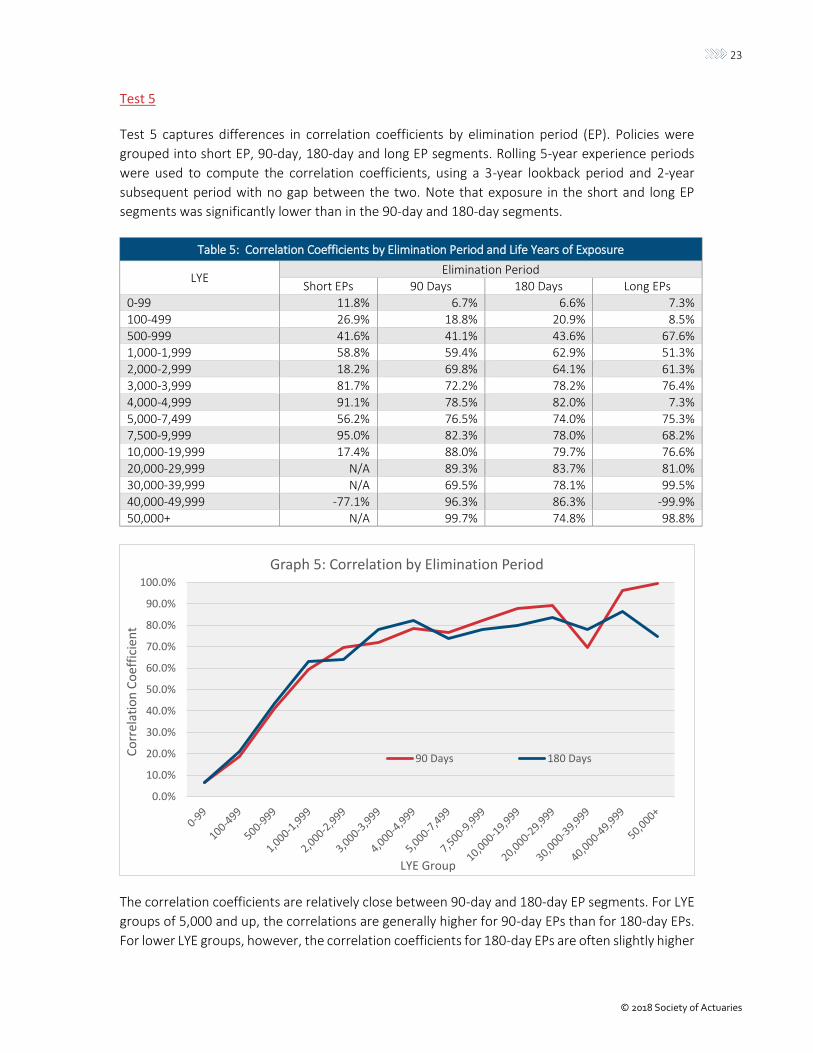
Test 5 Test 5 captures differences in correlation coefficients by elimination period (EP). Policies were
grouped into short EP, 90-day, 180-day and long EP segments. Rolling 5-year experience periods
were used to compute the correlation coefficients, using a 3-year lookback period and 2-year
subsequent period with no gap between the two. Note that exposure in the short and long EP
segments was significantly lower than in the 90-day and 180-day segments.
Table 5: Correlation Coefficients by Elimination Period and Life Years of Exposure
LYE Elimination Period
Short EPs 90 Days 180 Days Long EPs
0-99 11.8% 6.7% 6.6% 7.3%
100-499 26.9% 18.8% 20.9% 8.5%
500-999 41.6% 41.1% 43.6% 67.6% 1,000-1,999 58.8% 59.4% 62.9% 51.3%
2,000-2,999 18.2% 69.8% 64.1% 61.3%
3,000-3,999 81.7% 72.2% 78.2% 76.4%
4,000-4,999 91.1% 78.5% 82.0% 7.3%
5,000-7,499 56.2% 76.5% 74.0% 75.3% 7,500-9,999 95.0% 82.3% 78.0% 68.2%
10,000-19,999 17.4% 88.0% 79.7% 76.6%
20,000-29,999 N/A 89.3% 83.7% 81.0%
30,000-39,999 N/A 69.5% 78.1% 99.5%
40,000-49,999 -77.1% 96.3% 86.3% -99.9%
50,000+ N/A 99.7% 74.8% 98.8%
The correlation coefficients are relatively close between 90-day and 180-day EP segments. For LYE
groups of 5,000 and up, the correlations are generally higher for 90-day EPs than for 180-day EPs.
For lower LYE groups, however, the correlation coefficients for 180-day EPs are often slightly higher
0.0%
10.0%
20.0%
30.0%
40.0%
50.0%
60.0%
70.0%
80.0%
90.0%
100.0%
Co
rrel
atio
n C
oef
fici
ent
LYE Group
Graph 5: Correlation by Elimination Period
90 Days 180 Days

24
© 2018 Society of Actuaries
than those for 90-day EPs. In general, we would have expected to see higher correlation
coefficients for groups with 90-day EPs versus groups with 180-day EPs because, all else being
equal, the number of expected claims is higher for shorter EPs. It may be that other plan design
differences within each EP segment are confounding the results, or that the differences in claim
incidence by EP are not large enough among the LYE groups to produce significantly different
expected claims to affect the correlation coefficients.

25
© 2018 Society of Actuaries
Test 6.a For Test 6.a, the correlation coefficients are summarized below by industry group. Rolling 5-year
experience periods were used to compute the coefficients, using a 3-year lookback period and 2-
year subsequent period with no gap between the two. Note that certain industries have
significantly lower exposure than others (e.g. legal services—see tab ‘Test 6.a’ of the Appendix).
Table 6.a.1 Correlation Coefficients by Industry and Life Years of Exposure
LYE
Industry
Finance, Insurance, and Real
Estate
Manufacturing Other
Services
Retail and Wholesale
Trade
Legal Services
0-99 4.8% 8.4% 7.6% 6.8% -1.0%
100-499 8.4% 28.0% 12.4% 14.9% 7.4%
500-999 44.0% 48.1% 33.3% 34.4% -2.4%
1,000-1,999 35.0% 70.7% 36.2% 53.0% 8.2%
2,000-2,999 30.7% 70.6% 58.1% 41.9% 14.8%
3,000-3,999 50.3% 76.3% 68.7% 78.2% 43.9%
4,000-4,999 51.4% 72.9% 74.4% 87.9% 37.6%
5,000-7,499 49.3% 71.7% 81.7% 79.4% 64.9%
7,500-9,999 32.7% 72.0% 79.8% 86.3% -6.1%
10,000-19,999 51.9% 80.2% 84.3% 92.7% N/A
20,000-29,999 63.2% 79.2% 91.9% 77.1% N/A
30,000-39,999 54.7% 79.6% -37.2% 99.3% N/A 40,000-49,999 89.0% 97.6% 96.7% N/A N/A
50,000+ 71.6% 75.8% 94.8% 88.8% N/A
Table 6.a.2 Correlation Coefficients by Industry and Life Years of Exposure
LYE
Industry Agriculture,
Forestry, Fishing, Mining,
Construction
Healthcare Services
Transportation, Communication,
Utilities
Educational Services
Public Administration
Overall
0-99 6.8% 7.4% 17.6% 11.8% -0.7% 6.7%
100-499 23.9% 12.8% 41.0% 20.4% 28.8% 20.2%
500-999 48.5% 30.9% 69.1% 29.8% 35.4% 43.2%
1,000-1,999 73.6% 65.9% 74.6% 49.8% 72.3% 60.7% 2,000-2,999 61.1% 63.4% 70.2% 71.4% 79.0% 65.8%
3,000-3,999 69.8% 65.1% 84.8% 64.4% 67.4% 76.8%
4,000-4,999 91.3% 55.1% 71.7% 61.2% 93.7% 78.4%
5,000-7,499 53.3% 62.0% 75.0% 51.9% 85.4% 74.5%
7,500-9,999 82.2% 59.7% 83.6% 90.6% 78.1% 83.3% 10,000-19,999 86.0% 81.9% 86.8% 93.1% 84.6% 81.6%
20,000-29,999 N/A 80.1% 95.4% -67.3% -95.7% 85.6%
30,000-39,999 -49.3% 67.7% 98.8% 98.3% N/A 77.3%
40,000-49,999 N/A 53.5% 99.7% 52.5% 100.0% 94.3%
50,000+ N/A 10.1% 6.7% N/A 97.2% 82.9%

26
© 2018 Society of Actuaries
The correlations are relatively low for policies in the Finance, Insurance, and Real Estate segment relative to the other industries. On the other hand, correlation coefficients are relatively high for groups in the Transportation, Communication, and Utilities segment, especially for smaller sized cases. Test 6.b The results corresponding to the Finance, Insurance, and Real Estate segment may be driven, in
part, by greater variability in benefit amounts and/or a higher prevalence of large outlier claims,
since these industries tend to exhibit greater disparity among employee wages. When the claim
costs were restated in Test 6.b using a $1 gross benefit amount for all claims in every industry—
thereby neutralizing the impact of variable benefit amounts—the correlation coefficients are
generally higher and more uniform across the industry segments. For example, results
corresponding to the Finance, Insurance, and Real Estate segment are more similar to other
industries when based on uniform benefit amounts, as shown in the following tables.
0.0%
10.0%
20.0%
30.0%
40.0%
50.0%
60.0%
70.0%
80.0%
90.0%
100.0%C
orr
elat
ion
Co
effi
cien
t
LYE Group
Graph 6.a: Correlation by Industry
Finance, Insurance, and Real Estate
Manufacturing
Healthcare Services
Transportation, Communication, Utilities
Overall Correlation

27
© 2018 Society of Actuaries
Table 6.b.1 Correlation Coefficients by Industry and Life Years of Exposure
LYE
Industry $1 Gross
Finance, Insurance, and Real
Estate
Manufacturing Other
Services
Retail and Wholesale
Trade
Legal Services
0-99 9.4% 15.6% 12.9% 12.9% 3.7%
100-499 16.9% 35.2% 24.5% 23.0% 10.8%
500-999 52.0% 60.3% 50.6% 49.2% 20.2%
1,000-1,999 60.0% 68.7% 64.2% 69.8% 31.7%
2,000-2,999 64.3% 75.0% 67.8% 64.5% 42.3%
3,000-3,999 74.5% 80.8% 78.9% 84.3% 86.3%
4,000-4,999 68.5% 72.2% 84.4% 89.8% 90.5%
5,000-7,499 68.9% 78.4% 85.5% 87.2% 80.0%
7,500-9,999 63.2% 86.9% 92.2% 87.3% 46.5%
10,000-19,999 85.5% 87.5% 92.7% 90.8% N/A
20,000-29,999 79.6% 87.2% 91.5% 87.6% N/A
30,000-39,999 79.6% 77.6% -74.1% 99.3% N/A
40,000-49,999 93.7% 99.1% 97.3% N/A N/A
50,000+ 71.0% 87.2% 96.7% 84.9% N/A
Table 6.b.2 Correlation Coefficients by Industry and Life Years of Exposure
LYE
Industry $1 Gross
Agriculture, Forestry, Fishing, Mining,
Construction
Healthcare Services
Transportation, Communication,
Utilities
Educational Services
Public Administration
Overall
0-99 10.5% 14.6% 21.2% 13.7% 3.7% 12.9%
100-499 30.3% 35.5% 44.3% 30.9% 38.0% 30.8% 500-999 66.2% 57.5% 66.8% 39.9% 45.0% 57.6%
1,000-1,999 75.9% 61.8% 67.7% 71.2% 71.0% 68.4%
2,000-2,999 84.6% 79.7% 75.6% 84.7% 77.4% 81.8%
3,000-3,999 86.5% 69.7% 91.1% 65.6% 71.7% 88.5%
4,000-4,999 84.2% 76.0% 77.4% 60.6% 88.7% 81.5%
5,000-7,499 73.6% 75.6% 73.5% 65.4% 90.4% 81.5% 7,500-9,999 89.7% 74.0% 79.1% 92.8% 91.1% 88.4%
10,000-19,999 91.2% 87.4% 78.7% 96.6% 74.4% 86.2%
20,000-29,999 N/A 83.0% 97.1% -17.7% -97.9% 90.1%
30,000-39,999 -80.9% 83.5% 96.7% 89.8% N/A 83.2%
40,000-49,999 N/A 77.8% 99.7% 75.7% 100.0% 96.8% 50,000+ N/A 90.7% 11.8% N/A 96.1% 79.6%

28
© 2018 Society of Actuaries
0.0%
10.0%
20.0%
30.0%
40.0%
50.0%
60.0%
70.0%
80.0%
90.0%
100.0%
Co
rrel
atio
n C
oef
fici
ent
LYE Group
Graph 6.b: Correlation by Industry $1 Gross
Finance, Insurance, and Real Estate
Manufacturing
Healthcare Services
Transportation, Communication, Utilities
Overall Correlation

29
© 2018 Society of Actuaries
Test 7 Test 7 captures differences across geographical region, based on the situs state of the policyholder.
Rolling 5-year experience periods were used to compute the coefficients, using a 3-year lookback
period and 2-year subsequent period with no gap between the two. The results are shown below.
Table 7: Correlation Coefficients by Region and Life Years of Exposure
LYE Region
East West South Central South Central
0-99 9.6% 5.2% 7.6% 4.5% 9.9%
100-499 19.9% 15.8% 20.6% 20.3% 22.7%
500-999 46.5% 25.5% 48.0% 42.5% 49.2% 1,000-1,999 68.5% 49.5% 70.9% 40.0% 72.4%
2,000-2,999 61.4% 43.7% 69.4% 62.8% 87.4%
3,000-3,999 74.3% 62.7% 79.0% 75.0% 61.1%
4,000-4,999 85.8% 88.3% 63.6% 49.5% 78.1%
5,000-7,499 72.0% 74.3% 76.2% 71.6% 80.7% 7,500-9,999 64.1% 72.9% 85.6% 81.7% 72.5%
10,000-19,999 82.7% 79.7% 91.3% 87.9% 78.6%
20,000-29,999 89.4% 85.8% 87.3% 80.6% 66.1%
30,000-39,999 94.1% 91.4% 84.4% 86.7% N/A
40,000-49,999 95.1% 86.5% 97.6% 95.2% N/A 50,000+ 78.3% 82.4% 97.6% 94.6% 82.7%
The correlation coefficients are much lower for groups located in the West region with lower LYE
(less than 4,000 LYE). Note that we have not attempted to normalize for industry or other mixes,
which could be potential contributors to the observed differences by region.
0.0%
10.0%
20.0%
30.0%
40.0%
50.0%
60.0%
70.0%
80.0%
90.0%
100.0%
Co
rrel
atio
n C
oef
fici
ent
LYE Group
Graph 7: Correlation by Region
East West South Central South Central

30
© 2018 Society of Actuaries
Test 8.a For Test 8, policies were grouped based on LTD claim incidence rates in the lookback period—i.e. less than 4 per 1,000; 4 to 8 per 1,000; and greater than 8 per 1,000. The results from this test are shown below.
Table 8.a Correlation Coefficients by Incidence Rate per 1,000
Incidence Rate Less than 4 per 1,000 4 to 8 per 1,000 Greater than 8 per 1,000
Life Years of Exposure
Sample Size
Correlation Coefficient
Sample Size
Correlation Coefficient
Sample Size
Correlation Coefficient
0-99 0 N/A 0 N/A 11,362 6.5%
100-499 3,339 6.6% 7,795 6.7% 7,470 21.8%
500-999 3,218 7.7% 1,690 16.0% 874 53.4%
1,000-1,999 2,431 38.4% 1,106 35.8% 453 67.8%
2,000-2,999 992 30.1% 427 35.3% 149 70.5%
3,000-3,999 496 43.3% 294 46.8% 95 80.8%
4,000-4,999 348 45.8% 178 57.0% 61 75.7%
5,000-7,499 463 51.2% 274 48.1% 80 59.7%
7,500-9,999 240 48.3% 146 64.6% 52 82.5%
10,000-19,999 318 52.9% 199 39.8% 78 86.1%
20,000-29,999 111 71.5% 64 75.3% 9 83.6%
30,000-39,999 43 68.5% 33 53.1% 5 33.1%
40,000-49,999 25 86.7% 11 71.7% 6 90.5%
50,000+ 59 80.7% 34 71.5% 6 15.0%
Correlation coefficients are significantly higher for groups whose experience included higher
incidence rates (greater than 8 per 1,000), suggesting that LTD claim incidence may be an
important driver of credibility. This result illustrates the relationship we expected to see reflected
in the comparison by EP (Test 5), though the results by EP were less striking due to the possible
reasons discussed earlier.
0%
10%
20%
30%
40%
50%
60%
70%
80%
90%
100%
Co
rrel
atio
n C
oef
fici
ent
LYE Group
Graph 8.a: Correlation by Incidence Rate and LYE
Less than 4 per 1,000 4 to 8 per 1,000 Greater than 8 per 1,000

31
© 2018 Society of Actuaries
Test 8.b The results from the prior test were summarized by claim count rather than LYE segment in the
following table and graph.
Table 8.b Correlation Coefficients by Incidence Rate per 1,000
Incidence Rate Less than 4 per 1,000 4 to 8 per 1,000 Greater than 8 per 1,000
Claim Count Sample
Size Correlation Coefficient
Sample Size
Correlation Coefficient
Sample Size
Correlation Coefficient
1 5,447 10.6% 5,638 6.5% 11,689 3.9%
2-5 4,211 27.8% 3,842 9.9% 6,824 14.3%
6-10 1,095 35.8% 1,046 37.8% 1,009 44.9%
11-20 640 39.0% 707 35.3% 525 71.0%
21-30 256 59.2% 322 53.9% 193 80.7%
31-40 136 70.4% 197 49.2% 113 74.5%
41-50 86 58.6% 120 61.7% 66 86.0% 51-75 83 78.7% 139 48.0% 106 88.2%
76-100 40 54.1% 79 46.9% 48 77.8% 101-150 47 73.7% 69 49.8% 52 72.5%
151-200 18 79.7% 39 77.6% 36 89.7%
201-300 14 59.4% 33 82.8% 15 78.5%
301-500 8 50.7% 7 96.0% 13 93.5%
501+ 2 100.0% 13 61.4% 11 95.0%
Measuring the correlation coefficients using claim count rather than LYE decreases the extent of
the differences by claim incidence rate. This suggests that measuring credibility using an
alternative to LYE such as actual or expected claims may provide a more consistent credibility basis.
Alternative credibility methods will be discussed in more detail in Stage 2 of this study.
0%
10%
20%
30%
40%
50%
60%
70%
80%
90%
100%
Co
rrel
atio
n C
oef
fici
ent
Claim Count
Graph 8.b: Correlation by Incidence Rate and Claim Count
Less than 4 per 1,000 4 to 8 per 1,000 Greater than 8 per 1,000

32
© 2018 Society of Actuaries
Test 9
In Test 9, the correlation coefficients were segmented by funding method (i.e. 100% employer-
paid, 100% employee-paid and partially employee paid). Rolling 5-year experience periods were
used to compute the coefficients, using a 3-year lookback period and 2-year subsequent period
with no gap between the two. The results are shown below.
Table 9 Correlation Coefficients by Funding Method and Life Years of Exposure
LYE Funding Method
100% ER Paid Partially EE Paid 100% EE Paid
0-99 5.2% 5.1% 11.6%
100-499 15.0% 22.8% 23.1%
500-999 29.7% 62.6% 50.9%
1,000-1,999 48.7% 58.1% 66.3% 2,000-2,999 59.0% 79.2% 63.7%
3,000-3,999 67.0% 80.1% 79.5%
4,000-4,999 64.6% 80.2% 87.0%
5,000-7,499 73.3% 78.3% 65.0%
7,500-9,999 81.6% 78.2% 82.4% 10,000-19,999 80.2% 73.3% 88.6%
20,000-29,999 88.5% 86.3% 83.6%
30,000-39,999 79.4% 77.7% 78.6%
40,000-49,999 95.5% 94.7% 94.0%
50,000+ 81.7% 90.7% 87.5%
0.0%
10.0%
20.0%
30.0%
40.0%
50.0%
60.0%
70.0%
80.0%
90.0%
100.0%
Co
rrel
atio
n C
oef
fici
ent
LYE Group
Graph 9: Correlation by Funding Method
100% ER Paid Partially EE Paid 100% EE Paid

33
© 2018 Society of Actuaries
The coefficients tend to be higher for GLTD experience corresponding to coverage that is either
partially or 100% employee-paid. This dynamic could be due, in part, to higher claim incidence rates
often observed on contributory policies.
Test 10 Test 10 compares correlation coefficients between LTD policies integrated with STD coverage from
the same carrier and non-integrated policies. Rolling 5-year experience periods were used to
compute the coefficients, using a 3-year lookback period and 2-year subsequent period with no
gap between the two. The results are shown below.
Table 10 Correlation Coefficients by Integration Type and Life Years of Exposure
LYE Integration Type
Non-Integrated Integrated
0-99 4.1% 9.5%
100-499 16.7% 20.6%
500-999 41.8% 42.9% 1,000-1,999 55.2% 65.7%
2,000-2,999 69.7% 61.0%
3,000-3,999 79.2% 73.0%
4,000-4,999 79.5% 76.8%
5,000-7,499 76.8% 71.7% 7,500-9,999 88.8% 71.6%
10,000-19,999 82.1% 81.0%
20,000-29,999 79.2% 86.3%
30,000-39,999 82.9% 73.2%
40,000-49,999 92.9% 95.7% 50,000+ 97.5% 75.4%
The coefficients are relatively close for both segments.
0.0%
10.0%
20.0%
30.0%
40.0%
50.0%
60.0%
70.0%
80.0%
90.0%
100.0%
Co
rrel
atio
n C
oef
fici
ent
LYE Group
Graph 10: Correlation by STD Integration Type
Non-Integrated Integrated

34
© 2018 Society of Actuaries
Section 5: Relative Error Analysis
5.1 Analytical Methods
Credibility is used in the LTD case underwriting process to determine how much weight should be assigned to prior experience versus a carrier’s overall block experience or manual rate when estimating future claims experience. When we use prior experience to predict future experience, how much error is inherent in our prediction? In LTD, one variable that is believed to reduce the error in our prediction is life years of exposure (LYE). The relative error approach measures this error directly to determine how increasing LYE affects the error in our prediction. For this purpose, we assume that our predicted claim cost is exactly equal to our historical claim cost. In other words, we assume a credibility factor of 100%. The error is then the difference between historical claim costs (CC1) and subsequent claim costs (CC2). We calculated claim costs using the same method as described in Section 3, using gross benefit and expected terminations based on the 2012 GLTD Basic Table. Relative error is calculated as the absolute value difference between CC1 and CC2, all divided by CC1. (Dividing by CC1 makes our error measure unitless). For example, if we have CC1 = 0.50% and CC2 = 0.55%, then our relative error is |0.55-0.50|/0.50 = 10%. The actual CC2 of 0.55% was 10% higher than our estimate of CC2, so our relative error is 10%. Next we grouped the data by LYE group to observe how the average relative error changes as LYE increases. A limitation of the method described above is that CC1 must be nonzero. For a significant number of policies, especially in the lower LYE groups, there are no claims in the lookback period so CC1 is often zero. Excluding these records leads to significant data loss, and may bias the results from this method. For larger LYE groups however, there are very few, if any, policies with zero claims in the lookback period. We also applied an alternative method in which we replaced CC1 with an expected claim cost measure. This eliminates the need to exclude records since expected claim costs will never be zero when exposure is nonzero, and also gets us closer to how credibility is used in practice with a manual rate. We tested two alternative expected claim cost measures. First, we calculated the overall expected claim costs based on the average claim costs for the entire data set. Specifically, E(CC1) is equal to the total present value of future benefits for all policy records included in the study, divided by the total covered payroll for all policy records included in the study. We excluded records with unknown elimination periods or industry data, since these fields are used in a later step. In order to refine the expected claim cost measure to more closely resemble a “manual” rate, we calculated alternative expected claim costs which vary by case size, elimination period, industry group, definition of disability, and employer-paid vs. voluntary. This refined expected claim cost measure does not take into account many important rating variables such as age and gender mix, which was not available in the study data. A true manual rate would likely produce different results than what is reflected in this study.

35
© 2018 Society of Actuaries
To summarize, we ran the following tests related to relative error analysis:
Test 11 - Calculate average relative error at the policy level, where relative error = |CC1-CC2|/CC1. Policies for which CC1 = 0 are excluded from the study.
Test 12 – Calculate average relative error using a single expected claim cost measure, where relative error = |(E(CC1)-CC2)|/E(CC1).
Test 13 – Similar to Test 12, but using a more refined expected claim cost which varies by
several key variables.
The results of these tests are discussed in Section 5.2.
36
© 2018 Society of Actuaries
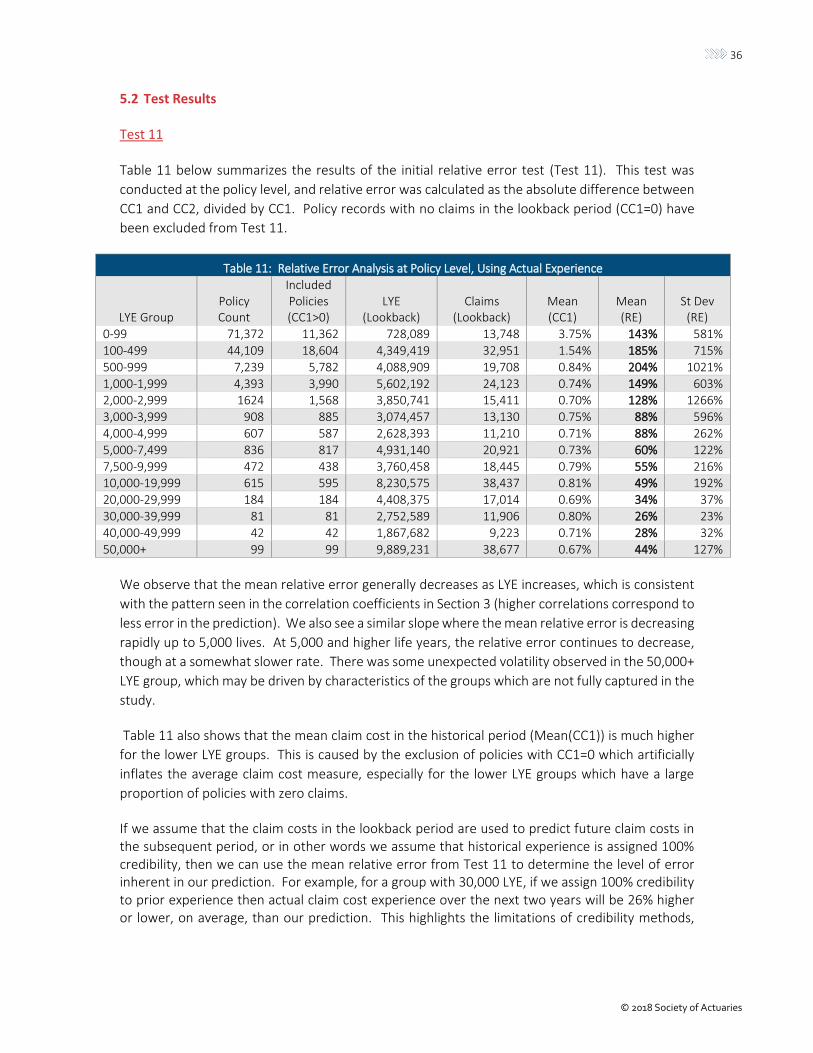
5.2 Test Results Test 11 Table 11 below summarizes the results of the initial relative error test (Test 11). This test was
conducted at the policy level, and relative error was calculated as the absolute difference between
CC1 and CC2, divided by CC1. Policy records with no claims in the lookback period (CC1=0) have
been excluded from Test 11.
Table 11: Relative Error Analysis at Policy Level, Using Actual Experience
LYE Group
Policy Count
Included Policies (CC1>0)
LYE
(Lookback)
Claims
(Lookback)
Mean (CC1)
Mean (RE)
St Dev
(RE)
0-99 71,372 11,362 728,089 13,748 3.75% 143% 581%
100-499 44,109 18,604 4,349,419 32,951 1.54% 185% 715%
500-999 7,239 5,782 4,088,909 19,708 0.84% 204% 1021%
1,000-1,999 4,393 3,990 5,602,192 24,123 0.74% 149% 603% 2,000-2,999 1624 1,568 3,850,741 15,411 0.70% 128% 1266%
3,000-3,999 908 885 3,074,457 13,130 0.75% 88% 596%
4,000-4,999 607 587 2,628,393 11,210 0.71% 88% 262%
5,000-7,499 836 817 4,931,140 20,921 0.73% 60% 122%
7,500-9,999 472 438 3,760,458 18,445 0.79% 55% 216% 10,000-19,999 615 595 8,230,575 38,437 0.81% 49% 192%
20,000-29,999 184 184 4,408,375 17,014 0.69% 34% 37%
30,000-39,999 81 81 2,752,589 11,906 0.80% 26% 23%
40,000-49,999 42 42 1,867,682 9,223 0.71% 28% 32%
50,000+ 99 99 9,889,231 38,677 0.67% 44% 127%
We observe that the mean relative error generally decreases as LYE increases, which is consistent
with the pattern seen in the correlation coefficients in Section 3 (higher correlations correspond to
less error in the prediction). We also see a similar slope where the mean relative error is decreasing
rapidly up to 5,000 lives. At 5,000 and higher life years, the relative error continues to decrease,
though at a somewhat slower rate. There was some unexpected volatility observed in the 50,000+
LYE group, which may be driven by characteristics of the groups which are not fully captured in the
study.
Table 11 also shows that the mean claim cost in the historical period (Mean(CC1)) is much higher
for the lower LYE groups. This is caused by the exclusion of policies with CC1=0 which artificially
inflates the average claim cost measure, especially for the lower LYE groups which have a large
proportion of policies with zero claims.
If we assume that the claim costs in the lookback period are used to predict future claim costs in the subsequent period, or in other words we assume that historical experience is assigned 100% credibility, then we can use the mean relative error from Test 11 to determine the level of error inherent in our prediction. For example, for a group with 30,000 LYE, if we assign 100% credibility to prior experience then actual claim cost experience over the next two years will be 26% higher or lower, on average, than our prediction. This highlights the limitations of credibility methods,

37
© 2018 Society of Actuaries
and the volatility inherent in LTD claim data, even for the largest of groups and may reflect the impact of experience drift, or movement in the underlying “true” expected claims. Test 12 Table 12.a contains the results from Test 12, which uses overall expected claim costs for the entire
data set in place of CC1 in the relative error formula. This is conceptually representative of using a
single manual rate as the claim cost predictor, with no credibility given to experience for any
particular policy. Policies with missing elimination period or industry information have been
excluded from Test 12 and Test 13.
Table 12.a: Relative Error Analysis Using E(CC1) as Predictor
LYE Group
Policy Count
Included Policies
LYE
(Lookback)
Claims
(Lookback)
Mean (CC1)
Mean (RE)
St Dev
(RE)
0-99 71,372 54,566 3,153,435 10,569 0.61% 181% 398%
100-499 44,109 34,643 7,112,403 26,562 0.67% 156% 230% 500-999 7,239 5,925 4,153,882 16,316 0.70% 107% 125%
1,000-1,999 4,393 3,469 4,841,767 19,753 0.70% 90% 128%
2,000-2,999 1624 1,292 3,169,095 12,483 0.68% 78% 91%
3,000-3,999 908 741 2,573,966 11,162 0.76% 76% 84%
4,000-4,999 607 468 2,096,553 9,088 0.74% 71% 81%
5,000-7,499 836 685 4,131,748 17,333 0.72% 67% 69% 7,500-9,999 472 339 2,895,259 12,281 0.74% 62% 71%
10,000-19,999 615 481 6,630,299 30,701 0.79% 63% 77%
20,000-29,999 184 160 3,848,223 15,406 0.71% 54% 53%
30,000-39,999 81 67 2,274,812 9,469 0.74% 52% 55%
40,000-49,999 42 35 1,550,023 7,731 0.68% 61% 60% 50,000+ 99 80 6,906,168 23,236 0.64% 42% 40%
Table 12.b compares the results from Test 11 and Test 12.
Table 12.b: Comparison of Average Relative Error for Tests 11 and 12
LYE Group
Mean (RE)
Test 11 Test 12
0-99 143% 181%
100-499 185% 156%
500-999 204% 107% 1,000-1,999 149% 90%
2,000-2,999 128% 78%
3,000-3,999 88% 76%
4,000-4,999 88% 71%
5,000-7,499 60% 67% 7,500-9,999 55% 62%
10,000-19,999 49% 63%
20,000-29,999 34% 54%
30,000-39,999 26% 52%
40,000-49,999 28% 61%
50,000+ 44% 42%

38
© 2018 Society of Actuaries
When we compare the results of Test 12 with those from Test 11 we see that for groups with fewer
than 5,000 LYE, Test 12 generally produced lower relative error. For these lower LYE groups, then,
the overall average (expected) claim cost was a better predictor of future experience than the
group’s own experience. At and above 5,000 LYE, however, relative error is lower for Test 11,
meaning that for these groups their own claim experience is a more accurate predictor, on average,
than overall expected claim costs. Again, results for the largest LYE group (50,000+ lives) are
anomalous.

39
© 2018 Society of Actuaries
Test 13 Test 13 uses a more refined expected claim cost assumption that is still calculated based on average
experience for the entire block but varies by several key variables which seemed to drive claim cost
differences, including case size, elimination period, industry, definition of disability, and funding
method (employer-paid versus employee-paid). Results under Test 13 are shown below.
Table 13.a: Relative Error Analysis Using Refined E(CC1) as Predictor
LYE Group
Policy Count
Included Policies
LYE
(Lookback)
Claims
(Lookback)
Mean (CC1)
Mean (RE)
St Dev
(RE) 0-99 71,372 54,533 3,153,435 10,569 0.61% 191% 461%
100-499 44,109 34,616 7,112,403 26,562 0.67% 157% 237%
500-999 7,239 5,924 4,153,882 16,316 0.70% 101% 112%
1,000-1,999 4,393 3,469 4,841,767 19,753 0.70% 81% 93%
2,000-2,999 1624 1,292 3,169,095 12,483 0.68% 69% 80% 3,000-3,999 908 741 2,573,966 11,162 0.76% 65% 67%
4,000-4,999 607 468 2,096,553 9,088 0.74% 58% 53%
5,000-7,499 836 684 4,131,748 17,333 0.72% 56% 59%
7,500-9,999 472 339 2,895,259 12,281 0.74% 51% 59%
10,000-19,999 615 481 6,630,299 30,701 0.79% 52% 73% 20,000-29,999 184 160 3,848,223 15,406 0.71% 48% 68%
30,000-39,999 81 67 2,274,812 9,469 0.74% 60% 74%
40,000-49,999 42 35 1,550,023 7,731 0.68% 35% 27%
50,000+ 99 80 6,906,168 23,236 0.64% 40% 32%
Table 13.b compares the results from Tests 11, 12 and 13.
Table 13.b: Comparison of Average Relative Error for Tests 11, 12 and 13
LYE Group
Mean (RE)
Test 11 Test 12 Test 13
0-99 143% 181% 191% 100-499 185% 156% 157%
500-999 204% 107% 101%
1,000-1,999 149% 90% 81%
2,000-2,999 128% 78% 69%
3,000-3,999 88% 76% 65% 4,000-4,999 88% 71% 58%
5,000-7,499 60% 67% 56%
7,500-9,999 55% 62% 51%
10,000-19,999 49% 63% 52%
20,000-29,999 34% 54% 48% 30,000-39,999 26% 52% 60%
40,000-49,999 28% 61% 35%
50,000+ 44% 42% 40%
Using the new, refined expected claim cost as our predictor in Test 13 has improved results, relative
to Test 12 (i.e., average relative error is lower for most LYE segments), suggesting that improving
the refinement of manual rates leads to a better ability to predict claim costs. There is some

40
© 2018 Society of Actuaries
volatility, such as for LYE group 30,000-39,999. Average experience is clearly a better predictor for
groups with less than 5,000 LYE, the two become relatively evenly-matched for groups between
5,000 and 19,999 LYE, and for groups with 20,000 or more LYE the group’s own experience
becomes the better predictor.
Additional Test – Test 14 Test 11 uses actual historical claim cost experience to predict subsequent experience, which
essentially assigns prior experience 100% credibility. Test 13, on the other hand, uses average claim
cost experience for the dataset as a whole, which can be loosely defined as a proxy for a manual
rate (albeit with some key rating variables ignored). Test 13 can therefore be interpreted as
assigning a credibility factor of 0. We can then use these two relative error approaches to explore
optimal credibility weighting factors which would minimize the relative error of our predictions for
each LYE group. Table 14 shows the relative error for each LYE group, with different credibility
factors assigned to the historical experience. In this table, “experience rate” refers to the historical
claim costs for each policy, CC1, and “manual rate” refers to the refined expected claim costs
calculated using average experience from the entire data set (Test 13 approach).
Table 14: Relative Error Analysis Using Case Rate as Predictor Case Rate = (1 – Z) x Manual Rate + Z x Experience Rate
LYE Group Credibility Factor Z Assigned to the Experience
0% 10% 20% 30% 40% 50% 60% 70% 80% 90% 100%
0-99 191% 191% 199% 212% 231% 258% 300% 370% 511% 935% N/A
100-499 157% 153% 156% 163% 174% 191% 217% 262% 351% 618% N/A
500-999 101% 97% 96% 97% 100% 105% 114% 129% 158% 238% N/A
1,000-1,999 81% 76% 73% 72% 72% 73% 77% 83% 95% 126% 142% 2,000-2,999 69% 65% 61% 60% 59% 59% 60% 63% 69% 82% 137%
3,000-3,999 65% 59% 55% 52% 50% 49% 48% 49% 51% 56% 68%
4,000-4,999 58% 53% 50% 47% 46% 45% 46% 48% 51% 58% 70%
5,000-7,499 56% 53% 49% 46% 44% 42% 42% 42% 43% 47% 56%
7,500-9,999 51% 47% 43% 41% 40% 39% 39% 39% 41% 45% 60% 10,000-19,999 52% 45% 40% 37% 35% 33% 32% 32% 33% 36% 49%
20,000-29,999 48% 41% 37% 33% 31% 29% 28% 27% 28% 28% 31%
30,000-39,999 60% 51% 45% 40% 35% 32% 29% 27% 25% 24% 25%
40,000-49,999 35% 33% 31% 29% 28% 27% 27% 26% 26% 27% 29%
50,000+ 40% 37% 33% 31% 28% 27% 25% 24% 23% 23% 24%
The values in bold from the table above represent the lowest relative error for each LYE group. We
can see that for lower LYE groups, a lower credibility factor is found to minimize error, and as we
increase LYE, the credibility factor which minimizes the error in our predictions increases. This is
consistent with our current understanding of credibility. Note that we have excluded several values
from the 100% credibility column for the lowest LYE groups since the need to exclude policies with
zero claims has skewed the results for these groups. Interestingly, even at the highest LYE groups
the relative error produced by the 90% credibility scenario was lower than the relative error
produced by assuming 100% credibility.

41
© 2018 Society of Actuaries
The results presented in this report show that there is still significant volatility in LTD claims
experience even at the highest LYE groups, and consequently that our estimates of future
experience using past experience are far from perfect for these largest groups. Table 14, however,
reminds us that volatility and credibility are two separate concepts, and that assigning high levels
of credibility to prior experience may still be optimal despite the underlying volatility of LTD claims
experience.
Note that this analysis is preliminary, and that expanding this approach will be the primary focus of Stage 2 of the Credibility Study.

42
© 2018 Society of Actuaries
Section 6: Reliance and Limitations
6.1 Reliance
In conducting the analysis, researchers relied upon the database developed MIB specifically for the
GLTD Credibility Experience Study. Unless otherwise described, researchers did not audit or
independently verify any of the information furnished, except for a high level review of the data
for reasonableness and consistency. To the extent that any of the data or other information
supplied was incorrect or inaccurate, the results of this analysis could be materially affected.
6.2 Limitations on Use and Distribution of Report
This report is intended for the benefit of the Society of Actuaries. Although the authors understand
that this report will be made widely available to third parties, Milliman does not assume any duty
or liability to such third parties with its work. This report should be distributed and reviewed only
in its entirety.
The results in this report are technical in nature and are dependent on certain assumptions and
methods. No party should rely upon these results without a thorough understanding of those
assumptions and methods. Such an understanding may require consultation with qualified
professionals.
The underlying analysis was performed using assumptions about future LTD claim costs.
Differences between claim cost projections and actual claim cost amounts depend on the extent
to which future experience conforms to the assumptions made for this analysis. It is certain that
actual experience will not conform exactly to the assumptions used in this analysis. Actual claim
costs will differ from projected claim costs to the extent that actual experience deviates from
expected experience.
We, Paul Correia and Tasha Khan, are Consulting Actuaries with Milliman and members of the
American Academy of Actuaries. We meet the qualification standards of the American Academy
of Actuaries for rendering the actuarial opinion contained in this report.

43
© 2018 Society of Actuaries
About The Society of Actuaries
The Society of Actuaries (SOA), formed in 1949, is one of the largest actuarial professional organizations
in the world dedicated to serving 24,000 actuarial members and the public in the United States, Canada
and worldwide. In line with the SOA Vision Statement, actuaries act as business leaders who develop and
use mathematical models to measure and manage risk in support of financial security for individuals,
organizations and the public.
The SOA supports actuaries and advances knowledge through research and education. As part of its work,
the SOA seeks to inform public policy development and public understanding through research. The SOA
aspires to be a trusted source of objective, data-driven research and analysis with an actuarial perspective
for its members, industry, policymakers and the public. This distinct perspective comes from the SOA as
an association of actuaries, who have a rigorous formal education and direct experience as practitioners
as they perform applied research. The SOA also welcomes the opportunity to partner with other
organizations in our work where appropriate.
The SOA has a history of working with public policymakers and regulators in developing historical
experience studies and projection techniques as well as individual reports on health care, retirement, and
other topics. The SOA’s research is intended to aid the work of policymakers and regulators and follow
certain core principles:
Objectivity: The SOA’s research informs and provides analysis that can be relied upon by other individuals
or organizations involved in public policy discussions. The SOA does not take advocacy positions or lobby
specific policy proposals.
Quality: The SOA aspires to the highest ethical and quality standards in all of its research and analysis. Our
research process is overseen by experienced actuaries and non-actuaries from a range of industry sectors
and organizations. A rigorous peer-review process ensures the quality and integrity of our work.
Relevance: The SOA provides timely research on public policy issues. Our research advances actuarial
knowledge while providing critical insights on key policy issues, and thereby provides value to
stakeholders and decision makers.
Quantification: The SOA leverages the diverse skill sets of actuaries to provide research and findings that
are driven by the best available data and methods. Actuaries use detailed modeling to analyze financial
risk and provide distinct insight and quantification. Further, actuarial standards require transparency and
the disclosure of the assumptions and analytic approach underlying the work.
Society of Actuaries 475 N. Martingale Road, Suite 600
Schaumburg, Illinois 60173 www.SOA.org