Embed Size (px)
Citation preview

GROUP INTERIM REPORTJANUARY 1 TO MARCH 31, 2016
1ST QUARTER

1 Net debt = interest-bearing liabilities – available liquidity2 Plus 91 temporary employees (prior year: 58)
Group key figures at a glance (IFRS)
in € thousands or as indicated Jan. 1 to Jan. 1 to Change in %March 31, 2016 March 31, 2015
Revenue 23,154 21,156 9.4
EBITDA 3,034 2,802 8.3
EBITDA margin in % 13.1 13.2 n. a.
EBIT 1,359 1,395 - 2.6
EBIT margin in % 5.9 6.6 n. a.
Net income 91 769 - 88.2
Earnings per share in € 0.02 0.19 - 88.2
in € thousands or as indicated March 31, 2016 March 31, 2015 Change in %
Total assets 102,310 74,957 36.5
Equity 19,674 17,792 10.6
Equity ratio in % 19.2 23.7 n. a.
Available liquidity 12,716 7,282 74.6
Interest-bearing liabilities 52,651 34,642 52.0
Net debt1 39,935 27,360 46.0
Investments 4,958 9,559 - 48.1
Operating cash flow 1,534 2,800 - 45.2
Employees2 485 452 7.3
ShareMarch 31, 2016 March 31, 2015 Change in %
Closing price in Xetra in € 24.90 18.09 37.7
Number of shares outstanding 4,114,788 4,114,788 0
Market capitalization in € thousands 102,458 74,437 37.7
2 | P A R A G O N A G G R O U P I N T E R I M R E P O R T 1 . 1 . – 3 1 . 3 . 2 0 1 6 – 1 S T Q U A R T E R
Highlights in first quarter of 2016• Consolidated revenue grows 9.4% to € 23.2 million (prior year: € 21.2 million)• EBITDA rises 8.3% to € 3.0 million (prior year: € 2.8 million)• EBIT of € 1.4 million matches prior year’s figure• Revenue and earnings forecast for current fiscal year confirmed

Investor relations at paragon
Overall, the first quarter was characterized by volatileinvestor sentiment. This led to fluctuations, in somecases substantial, in German share prices. As a result,Germany’s most important stock indices concludedthe quarter in the red (DAX - 7%, TecDAX - 11%).Professional investors most recently adopted a neutralposition, while foreign investors have increasingly with-drawn. The STOXX Europe 600 Automobiles & Parts(SXAP) index, which lists the most important Europeanautomotive industry stocks, also posted a quarterly lossof 11%.
paragon’s shares were unable to escape the effects ofthis volatile and weaker overall market climate. Startingat an opening price of € 31.73, the share initially rosepast the € 35 mark by mid-January, but neverthelessclosed the quarter at € 24.90 and thus not far from itsperiod low. That corresponds to a stock market value ofaround € 102.5 million for paragon at the reportingdate.
The paragon AG corporate bond was comparatively sta-ble in the quarter under report, with an average price ofaround € 106.50.
We pressed ahead with our personalized communica-tions with the capital market in the quarter under re-
port. Key focuses here included numerous one-to-onemeetings with investors at road shows held in the finan-cial centers of Frankfurt and London. We plan to furtherextend our IR activities in the coming quarters.
We received two voting right notifications in the quar-ter under report:• On January 12, Otus Capital Management notified us
that its shareholding had fallen short of the 5%threshold on January 5. At this time, its share of vot-ing rights in paragon AG came to around 4.99%.
• On February 19, Otus Capital Management notifiedus that its shareholding had exceeded the 5% thresh-old on February 11. At this time, its share of votingrights in paragon AG came to around 5.05%.
The shareholder structure at the end of the period un-der report was therefore as follows:
P A R A G O N A G G R O U P I N T E R I M R E P O R T 1 . 1 . – 3 1 . 3 . 2 0 1 6 – 1 S T Q U A R T E R 3
Performance of the paragon share
120 %
110 %
100 %
90 %
80 %
70 %
paragon AG TecDAX SDAX DAX SXAP
12/31/2015
1/7/2016
1/14/2016
1/21/2016
1/28/2016
2/4/2016
2/11/2016
2/18/2016
2/25/2016
3/3/2016
3/10/2016
3/17/2016
3/24/2016
3/31/2016
Shareholder structure as of March 31, 2016
Klaus Dieter Frers(CEO) 51 %
free float*49 %
* acc. to definition of Deutsche Börse AG
paragon AG remained absolutely on course in the firstquarter of the current year. We posted almost double-digit growth once again, with revenue rising 9.4% from€ 21.2 million in the prior year to € 23.2 million.
These figures are not just a further strong result andconfirmation of our expectations – they also take thewind out of the sails of those skeptics who had a nega-tive overall view of developments in the automotive in-dustry and the potential implications for paragon AG.
The opposite situation arose – and that not only at ourcompany. All German carmakers sold more vehicles inthe first quarter than in prior years, with BMW andDaimler leading the field. In a development which manywould not have thought possible, even the VW Groupmanaged to post growth driven by its strong sub-sidiaries. In Europe, a total of 8.2% more new cars weresold than in the prior year’s quarter. March was the 30th
consecutive month with rising turnover figures. Even inChina, where the outlook was said to be particularlyweak, sales grew by an impressive 12% in March. Volks-wagen, by the way, sold 6.5% more vehicles here. Ac-cording to sector analysts, the growth in the automotiveindustry is set to continue throughout the year.
We can afford to be pleased with these developmentsat paragon. After all, our products and solutions cannow be found in virtually all new cars sold, especially inthe premium segment. Not only that, our product cam-paign from last year will boost this trend yet further.
However, that is not enough to keep us satisfied. Thestrong performance in our electromobility business divi-sion – with our Voltabox subsidiaries in Germany andthe US – is promoting our independence of the overallmarket. The growth rate in this business division will bewell within a double-digit range this year as well – andwe have additional new orders over and above this inour sights.
Strong underlying conditions and excellent positioningin various markets – this combination shows how prom-ising the years ahead are for paragon.
Consistent with expectations, our first-quarter EBITDAand EBIT were at or above the superb prior year’s fig-ures. It goes without saying that we aim to generategrowth here as well in 2016 – and with a forecast EBITmargin of around 9% disproportionately so when com-pared with revenue.
In summary, all indicators for paragon AG in what is stilla relatively new year point to success in 2016. We willbe working hard to turn that expectation into reality inthe months ahead.
We would like to take this opportunity to thank all em-ployees for their outstanding work and our businesspartners, customers, and shareholders for their trust.
Klaus Dieter Frers Dr. Stefan SchwehrChief Executive Officer Chief Technology Officer
4 | P A R A G O N A G G R O U P I N T E R I M R E P O R T 1 . 1 . – 3 1 . 3 . 2 0 1 6 – 1 S T Q U A R T E R
Dear shareholders,customers, business partners, and employees,
Business performanceand major events
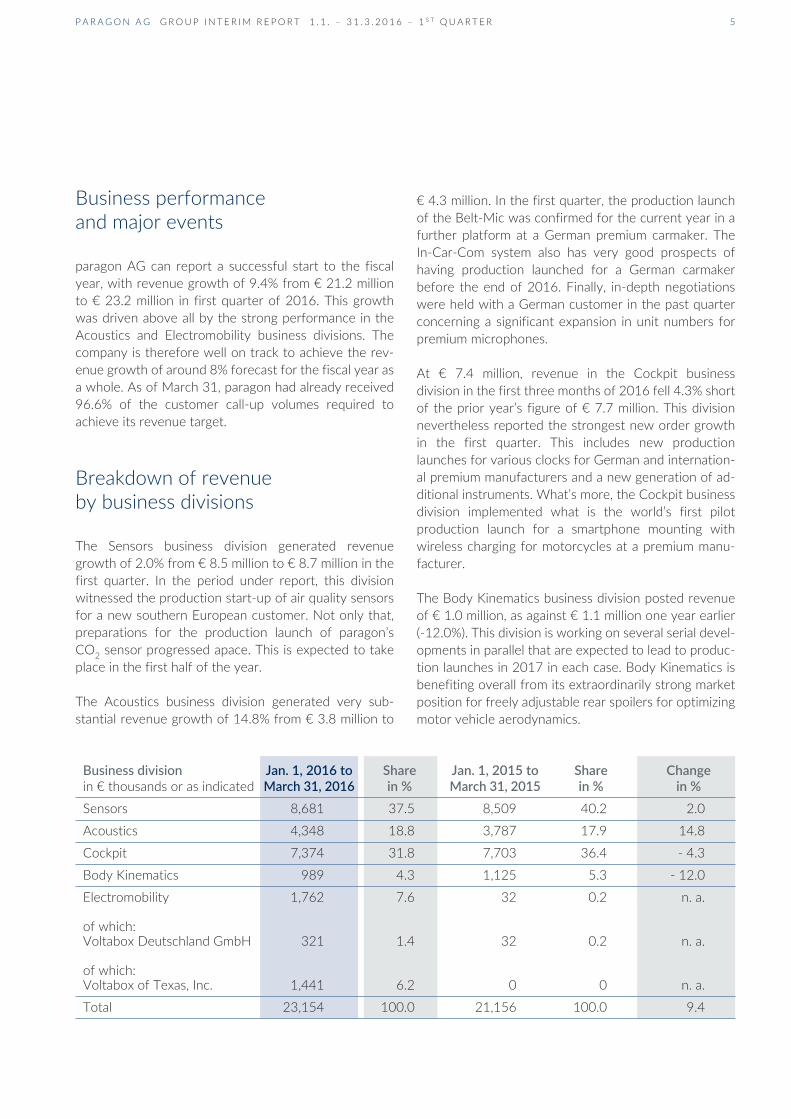
paragon AG can report a successful start to the fiscalyear, with revenue growth of 9.4% from € 21.2 millionto € 23.2 million in first quarter of 2016. This growthwas driven above all by the strong performance in theAcoustics and Electromobility business divisions. Thecompany is therefore well on track to achieve the rev-enue growth of around 8% forecast for the fiscal year asa whole. As of March 31, paragon had already received96.6% of the customer call-up volumes required toachieve its revenue target.
Breakdown of revenueby business divisions
The Sensors business division generated revenuegrowth of 2.0% from € 8.5 million to € 8.7 million in thefirst quarter. In the period under report, this divisionwitnessed the production start-up of air quality sensorsfor a new southern European customer. Not only that,preparations for the production launch of paragon’sCO2 sensor progressed apace. This is expected to takeplace in the first half of the year.
The Acoustics business division generated very sub-stantial revenue growth of 14.8% from € 3.8 million to
€ 4.3 million. In the first quarter, the production launchof the Belt-Mic was confirmed for the current year in afurther platform at a German premium carmaker. TheIn-Car-Com system also has very good prospects ofhaving production launched for a German carmakerbefore the end of 2016. Finally, in-depth negotiationswere held with a German customer in the past quarterconcerning a significant expansion in unit numbers forpremium microphones.
At € 7.4 million, revenue in the Cockpit businessdivision in the first three months of 2016 fell 4.3% shortof the prior year’s figure of € 7.7 million. This divisionnevertheless reported the strongest new order growthin the first quarter. This includes new productionlaunches for various clocks for German and internation-al premium manufacturers and a new generation of ad-ditional instruments. What’s more, the Cockpit businessdivision implemented what is the world’s first pilotproduction launch for a smartphone mounting withwireless charging for motorcycles at a premium manu-facturer.
The Body Kinematics business division posted revenueof € 1.0 million, as against € 1.1 million one year earlier(-12.0%). This division is working on several serial devel-opments in parallel that are expected to lead to produc-tion launches in 2017 in each case. Body Kinematics isbenefiting overall from its extraordinarily strong marketposition for freely adjustable rear spoilers for optimizingmotor vehicle aerodynamics.
P A R A G O N A G G R O U P I N T E R I M R E P O R T 1 . 1 . – 3 1 . 3 . 2 0 1 6 – 1 S T Q U A R T E R 5
Business division Jan. 1, 2016 to Share Jan. 1, 2015 to Share Changein € thousands or as indicated March 31, 2016 in % March 31, 2015 in % in %Sensors 8,681 37.5 8,509 40.2 2.0
Acoustics 4,348 18.8 3,787 17.9 14.8
Cockpit 7,374 31.8 7,703 36.4 - 4.3
Body Kinematics 989 4.3 1,125 5.3 - 12.0
Electromobility 1,762 7.6 32 0.2 n. a.
of which:Voltabox Deutschland GmbH 321 1.4 32 0.2 n. a.
of which:Voltabox of Texas, Inc. 1,441 6.2 0 0 n. a.
Total 23,154 100.0 21,156 100.0 9.4

First-quarter revenue in the Electromobility businessdivision grew to € 1.8 million, whereas no materialrevenue was yet generated in the prior year’s period.The US subsidiary Voltabox of Texas began supplyingtwo US customers with battery systems in the firstquarter. Voltabox Deutschland supplied battery systemsto Vossloh Kiepe for a new trolleybus project inSwitzerland. The production launch for the major starterbattery order received last year is scheduled for thethird quarter of 2016.
Earnings performance
paragon AG generated consolidated revenue of € 23.2million in the first quarter (prior year: € 21.2 million),corresponding to growth of 9.4% on the prior year’squarter. Due to the expansion in business in Electromo-bility and various production launches in other divisions,cost of material grew by 9.9% from € 11.8 million to€ 13.0 million. The materials quota showed a corre-sponding slight increase from 55.8% to 56.1%. Drivenabove all by newly hired development staff in new busi-ness divisions, personnel expenses rose by 12.8% from€ 6.3 million to € 7.1 million in the first quarter of 2016.The personnel expense quota accordingly came to30.6%, up from 29.7% in the prior year. Earnings beforeinterest, taxes, depreciation and amortization (EBITDA)rose by 8.3% from € 2.8 million to € 3.0 million. Net ofincreased depreciation and amortization of € 1.7 million(prior year: € 1.4 million), earnings before interest andtaxes (EBIT) amounted to € 1.4 million and thusmatched the prior year’s figure. Net of a decreasedfinancial result of € - 0.7 million (prior year: € - 0.4 mil-lion) and of higher income taxes of € 0.5 million (prioryear: € 0.2 million), the paragon Group generated netincome of € 0.1 million in the first quarter of 2016(prior year: € 0.8 million). This results in earnings pershare of € 0.02 (prior year: € 0.19).
Net asset and financial position
Total assets rose to € 102.3 million as of March 31,2016 (March 31, 2015: € 75.0 million). This growthwas mainly driven by the acquisition of the building inArtegastrasse 1 in Delbrück, the production building inAustin, Texas (US), and capitalized development ex-penses.
Non-current assets grew to € 62.2 million (March 31,2015: € 40.6 million). This was due to increased invest-ments in property, plant and equipment in connectionwith the development of new business divisions and toa higher volume of development work capitalized fornumerous new projects.
Current assets rose slightly to € 40.1 million (March 31,2015: € 34.3 million). This resulted above all from anincrease in inventories consistent with the expansion inthe business and higher trade receivables accompaniedby a stable development in cash and cash equivalents.
Non-current provisions and liabilities grew by € 16.2million to € 47.8 million (March 31, 2015: € 31.6 mil-lion). Current provisions and liabilities rose by € 9.4 mil-lion to € 34.9 million (March 31, 2015: € 25.5 million).This increase was driven above all by higher currentloan liabilities and trade payables resulting from the ex-pansion in the business.
The equity of paragon AG grew by € 1.9 million to€ 19.7 million (March 31, 2015: € 17.8 million).Given the marked rise in total assets, the equity ratiodecreased as expected to 19.2% (March 31, 2015:23.7%).
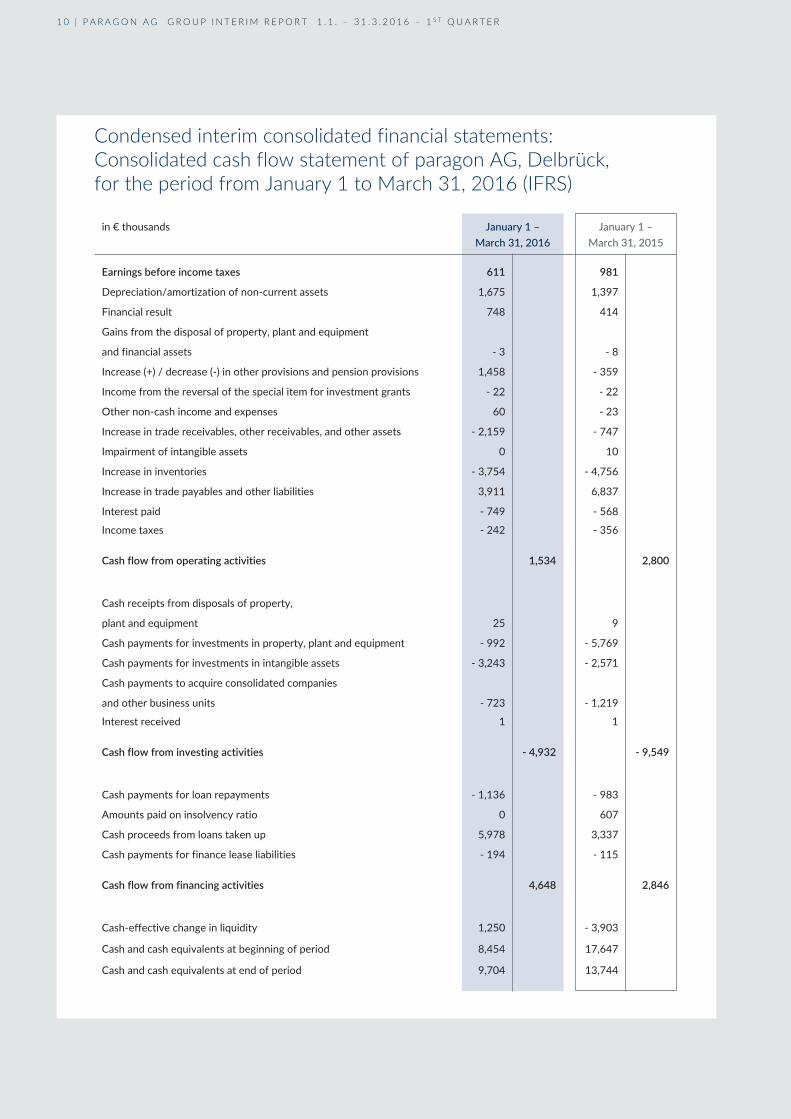
The cash flow from operating activities fell to € 1.5 millionin the first quarter of 2016, down from € 2.8 million in theprior year’s quarter. This development was chiefly due toa significantly lower rise in trade payables. As planned,the cash flow from investing activities dropped from € 9.5
6 | P A R A G O N A G G R O U P I N T E R I M R E P O R T 1 . 1 . – 3 1 . 3 . 2 0 1 6 – 1 S T Q U A R T E R
million to € 4.9 million, thus documenting the company’sreturn to a normal volume of investment activity.
Cash and cash equivalents totaled € 9.7 million at thebalance sheet date, as against € 8.5 million at the end offiscal year 2015. Available liquidity dropped slightly overthe same period from € 13.8 million to € 12.8 million.
Forecast
Accounting for the marginally positive outlook for theautomotive industry and the dynamic growth in themarket for lithium ion batteries, at the end of the Febru-ary the Managing Board confirmed its earlier forecastfor the current year in the 2015 Annual Report.
Based on the current competitive position of theparagon Group and the extensive investments made inrecent years, particularly in developing production sitesin Germany, the US, and most recently in China, theManaging Board expects paragon to generate signifi-cantly higher growth than the global automotive indus-try once again in fiscal year 2016. Key drivers of thisgrowth are expected in the Sensors and Electromobility(Voltabox) business divisions.
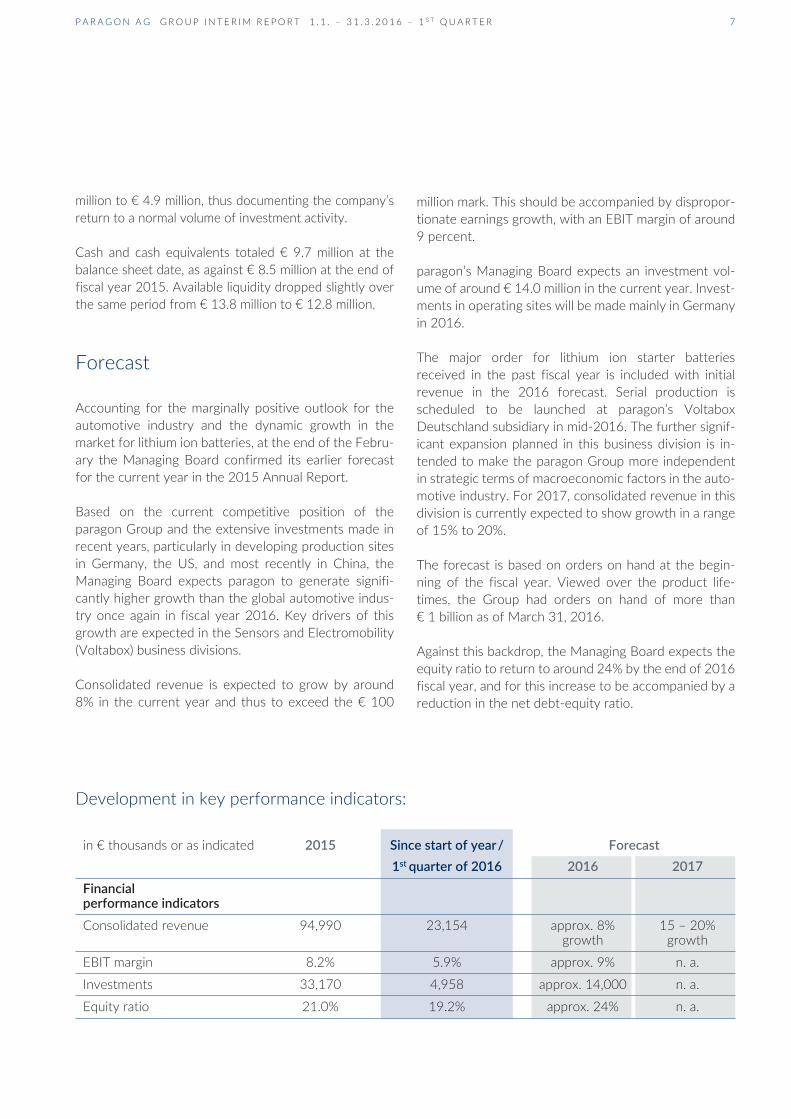
Consolidated revenue is expected to grow by around8% in the current year and thus to exceed the € 100
million mark. This should be accompanied by dispropor-tionate earnings growth, with an EBIT margin of around9 percent.
paragon’s Managing Board expects an investment vol-ume of around € 14.0 million in the current year. Invest-ments in operating sites will be made mainly in Germanyin 2016.
The major order for lithium ion starter batteriesreceived in the past fiscal year is included with initialrevenue in the 2016 forecast. Serial production isscheduled to be launched at paragon’s VoltaboxDeutschland subsidiary in mid-2016. The further signif-icant expansion planned in this business division is in-tended to make the paragon Group more independentin strategic terms of macroeconomic factors in the auto-motive industry. For 2017, consolidated revenue in thisdivision is currently expected to show growth in a rangeof 15% to 20%.
The forecast is based on orders on hand at the begin-ning of the fiscal year. Viewed over the product life-times, the Group had orders on hand of more than€ 1 billion as of March 31, 2016.
Against this backdrop, the Managing Board expects theequity ratio to return to around 24% by the end of 2016fiscal year, and for this increase to be accompanied by areduction in the net debt-equity ratio.
P A R A G O N A G G R O U P I N T E R I M R E P O R T 1 . 1 . – 3 1 . 3 . 2 0 1 6 – 1 S T Q U A R T E R 7
in € thousands or as indicated 2015 Since start of year/ Forecast1st quarter of 2016 2016 2017
Financialperformance indicatorsConsolidated revenue 94,990 23,154 approx. 8% 15 – 20%
growth growth
EBIT margin 8.2% 5.9% approx. 9% n. a.
Investments 33,170 4,958 approx. 14,000 n. a.
Equity ratio 21.0% 19.2% approx. 24% n. a.
Development in key performance indicators:

8 | P A R A G O N A G G R O U P I N T E R I M R E P O R T 1 . 1 . – 3 1 . 3 . 2 0 1 6 – 1 S T Q U A R T E R
Condensed interim consolidated financial statements:Consolidated statement of comprehensive income of paragon AG,Delbrück, for the period from January 1 to March 31, 2016 (IFRS)
in € thousands January 1 – January 1 –March 31, 2016 March 31, 2015
Revenue 23,154 21,156
Other operating income 264 1,252Increase or decrease in inventoryof finished goods and work in progress 440 457Other own work capitalized 3,296 1,335Total operating performance 27,154 24,200
Cost of material - 12,982 - 11,810Gross profit 14,172 12,390
Personnel expenses - 7,096 - 6,290Depreciation of property, plant and equipment andamortization of intangible assets - 1,675 - 1,397Impairment of property, plant and equipment andintangible assets 0 - 10Other operating expenses - 4,042 - 3,298Earnings before interest and taxes (EBIT) 1,359 1,395
Financial income 1 154Financial expenses - 749 - 568Financial result - 748 - 414
Earnings before taxes (EBT) 611 981Income taxes - 520 - 212
Net income for period 91 769
Earnings per share in € (basic) 0.02 0.19Earnings per share in € (diluted) 0.02 0.19Average number of shares outstanding(basic) 4,114,788 4,114,788Average number of shares outstanding(diluted) 4,114,788 4,114,788
Other comprehensive income
Actuarial gains and losses 0 0Currency translation reserve 181 - 176
Total comprehensive income 272 593

P A R A G O N A G G R O U P I N T E R I M R E P O R T 1 . 1 . – 3 1 . 3 . 2 0 1 6 – 1 S T Q U A R T E R 9
in € thousands March 31, 2016 March 31, 2015
ASSETSNon-current assetsIntangible assets 26,631 14,435Goodwill 770 840Property, plant and equipment 34,389 24,885Financial assets 326 376Other assets 86 85
62,202 40,621
Current assetsInventories 14,970 11,667Trade receivables 12,112 10,142Income tax claims 1,369 1,028Other assets 1,953 2,138Cash and cash equivalents 9,704 9,361
40,108 34,336
Total assets 102,310 74,957
in € thousands March 31, 2016 March 31, 2015
EQUITY AND LIABILITIESEquitySubscribed capital 4,115 4,115Capital reserve 2,450 2,450Revaluation deficit - 766 - 781Profit/loss carried forward 13,896 11,521Consolidated net income for the period 91 769Currency translation differences - 112 - 282
19,674 17,792
Non-current provisions and liabilitiesNon-current lease obligations 1,372 1,873Non-current loans 25,880 11,356Non-current bonds 13,299 13,146Investment grants 1,158 1,246Deferred tax liabilities 3,916 2,106Pension provisions 2,143 1,915
47,768 31,642
Current provisions and liabilitiesCurrent portion of lease obligations 778 457Current loans and current portion of non-current loans 11,322 7,810Trade payables 15,955 9,268Other provisions 363 370Income tax liabilities 48 199Other current liabilities 6,402 7,419
34,868 25,523
Total equity and liabilities 102,310 74,957
Condensed interim consolidated financial statements:Consolidated balance sheet of paragon AG, Delbrück,as of March 31, 2016 (IFRS)
1 0 | P A R A G O N A G G R O U P I N T E R I M R E P O R T 1 . 1 . – 3 1 . 3 . 2 0 1 6 – 1 S T Q U A R T E R
Condensed interim consolidated financial statements:Consolidated cash flow statement of paragon AG, Delbrück,for the period from January 1 to March 31, 2016 (IFRS)
in € thousands January 1 – January 1 –March 31, 2016 March 31, 2015
Earnings before income taxes 611 981
Depreciation/amortization of non-current assets 1,675 1,397
Financial result 748 414
Gains from the disposal of property, plant and equipment
and financial assets - 3 - 8
Increase (+) / decrease (-) in other provisions and pension provisions 1,458 - 359
Income from the reversal of the special item for investment grants - 22 - 22
Other non-cash income and expenses 60 - 23
Increase in trade receivables, other receivables, and other assets - 2,159 - 747
Impairment of intangible assets 0 10
Increase in inventories - 3,754 - 4,756
Increase in trade payables and other liabilities 3,911 6,837
Interest paid - 749 - 568
Income taxes - 242 - 356
Cash flow from operating activities 1,534 2,800
Cash receipts from disposals of property,
plant and equipment 25 9
Cash payments for investments in property, plant and equipment - 992 - 5,769
Cash payments for investments in intangible assets - 3,243 - 2,571
Cash payments to acquire consolidated companies
and other business units - 723 - 1,219
Interest received 1 1
Cash flow from investing activities - 4,932 - 9,549
Cash payments for loan repayments - 1,136 - 983
Amounts paid on insolvency ratio 0 607
Cash proceeds from loans taken up 5,978 3,337
Cash payments for finance lease liabilities - 194 - 115
Cash flow from financing activities 4,648 2,846
Cash-effective change in liquidity 1,250 - 3,903
Cash and cash equivalents at beginning of period 8,454 17,647
Cash and cash equivalents at end of period 9,704 13,744

P A R A G O N A G G R O U P I N T E R I M R E P O R T 1 . 1 . – 3 1 . 3 . 2 0 1 6 – 1 S T Q U A R T E R 1 1
Financial calendar
March 17, 2016 Edison-Automotive Tech Conference, London
April 27, 2016 Publication of Interim Report as of March 31, 2016 (1st Quarter)
April 27, 2016 Annual General Meeting, Delbrück
May 9, 2016* 7th DVFA Spring Conference 2016, Frankfurt am Main
June 2, 2016* Quirin Champions 2016, Frankfurt am Main
August 16, 2016* Publication of Interim Report as of June 30,2016 (2nd Quarter)
November 18, 2016* Publication of Interim as of September 30, 2016 (3rd Quarter)
November 21-23, 2016* Equity Forum 2016, Frankfurt am Main
* expected date

paragon AGArtegastraße 133129 Delbrück / GermanyPhone: +49 5250 9762-0Fax: +49 5250 9762-60E-mail: [email protected]