Embed Size (px)
Citation preview

Using Group Awareness Tools 1
Running head: Using Group Awareness Tools
GROUP AWARENESS TOOLS: IT’S WHAT YOU DO WITH IT THAT MATTERS
Jeroen Janssena, Gijsbert Erkensa, Paul Kirschnerb
a Research Centre Learning in Interaction, Utrecht University, The Netherlands
b Centre for Learning Sciences and Technologies, Open University, The Netherlands
Address correspondence to:
Jeroen Janssen
Research Centre Learning in Interaction
Utrecht University
P.O. Box 80140
3508 TC Utrecht, The Netherlands
Tel.: +31 30 253 47 98
E-mail: [email protected]

Using Group Awareness Tools 2
Abstract
This study examined the effect of using a group awareness tool on online
collaboration. Furthermore, we examined whether the effect of using a group awareness tool
on online collaboration is mediated by group awareness (i.e., students’ awareness of their
group members’ levels of participation). To answer these questions, we determined how often
and how long 107 secondary education students used the Participation-tool (PT), a group
awareness tool designed to visualize group members’ relative contribution to the online
collaborative process. Our analyses show that duration of PT use (how long students
displayed the tool on their screens) significantly predicted group members’ participation in
the online dialogue, their participation when writing collaborative texts, equality of
participation within the group, and coordination and regulation of activities in the relational
space (i.e., discussing the collaboration process with group members). No effect of using the
PT on group performance was found. Mediation analyses showed that the effect of using the
PT is only partially mediated by group awareness: an indirect effect of using the PT, via
enhanced group awareness, on student participation during chat discussions and the
collaborative writing process was found.
Using Group Awareness Tools 3
GROUP AWARENESS TOOLS: IT’S WHAT YOU DO WITH IT THAT MATTERS
INTRODUCTION
Although computer-supported collaborative learning (CSCL) has been identified as a
promising educational approach, the research on the effectiveness of CSCL and the processes
that take place during CSCL demonstrate that the collaboration in these environments is not
always effective and efficient. These problems may include conflicts between group members
(e.g., Hobman, Bordia, Irmer, & Chang, 2002), free riding behavior and unequal participation
(e.g., Fjermestad, 2004). Some problems however, may be unique to CSCL environments or
may be exacerbated in these environments, such as difficulties coordinating one’s actions
with other group members’ actions (Baker, Greenberg, & Gutwin, 2001; Ellis, Gibbs, &
Rein, 1992; Erkens, Jaspers, Prangsma, & Kanselaar, 2005). These coordination problems,
whether they occur in the content space (i.e., efforts aimed at problem solving, such as
exchange of information or discussion of answers and alternatives) or the relational space
(i.e., efforts to establish a positive group climate and to ensure effective and efficient
collaboration) of collaboration (Barron, 2003; Slof, Erkens, Kirschner, Jaspers, & Janssen,
2010), may be caused by a lack of group awareness (Janssen, Erkens, & Kanselaar, 2007;
Janssen, Erkens, Kanselaar, & Jaspers, 2007; Jermann & Dillenbourg, 2008). Recently,
researchers have begun to examine how group awareness tools can be used to enhance group
awareness and to study whether group awareness tools affect collaborative learning and
group performance (Dourish & Bellotti, 1992). The aim of this article is to examine how use
of a group awareness tool affects the collaborative learning process and group performance.
Group Awareness

Using Group Awareness Tools 4
Rafael: What do you think of the Debate now? Casey: Fine. Rafael: And what did you do Casey? Rafael: Nothing was added to the Debate…? Rafael: What are you doing now in the Debate, Case? Don’t put anything in there cos you’ll mess up the order. Casey: Oops. Too late! Casey: I’ve added source 3 to propaganda as a new argument. By accident!! Rafael: I see. Grrrrr :-| Rafael: Do you know what Lara is doing? Casey: She’s supposed to be working on the Martyrs position… Rafael: I get the feeling she’s letting us do most of the work. Casey: So do I!
The chat fragment above comes from two male secondary education students working
in a CSCL environment. They are members of a 3-person group, and they are currently
working on the creation of a representation of a historical debate in an argumentative diagram
called the Debate-tool. This fragment highlights two of the most common problems that
group members encounter during online collaboration. Rafael is uncertain about what Casey
is doing in the Debate-tool. He warns Casey about messing up the order in the tool, but he is
too late. This is a sign of coordination problems with respect to the content space of
collaboration. Additionally, they wonder about their other group member, Lara. They have no
idea what she is doing, if she is even online, and whether she is doing what she is supposed to
be doing. On top of that, they are afraid she is letting them do the lion’s share of the work,
but they do not know that for sure. This is an indication of coordination problems in the
relational space. In sum, this fragment illustrates Rafael and Casey lack awareness
information (CSCW, Schmidt, 2002).
The issue of awareness has received considerable attention in the area of computer-
supported cooperative work (Dourish & Bellotti, 1992). This has led to a multitude of
definitions of awareness and to the identification of a large number of different forms of
awareness, such as passive awareness (Gutwin & Greenberg, 2002), workspace awareness

Using Group Awareness Tools 5
(Bødker & Christiansen, 2006), social awareness (Mendoza-Chapa, Romero-Salcedo, &
Oktaba, 2000), conversational awareness (Kreijns & Kirschner, 2001), history awareness
(Engelmann, Dehler, Bodemer, & Buder, 2009), knowledge awareness (Buder & Bodemer,
2008), and group awareness (Gutwin, Stark, & Greenberg, 1995). Although there are
differences between these forms of awareness and their definitions, their main commonality
is their focus on information, or rather, the lack thereof in CSCL environments. In CSCL
environments, it is often difficult to obtain information about what the other is doing, whether
he/she is available for communication and interaction, what the others know about the task at
hand, what group members will do next, and so on (Romero-Salcedo et al., 2004). In this
study we focus on group awareness, which can be defined as knowledge about the social and
collaborative environment the person is working in (e.g., knowledge about the activities,
presence or participation of group members; see Buder & Bodermer, 2008).
If group awareness is a problem of perception and information (Gutwin & Greenberg,
2004), why would this be problematic for group members working in a CSCL environment?
Consider the chat-fragment above. Because Rafael and Casey lack information about their
group members’ activities, their collaboration is far from smooth. Note for instance Rafael’s
irritation after Casey’s mistake. Group awareness information can reduce group members’
efforts to coordinate their actions, can increase their efficiency, and reduce the chance of
errors (Salomon & Globerson, 1989).
During collaboration, group members have to engage in different types of activities.
These activities often have to do with the execution of the task, while others have to with the
coordination and regulation of the task. But group members also need to regulate and
coordinate the social aspect of collaboration. For instance, they need to coordinate their
collaboration: Who is available for discussion and communication? Who needs help? Is the
collaboration going fine or should changes be made? This means that group members need

Using Group Awareness Tools 6
awareness information about the relational space as well as information about the content
space of collaboration. A common problem in collaboration is for example, the free rider
effect: one student lets the other group members do most of the work (Buder & Bodemer,
2008). This is obviously not in the best interest of the group and therefore needs to be
avoided. But it is often very difficult to determine whether free riding behavior is occurring.
Rafael and Casey think that Lara might be taking a free ride, but without the proper
information they cannot be certain. Thus, while working in a CSCL environment, group
members not only require awareness information about the content space, but also about the
relational space. In sum, CSCL environments should incorporate tools or mechanisms that
offer students group awareness information to facilitate coordination and regulation of
activities in both spaces. Such tools are called group awareness tools (Kirschner, Paas, &
Kirschner, 2009; Van Bruggen, Kirschner, & Jochems, 2002).
Using Group Awareness Tools to Increase Group Awareness
Collaborating in CSCL environments is a complex endeavor. Group members have to
carry out many different activities, while keeping track of the overwhelming amount of
information that is available in the environment (e.g., the chat history detailing all the
decisions that were made by the group or the version history of shared documents that are
being written). The collection and interpretation of such information is a cognitively
demanding task. From the perspective of cognitive load theory (Ware, 2005, p. 29),
collaboration in these environments generates high levels of intrinsic and extraneous
cognitive load (Keller & Tergan, 2005; Sweller & Chandler, 1994), for example due to the
necessity to keep track of group members’ actions and the progress of the task as well as the
need to communicate with group members to ensure optimal inter-individual coordination.

Using Group Awareness Tools 7
Group awareness tools can assist students in collecting the required information to
collaborate effectively in CSCL environments. One approach to develop such tools is to
visualize information that is important for the development of group awareness (Ainsworth,
2006). Visualizations can make it easier to collect and interpret this information, because “it
is possible to have a far more complex concept structure represented externally in a visual
display than can be held in visual and verbal working memories” (Erkens et al., 2005).
Visualizations can display large amounts of information and can facilitate its interpretation.
They can therefore decrease the cognitive demands placed on individuals (Savicki, Kelley, &
Ammon, 2002). Visualizations for example, facilitate computational offloading (Lipponen,
Rahikainen, Lallimo, & Hakkarainen, 2003) since team members need to invest less effort to
collect and interpret the information they need to collaborate successfully in a CSCL
environment. On the other hand, adding visualizations to a CSCL environment to enhance
group awareness can also increase cognitive load for students, because they have to pay
attention to the visualization and have to interpret the information displayed by the
visualization.
In this study, students used a group awareness tool called the Participation-tool (PT,
see Figure 1) while they were collaborating in a CSCL environment called Virtual
Collaborative Research Institute (VCRI, see Figure 2). VCRI is a groupware application
designed to facilitate and support collaboration on complex inquiry tasks and research
projects (Cohen, 1994). VCRI consists of several tools which are shared by the group
members (i.e., students can modify their contents and these modifications are visible to the
other group members). The Chat-tool shown in the upper left window is used for
synchronous communication between group members. The chat history is stored
automatically and can be re-read at any time. Using the Cowriter shown in the upper right
window, students can simultaneously formulate their answers or write their research reports.

Using Group Awareness Tools 8
The PT visualizes how much each group member contributes to his or her group’s
online collaboration and thus focuses on a specific aspect of group awareness, awareness of
participation. Research has shown that during online collaboration unequal participation
sometimes may occur in some groups (Webb, 1995). Moreover, in some studies researchers
have noted low participation rates of all group members (Kirschner, Beers, Boshuizen, &
Gijselaers, 2008). This may be a cause for concern, because student participation during
collaboration affects group performance and student achievement (Butler & Winne, 1995).
When students participate actively during online collaboration and participation is divided
equally among group members, every group member has the opportunity to contribute to the
problem solving process, to participate in knowledge construction, to give or request
explanations, and to use and refine his or her skills (2008). The PT was designed to enhance
group awareness – more specifically awareness of participation – by giving group members
awareness information about their participation levels.
In the PT, each group member is represented by a sphere. While group members are
collaborating, the visualization displayed in the PT is continually updated, allowing group
members to compare their own participation with the participation of the other group
members. The distance of a sphere to the group center indicates the number of messages sent
by the represented student compared to the other group members. When a sphere is located
closer to the center of the group, the student has sent relatively more messages than a student
who is located farther from the center. This aspect of the PT therefore focuses on student
participation in the relational space. In contrast, the size of the sphere indicates the amount of
keystrokes typed in the other tools of the VCRI (e.g., the number of keystrokes in the
Cowriter while writing the group product) compared to the other group members. If a sphere
is smaller, the student has typed less keystrokes than a student whose sphere is larger. This

Using Group Awareness Tools 9
aspect of the PT gives awareness information about students’ participation in the content
space (e.g., how much the student has contributed to the group product).
The PT is not a shared but an individual tool and can be opened and examined by
students at any time. The visualization can be rotated using the mouse, to examine the
visualization from a different perspective. After opening the PT, students can drag its window
to any place on their screen and can adjust the size of the window. It should be noted that this
means that students can also obstruct their view of the other tools with the PT and that they
can obstruct their view of the PT with one of the other tools. The PT can display students’
cumulative participation rates (i.e., total number of messages sent at any moment), but can
also display a moving average. The moving average displays students’ participation rates
during the past 20 minutes. This was included because when students have sent many
messages and have typed many keystrokes, sending one long message or typing a
considerable text section in the Cowriter will not greatly affect the cumulative display. In a
period of 20 minutes however, the total number of messages and keystrokes is limited, which
means that active participation has more impact on the visualization (e.g., the size of the
sphere will increase more dramatically). Finally, it is important to note that students are not
forced or coerced to use the PT (Zumbach, Hillers, & Reimann, 2004; Zumbach & Reimann,
2003). In order words, the tool is available and students can use it whenever they want, but
students do not have to open the tool and they can also choose to ignore or close it whenever
they want.
-------------------------------------------------
Insert Figure 1 about here
-------------------------------------------------
-------------------------------------------------
Insert Figure 2 about here

Using Group Awareness Tools 10
-------------------------------------------------
Effects of Using Group Awareness Tools on Online Collaboration
The current study aims to explore the relationship between the use of a group
awareness tool and the online collaborative process. Group awareness tools can be used to
generate external feedback (Gutwin & Greenberg, 2004; Kirschner, Strijbos, Kreijns, &
Beers, 2004). This feedback provides group members with information they can use to
monitor the progress of their collaboration. It allows them to determine whether selected
strategies are working as expected, and whether group performance and products are up to
standard.
Jermann and Dillenbourg (2008) for example, developed a visualization in one of
their studies which gives feedback about dyad members’ activities in a computer-supported
simulation environment. Dyads collaborate on a task which requires them to tune the lights of
a traffic simulation so as to minimize waiting time for car drivers. This requires them to ‘talk’
(visualized by the number of chat messages sent) and to ‘tune’ the traffic lights (visualized by
the number of times the traffic lights were tuned in the simulation). The visualization shows
the amount of talking and tuning done by the group members using bar charts. This allows
group members to compare themselves to one another. Jermann and Dillenbourg (2008)
could not however, establish an effect of their awareness tool on participation and equality of
participation during online collaboration, or an effect on group performance.
Another example of how group awareness tools can be embedded in CSCL
environments to give feedback to group members comes from the work of Zumbach and
colleagues (2007). The environment tracks group members’ activity and feeds this back to the
users in a pie chart. In sum, these group awareness tools provide group members with
feedback on how well they are collaborating (i.e., are group members participating equally in

Using Group Awareness Tools 11
the collaborative process?). In their studies Zumbach et al. showed that their group awareness
tool positively affected students’ learning process, group performance, and motivation.
Group awareness tools can enhance the awareness information CSCL environments
offer to group members and could thus raise students’ group awareness (Shepperd, 1993).
The group awareness tools developed by Jermann and Dillenbourg (2004) and Zumbach and
colleagues (Michinov & Primois, 2005) provide information about who the most active
participants of the group are. This information may enhance students’ awareness of group
processes, and more specifically, of group member participation (i.e., the group awareness
tools affect awareness of participation). This enhanced group awareness may in turn help
students to decide whether it is necessary to change their collaborative behavior. In a
previous study for example, Janssen, Erkens, Kanselaar et al. (2007) found that students who
used the PT reported higher awareness about free riding behavior by group members,
compared to students who did not use the PT. Thus, the following hypothesis may be
formulated:
(H1) Use of the PT will increase students’ awareness of participation.
Group awareness tools such as the PT may also affect students’ motivation to
participate during online collaboration. The contribution of each group member to the online
collaboration is made identifiable when participation is visualized. This identifiability may
motivate students to put effort into the collaboration and the task. For example, the PT can
motivate students to participate more, because they are unable to hide in the crowd and they
may be evaluated negatively when they are seen as free riders (2008). Zumbach et al.
(Clarebout & Elen, 2006; Jiang, Elen, & Clarebout, 2009)In addition, group awareness tools
such as the PT create opportunities for social comparison. This means that by comparing

Using Group Awareness Tools 12
themselves to other group members, students may be motivated to set higher standards for
themselves and to try to increase their participation (2005).
Michinov and Primois (2005) for example, stimulated social comparison processes by
providing students with measures of their group members’ participation in a table that could
be read by all group members. They found that their group awareness tool positively affected
group member participation. A similar effect was found by Janssen, Erkens, Kanselaar et al.
(2007). Jermann and Dillenbourg (2008) however, found no effect of their group awareness
tool on group member participation.
Because students can usually decide for themselves whether they use group awareness
tools or not (i.e., the learning environment does not advise students to use the tool, nor is its
use coerced), variations in use of the tools will therefore occur (e.g., because students do not
perceive the value of the information displayed or do not understand the representation). This
means that the effect of group awareness tools on online collaboration will – at least partially
– depend on group members’ ability to make adequate choices about the added value of the
tool for their collaboration (cf., Savicki et al., 2002).
This may also explain why group awareness tools were found to affect group member
participation in the studies conducted by Michinov and Primois (2007) and Janssen, Erkens,
Kanselaar et al. (2008), but not in Jermann and Dillenbourg’s (Barron, 2003; Slof et al.,
2010) study. It may be possible that students in the studies by Michinov and Primois and
Janssen, Erkens, Kanselaar et al. used the group awareness tool more frequently or more
appropriately than students in the study by Jermann and Dillenbourg. Investigating how use
of group awareness tools affects group member participation may therefore enhance our
understanding of the effects of group awareness tools. Furthermore, group awareness has
been identified as an important mechanism in online collaboration: by increasing group
awareness, the collaborative process may become more effective and efficient (i.e., group

Using Group Awareness Tools 13
awareness acts as a mediating variable when investigating the effects of group awareness
tools). However, research has not yet addressed whether group awareness actually plays this
mediating role in explaining the effect of group awareness tools on online collaboration. We
will therefore examine the following two hypotheses:
(H2a) Use of the PT will increase students’ participation during online collaboration
and
(H2b) this effect will be (partially) mediated by group awareness.
During online collaboration, students sometimes engage in social loafing or free
riding behavior (McGrath, 1991). Because the PT is expected to stimulate social evaluation
and social comparison among group members, the PT may not only stimulate group member
participation, but may also stimulate equality of participation among group members.
Because students can be evaluated by their group members based on the information
provided by the PT, they may do their best to try to participate as much as their group
members. The group awareness tools developed by Janssen, Erkens, Kanselaar et al. (Kreijns,
Kirschner, & Jochems, 2003) and Jermann and Dillenbourg (Manlove, Lazonder, & De Jong,
2006) however, did not affect equality of participation. As noted before, this may also be due
to differences in students’ use of the group awareness tool and subsequent differences in
students’ group awareness. The following two hypotheses will therefore be investigated:
(H3a) Use of the PT will lead to more equality of participation during online
collaboration and
(H3b) this effect will be (partially) mediated by group awareness.

Using Group Awareness Tools 14
When students collaborate on complex tasks in CSCL environments, they have to
attend to two different interaction spaces (Phielix, Prins, & Kirschner, 2010). In the content
space of collaboration, they have to exchange their ideas and opinions, ask questions,
formulate and revise answers, and work towards a group product (Fischer, Bruhn, Gräsel, &
Mandl, 2002; Teasley & Roschelle, 1993). In the relational space, group members have to
perform social and communicative activities that foster group well-being (2007).
Furthermore, the problem-solving and interaction processes in both spaces have to be
coordinated and regulated. Metacognitive activities that regulate activities in the content
space (e.g., making plans, monitoring task progress, and evaluating plans or ideas) are
considered important to successful performance during collaboration (Bonito, 2000; Cohen,
1994). Moreover, collaboration also requires coordination or regulation of activities in the
relational space (cf., Yager, Johnson, Johnson, & Snider, 1986). During collaboration, group
members have to discuss collaboration strategies, monitor collaboration processes, and
evaluate and reflect on the manner in which they collaborated (Kirschner et al., 2009).
The awareness information offered by the PT may trigger coordination and
regulation of activities in the relational space, because it raises group members’ awareness.
Coordination and regulation may furthermore be facilitated because group awareness tools
can mediate discussion as is the case when they help group members externalize and
articulate their thoughts about collaboration processes by providing them with appropriate
information and concepts (cf., Jiang et al., 2009). After examining the group awareness tool
developed by Jermann and Dillenbourg (2008) for example, a group member may feel that
his partner is free riding, which may stimulate him or her to discuss this by referring to the
group awareness tool.
In a previous study using the PT, Janssen, Erkens, Kanselaar et al. (2007) examined
the impact of the PT on coordination and regulation of activities in the relational space. They

Using Group Awareness Tools 15
found that, compared to a control group that did not use the PT, students that used the PT
discussed more about the coordination and regulation of their collaboration. This can be seen
as evidence that the group awareness tool affected the occurrence of coordination and
regulation of the relational space. Thus, the following two hypotheses will be examined:
(H4a) Use of the PT will lead to more coordination and regulation of activities in the
relational space and
(H4b) this effect will be (partially) mediated by group awareness.
Our last hypotheses address the effect of using the PT on group performance (i.e., the
quality of the group products created by the group members). In light of the above, it may be
assumed that use of the PT will positively affect group performance. For example, when
groups use the PT more intensively, group member participation will be higher and
participation will be divided more equally among group members. This will help these groups
to perform better (e.g., Adrianson, 2001). Furthermore, these groups will also devote more
time and effort to coordinating and regulating activities in the relational space. When group
members engage in these activities their collaboration will likely improve, resulting in
increased group performance (e.g., Savicki et al., 2002; Straus, 1997). This study will
therefore address the following hypotheses:
(H5a) Use of the PT will lead to higher group performance and
(H5b) this effect will be mediated by group awareness.

Using Group Awareness Tools 16
METHOD
Participants
Participants were eleventh-grade students from five history classes in two secondary
education schools in the Netherlands. Both schools were comparable in terms of social-
economical status of the attending students. The total sample consisted of 107 students (49
male, 58 female) working in 35 three-person and two four-person groups (22 groups in the
first school, 13 groups in the second school). Mean age of the students was 16.21 years
(SD = 0.63, Min = 15, Max = 18). Students were assigned randomly to a group, group
composition was therefore heterogeneous with respect to variables such as prior knowledge
and gender.
Materials
Collaborative Learning Environment
The participating students collaborated in a CSCL-environment called Virtual
Collaborative Research Institute (VCRI, see Figure 2). Besides the Chat-tool, Cowriter, and
Participation-tool mentioned in the Introduction, the VCRI contains several other tools. For
example, to complete the inquiry group project, students have to read several information
sources containing important information. These information sources are included in the
VCRI and are listed in the Sources-tool (bottom left window of Figure 2). An opened
information source is visible in the bottom right window. Students can read the information
displayed here from their screens and use it for their inquiry task or research project.
Inquiry Group Task
Students collaborated on a historical inquiry task. The subject of the task was “The
first four centuries of Christianity” and consisted of three parts. The task can be characterized
as an open-ended task without a standard procedure and a single correct answer. For the first
part of the inquiry task, the groups had to answer four different questions pertaining to the

Using Group Awareness Tools 17
first four centuries of Christianity. To answer these questions, 12 different sources were
available to the students. These sources were, for example, fragments from the New
Testament, and historical texts from the Roman era. Additionally, students could search the
Internet or their textbooks for more information. To complete the second part of the task, the
groups had to study 40 different sources about the subject. These sources needed to be
categorized into up to five different categories. Furthermore, group members were instructed
to construct a diagram of their categorization using the Diagrammer. Finally, students had to
write a short text, explaining how and why they categorized the different sources. For the
final part of the inquiry task, group members had to collaboratively write an essay of at least
1200 words. The essay had to explain why and how Christianity developed from a small
‘cult’ into the main religion of the Roman Empire. The task was complex and group members
had to share and divide the available information sources. Active participation and
cooperation of all group members was therefore necessary to successfully complete the
inquiry task (Howell-Richardson & Mellar, 1996). Students collaborated on the task for eight
50-minute lessons.
Measures
Use of the Participation-tool
To analyze how students used the PT during their online collaboration, all user actions
in the VCRI-environment were logged and stored. From the log files two scores were
calculated to reflect students’ use of the PT (Erkens & Janssen, 2008; Erkens et al., 2005).
First, the number of times a student used the PT was calculated (e.g., opening and closing the
tool, changing the view from cumulative to moving average, etc.). This reflects the intensity
with which the PT was used by the students. Additionally, the amount of time the PT was
displayed on the student’s screen was calculated. For example, when a student opened or

Using Group Awareness Tools 18
maximized the PT and closed or minimized the tool five minutes later, 5 minutes were added
to the total time. This provides a measure for the overall duration of PT use.
Group Awareness
Students’ group awareness of the participation of their group members during the
online collaboration (i.e., awareness of participation) was measured using a 4-item
questionnaire developed by Janssen et al. (Erkens, 2005). A sample item from this scale is: “I
knew how much my group members contributed to the collaboration”. Students provided
answers to the statements on a 5-point scale (ranging from 1 = completely disagree to 5 =
completely agree). Cronbach’s alpha was .72.
Student Participation during Online Collaboration
To examine the impact of the PT on students’ participation levels in the chat
discussions, we had to decide on an appropriate measure. Two obvious choices are the
number of chat messages sent (see Erkens & Janssen, 2008) or the number of words written
during the chat conversations (Janssen, Erkens, & Kanselaar, 2007; Janssen, Erkens,
Kanselaar et al., 2007). These measures do not however, reflect the nature of synchronous
computer-mediated communication very well (Erkens et al., 2005). During chat
conversations some users only send one proposition per message, while other users type
multiple sentences which combine several propositions. The chat messages sent by the
students were therefore segmented into dialogue acts (Manlove et al., 2006). Dialogue acts
signal the communicative function of a message to receivers (e.g., responding, informing,
argumentation). One dialogue act corresponds to one proposition.
Segmentation of the chat messages was done using the Multiple Episode Protocol
Analysis (MEPA) program (Webb & Palincsar, 1996). Messages were segmented using a
segmentation filter (Kenny, Kashy, & Cook, 2006; Kenny, Mannetti, Pierro, Livi, & Kashy,
2002), which is a program specified and used in MEPA for automatic rule based data

Using Group Awareness Tools 19
manipulation. Punctuation marks (e.g., full stop, question mark, comma) and phrases
connected through a conjunction (e.g., “and”, “but”, “if”) were used to segment chat
messages into dialogue acts. For each student the total number of dialogue acts was
calculated. This measure can be used as an indication for group members’ participation in the
chat discussions.
Furthermore, we extracted for each group member the number of keystrokes he or she
typed in the Cowriter. We considered this measure an indication of students’ participation
during the collaborative writing process.
Equality of Participation
The Gini coefficient was used as a measure of equality of participation (research
question 4). This is a group level measure calculated for each of the 35 groups. For each
group, the deviation of its group members from equal participation is summed. This sum is
then divided by the maximum possible deviation from this value (Cress, 2008). The Gini
coefficient can range from 0 (all students sent the same number of dialogue acts) to 1 (one
student sent all dialogue acts and his/her group members sent none).
Coding of Online Discussion
To examine whether use of the PT affects group members’ discussion of the
collaborative process (e.g., formulating and choosing collaborative strategies or monitoring
the group process) a coding scheme was used to analyze the chat messages sent by the
students. This coding scheme was developed in earlier studies (Baron & Kenny, 1986). In
total, the coding scheme consists of four dimensions. The first dimension concerns activities
carried out in the content space of collaboration, such as proposing solutions, asking task-
related questions, and exchanging relevant information. The second dimension is used for
activities that address the relational space of collaboration. These activities include
negotiation of meaning and making positive comments to ensure a sound social space. The

Using Group Awareness Tools 20
third dimension addresses activities that coordinate and regulate activities in the content
space, such as planning the problem-solving process and monitoring task progression. The
final dimension is reserved for activities that coordinate and regulate activities in the
relational space, for example when group members evaluate their collaboration. In total, the
coding scheme consists of 19 codes. For this article we focused on the effect of using the PT
on students’ attempts to coordinate and regulate activities in the relational space. By giving
feedback about group members’ level of participation during the collaboration, the PT
enhances group members’ awareness. It is expected that group members will use this
information to discuss their collaboration with each other and to coordinate and regulate their
activities in the relational space (see hypotheses 4a and 4b). We will therefore only describe
the last dimension of our coding scheme in detail. For more information about the other
dimensions, the reader is referred to the above mentioned publications.
When students collaborate on an inquiry task, they have to perform activities in the
content space and in the relational space. On the other hand, successful coordination also
requires considerable coordination and regulation of these activities (MacKinnon, Fairchild,
& Fritz, 2007). In this study, we focus on how group members coordinate and regulate
activities in the relational space of collaboration (Baron & Kenny, 1986; MacKinnon et al.,
2007). During the regulation of activities in the relational space, students engage in group
processing, which means they discuss how well their group is functioning and how group
processes may be improved (Shrout & Bolger, 2002). The coding scheme used in this study
uses four different codes to identify coordination and regulation of activities in the relational
space. Planning involves discussion of collaborative strategies, such as helping each other or
proposals to work together on certain tasks. Second, monitoring refers to exchange of
information that group members use to monitor group processes (e.g., group members discuss
the progress of collaborative tasks). Finally, positive and negative evaluations refer to

Using Group Awareness Tools 21
appraisal and evaluation of group processes and collaboration (e.g., a student remarks he/she
is happy with the way the group is working together).
In our analyses, we calculated for each group member the total number of statements
that coordinate and regulate activities in the relational space (i.e., the sum of planning,
monitoring, and evaluating). The objectivity of the coding scheme was assessed by two
independent coders, using Cohen’s kappa. A satisfactory Kappa of .90 was found.
Group Performance
To measure the effect of using the PT on group performance, we assessed the quality
of the group products handed in by the groups. For each of the three subtasks of the inquiry
task we assessed both the conceptual content and quality of argumentation (e.g., use of
relevant historical concepts, quality of reasoning and argumentation) and the quality of the
presentation of the answers (e.g., structure of the written text, correctness of language used)
using an assessment form. In total, the form consisted of 20 items rated on a 3-point scale
(0 = low quality, 2 = high quality). Interrater reliability analyses using two independent
coders indicate the assessment procedure was sufficiently objective (Cohen’s Kappa ranged
from .72 - .90). In our analyses we calculated mean overall performance scores in such a way
that a group that was given the maximum amount of points for all of the 20 items (40)
received an overall mean score of 1, while a group that was given the minimum amount of
points (0) received an overall mean score of 0.
Procedure
Students worked on separate computers in a computer lab during the eight lessons.
Before the start of the first lesson, students were instructed about the inquiry task and the
VCRI-environment. During this introduction several important tools of the environment were
explained to the students, including the PT. Our explanation of the PT focused on how the
tool should be used, how the information visualized should be interpreted. The explanation

Using Group Awareness Tools 22
why the tool is beneficial was kept to a minimum so as not to influence students’ use of the
PT too much.
During the lessons, teachers answered task-related questions, while an experimenter
answered technical questions about the environment. The teachers were able to monitor the
online discussions of their students when they logged into the VCRI environment. Teachers
could also send messages in order to answer students’ questions, or to warn students in case
of misbehavior. Furthermore, teachers had access to the texts students are writing in the
Cowriter. This way, teachers could monitor the progress of their groups. Students were
allowed to work on the inquiry task during free periods in their time schedule. After eight
lessons students handed in their final version of the task for grading by their teacher.
-------------------------------------------------
Insert Figure 3 about here
-------------------------------------------------
RESULTS
-------------------------------------------------
Insert Table 1 about here
-------------------------------------------------
Use of the Participation-tool
As can be seen in Table 1, students manipulated the PT (e.g., opening, closing or
rotating the view) on average 77.36 times (SD = 38.92) and displayed the PT on their screens
for 66.82 minutes (SD = 43.36). Because the average time a student was online in the VCRI
environment was 405.60 minutes (SD = 104.36), this means most students displayed the PT
on their screens for a considerable amount of time (16%) and manipulated the PT on a regular
basis (about once every 5 minutes). Unsurprisingly, intensity of PT use and display time of
the PT correlated significantly, r = .23, p = .02.

Using Group Awareness Tools 23
We also examined whether the intensity and duration with which students
manipulated the PT changed over the course of the experiment. Figure 3 shows that in the
first week of the experiment, students used the PT most intensively and for the longest
duration. After the first week, a significant drop in both intensity and duration can be seen.
Half way through the duration of the collaborative project (week 4), intensity and duration of
PT use are at their lowest, but then rise again in week 5 and 6. Finally, intensity and duration
decrease again in the last two weeks of the collaboration. It seems that during the beginning
of the study, the students were learning to manipulate the PT through a trial and error
strategy, which explains the relatively high intensity and duration scores in the first week.
After the first week, students use the tool less often in weeks 2, 3 and 4.
-------------------------------------------------
Insert Table 2 about here
-------------------------------------------------
-------------------------------------------------
Insert Table 3 about here
-------------------------------------------------
Group Awareness
From Table 1 it becomes clear that on average students reported moderate levels of
awareness of their group members’ levels of participation (M = 3.21, SD = 0.67). When
investigating the effect of use of the PT on awareness of participation, the problem of
nonindependence had to be taken into account (Kenny et al., 2006). Because students worked
in groups, they influenced each other. This violates the assumption of nonindependence of
observations of individuals, making the results of traditional analytical techniques such as
regression or correlation analysis unreliable (2009). Multilevel analysis (MLA) however, can
cope with nonindependence and is therefore a more appropriate technique.

Using Group Awareness Tools 24
Table 2 shows the results of a MLA investigating the effects of intensity of PT use on
awareness of participation. As can be seen, intensity of PT use did not have a significant
effect on awareness of participation. In contrast, Table 3 shows that duration of PT use
significantly affected awareness of participation: students who displayed the PT on their
screen longer reported higher awareness of their group members’ levels of participation.
Hypothesis 1 is therefore partially supported.
-------------------------------------------------
Insert Table 4 about here
-------------------------------------------------
-------------------------------------------------
Insert Table 5 about here
-------------------------------------------------
Student Participation during Online Collaboration
On average, students typed a total of 294.92 (SD = 184.46) dialogue acts in VCRI’s
Chat-tool during their collaboration (see Table 1). Tables 4 and 5 show the results of the
analyses of the effect of PT use on student participation during chat discussions (number of
dialogue acts sent). No effect of intensity of PT use on student participation was found (see
Table 4). However, a significantly positive effect of overall duration of PT use on student
participation during chat discussions was found (see Table 5). The positive sign of β1
indicates that students who displayed the PT on their screen for a longer period of time,
participated more during the chat discussions. Hypothesis 2a is therefore partially supported.
-------------------------------------------------
Insert Table 6 about here
-------------------------------------------------
-------------------------------------------------

Using Group Awareness Tools 25
Insert Table 7 about here
-------------------------------------------------
Table 1 also shows students’ participation in the Cowriter. On average students’ typed
6816.50 keystrokes in the Cowriter (SD = 1938.87). The MLA displayed in Table 6 shows
that intensity of PT did not significantly affect student participation in the Cowriter. Overall
duration of PT use was, in contrast, found to affect student participation in the Cowriter, as
can be seen in Table 7. Students who used the PT for a longer period of time, contributed
more keystrokes to the texts written in the Cowriter. These findings again partly support
Hypothesis 2a.
-------------------------------------------------
Insert Figure 4 about here
-------------------------------------------------
To investigate whether the effect of using the PT on student participation in the chat
discussions is mediated by awareness of participation (Hypothesis 2b), a mediation analysis
was conducted (Molinari, Sangin, Dillenbourg, & Nussli, 2009; Sangin, Molinari, Nüssli, &
Dillenbourg, 2008; Van Gog, Kester, Nievelstein, Giesbers, & Paas, 2009). Baron and Kenny
recommend a three step procedure to determine whether mediation exists. All three steps
must be met for complete mediation to exist. The first step is met if the initial predictor
variable (e.g., intensity of PT use or overall duration of PT use, denoted X in Figure 4)
correlates significantly with the mediator (e.g., awareness of participation which is denoted M
in Figure 4). If this is the case, path a in Figure 4 is significant. If the presumed mediator
significantly predicts the dependent variable (e.g., student participation in chat discussions,
denoted Y in Figure 4) while controlling for the initial predictor variable (path b in Figure 4),
the second step is met. Finally, the third step is met when the effect of the initial predictor
variable on the dependent variable, while controlling for the mediator, is zero (path c’). This

Using Group Awareness Tools 26
means the effect of X on Y is completely mediated by M. However, if step 3 is not met, it can
be tested whether partial mediation exists, using a Sobel test (Gutwin & Greenberg, 2004;
Kirschner et al., 2004).
The results displayed in Table 1 indicate that step 1 is not met for intensity of PT use
(path a is not significant), while this step is met for overall duration of PT use (path a is
significant), β = .296, p = .002, r2 = .089. We therefore did not conduct steps two and three
for intensity of PT use. Next, our analyses show that for overall duration of PT use, step 2 has
been passed. The results showed a significantly positive relationship between awareness of
participation and student participation in the chat discussions, β = .245, p = .010, r2 = .060.
Path b is therefore significant. Step 3 was not passed however, because the effect of overall
duration of PT use on student participation controlling for awareness of participation was still
significant, β = .282, p = .003, r2 = .081. The Sobel test however, showed that the indirect
effect was significant, Z = 2.043, p = .041, meaning that awareness of participation can be
considered a partial mediator for student participation in the chat discussions (e.g., asking for
elaborated help and giving elaborated explanations, see Webb, Nemer, & Zuniga, 2002). The
percentage of the total effect of overall duration of PT use on student participation that is
mediated by awareness of participation is 20.73% (e.g., prior knowledge, achievement
motivation, see Dillenbourg, Baker, Blaye, & O'Malley, 1996). Hypothesis 2b is therefore
partially supported.
Mediation analyses were also performed to investigate whether awareness of
participation mediated the effect of intensity of PT use and overall duration of PT use on
student participation in the Cowriter. Because step 1 is similar to step 1 for student
participation in the chat discussion, path a is not significant for intensity of PT use but it is
significant for duration of PT use. Next, awareness of participation when controlling for
overall duration of PT use significantly predicted student participation in the Cowriter,

Using Group Awareness Tools 27
β = .248, p = .010, r2 = .062. Path b is therefore significant, and step 2 has been met for
duration of PT use. Finally, our analyses showed that overall duration of PT use when
controlling for awareness of participation significantly predicted number of keystrokes typed
in the Cowriter, β = .250, p = .009, r2 = .064. This means path c’ is significant and step 3 has
not been passed. The Sobel test however, showed that the indirect effect of awareness of
participation was significant, Z = 2.028, p = .043, meaning that awareness of participation can
be considered a partial mediator for student participation in the Cowriter. The percentage of
the total effect of overall duration of PT use on student participation in the Cowriter that is
mediated by awareness of participation is 22.69%. These findings also provide partial support
for Hypothesis 2b.
Equality of Participation
Over the 35 groups in our study, a mean Gini coefficient of .15 (SD = .07) was found
(see Table 1). This indicates that in most groups students contributed roughly equally to the
online collaboration. Because equality of participation is a group level variable, it was
necessary to aggregate the two PT-variables to the level of the group. These measures then
indicate the intensity with which the group used the PT and the overall duration of PT use by
the group. Because all variables of interest are now measured at the level of the group and
nonindependence is therefore no longer a problem (e.g., Buder & Bodemer, 2008; Gutwin &
Greenberg, 2004; Kirschner et al., 2004), these aggregated variables were subsequently
correlated with our equality of participation measure. As can be seen in Table 1, intensity of
PT use was not significantly correlated with equality of participation, r = -.02, p = .92. On the
other hand, a significant correlation was found between overall duration of PT use by the
group and equality of participation, r = -.36, p = .03. Thus, in groups that had the PT on their
screens for a longer period of time, participation between group members was more equal.
Hypothesis 3a is therefore partially supported.

Using Group Awareness Tools 28
To test Hypotheses 3b, mediation analyses were also conducted. Intensity of PT use
did not correlate with awareness of participation (see Table 1), therefore step 1 has not been
passed. We therefore did not examine steps 2 and 3 for this variable. In contrast, overall
duration of PT use correlated significantly with awareness of participation. For this variable,
path a was therefore significant. Furthermore, the results also show that path b is significant:
awareness of participation significantly predicts equality of participation while controlling for
overall duration of PT use, β = .298, p = .043, r2 = .089. Step 2 has been passed. Step 3 was
not passed however, because the effect of overall duration of PT use on equality of
participation controlling for awareness of participation was still significant, β = -.783, p =
.000, r2 = .487. The Sobel test showed a nonsignificant indirect effect of the mediator
variable, Z = 1.709, p = .087, meaning awareness of participation does not mediate the effect
of overall duration of PT use on equality of participation. Hypothesis 3b is therefore rejected.
-------------------------------------------------
Insert Table 8 about here
-------------------------------------------------
-------------------------------------------------
Insert Table 9 about here
-------------------------------------------------
Coordination and Regulation of Relational Space
On average, 19.52 of the dialogue acts sent by the students were used for coordination
and regulation of the relational space (SD = 15.44, see Table 1). This is equal to about 7% of
the total number of dialogue acts. Tables 8 and 9 show the results of MLA investigating the
effects of intensity of PT use and overall duration of PT use on students’ use of strategies that
coordinate and regulate activities in the relational space. As can be seen, intensity did not
predict coordination and regulation of the relational space. On the other hand, duration of PT

Using Group Awareness Tools 29
use significantly predicted coordination and regulation of the relational space. Hypothesis 4a
is therefore partially supported.
Mediation analyses were not performed for the effect of intensity of PT use on
activities that coordinate and regulate the relational space, because path a was not significant
and step 1 has not been met. Concerning overall duration of PT use, path a is similar to path a
for the previous mediation analyses for this variable. Step 1 has therefore been met. Step 2
was not met however, because awareness of participation did not predict coordination and
regulation of the relational space, β = .168, p = .090, r2 = .028. Unsurprisingly, the final step
showed that duration of PT use was a significant predictor for coordination and regulation of
the relational space when controlling for awareness of participation, β = .204, p = .040,
r2 = .040. Moreover, the Sobel test showed a nonsignificant indirect effect of the mediator
variable awareness of participation, Z = 1.514, p = .130. Step 3 has not been passed and
hypothesis 4b is therefore rejected.
Group Performance
Comparable to equality of participation, group performance is also a group level
measure. This measure was again correlated with the aggregated measures for intensity of PT
use and duration of PT use. The 35 groups participating in this study performed a little bit
above average (M = .58, SD = .10). Intensity of PT use and duration of PT use did not
correlate with group performance, r = -.04, p = .81, and r = .27, p = .12. Hypothesis 5a is thus
rejected.
Like the previous mediation analyses, step 1 involved investigating the effect of
intensity of PT use and duration of PT use on awareness of participation (path a). Thus only
in the latter case path a was significant. Furthermore, path b was not significant because
awareness of participation did not significantly predict group performance when controlling
for duration of PT use, β = .287, p = .129, r2 = .071. The final step showed that duration of

Using Group Awareness Tools 30
PT use did not predict group performance when controlling for awareness of participation,
β = .140, p = .454, r2 = .018. Moreover, the Sobel test showed a nonsignificant indirect effect
of the mediator variable awareness of participation, Z = 1.376, p = .169. Hypothesis 5b is
therefore also rejected.
CONCLUSION AND DISCUSSION
The present study examined the effect of using the Participation-tool (PT) on online
collaboration. Furthermore, we examined whether the effect of using the PT on online
collaboration is mediated by awareness of participation. To answer these questions, we
determined the intensity with which secondary education students used the PT and how they
used the PT. Our results show that students used the PT quite intensively, although large
variations existed between individual students.
Contrary to our expectations, only one of the two variables we used to measure use of
the PT affected the online collaborative process. The first measure was calculated by adding
up all the mouse clicks in the PT of a student (e.g., clicking on a button to zoom in or out)
and reflected intensity of PT use. The second measure was calculated by adding up the total
amount of time the PT was displayed on the student’s screen and reflected overall duration of
PT use. Only the latter measure significantly predicted variables related to the online
collaboration. This finding mirrors a results reported by Jiang et al. (Strijbos, Martens, &
Jochems, 2004), who also found that frequency of tool use did not affect performance in an
computer-based learning environment, while time spent using the tool did affect
performance. An important question is therefore: Why does the former measure not affect
online collaboration, while the latter does? It might be argued that both measures provide
only a rough indication of students’ use of the tool. They do not give information about

Using Group Awareness Tools 31
whether the visualization of participation was meaningful for students, whether they actually
used the tool in a meaningful way, whether they focused their gaze on important aspects of
the tool, or whether students comprehended the information displayed in the tool. Using other
methods to measure use of the PT, such as eye-tracking, may shed more light on these
questions (Bonito, 2000).
Duration of PT use was found to affect several aspects of the online collaborative
process. First, duration of use had a significantly positive effect on awareness of participation
as expected (Dillenbourg, 1999): students who used the tool longer reported higher levels of
awareness of participation. Furthermore, duration of use also affected student participation in
the collaborative process in a similar way: students who used the PT longer also participated
more in the online discussions and the collaborative writing process. Moreover, participation
was more equal in groups that displayed the PT on their screen longer. Finally, we found a
significant effect of duration of use and coordination and regulation of the relational space:
students who used the PT longer, discussed more about the way their group was
collaborating. No effect of duration of use on group performance was found however. This
might be due to the fact that factors such as the interaction between students during the
collaboration (Erkens & Janssen, 2008; Janssen, Erkens, & Kanselaar, 2007) and student
characteristics (Jermann & Dillenbourg, 2008) have a greater impact on group performance
than group awareness tools. Another explanation may lie in the fact that use of the PT
affected students’ participation in the online discussions. However, this effect is possibly due
to the fact that students that used the PT longer also engaged more in coordination and
regulation strategies. In other words, they discussed more about the way their group was
functioning and how this could possibly be improved, but they did not discuss more about the
task. It could be argued that the PT distracted these students somewhat from the task. This
might explain why no effect of duration of PT use on group performance was found. On the

Using Group Awareness Tools 32
other hand, additional analyses showed a negative effect of duration of PT use on off-task
behavior, meaning that when students used the PT longer, they engaged in less off-task
behavior. This mirrors a similar finding by Janssen, Erkens, Kanselaar et al. (2007). Thus,
although use of the PT might increase regulation of the relational space in favor of activities
in the content space, this does not necessarily mean use of the PT increases off-task behavior.
Further research is therefore needed to investigate how the PT affects collaborative activities
and how these activities in turn affect group performance. It should also be noted that because
group performance was measured at the group level, the statistical power to detect effects of
familiarity was relatively small.
We performed mediation analyses to test the hypothesis that awareness of
participation mediates the effect of the PT on online collaboration. The results only partially
confirm that awareness of participation might be a mediating variable that explains how using
the PT affects online collaboration. We found that awareness of group members’
participation, partially mediates the effect of duration of PT use on students’ participation
during the online discussions and the collaborative process. This means that part of the effect
of the PT on student participation can be explained by the fact that the PT raises students’
awareness of participation, which in turn leads to more active student participation during the
online collaboration. Our study therefore partially confirms the ideas articulated by several
authors (Kirschner et al., 2008) that group awareness tools such as the PT may affect online
collaboration by raising students’ group awareness, in this case awareness of participation.
It should be noted that group size may have influenced the results of our study
(Weinberger, Ertl, Fischer, & Mandl, 2005). This study used groups with three or four
members. In smaller groups the obligation to participate is higher, lack of participation can
therefore be noticed more easily . Therefore, if larger groups had been used in this study, the
results might have been different. In large groups, the PT could possibly have a greater

Using Group Awareness Tools 33
impact on equality of participation. Similarly, in larger groups it is more difficult to know
what group members are doing and which group members are participating too little.
Therefore, under these circumstances the PT could possibly have a greater impact on
awareness of participation. In the future research, it should be examined whether group size
influences the effects of visualization of participation.
The nature of the collaborative task used in this study may also have affected our
results. This study used an inquiry group task, for which a high level of collaboration and
equal participation was necessary to perform well. However, due to the large amount of
information that had to be read by the students, students often divided the work among
themselves. This may more have resembled working on a cooperative task than a
collaborative task . For cooperative tasks (e.g., Jigsaw), equal participation is not always
necessary. Possibly, the effects of the PT will be different for tasks that explicitly stimulate
division of labor (e.g., cooperation) than for tasks that require simultaneous problem-solving
(e.g., collaboration).
The careful reader will have noticed a discrepancy between how student participation
was operationalized in the visualization of the PT and how this was operationalized in the
study. The PT used number of keystrokes typed in the chat-tool as a measure of student
participation. In our analyses we however used number of dialogue acts typed as a measure of
student participation. This was done because during chat conversations some users only send
one proposition per message, while other users type multiple sentences which combine
several propositions. Chat messages were therefore segmented into smaller segments which
had only one communicative function (i.e., a dialogue act). However, if the aim of the PT is
to stimulate students to contribute more dialogue acts to the discussion instead of merely
increasing the number of keystrokes typed, it would probably be better to also use number of
dialogue acts sent as a basis for visualizing student participation. This would necessitate an

Using Group Awareness Tools 34
online immediate segmentation of chat messages into dialogue acts. Recent developments in
the field of automatic coding of collaborative dialogue have made this a real possibility
however .
Another way to improve the PT would be to include so-called mirroring information
in the visualization. A mirroring tool provides students with a visualization of the
"difference" between what they have done during the interaction and what they should have
done (in order to reach an efficient collaboration). By not only providing awareness
information, but also normative information about students’ behavior, students may be
further motivated to contribute to the collaboration process.
This study shows that it is important that research not only examines the effects of
group awareness tools in (quasi-)experimental designs, but also takes into account whether
students use group awareness tools and how they use these tools. Other studies (Clarebout &
Elen, 2006; Jiang et al., 2009) and the current study demonstrate that students’ use of a tool
affects the impact of the tool on their collaboration process. It is therefore important that
future research takes this into account. Moreover, future research should try to examine tool
use not only using log file analyses, but also using other methods such as eye-tracking
(Molinari et al., 2009; Sangin et al., 2008; Van Gog et al., 2009) or stimulated recall
interviews with students to understand their motives for using the tool, whether or not they
understood the tool and whether they valued the tool (Beers, Boshuizen, Kirschner,
Gijselaers, & Westendorp, 2008).
This study shows that the effectiveness of group awareness tools depends on how
students use such a tool. In this study, students could decide for themselves whether they
used the tool or not. A new line of research could then focus on enhancing the effectiveness
of group awareness tools by coercing or scripting its use. Another approach to further
enhance the effectiveness of group awareness tools may be to employ attention guidance .

Using Group Awareness Tools 35
This means that the group awareness tool also shows the eye movements of a model or expert
while working with the tool, which may help students to focus on the important aspects of the
tool. Whichever direction future research takes, we are confident group awareness tools will
remain an important way to enhance the effectiveness of CSCL.
REFERENCES
Adrianson, L. (2001). Gender and computer-mediated communication: Group processes in problem solving. Computers in Human Behavior, 17, 71-94.
Ainsworth, S. (2006). DeFT: A conceptual framework for considering learning with multiple representations. Learning and Instruction, 16, 183-198.
Baker, K., Greenberg, S., & Gutwin, C. (2001). Heuristic evaluation of groupware based on the mechanics of collaboration. Paper presented at the Engineering for Human-Computer Interaction: 8th IFIP International Conference, EHCI 2001, Toronto, Canada.
Baron, R. M., & Kenny, D. A. (1986). The moderator-mediator variable distinction in social psychological research: Conceptual, strategical, and statistical considerations. Journal of Personality and Social Psychology, 51, 1173-1182.
Barron, B. (2003). When smart groups fail. Journal of the Learning Sciences, 12, 307-359. Bødker, S., & Christiansen, E. (2006). Computer support for social awareness in flexible
work. Computer Supported Cooperative Work (CSCW), 15, 1-28. Bonito, J. A. (2000). The effect of contributing substantively on perceptions of participation.
Small Group Research, 31, 528-553. Buder, J., & Bodemer, D. (2008). Supporting controversial CSCL discussions with
augmented group awareness tools. International Journal of Computer-Supported Collaborative Learning, 3, 123-139.
Butler, D. L., & Winne, P. H. (1995). Feedback and self-regulated learning: A theoretical synthesis. Review of Educational Research, 65, 245-281.
Clarebout, G., & Elen, J. (2006). Tool use in computer-based learning environments: Towards a research framework. Computers in Human Behavior, 22, 389-411.
Cohen, E. G. (1994). Restructuring the classroom: Conditions for productive small groups. Review of Educational Research, 64, 1-35.
Cress, U. (2008). The need for considering multilevel analysis in CSCL research: An appeal for the use of more advanced statistical methods. International Journal of Computer-Supported Collaborative Learning, 3, 69-84.
Dillenbourg, P. (1999). Introduction: What do you mean by "Collaborative Learning"? In P. Dillenbourg (Ed.), Collaborative learning: Cognitive and computational approaches (pp. 1-19). Amsterdam: Pergamon.
Dillenbourg, P., Baker, M., Blaye, A., & O'Malley, C. (1996). The evolution of research on collaborative learning. In H. Spada & P. Reimann (Eds.), Learning in humans and machine: Towards an interdisciplinary learning science (pp. 189-211). Oxford: Elsevier.
Dourish, P., & Bellotti, V. (1992). Awareness and coordination in shared work spaces. Paper presented at the ACM Conference on Computer Supported Cooperative Work (CSCW'92), Toronto, Canada.

Using Group Awareness Tools 36
Ellis, C. A., Gibbs, S. J., & Rein, G. (1992). Groupware: Some issues and experiences. In D. Marca & G. Bock (Eds.), Groupware: Software for computer-supported cooperative work (pp. 23-43). Los Alamitos, CA: IEEE Computer Society Press.
Engelmann, T., Dehler, J., Bodemer, D., & Buder, J. (2009). Knowledge awareness in CSCL: A psychological perspective. Computers in Human Behavior, 25, 949-960.
Erkens, G. (2005). Multiple Episode Protocol Analysis (MEPA). Version 4.10. Utrecht University, The Netherlands.
Erkens, G., & Janssen, J. (2008). Automatic coding of online collaboration protocols. International Journal of Computer Supported Collaborative Learning (ijCSCL), 3, 447-470.
Erkens, G., Jaspers, J., Prangsma, M., & Kanselaar, G. (2005). Coordination processes in computer supported collaborative writing. Computers in Human Behavior, 21, 463-486.
Fischer, F., Bruhn, J., Gräsel, C., & Mandl, H. (2002). Fostering collaborative knowledge construction with visualization tools. Learning and Instruction, 12, 213-232.
Fjermestad, J. (2004). An analysis of communication mode in group support systems research. Decision Support Systems, 37, 239-263.
Gutwin, C., & Greenberg, S. (2002). A descriptive framework of workspace awareness for real-time groupware. Computer Supported Cooperative Work (CSCW), 11, 411-446.
Gutwin, C., & Greenberg, S. (2004). The importance of awareness for team cognition in distributed collaboration. In E. Salas & S. M. Fiore (Eds.), Team cognition: Understanding the factors that drive processes and performance (pp. 177-201). Washington: APA Press.
Gutwin, C., Stark, G., & Greenberg, S. (1995). Support for workspace awareness in educational groupware. In J. L. Schnase & E. L. Cunnius (Eds.), The first international conference on Computer support for collaborative learning (pp. 147-156). Mahwah, NJ: Lawrence Erlbaum Associates Inc.
Hobman, E. V., Bordia, P., Irmer, B., & Chang, A. (2002). The expression of conflict in computer-mediated and face-to-face groups. Small Group Research, 33, 439-465.
Howell-Richardson, C., & Mellar, H. (1996). A methodology for the analysis of patterns of participation within computer mediated communication courses. Instructional Science, 24, 47-69.
Janssen, J., Erkens, G., & Kanselaar, G. (2007). Visualization of agreement and discussion processes during computer-supported collaborative learning. Computers in Human Behavior, 23, 1105-1125.
Janssen, J., Erkens, G., Kanselaar, G., & Jaspers, J. (2007). Visualization of participation: Does it contribute to successful computer-supported collaborative learning? Computers & Education, 49, 1037-1065.
Jermann, P., & Dillenbourg, P. (2008). Group mirrors to support interaction regulation in collaborative problem solving. Computers & Education, 51, 279-296.
Jiang, L., Elen, J., & Clarebout, G. (2009). The relationships between learner variables, tool-usage behaviour and performance. Computers in Human Behavior, 25, 501-509.
Keller, T., & Tergan, S. O. (2005). Visualizing knowledge and information: An introduction. In S. O. Tergan & T. Keller (Eds.), Knowledge and information visualization: Searching for synergies (Vol. 3426, pp. 1-23). Berlin: Springer-Verlag Berlin.
Kenny, D. A., Kashy, D. A., & Cook, W. L. (2006). Dyadic data analysis. New York/London: The Guilford Press.
Kenny, D. A., Mannetti, L., Pierro, A., Livi, S., & Kashy, D. A. (2002). The statistical analysis of data from small groups. Journal of Personality and Social Psychology, 83, 126-137.

Using Group Awareness Tools 37
Kirschner, F., Paas, F., & Kirschner, P. A. (2009). A cognitive load approach to collaborative learning: United brains from complex learning. Educational Psychology Review, 21, 31-42.
Kirschner, P. A., Beers, P. J., Boshuizen, H. P. A., & Gijselaers, W. H. (2008). Coercing shared knowledge in collaborative learning environments. Computers in Human Behavior, 24, 403-420.
Kirschner, P. A., Strijbos, J. W., Kreijns, K., & Beers, P. J. (2004). Designing electronic collaborative learning environments. Educational Technology Research and Development, 52(3), 47-66.
Kreijns, K., & Kirschner, P. A. (2001). The social affordances of computer-supported collaborative learning environments. Paper presented at the 31st Annual Frontiers in Education Conference, Reno, NV.
Kreijns, K., Kirschner, P. A., & Jochems, W. (2003). Identifying the pitfalls for social interaction in computer-supported collaborative learning environments: A review of the research. Computers in Human Behavior, 19, 335-353.
Lipponen, L., Rahikainen, M., Lallimo, J., & Hakkarainen, K. (2003). Patterns of participation and discourse in elementary students' computer-supported collaborative learning. Learning and Instruction, 13, 487-509.
MacKinnon, D. P., Fairchild, A. J., & Fritz, M. S. (2007). Mediation analysis. Annual Review of Psychology, 58, 593-614.
Manlove, S., Lazonder, A. W., & De Jong, T. (2006). Regulative support for collaborative scientific inquiry learning. Journal of Computer Assisted Learning, 22, 87-98.
McGrath, J. E. (1991). Time, interaction, and performance (TIP). Small Group Research, 22, 147-174.
Mendoza-Chapa, S., Romero-Salcedo, M., & Oktaba, H. (2000). Group awareness support in collaborative writing systems. Paper presented at the 6th International Workshop on Groupware (CRIWG'00), Madeira, Portugal.
Michinov, N., & Primois, C. (2005). Improving productivity and creativity in online groups through social comparison process: New evidence for asynchronous electronic brainstorming. Computers in Human Behavior, 21, 11-28.
Molinari, G., Sangin, M., Dillenbourg, P., & Nussli, M. A. (2009). Knowledge interdependence with the partner, accuracy of mutual knowledge model and computer-supported collaborative learning. European Journal of Psychology of Education, 24, 129-144.
Phielix, C., Prins, F. J., & Kirschner, P. A. (2010). Awareness of group performance in a CSCL-environment: Effects of peer feedback and reflection. Computers in Human Behavior, 26, 151-161.
Romero-Salcedo, M., Osuna-Gómez, C., A., Sheremetov, L., Villa, L., Morales, C., Rocha, L., et al. (2004). Study and analysis of workspace awareness in CDebate: A groupware application for collaborative debates. Interacting with Computers, 16, 657-681.
Salomon, G., & Globerson, T. (1989). When teams do not function the way they ought to. International Journal of Educational Research, 13, 89-99.
Sangin, M., Molinari, G., Nüssli, M. A., & Dillenbourg, P. (2008). How learners use awareness cues about their peer's knowledge? Insights from synchronized eye-tracking data. In P. A. Kirschner, F. Prins, V. Jonker & G. Kanselaar (Eds.), Cre8ting a learning world: Proceedings of the 8th International Conference of the Learning Sciences (Vol. 2, pp. 287-294). Utrecht, The Netherlands: International Society of the Learning Sciences.

Using Group Awareness Tools 38
Savicki, V., Kelley, M., & Ammon, B. (2002). Effects of training on computer-mediated communication in single or mixed gender small task groups. Computers in Human Behavior, 18(3), 257-270.
Schmidt, K. (2002). The problem with 'Awareness': Introductory remarks on 'Awareness in CSCW'. Computer Supported Cooperative Work (CSCW), 11, 285-298.
Shepperd, J. A. (1993). Productivity loss in performance groups: A motivation analysis. Psychological Bulletin, 113, 67-81.
Shrout, P. E., & Bolger, N. (2002). Mediation in experimental and nonexperimental studies: New procedures and recommendations. Psychological Methods, 7, 422-445.
Slof, B., Erkens, G., Kirschner, P. A., Jaspers, J. G. M., & Janssen, J. (2010). Guiding students’ online complex learning-task behavior through representational scripting. Computers in Human Behavior, 26, 927–939.
Straus, S. G. (1997). Technology, group process, and group outcomes: Testing the connections in computer-mediated and face-to-face groups. Human-Computer Interaction, 12, 227-266.
Strijbos, J. W., Martens, R. L., & Jochems, W. M. G. (2004). Designing for interaction: Six steps to designing computer-supported group-based learning. Computers & Education, 42, 403-424.
Sweller, J., & Chandler, P. (1994). Why some material is difficult to learn. Cognition and Instruction, 12, 185-233.
Teasley, S. D., & Roschelle, J. (1993). Constructing a joint problem space: The computer as a tool for sharing knowledge. In S. P. Lajoie (Ed.), Computers as cognitive tools: Technology in education (pp. 229-258). Hillsdale, NJ, England: Lawrence Erlbaum Associates, Inc.
Van Bruggen, J. M., Kirschner, P. A., & Jochems, W. (2002). External representation of argumentation in CSCL and the management of cognitive load. Learning and Instruction, 12, 121-138.
Van Gog, T., Kester, L., Nievelstein, F., Giesbers, B., & Paas, F. (2009). Uncovering cognitive processes: Different techniques that can contribute to cognitive load research and instruction. Computers in Human Behavior, 25, 325-331.
Ware, C. (2005). Visual queries: The foundation of visual thinking In S. O. Tergan & T. Keller (Eds.), Knowledge and information visualization: Searching for synergies (Vol. 3426, pp. 27-35). Berlin: Springer-Verlag Berlin.
Webb, N. M. (1995). Group collaboration in assessment: Multiple objectives, processes, and outcomes. Educational Evaluation and Policy Analysis, 17, 239-261.
Webb, N. M., Nemer, K. M., & Zuniga, S. (2002). Short circuits or superconductors? Effects of group composition on high-achieving students' science assessment performance. American Educational Research Journal, 39, 943-989.
Webb, N. M., & Palincsar, A. S. (1996). Group processes in the classroom. In D. C. Berliner (Ed.), Handbook of educational psychology (pp. 841-873). New York: Simon & Schuster Macmillan.
Weinberger, A., Ertl, B., Fischer, F., & Mandl, H. (2005). Epistemic and social scripts in computer-supported collaborative learning. Instructional Science, 33, 1-30.
Yager, S., Johnson, R. T., Johnson, D. W., & Snider, B. (1986). The impact of group processing on achievement in cooperative learning groups. Journal of Social Psychology, 126, 389-397.
Zumbach, J., Hillers, A., & Reimann, P. (2004). Distributed problem-based learning: The use of feedback mechanisms in online learning. In T. S. Roberts (Ed.), Online collaborative learning: Theory and practice (pp. 86-102). Hershey, PA: Idea Group, Inc.

Using Group Awareness Tools 39
Zumbach, J., & Reimann, P. (2003). Influence of feedback on distributed problem based learning: Enhancing online communities in group functioning and well-being. In B. Wasson, S. Ludvigsen & U. Hoppe (Eds.), Designing for change in networked learning environments (pp. 219-228). Dordrecht, The Netherlands: Kluwer.

Using Group Awareness Tools 40
Figure 1 Screenshot of the Participation-tool

Using Group Awareness Tools 41
Figure 2 Screenshot of VCRI

Using Group Awareness Tools 42
Figure 3 Development of intensity of PT use and duration of PT use during the eight weeks of the study.

Using Group Awareness Tools 43
Figure 4
Graphical representation of mediation analyses.

Using Group Awareness Tools 44
Table 1
Means, standard deviations, and intercorrelations of variables used in the study.
N M SD 1 2 3 4 5 6 7 8 1 Intensity of PT use 107 77.36 38.92 - .23* .03 -.08 -.02 -.02 -.01 -.04 2 Overall duration of PT use 107 66.82 43.36 - .30** .36** .32** -.36* .25** .27 3 Awareness of participation 107 3.21 0.67 - .33** .32** .06 .23* .28 4 Participation chat discussion 107 294.92 184.46 - .17 .12 .83** .06 5 Participation cowriter 107 6816.50 1938.87 - -.31 .17 .17 6 Equality of participationa 35 .15 .07 - .10 .02 7 Group processing 107 19.52 15.44 - -.05 8 Group performancea 35 .58 .10 - Note a Because these variables were measured at the group level, the number of observations is lower. These variables were correlated with aggregated sum scores of the other variables. * p < .05, ** p < .01.

Using Group Awareness Tools 45
Table 2
Estimates for random intercept multilevel model investigating the effect of intensity of PT use on
awareness of participation (N = 107).
β SE
γ00 = Intercept 3.033 0.133
β1 = Intensity of PT use 0.002 0.001
Variance
Group level 0.214 0.036
Individual level 0.022 0.071
Deviance 200.373
Decrease in deviance 0.092
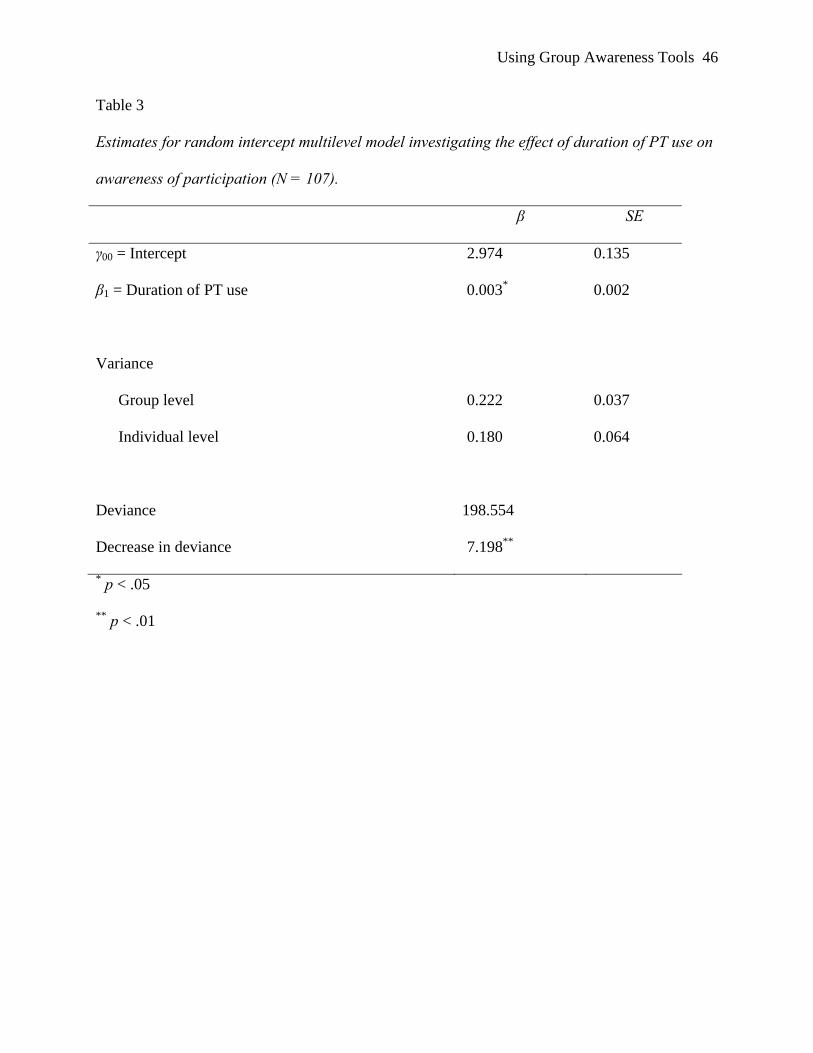
Using Group Awareness Tools 46
Table 3
Estimates for random intercept multilevel model investigating the effect of duration of PT use on
awareness of participation (N = 107).
β SE
γ00 = Intercept 2.974 0.135
β1 = Duration of PT use 0.003* 0.002
Variance
Group level 0.222 0.037
Individual level 0.180 0.064
Deviance 198.554
Decrease in deviance 7.198**
* p < .05
** p < .01

Using Group Awareness Tools 47
Table 4
Estimates for random intercept multilevel model investigating the effect of intensity of PT use on
student participation in the online discussion (N = 107).
β SE
γ00 = Intercept 301.860 37.860
β1 = Intensity of PT use -0.073 0.361
Variance
Group level 17642.950 2930.492
Individual level 17184.612 5650.845
Deviance 1387.234
Decrease in deviance 0.165

Using Group Awareness Tools 48
Table 5
Estimates for random intercept multilevel model investigating the effect of duration of PT use on
student participation in the online discussion (N = 107).
β SE
γ00 = Intercept 197.803 37.122
β1 = Duration of PT use 1.463** 0.425
Variance
Group level 16038.421 2683.000
Individual level 14454.387 4893.250
Deviance 1375.670
Decrease in deviance 11.399**
** p < .01

Using Group Awareness Tools 49
Table 6
Estimates for random intercept multilevel model investigating the effect of intensity of PT use on
student participation in the Cowriter (N = 107).
β SE
γ00 = Intercept 6731.366 417.540
β1 = Intensity of PT use 1.153 4.488
Variance
Group level 2.879 106 0.486 106
Individual level 0.943 106 0.496 106
Deviance 1899.746
Decrease in deviance 4.903

Using Group Awareness Tools 50
Table 7
Estimates for random intercept multilevel model investigating the effect of duration of PT use on
student participation in the Cowriter (N = 107).
β SE
γ00 = Intercept 5930.745 360.124
β1 = Duration of PT use 13.264** 4.439
Variance
Group level 2.938 106 0.497 106
Individual level 0.481 106 0.403 106
Deviance 1892.121
Decrease in deviance 12.528**
** p < .01

Using Group Awareness Tools 51
Table 8
Estimates for random intercept multilevel model investigating the effect of intensity of PT use on
activities that coordinate and regulate the relational space (N = 107).
β SE
γ00 = Intercept 17.201 3.304
β1 = Intensity of PT use 0.031 0.035
Variance
Group level 178.267 29.925
Individual level 61.912 30.938
Deviance 883.336
Decrease in deviance 0.408

Using Group Awareness Tools 52
Table 9
Estimates for random intercept multilevel model investigating the effect of duration of PT use on
activities that coordinate and regulate the relational space (N = 107).
β SE
γ00 = Intercept 12.691 3.099
β1 = Duration of PT use 0.103** 0.037
Variance
Group level 164.973 27.713
Individual level 62.655 30.399
Deviance 876.611
Decrease in deviance 2.743*
* p < .05
** p < .01