Embed Size (px)
Citation preview
Financial Reporting and Analysis of:
Intel Corporation
Stock symbol: INTC
Listed on the:
National Association of Securities Dealers Automated Quotation (NASDAQ)
Prepared for:
Dr. Clark Wheatley
Florida International University
In partial fulfillment of the requirements of the course:
ACG6175
2
Table of Contents Page
Executive Summary ..................................................................................................................................... 3 Strategic Analysis ......................................................................................................................................... 4 Company Overview .................................................................................................................................. 4 Industry Analysis ...................................................................................................................................... 5 Competitive Environment ........................................................................................................................ 7 Competitive Advantage ......................................................................................................................... 10 SWOT Analysis ....................................................................................................................................... 11 Values of Key Personnel ........................................................................................................................ 14 Societal Expectation .............................................................................................................................. 15
Accounting Analysis ................................................................................................................................... 16 Policies ................................................................................................................................................... 16 Flexibility ................................................................................................................................................ 19 Strategy .................................................................................................................................................. 22 Disclosure Quality .................................................................................................................................. 24 Red Flags ................................................................................................................................................ 25 Distortions ............................................................................................................................................. 26
Financial Analysis ....................................................................................................................................... 27 Return on Equity Decomposition ........................................................................................................... 27 Profitability ............................................................................................................................................ 31 Asset Management ................................................................................................................................ 34 Liquidity ................................................................................................................................................. 36 Debt & Coverage .................................................................................................................................... 39 Sustainable Growth ............................................................................................................................... 42
Forecasting ................................................................................................................................................ 43 Sales ....................................................................................................................................................... 44 Income ................................................................................................................................................... 45 Balance Sheet ........................................................................................................................................ 48
Valuation ................................................................................................................................................... 49 Price Multiples ....................................................................................................................................... 50 Discounted Free Cash Flow .................................................................................................................... 51 Discounted Abnormal Earnings ............................................................................................................. 53 Discounted Abnormal Return on Equity ................................................................................................ 54 Earnings Growth (Buffet’s Model) ......................................................................................................... 54
Assessment Of Solvency ............................................................................................................................ 56 Calculation of Altman Z-‐Score Model .................................................................................................... 57 Estimate of Debt Rating ......................................................................................................................... 58 Actual Bond Rating ................................................................................................................................ 59
Conclusion ................................................................................................................................................. 60
3
Executive Summary
Based on Strategy, Accounting, Financial, Credit and Prospective analysis of Intel
Corporation, it is undervalued at current price levels and is a BUY. The analysis suggests Intel's
sustainable growth rate is 12%, with an expected earnings per share growth of 35% over the
next 10 years and year-‐over-‐year value creation of 6.5% to 14.7%. Finally, with 85%+ of the
microprocessor market, Intel is consumer monopoly allowing it to command a premium for its
products resulting in profit margins well above industry norms.
4
Strategic Analysis
Company Overview
Intel Corporation (Intel) is a multinational semiconductor chip maker headquartered in
Santa Clara, California. Founded by semiconductor pioneers Robert Noyce and Gordon Moore
and associated with visionary Andrew Grove, Intel combines advanced chip design capability
with state-‐of-‐the-‐art manufacturing capability1. Incorporated in 1968, Intel's core business is
designing and manufacturing integrated digital technology platforms consisting of
microprocessors and chipsets2. These platforms are used in various computing applications
including tablets, smartphones, laptops, desktops, servers, automobile systems, medical
devices and factory machines. The company also provides mobile components such as WiFi
products, radio frequency transceivers, Bluetooth products, power management chips and
global navigation satellite system components. In addition, through various company
acquisitions, Intel offers network and content security as well as security software products for
consumer, mobile, and corporate environments. Intel sells its products primarily to
manufacturers in the computing and communications industries. Intel has over 107,000
employees and is the largest publicly traded semiconductor manufacturer by revenues with
sales of over $52 billion last year3. The following sections analyze the elements of Intel's
success.
1 en.wikipedia.org/wiki/Intel
2 www.reuters.com/finance/stocks/companyProfile?symbol=INTC.O
3 finance.yahoo.com/q?s=intc
5
Industry Analysis
In order to understand the strategic avenues Intel may pursue, one must understand
the context of the semiconductor industry. The number of semiconductor components used in
our daily lives is constantly expanding. Chips form the core of the newest technological devices
such as smartphones and tablets. Semiconductors are also becoming more common in
automotive and industrial markets as well as consumer goods such as televisions and
appliances. As a consequence, the semiconductor industry has been growing for over 40 years,
in spite of economic downturns, the bursting of the internet bubble and the 2008–2009
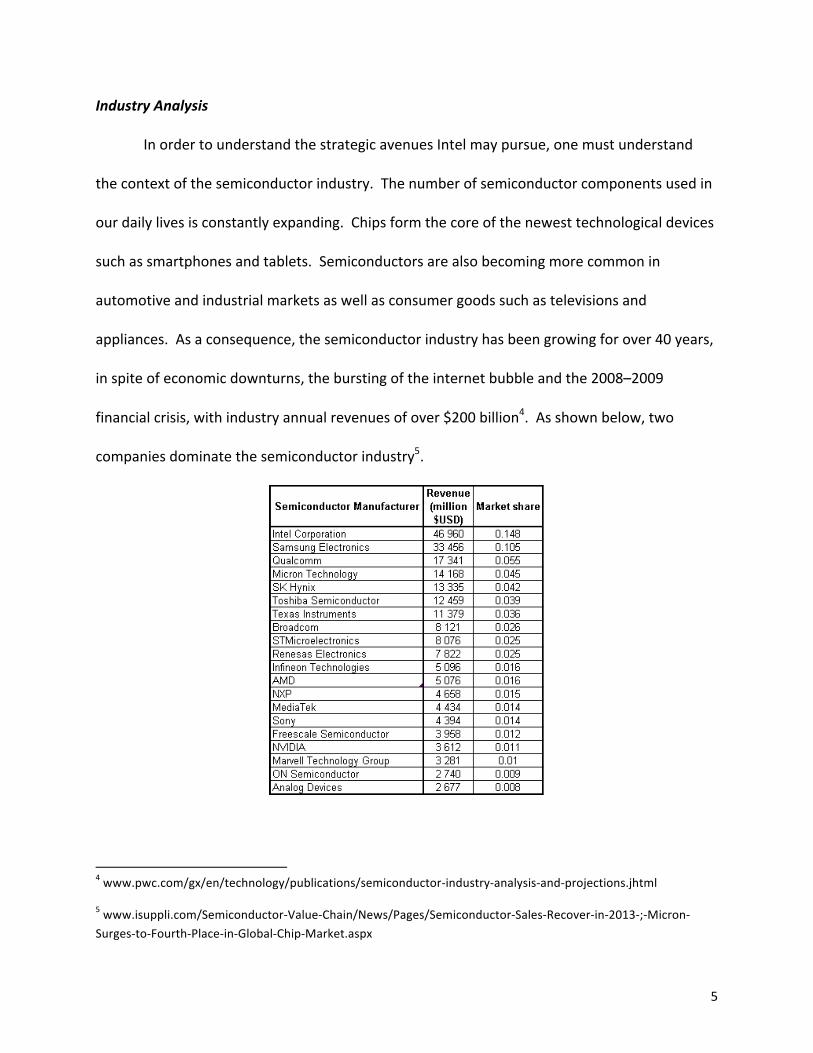
financial crisis, with industry annual revenues of over $200 billion4. As shown below, two
companies dominate the semiconductor industry5.
4 www.pwc.com/gx/en/technology/publications/semiconductor-‐industry-‐analysis-‐and-‐projections.jhtml
5 www.isuppli.com/Semiconductor-‐Value-‐Chain/News/Pages/Semiconductor-‐Sales-‐Recover-‐in-‐2013-‐;-‐Micron-‐Surges-‐to-‐Fourth-‐Place-‐in-‐Global-‐Chip-‐Market.aspx
6
It should be noted, however, that the semiconductor space is very complex. The
semiconductor industry is made up of four main product categories: memory, microprocessors,
integrated circuits and complex "Systems on a Chip", where a single integrated circuit chip has
an entire system's capability on it. Not all manufacturers participate in all categories. For
example, with the exception of Advanced Micro Devices (AMD), Intel dominates the
microprocessor segment with over 85% of the market share6.
Due to fierce competition and new technologies that lower the cost of producing
semiconductors, there is a constant need for semiconductor manufacturers to come up with
new and cheaper products. Thus, the semiconductor industry is characterized by rapid
technological innovation. Another characteristic of the semiconductor industry is the high
capital expenditures needed to support both growth and technological progress. Specifically,
the fixed costs and minimum scale associated with building a new chip fabrication facility is in
the billions7. Finally, the semiconductor industry has been characterized as being cyclical. This
occurs because semiconductor manufacturers face booms and busts in semiconductor demand.
This cycle coincides with demand for various electronic devices such as personal computers and
smartphones, which is in synch with consumer spending patterns. In other words, when the
economy is good, semiconductor manufacturers generally produce at capacity. However, when
the economy is struggling and computer sales are slow, the semiconductor manufacturers
struggle too8.
6 McGrath, D. (2011-‐08-‐02). IDC cuts PC microprocessor forecast, EE Times, retrieved from www.eetimes.com
7 www.valueline.com/Stocks/Industries/Industry_Analysis__Semiconductor.aspx
8 www.investopedia.com/features/industryhandbook/semiconductor.asp
7
Competitive Environment
In this section, Porter's Model9 is used to analyze the semiconductor industry. The
model is based on five forces including Rivalry Among Competition, Threat Of Substitution,
Threat Of New Entrants, Bargaining Power Of Buyers and Bargaining Power Of Suppliers, each
of which is addressed in the following paragraphs.
RIVALRY AMONG COMPETITION-‐-‐The semiconductor industry is characterized by
intense rivalry between a few companies. Firms in the semiconductor industry compete to
manufacture products that are smaller, faster and cheaper10. This is the result of a short
product cycle that is associated with PC components such as microprocessors and memory that
are near obsolescence shortly after being released. The semiconductor industry changes
rapidly as technology demands change. This change keeps the industry competitive as each
company tries to get to market first with differentiated products. The result is an industry that
is always on the cutting-‐edge. The technology is constantly changing into something better so
it is hard for one company to remain on top. What tends to happen with this type of rivalry is
that there are several industry players with similar size that rise as the larger players. This
happens because no one firm can always be the one with the newest, fastest and cheapest
product available11.
9 Porter, M. (1996). “What is strategy?” Harvard Business Review 74: 61-‐78.
10 www.investopedia.com/features/industryhandbook/semiconductor.asp
11 Banks, W., (2011). Semiconductor Industry Analysis & Competitive Analysis. Goizueta Business School, Emory University.
8
THREAT OF SUBSTITUTION-‐-‐The threat of substitutes in the semiconductor industry
depends on the segment12. In general, there is no substitute for semiconductors for use in
electronic products needing microprocessors or memory. That being said, new techniques to
produce semiconductor products are possible. However, the rivalry in the semiconductor
industry has enabled the industry to change manufacturing lines in a very short time. This
ability takes away opportunities for others to compete in the market. The semiconductor
industry would respond quickly to any successful substitute process, limiting the advantage that
particular substitute approach may have had. Additionally, given the research and
development costs, as well as manufacturing plant cost constraints, semiconductor firms can
find themselves spending significant amounts of money to research and develop new products
just to find that their competition has already beat them to it. This industry tension, keeps the
semiconductor business environment volatile and difficult for any substitutes to remain
competitive13.
THREAT OF NEW ENTRANTS-‐-‐Setting up a chip fabrication facility requires billions of
dollars. This high cost makes entry near impossible except for the largest firms. Thus, the
established semiconductor firms have an enormous advantage over any new entrants. Another
related barrier is the short product cycle of semiconductors. It would require a new entrant to
the semiconductor industry several products, just to recoup the cost of the manufacturing
plant. "Fabless” chip companies that outsource manufacturing have started to be contenders
in niche areas. However, the speed at which the semiconductor industry can adapt has limited 12 www.investopedia.com/features/industryhandbook/semiconductor.asp
13 Banks, W., (2011). Semiconductor Industry Analysis & Competitive Analysis. Goizueta Business School, Emory University
9
the success of these "Fabless” firms. Another potential threat is if a business that uses
semiconductors in their products decides to backward integrate (e.g., Apple). Another
potential threat is indirect competition from governments that subsidize firms in their country,
giving them an unfair advantage in the market place. Finally, counterfeit semiconductors can
also create unfair competitive forces14.
BARGAINING POWER OF BUYERS-‐-‐The semiconductor industry is dominated by a small
number of large firms. On the other hand, there are numerous buyers ranging from PC makers
to electronic do-‐it-‐yourselfers. In general, this means buyers have little bargaining power.
However, there are some exceptions. Large PC and electronic device makers do have some
influence due to the shear volume of products they sell. Their consistent large purchase
volumes give some computer and device manufacturers (e.g., Dell and Hewlett-‐Packard)
considerable leverage. Additionally, these high volumes help semiconductor manufactures
lower their per unit fixed costs. Thus, there is a symbiotic relationship between the
semiconductors manufactures and the major computer and device manufacturers14.
BARGAINING POWER OF SUPPLIERS-‐-‐There are a small number of semiconductor
manufacturers but a large number of suppliers. This allows the semiconductor firms to assert
influence and reduce the bargaining power of each individual supplier to a minimum15.
However, for some niche services such as fabrication plant operation or foundries, "Fabless"
firms, who only design chips and have others firms manufacturer them, are becoming
14 Banks, W., (2011). Semiconductor Industry Analysis & Competitive Analysis. Goizueta Business School, Emory University
15 www.investopedia.com/features/industryhandbook/semiconductor.asp
10
increasingly dependent on a handful of large foundries. As the suppliers of cutting-‐edge
equipment and production skills, these foundries are gaining considerable bargaining influence.
Competitive Advantage
Most types of semiconductors are fungible, forcing semiconductor manufactures to
pursue a competitive strategy based on differentiation. For differentiation to be successful, a
firm must achieve three things: 1) identify attributes of a product that customers value, 2)
position to meet the customer need in a unique manner, and 3) achieve differentiation at a cost
lower than the price the customer is willing to pay16.
Intel is the world's fifth most valuable brand worth $35 billion and its microprocessors
drive almost 90% of the world's personal computers. Intel is able to achieve this success by
dominating the above three elements of a differentiation strategy. First, Intel employs
anthropologists who study how people use technology in their lives. Intel also uses focus
groups to find out what customers think of future scenarios that Intel anticipates such as
lifestyle developments. This information helps Intel's designers and engineers understand what
customer want. Second, Intel doesn't just sell its semiconductors. Intel's approach is to create
many types of chips and software, and then combine them into platforms, where a platform is
an integrated set of proven technologies designed from the start to work together. These
platforms enhance performance bringing added value for consumers. Finally, Intel is a
'manufacturing monster' having invested billions of dollars in manufacturing plants that can
produce more processors in a day than some of Intel rivals can produce in a year. Intel can
16 Palepu, K &, Healy, P (2007). Title Business Analysis and Valuation: Using Financial Statements. Edition 4. Publisher Cengage Learning.
11
develop and bring a product to market faster than anyone else. By leveraging this
manufacturing capability, Intel can increase production to bring a product to market in large
volumes. This agility allows Intel to deliver a product that consumers want at price customers
value17.
SWOT Analysis
A SWOT analysis is a structured planning framework to evaluate the strengths,
weaknesses, opportunities, and threats for a firm. Specifically, strengths address business
characteristics that give the firm an advantage over others; weaknesses identify company
characteristics that place the firm at a disadvantage relative to others; opportunities are
circumstances the firm could exploit to its advantage; and finally, threats are conditions that
could cause trouble for the firm. The following paragraphs apply the SWOT framework to Intel.
STRENGTHS-‐-‐Intel is an industry leader. Intel controls over 85% of the microprocessor
market and over 50% of the graphics chip market. Intel is also a big player in the memory and
motherboard market. This leadership position gives Intel more latitude to invest in research
and development, which translates into increased efficiency of design and manufacturing. Intel
also has a strong company network. Intel controls the entire production process for most of its
products. This network of manufacturing facilities and assembly/test facilities gives Intel a
powerful competitive advantage. It allows Intel to have more direct control over processes,
quality control, product cost, volume, and timing of production. Further, Intel has strong brand
recognition. Intel is the world's fifth most valuable brand worth over $35 billion. This strong
brand recognition coupled with strong market position enhances Intel's investor confidence.
17 businesscasestudies.co.uk/intel/
12
Additionally, Intel has strategic partnerships with prominent technology players such as IBM,
Microsoft, LG, AT&T and Nokia. This allows Intel to launch new services, reach more
customers, and improve their expertise in niche areas. These strategic collaborations enable
Intel to expand its customer base and product portfolio, enhancing their competitive
advantage. Another strength is that Intel's research and development capabilities are second
to none. The company consistently spends over $5 billion a year on research and development.
The result is a consistent line of innovative products and advanced technologies. Finally, Intel
offers a broad portfolio of microprocessors. They have microprocessors and chipsets for
notebooks, netbooks and desktops. Intel also supplies products for data center and cloud
computing environments. Additionally, Intel provides chips at variety of price and performance
points18 to meet various customer needs.
WEAKNESSES-‐-‐Given the fungible nature of semiconductors, Intel faces a never-‐ending
battle with competitors trying to take its leadership spot. In some niche areas, competitors,
such as AMD with its 64-‐bit processor, are catching up to Intel. In other areas, such as flash
memory, companies like Samsung have overtaken Intel. These challenges will likely continue.
Another issue is the volatility of the semiconductor industry. Overall, the industry is very
cyclical with the general health of the economy dictating demand for semiconductor
components. Unexpected changes in the global economy can have an extremely negative
effect on Intel and the semiconductor industry. Additionally, in Intel's ongoing pursuit to
expand its customer base, it often ventures into products like wireless chipsets and
communications. While these offering expand Intel's portfolio, most of Intel’s revenue still
18 www.datamonitor.com
13
comes from microprocessor and motherboard products. Thus, expanding into these non-‐core
areas, requires capital with a disproportionate return. Finally, Intel is dependent on a few
customers for a significant proportion of its revenues. Intel's largest two customers, Hewlett-‐
Packard and Dell, account for over a third of its revenues. This high dependence on a few
customers could reduce Intel's bargaining power and increases its business risk19.
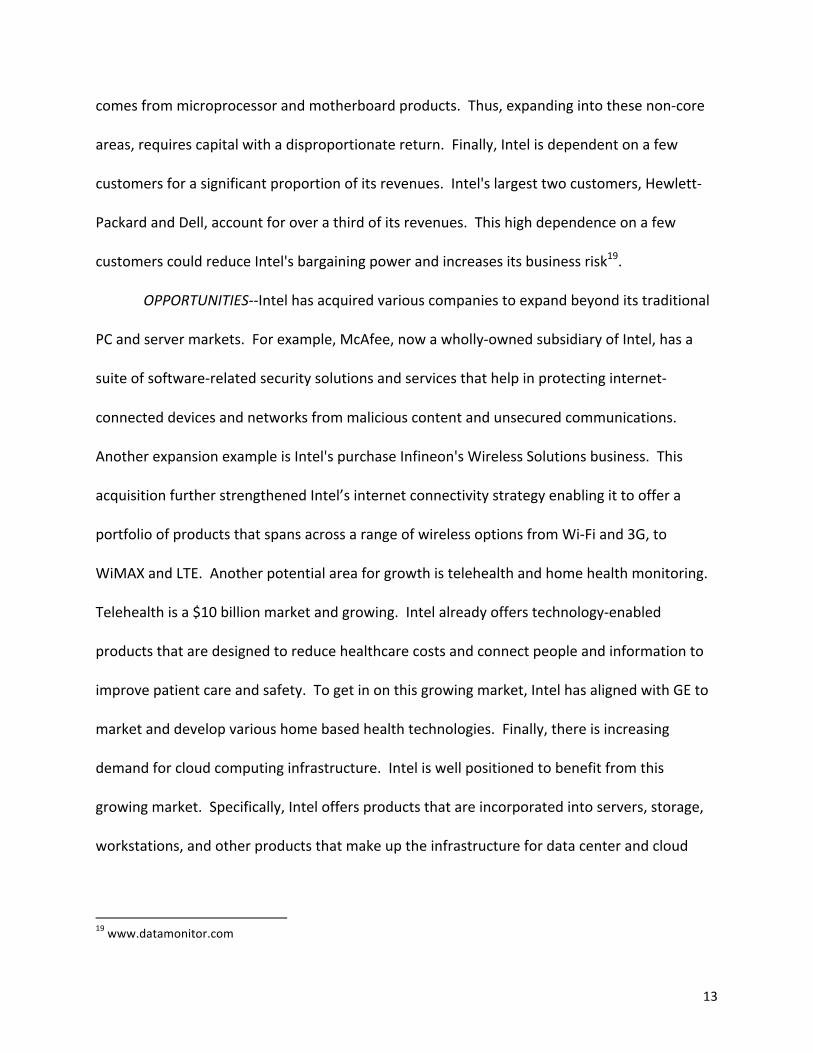
OPPORTUNITIES-‐-‐Intel has acquired various companies to expand beyond its traditional
PC and server markets. For example, McAfee, now a wholly-‐owned subsidiary of Intel, has a
suite of software-‐related security solutions and services that help in protecting internet-‐
connected devices and networks from malicious content and unsecured communications.
Another expansion example is Intel's purchase Infineon's Wireless Solutions business. This
acquisition further strengthened Intel’s internet connectivity strategy enabling it to offer a
portfolio of products that spans across a range of wireless options from Wi-‐Fi and 3G, to
WiMAX and LTE. Another potential area for growth is telehealth and home health monitoring.
Telehealth is a $10 billion market and growing. Intel already offers technology-‐enabled
products that are designed to reduce healthcare costs and connect people and information to
improve patient care and safety. To get in on this growing market, Intel has aligned with GE to
market and develop various home based health technologies. Finally, there is increasing
demand for cloud computing infrastructure. Intel is well positioned to benefit from this
growing market. Specifically, Intel offers products that are incorporated into servers, storage,
workstations, and other products that make up the infrastructure for data center and cloud
19 www.datamonitor.com
14
computing environments. Intel has also invested heavily in various cloud computing
companies20.
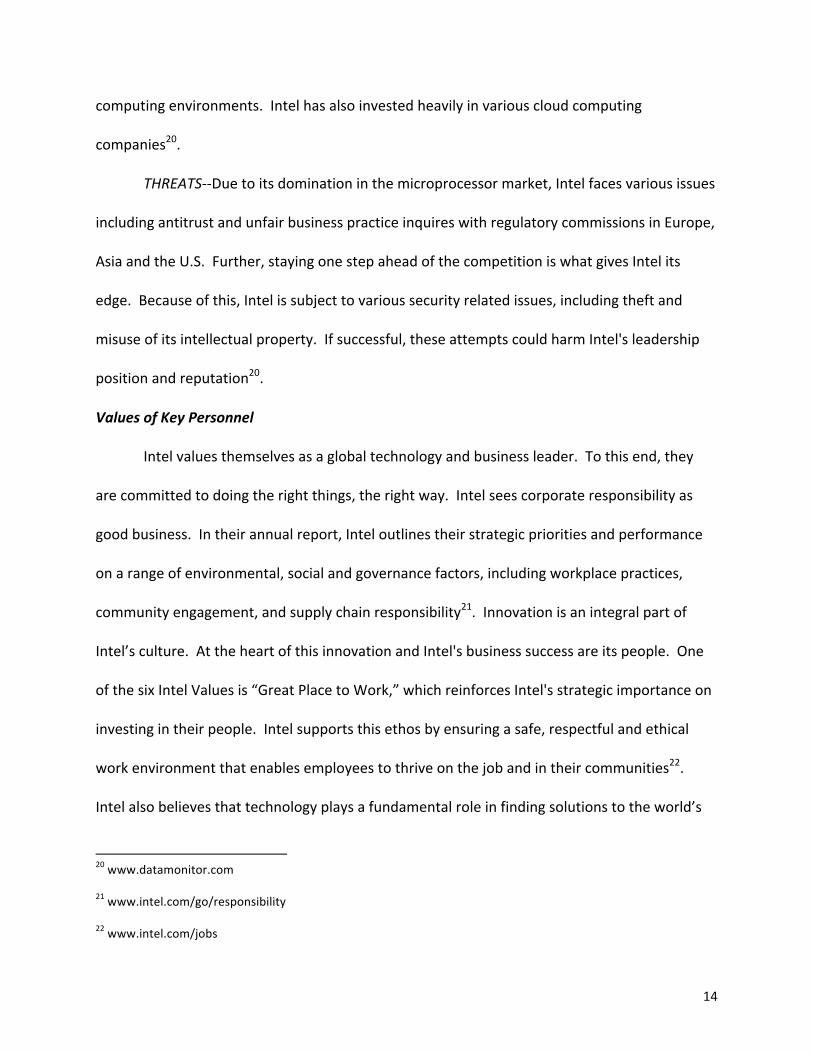
THREATS-‐-‐Due to its domination in the microprocessor market, Intel faces various issues
including antitrust and unfair business practice inquires with regulatory commissions in Europe,
Asia and the U.S. Further, staying one step ahead of the competition is what gives Intel its
edge. Because of this, Intel is subject to various security related issues, including theft and
misuse of its intellectual property. If successful, these attempts could harm Intel's leadership
position and reputation20.
Values of Key Personnel
Intel values themselves as a global technology and business leader. To this end, they
are committed to doing the right things, the right way. Intel sees corporate responsibility as
good business. In their annual report, Intel outlines their strategic priorities and performance
on a range of environmental, social and governance factors, including workplace practices,
community engagement, and supply chain responsibility21. Innovation is an integral part of
Intel’s culture. At the heart of this innovation and Intel's business success are its people. One
of the six Intel Values is “Great Place to Work,” which reinforces Intel's strategic importance on
investing in their people. Intel supports this ethos by ensuring a safe, respectful and ethical
work environment that enables employees to thrive on the job and in their communities22.
Intel also believes that technology plays a fundamental role in finding solutions to the world’s
20 www.datamonitor.com
21 www.intel.com/go/responsibility
22 www.intel.com/jobs
15
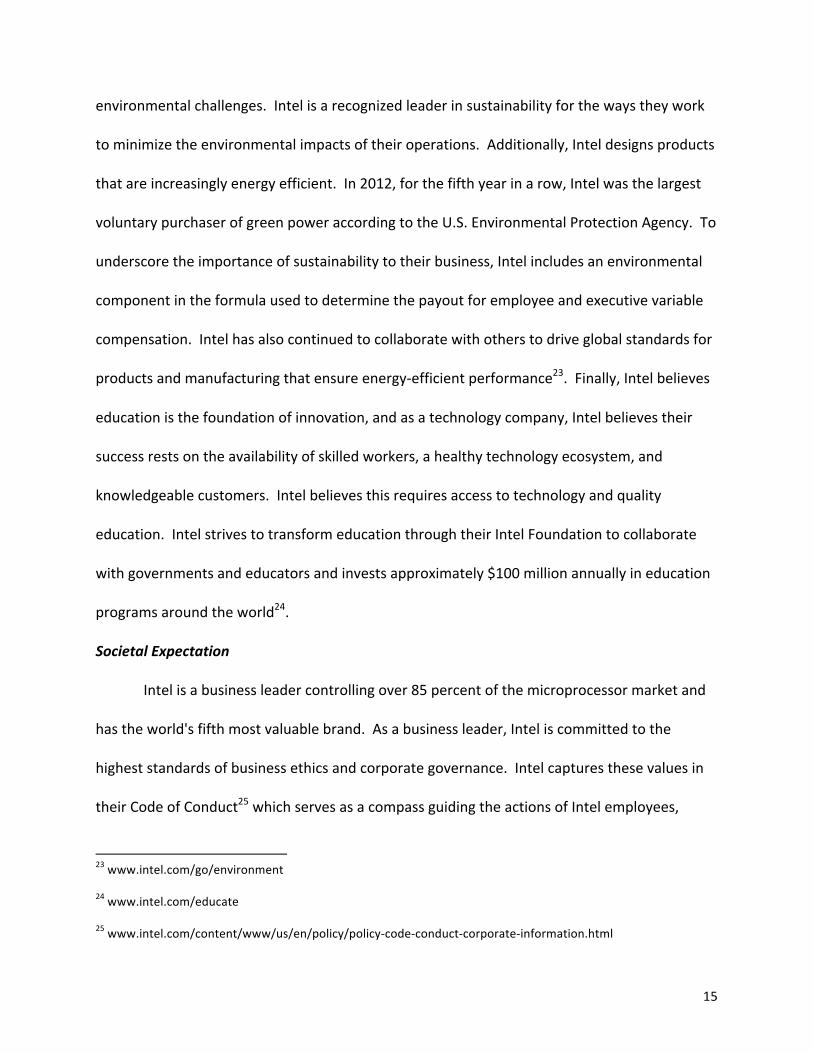
environmental challenges. Intel is a recognized leader in sustainability for the ways they work
to minimize the environmental impacts of their operations. Additionally, Intel designs products
that are increasingly energy efficient. In 2012, for the fifth year in a row, Intel was the largest
voluntary purchaser of green power according to the U.S. Environmental Protection Agency. To
underscore the importance of sustainability to their business, Intel includes an environmental
component in the formula used to determine the payout for employee and executive variable
compensation. Intel has also continued to collaborate with others to drive global standards for
products and manufacturing that ensure energy-‐efficient performance23. Finally, Intel believes
education is the foundation of innovation, and as a technology company, Intel believes their
success rests on the availability of skilled workers, a healthy technology ecosystem, and
knowledgeable customers. Intel believes this requires access to technology and quality
education. Intel strives to transform education through their Intel Foundation to collaborate
with governments and educators and invests approximately $100 million annually in education
programs around the world24.
Societal Expectation
Intel is a business leader controlling over 85 percent of the microprocessor market and
has the world's fifth most valuable brand. As a business leader, Intel is committed to the
highest standards of business ethics and corporate governance. Intel captures these values in
their Code of Conduct25 which serves as a compass guiding the actions of Intel employees,
23 www.intel.com/go/environment
24 www.intel.com/educate
25 www.intel.com/content/www/us/en/policy/policy-‐code-‐conduct-‐corporate-‐information.html
16
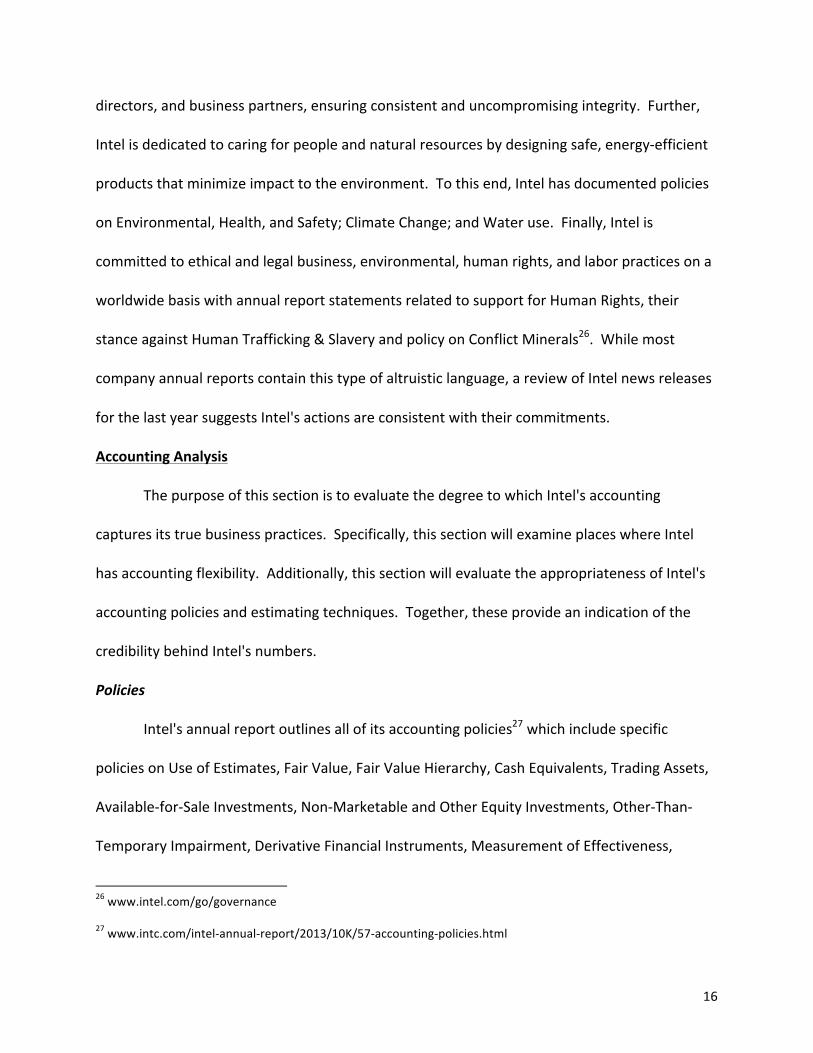
directors, and business partners, ensuring consistent and uncompromising integrity. Further,
Intel is dedicated to caring for people and natural resources by designing safe, energy-‐efficient
products that minimize impact to the environment. To this end, Intel has documented policies
on Environmental, Health, and Safety; Climate Change; and Water use. Finally, Intel is
committed to ethical and legal business, environmental, human rights, and labor practices on a
worldwide basis with annual report statements related to support for Human Rights, their
stance against Human Trafficking & Slavery and policy on Conflict Minerals26. While most
company annual reports contain this type of altruistic language, a review of Intel news releases
for the last year suggests Intel's actions are consistent with their commitments.
Accounting Analysis
The purpose of this section is to evaluate the degree to which Intel's accounting
captures its true business practices. Specifically, this section will examine places where Intel
has accounting flexibility. Additionally, this section will evaluate the appropriateness of Intel's
accounting policies and estimating techniques. Together, these provide an indication of the
credibility behind Intel's numbers.
Policies
Intel's annual report outlines all of its accounting policies27 which include specific
policies on Use of Estimates, Fair Value, Fair Value Hierarchy, Cash Equivalents, Trading Assets,
Available-‐for-‐Sale Investments, Non-‐Marketable and Other Equity Investments, Other-‐Than-‐
Temporary Impairment, Derivative Financial Instruments, Measurement of Effectiveness,
26 www.intel.com/go/governance
27 www.intc.com/intel-‐annual-‐report/2013/10K/57-‐accounting-‐policies.html
17
Securities Lending, Loans Receivable, Inventories, Property, Plant and Equipment, Goodwill,
Identified Intangible Assets, Product Warranty, Revenue Recognition, Advertising, Employee
Equity Incentive Plans, and Income Taxes. Most of these contain 'boilerplate' language that is
similar to the policies stated in Texas Instruments (TXN) and Advanced Micro Devices (AMD)
annual reports. The following paragraphs highlight some of the most notable policies as they
relate to the credibility of Intel financial statements.
Use of Estimates -‐ Intel makes extensive use of estimates throughout its financial
statements. These include subjective judgments on the valuation of non-‐marketable equity
investments, assessments on the recoverability of long-‐lived assets, recognition and
measurement of current and deferred income taxes, valuation of inventory, and recognition &
measurement of loss contingencies. While TXN and AMD make similar statements, these areas
where estimates are used warrant further investigation when examining the statements.
Fair Value -‐ Fair value is the price that would be received from selling an asset or paid to
transfer a liability in an orderly transaction between market participants at the measurement
date28. When determining fair value, Intel considers the principal or most advantageous
market in which they would transact. The TXN and AMD reports contain nebulous statements
about fair value. Intel, at least states they use an optimistic, but perhaps not realistic,
estimation methodology.
Inventories -‐ Intel computes inventory cost on a first-‐in, first-‐out basis, which is
consistent with TXN and AMD. This industry first-‐in, first-‐out inventory policy makes sense
given the short life of semiconductor products. However, this first-‐in, first-‐out process suggests
28 www.intc.com/intel-‐annual-‐report/2013/10K/57-‐accounting-‐policies.html
18
eventually one of these firms winds up having some obsolete inventory that will have to written
off.
Goodwill -‐ Goodwill represents the excess of the purchase price over the fair value of
net tangible and identifiable intangible assets acquired. Neither Intel, TXN nor AMD amortize
goodwill, but test periodically for impairment. They all evaluate whether goodwill has been
impaired by determining if the estimated fair value of the acquisition is less than the carrying
value. The implied fair value is determined through the use of industry valuation models. Any
differences are expensed. This topic will be discussed further under Long-‐Lived Assets.
Revenue Recognition -‐ Intel's revenue recognition is quite complex due to its different
business segments and its variety of end-‐users. For example, Intel recognizes revenue from
products sold directly to end-‐consumers when delivery has occurred. For sales made to
distributors, Intel defers product revenue and related costs of sales until the distributors sell
the merchandise. This is done primarily to give the distributor price protection because of
frequent sales price reductions and rapid technology obsolescence in the industry. Intel also
receives revenue from license agreements primarily with the McAfee segment. Revenue from
these agreements is deferred and recognized over the performance of the agreement period.
Similarly, revenue Intel derives from online subscription products is deferred and recognized
over the subscription periods. For Intel professional services, revenue is recognized as services
are performed. To make revenue recognition even more complicated, Intel has numerous
relationships where all of these elements are being provided to a single customer. In these
cases, revenue is allocated across the separately identified deliverables and may be recognized
or deferred. Costs associated with all of these revenue generating activities are deferred and
19
amortized over the same period that the related revenue is recognized29. While revenue
recognition is not directly comparable for TXN and AMD, for basic components they use similar
revenue recognition policies. Revenue Recognition is an area of accounting flexibility that will
be discussed further in the paragraphs below.
Flexibility
In the Management's Discussion & Analysis section of the annual report, Intel is very
forthcoming about the extensive use of subjective estimates in their financial reporting30. The
key areas include the valuation of non-‐marketable equity investments, assessment on
recoverability of long-‐lived assets, recognition and measurement of current and deferred
income taxes, the valuation of inventory and recognition and measurement of loss
contingencies. The gist of these estimates are to identify the fair value of an asset. The
estimate methodologies provide ample accounting flexibility for Intel and are covered in more
detail in the following paragraphs.
Non-‐Marketable Equity Investments -‐ Intel invests in non-‐marketable equity
instruments of private companies ranging from start-‐ups to mature companies with established
revenue streams and business models. At the end of December 2013, the value of these types
of investments was valued at $2.3 billion. Since these equity stakes are non-‐marketable, Intel
has to estimate their value. Intel uses two estimating approaches. The first is based on using
financial metrics, such as projected revenue, projected earnings, and financial ratios of
comparable public companies. The selection of companies for comparison is an art since the
29 www.intc.com/intel-‐annual-‐report/2013/10K/57-‐accounting-‐policies.html
30 www.intc.com/intel-‐annual-‐report/2013/10K/28-‐critical-‐accounting-‐estimates.html
20
start-‐up often has a unique product and service. Generally, however, it is based on factors
including company size, growth rate, industry, and development stage. For more mature
companies, Intel uses a discounted cash flow model, which requires significant estimates
regarding the company's revenue, costs, and discount rates based on the risk profile of
comparable companies. Estimates of revenue and costs are developed using available market,
historical, and forecasted data. If Intel determines the fair value of an investment is below the
carrying value, Intel writes down the investment to its fair value. It is interesting to note that
these impairments of non-‐marketable equity investments were $112 million in 2013, $104
million in 2012 and $63 million in 2011. Assuming the estimates are correct, Intel's losses on
these types of investments has doubled over the 2 year period, although the $112 million only
represents about 5% of the entire $2.3 billion portfolio.
Long-‐Lived Assets -‐ Property, Plant, Equipment, Goodwill and other Identified
Intangibles all follow an estimating approach similar to Non-‐Marketable Equity Investments.
Specifically, Intel tries to find comparables based on groupings of like assets. If the assets are
directly producing a revenue stream, then a cash flow model is used. However, even when a
cash flow model is used, considerable subjective judgments regarding the remaining useful lives
of assets have to be made. In general, the assumptions and estimates used to determine future
values and remaining useful lives of Intel's long-‐lived assets are complex, subjective and
influenced by numerous external factors such as industry and economic trends. Overall, these
impairments are small relative to the size of Intel. In 2013, impairment charges were $17
21
million ($21 million in 2012 and $10 million in 2011). It should be noted, however, these values
are small only if you assume the estimates are correct31.
Income Taxes -‐ Intel makes various estimates and judgments in determining the
provision for taxes related to calculation of tax credits, benefits, and deductions. Further
judgments are required in the calculation of certain tax assets and liabilities that arise from
differences in the revenue and expense recognition timing. Changes in the assumptions behind
these estimates may result in an increase or decrease to Intel's tax provisions. These tax
related assumptions also provide another accounting flexibility knob.
Inventory -‐ Semiconductor-‐based products can be considered end-‐products at various
stages of development. Intel has to decide at what point product costs change from R&D
expenditures, which would be expensed in the current period, to cost of sales, which could be
deferred. This point may be different for different customers providing Intel some flexibility
regarding how to expense costs. Intel's inventory valuation is another area providing
accounting flexibility. Their inventory is valued at the lower of cost or market based upon
assumptions concerning future demand and market conditions. Some of the factors considered
are: customer base, stage of the product life cycle, consumer confidence, customer acceptance
and an assessment of selling price in relation to product cost. If the estimated value of the
inventory is less than the carrying value, Intel writes down the inventory and records the
difference as a charge to cost of sales. A final aspect on inventory concerns obsolete inventory.
Intel's valuation of inventory requires an estimation of obsolete inventory. To do this, a
demand forecast is utilized. This is then compared to inventory levels. If the demand forecast
31 www.intc.com/intel-‐annual-‐report/2013/10K/28-‐critical-‐accounting-‐estimates.html
22
for specific products is less than inventory levels, the excess products are written off. These
estimation models are highly sensitive to assumptions, giving Intel plenty of accounting
flexibility by designating 'obsolete' inventory.
Loss Contingencies -‐ This final area also gives Intel considerable accounting flexibility. As
a leader in the industry, Intel is constantly subjected to various legal and administrative
proceedings with potential financial claims. Further, there is always the potential that product
issues will occur while they are still under warranty. Based on these potential claims, Intel
estimates a loss recognized as a charge to income, even if the loss has not occurred (and may
not occur). This is similar to making an allowance for uncollected accounts. The amount set-‐
aside for loss contingencies is highly subjective and is definitely another 'tool' Intel could use to
smooth earnings.
Strategy
As demonstrated above, Intel has significant accounting flexibility. The question,
however, is whether or not they are using this flexibility to accurately communicate Intel's
economic situation or using it to hide something. By comparing Intel's policies to others in the
industry, we can get a first look at potential irregularities. As noted in the Policies section,
Intel's accounting policies are in alignment with other companies in the semiconductor industry
such as TXN and AMD.
Managers could also be tempted to use this flexibility to manage earnings. Intel
managers, however, would not be doing this to avoid triggering debt covenants, since Intel has
more than enough cash to pay off their long-‐term debt. One possibility, however, is
accounting-‐based compensation. Over the last 3-‐years, the top 7 executives at Intel had
23
compensation of $187 million. Most of this was in the form of stock and stock options ($130
million)32. Clearly, there is motive for these managers to keep the stock climbing. Another
motive for Intel's accounting practices is to minimize the tax burden. Intel is pretty open about
this, stating that profits made in another country will stay there for reinvestment purposes
versus bring the profits back to the U.S. where they would be taxed.
There were several accounting changes in 2011 and 201233. In 2011, Intel adopted a
policy concerning revenue recognition related to multiple deliverables. This change simply
allowed Intel to modify the method by which revenue is allocated to the separately identified
deliverables (recurring software subscription versus a one time hardware purchase by the same
customer). According to Intel, this change had no material impact. There were two other
changes, one in 2011 and one in 2012, that had no material impact, but paved the way for more
accounting flexibility. Specifically, the changes allow Intel to assess qualitative factors in
determining whether the fair value of an asset's goodwill and long-‐lived assets are going to be
less than its carrying value. These qualitative factors add to the subjectivity in assessing the fair
value of these items.
Overall, the accounting strategy used by Intel seems to accurately represent the
company’s financial activity and health. Their policies and estimates seem realistic and no
business transactions seem out of place. While it still remains true that Intel has significant
accounting flexibility, Intel uses a conservative approach in alignment with industry norms.
Finally, the auditor (Ernest & Young) has this to say, "...the financial statements referred to
32 www.intc.com/IntelProxy2014/58-‐execitive-‐compensation.html
33 www.intc.com/intel-‐annual-‐report/2013/10K/58-‐accounting-‐changes.html
24
above present fairly, in all material respects, the consolidated financial position of Intel
Corporation at December 28, 2013 and December 29, 2012". Additionally, they state, "Intel
Corporation maintained, in all material respects, effective internal control over financial
reporting as of December 28, 2013".
Disclosure Quality
Annual reports can be over a 100 pages. The latest from Intel is 140 pages. Within
those pages, companies have a choice on making it more or less easy for someone to assess the
company's accounting quality and use the statements to understand the business reality of the
firm. Overall, Intel appears to make an attempt to be as transparent as possible with their
financial reporting. While some aspects of the accounting procedures are subjective and
accounting changes made in 2011 and 2012 increase this qualitative approach, this seems to
have been done to increase the level of fidelity into specific elements of revenue streams
versus just aggregating them in one number that is reported.
The Executive Letters accompanying Intel's annual report are primarily cheerleading and
motivational speech. However, the Management's Discussion and Analysis of Financial
Condition and Results (MD&A) section is comprehensive and detailed. The MD&A does an
excellent job of laying out the industry conditions, Intel's competitive position and Intel's plans
for the future.
Early in the MD&A section, Intel lays out the Critical Accounting Estimates. While this is
also true for TXN and AMD, Intel provides more than GAAP "requires us to make estimates and
judgments". Intel characterizes the main areas where estimates and judgments are involved
and then provides detailed information on each of these areas. Further, Intel makes use of the
25
footnotes to explain the accounting policies and assumptions for the way the data are
presented. Intel also does a good job of explaining the rationale behind various accounting
changes and their impact on the presentation of financial results.
Intel has grown beyond just being a semiconductor chip maker. The company also
provides mobile components such as WiFi products, radio frequency transceivers, Bluetooth
products, power management chips and global navigation satellite system components. In
addition, through various company acquisitions, Intel now offers network and content security
as well as security software products for consumer, mobile, and corporate environments. Each
of these segments has different accounting practices. Intel provides excellent discussion and
breaks down the overall top-‐line, providing insight into the health of each of its business
segments.
Finally, Intel has an extensive Investor Relations site. It contains the latest Intel
corporate events, news releases and financial statements. Further, it contains an archive of
past news and financial releases. It is also the location where Intel posts the latest quarterly
financial releases. Overall, Intel has a high quality of disclosure and does a great job of
explaining their assumptions, accounting policies behind the numbers throughout their
financial statements; and then making this information available.
Red Flags
As just noted, the Intel Financial Statements provide a very high level of disclosure
quality. Based on this, there are few areas where the accounting should be called into
question. Specifically, there were no unexplained increases in contingencies or significant off-‐
26
balance-‐sheet arrangements. Further, the only changes in accounting were to increase the
financial transparency related to revenue streams in different business segments.
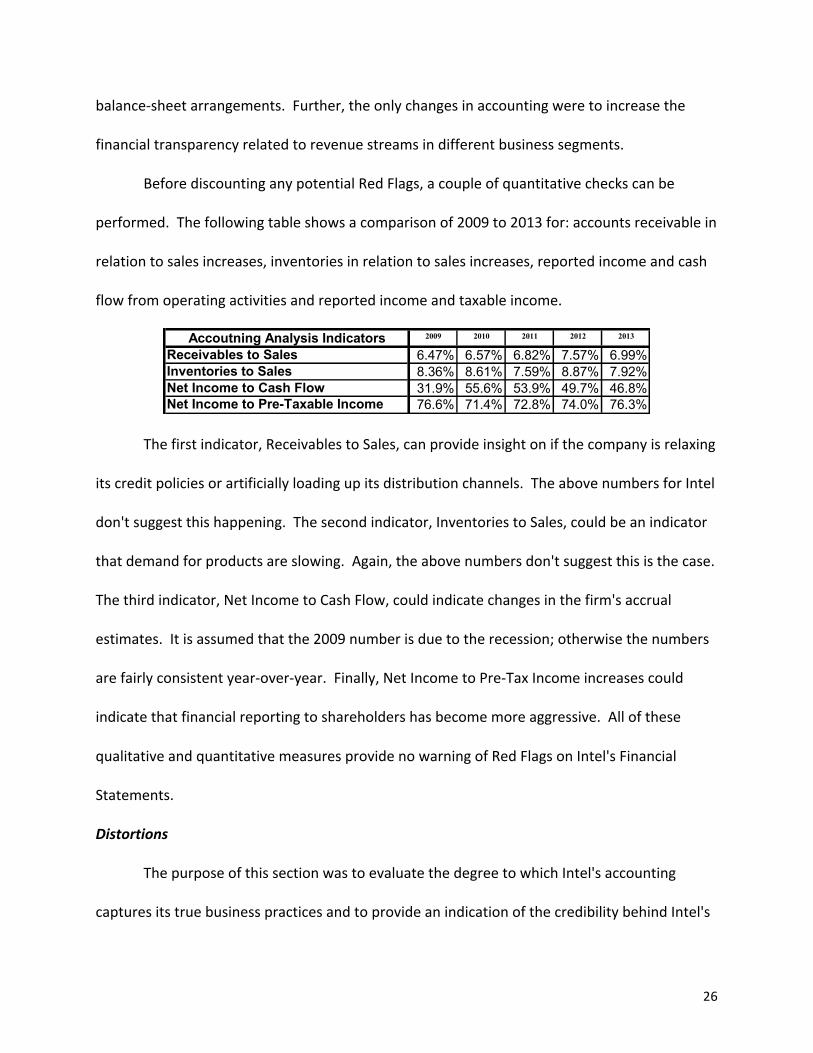
Before discounting any potential Red Flags, a couple of quantitative checks can be
performed. The following table shows a comparison of 2009 to 2013 for: accounts receivable in
relation to sales increases, inventories in relation to sales increases, reported income and cash
flow from operating activities and reported income and taxable income.
Accoutning Analysis Indicators 2009 2010 2011 2012 2013
Receivables to Sales 6.47% 6.57% 6.82% 7.57% 6.99%Inventories to Sales 8.36% 8.61% 7.59% 8.87% 7.92%Net Income to Cash Flow 31.9% 55.6% 53.9% 49.7% 46.8%Net Income to Pre-Taxable Income 76.6% 71.4% 72.8% 74.0% 76.3%
The first indicator, Receivables to Sales, can provide insight on if the company is relaxing
its credit policies or artificially loading up its distribution channels. The above numbers for Intel
don't suggest this happening. The second indicator, Inventories to Sales, could be an indicator
that demand for products are slowing. Again, the above numbers don't suggest this is the case.
The third indicator, Net Income to Cash Flow, could indicate changes in the firm's accrual
estimates. It is assumed that the 2009 number is due to the recession; otherwise the numbers
are fairly consistent year-‐over-‐year. Finally, Net Income to Pre-‐Tax Income increases could
indicate that financial reporting to shareholders has become more aggressive. All of these
qualitative and quantitative measures provide no warning of Red Flags on Intel's Financial
Statements.
Distortions
The purpose of this section was to evaluate the degree to which Intel's accounting
captures its true business practices and to provide an indication of the credibility behind Intel's
27
numbers. After analyzing Intel's Financial Statements, the analysis suggests the data in Intel's
financial reports clearly and accurately reflect the financial health of the firm. There were no
questionable practices that would lead one to believe that Intel’s management was trying to
misrepresent the numbers. All changes in accounting were documented with the rationale and
the impact on the financial statements. While Intel's accounting policies provide ample
accounting flexibility, the accounting analysis suggests Intel is applying these policies
responsibly while documenting their actions and logic in the footnotes. Because of the above
findings, no adjustments to the financial statements are necessary.
Financial Analysis
The financial statements of a company contain information that reveal the company’s
financial position. This information can be combined using various ratios to assess the
company’s financial health. This section is focused on using the financial information in Intel’s
financial statements, as well as Intel's primary competitors (Advanced Micro Devices (AMD) &
Texas Instruments (TXN)), to see where Intel stands with respect to those competitors and the
industry (average of INTC, AMD & TXN). The key areas examined are: Return on Equity
Decomposition, Profitability, Asset Management, Liquidity, Debt & Coverage and Sustainable
Growth. The data examined covers 31 Dec 2004 to 31 Dec 2013.
Return on Equity Decomposition
This section will breakdown Intel's Return on Equity (ROE) into its building blocks to
yield a deeper understanding of Intel's strategic, investment and financing decisions. These
basic building blocks for Intel will also be compared to the build blocks for two of Intel's
competitors (TXN and AMD). The breakdown of ROE is as follows:
28
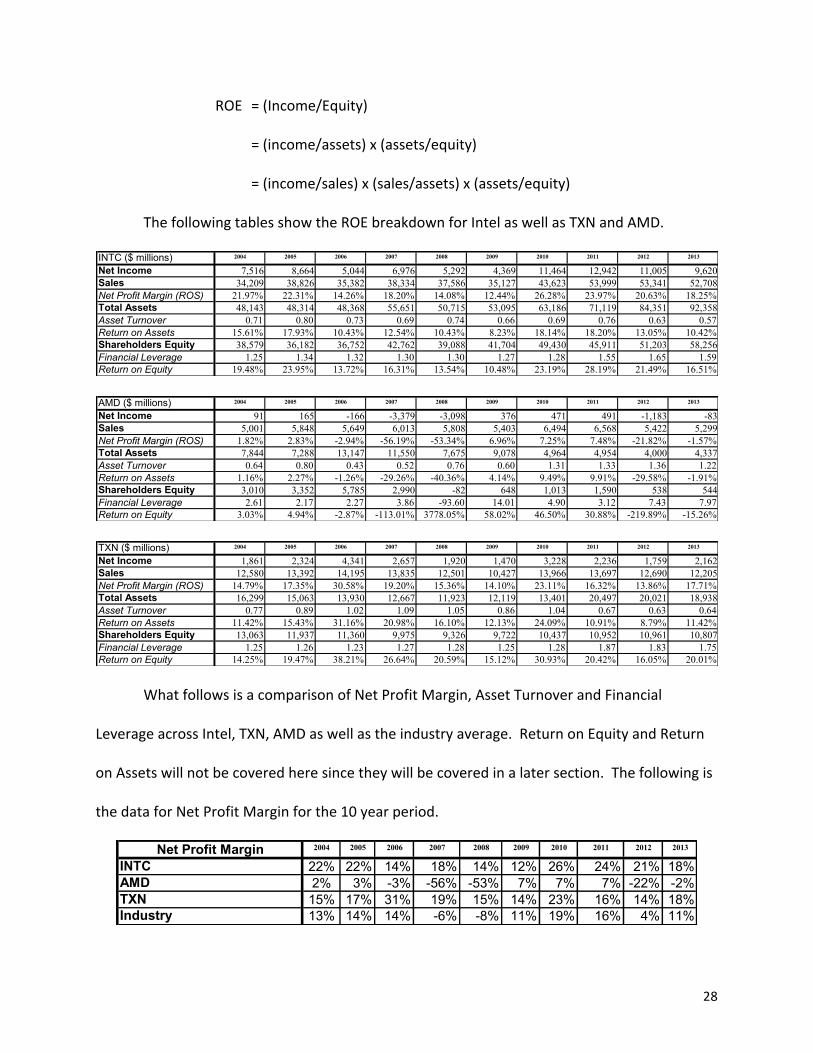
ROE = (Income/Equity)
= (income/assets) x (assets/equity)
= (income/sales) x (sales/assets) x (assets/equity)
The following tables show the ROE breakdown for Intel as well as TXN and AMD.
INTC ($ millions) 2004 2005 2006 2007 2008 2009 2010 2011 2012 2013
Net Income 7,516 8,664 5,044 6,976 5,292 4,369 11,464 12,942 11,005 9,620Sales 34,209 38,826 35,382 38,334 37,586 35,127 43,623 53,999 53,341 52,708Net Profit Margin (ROS) 21.97% 22.31% 14.26% 18.20% 14.08% 12.44% 26.28% 23.97% 20.63% 18.25%Total Assets 48,143 48,314 48,368 55,651 50,715 53,095 63,186 71,119 84,351 92,358Asset Turnover 0.71 0.80 0.73 0.69 0.74 0.66 0.69 0.76 0.63 0.57Return on Assets 15.61% 17.93% 10.43% 12.54% 10.43% 8.23% 18.14% 18.20% 13.05% 10.42%Shareholders Equity 38,579 36,182 36,752 42,762 39,088 41,704 49,430 45,911 51,203 58,256Financial Leverage 1.25 1.34 1.32 1.30 1.30 1.27 1.28 1.55 1.65 1.59Return on Equity 19.48% 23.95% 13.72% 16.31% 13.54% 10.48% 23.19% 28.19% 21.49% 16.51%
AMD ($ millions) 2004 2005 2006 2007 2008 2009 2010 2011 2012 2013
Net Income 91 165 -166 -3,379 -3,098 376 471 491 -1,183 -83Sales 5,001 5,848 5,649 6,013 5,808 5,403 6,494 6,568 5,422 5,299Net Profit Margin (ROS) 1.82% 2.83% -2.94% -56.19% -53.34% 6.96% 7.25% 7.48% -21.82% -1.57%Total Assets 7,844 7,288 13,147 11,550 7,675 9,078 4,964 4,954 4,000 4,337Asset Turnover 0.64 0.80 0.43 0.52 0.76 0.60 1.31 1.33 1.36 1.22Return on Assets 1.16% 2.27% -1.26% -29.26% -40.36% 4.14% 9.49% 9.91% -29.58% -1.91%Shareholders Equity 3,010 3,352 5,785 2,990 -82 648 1,013 1,590 538 544Financial Leverage 2.61 2.17 2.27 3.86 -93.60 14.01 4.90 3.12 7.43 7.97Return on Equity 3.03% 4.94% -2.87% -113.01% 3778.05% 58.02% 46.50% 30.88% -219.89% -15.26%
TXN ($ millions) 2004 2005 2006 2007 2008 2009 2010 2011 2012 2013
Net Income 1,861 2,324 4,341 2,657 1,920 1,470 3,228 2,236 1,759 2,162Sales 12,580 13,392 14,195 13,835 12,501 10,427 13,966 13,697 12,690 12,205Net Profit Margin (ROS) 14.79% 17.35% 30.58% 19.20% 15.36% 14.10% 23.11% 16.32% 13.86% 17.71%Total Assets 16,299 15,063 13,930 12,667 11,923 12,119 13,401 20,497 20,021 18,938Asset Turnover 0.77 0.89 1.02 1.09 1.05 0.86 1.04 0.67 0.63 0.64Return on Assets 11.42% 15.43% 31.16% 20.98% 16.10% 12.13% 24.09% 10.91% 8.79% 11.42%Shareholders Equity 13,063 11,937 11,360 9,975 9,326 9,722 10,437 10,952 10,961 10,807Financial Leverage 1.25 1.26 1.23 1.27 1.28 1.25 1.28 1.87 1.83 1.75Return on Equity 14.25% 19.47% 38.21% 26.64% 20.59% 15.12% 30.93% 20.42% 16.05% 20.01%
What follows is a comparison of Net Profit Margin, Asset Turnover and Financial
Leverage across Intel, TXN, AMD as well as the industry average. Return on Equity and Return
on Assets will not be covered here since they will be covered in a later section. The following is
the data for Net Profit Margin for the 10 year period.
Net Profit Margin 2004 2005 2006 2007 2008 2009 2010 2011 2012 2013
INTC 22% 22% 14% 18% 14% 12% 26% 24% 21% 18%AMD 2% 3% -3% -56% -53% 7% 7% 7% -22% -2%TXN 15% 17% 31% 19% 15% 14% 23% 16% 14% 18%Industry 13% 14% 14% -6% -8% 11% 19% 16% 4% 11%
29
-70%
-60%
-50%
-40%
-30%
-20%
-10%
0%
10%
20%
30%
40%
2004 2005 2006 2007 2008 2009 2010 2011 2012 2013 INTCAMDTXNIndustry
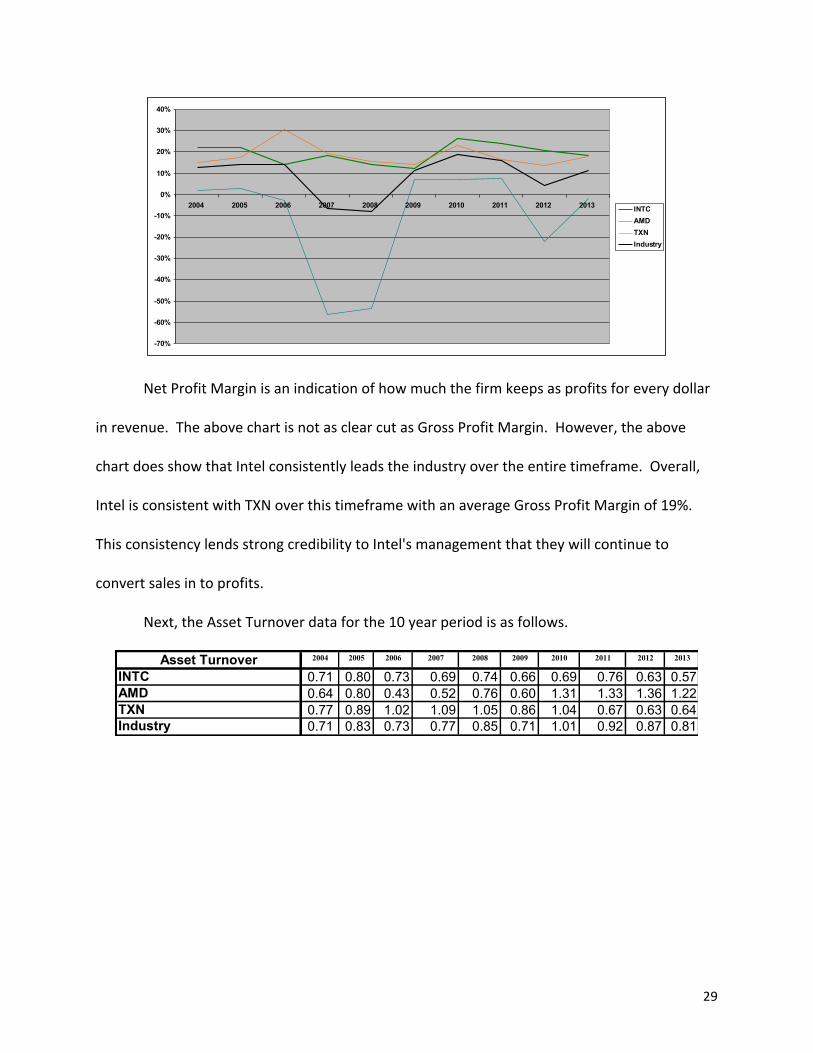
Net Profit Margin is an indication of how much the firm keeps as profits for every dollar
in revenue. The above chart is not as clear cut as Gross Profit Margin. However, the above
chart does show that Intel consistently leads the industry over the entire timeframe. Overall,
Intel is consistent with TXN over this timeframe with an average Gross Profit Margin of 19%.
This consistency lends strong credibility to Intel's management that they will continue to
convert sales in to profits.
Next, the Asset Turnover data for the 10 year period is as follows.
Asset Turnover 2004 2005 2006 2007 2008 2009 2010 2011 2012 2013
INTC 0.71 0.80 0.73 0.69 0.74 0.66 0.69 0.76 0.63 0.57AMD 0.64 0.80 0.43 0.52 0.76 0.60 1.31 1.33 1.36 1.22TXN 0.77 0.89 1.02 1.09 1.05 0.86 1.04 0.67 0.63 0.64Industry 0.71 0.83 0.73 0.77 0.85 0.71 1.01 0.92 0.87 0.81
30
0.00
0.20
0.40
0.60
0.80
1.00
1.20
1.40
1.60
2004 2005 2006 2007 2008 2009 2010 2011 2012 2013
INTCAMDTXNIndustry
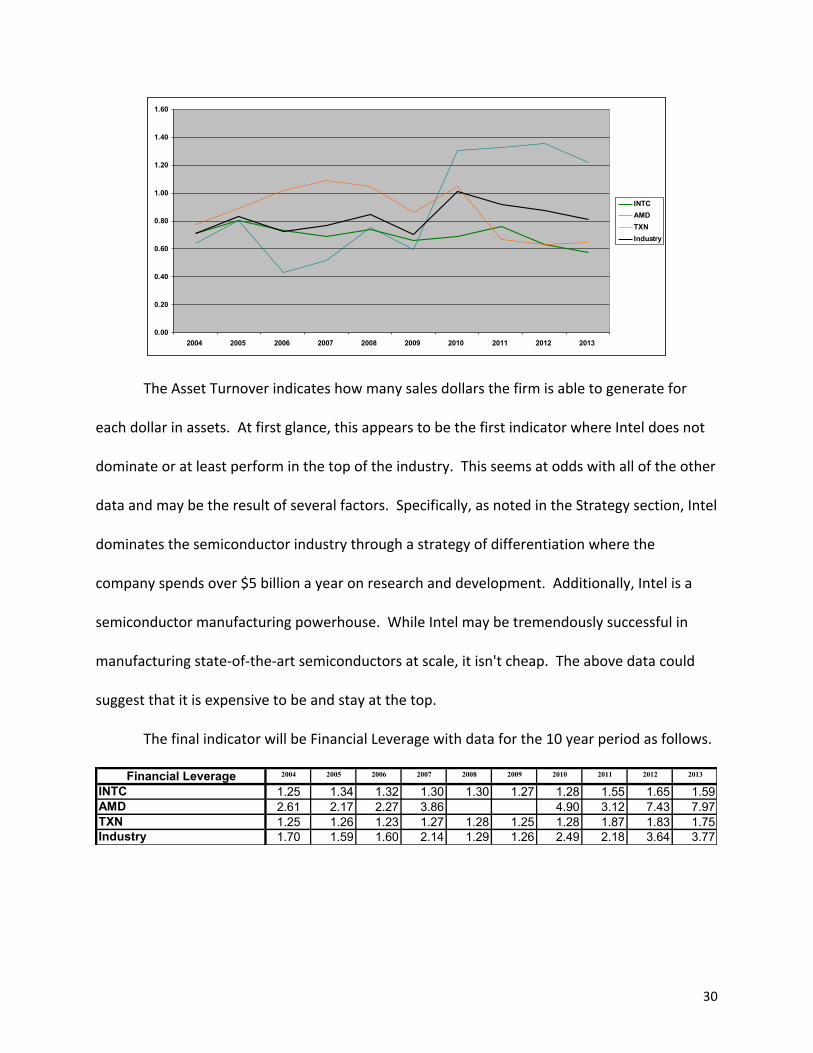
The Asset Turnover indicates how many sales dollars the firm is able to generate for
each dollar in assets. At first glance, this appears to be the first indicator where Intel does not
dominate or at least perform in the top of the industry. This seems at odds with all of the other
data and may be the result of several factors. Specifically, as noted in the Strategy section, Intel
dominates the semiconductor industry through a strategy of differentiation where the
company spends over $5 billion a year on research and development. Additionally, Intel is a
semiconductor manufacturing powerhouse. While Intel may be tremendously successful in
manufacturing state-‐of-‐the-‐art semiconductors at scale, it isn't cheap. The above data could
suggest that it is expensive to be and stay at the top.
The final indicator will be Financial Leverage with data for the 10 year period as follows.
Financial Leverage 2004 2005 2006 2007 2008 2009 2010 2011 2012 2013
INTC 1.25 1.34 1.32 1.30 1.30 1.27 1.28 1.55 1.65 1.59AMD 2.61 2.17 2.27 3.86 4.90 3.12 7.43 7.97TXN 1.25 1.26 1.23 1.27 1.28 1.25 1.28 1.87 1.83 1.75Industry 1.70 1.59 1.60 2.14 1.29 1.26 2.49 2.18 3.64 3.77
31
0.00
1.00
2.00
3.00
4.00
5.00
6.00
7.00
8.00
9.00
2004 2005 2006 2007 2008 2009 2010 2011 2012 2013
INTCAMDTXNIndustry
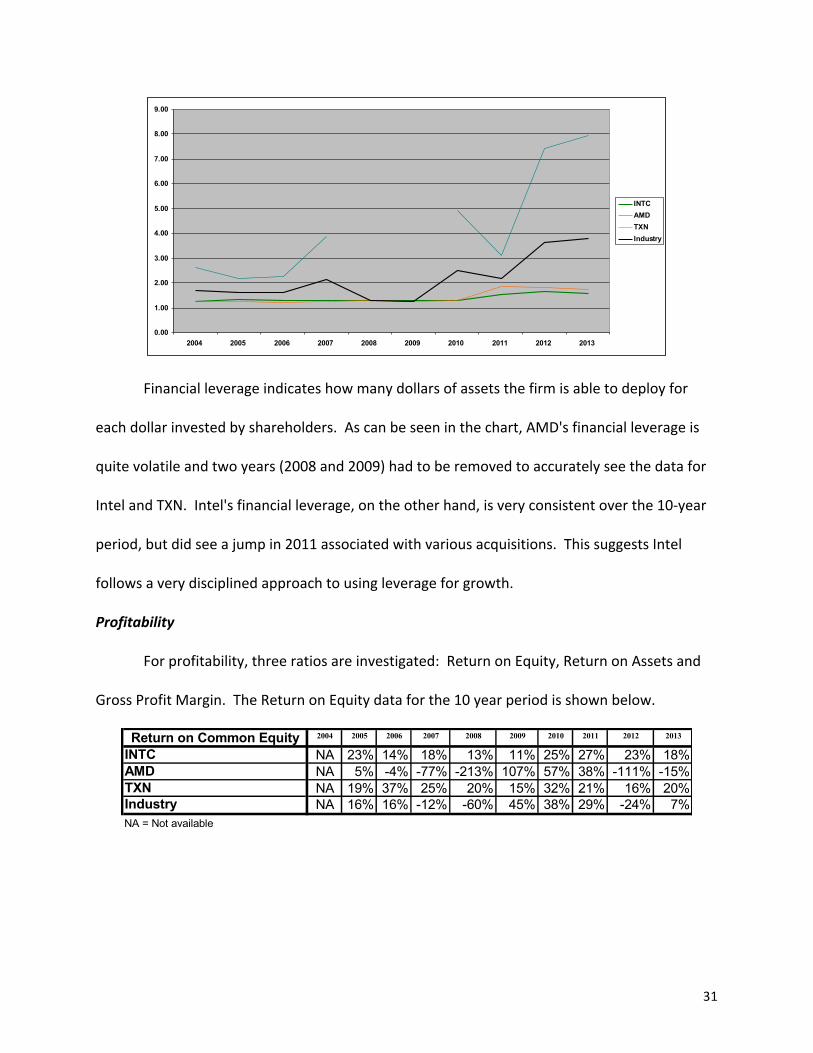
Financial leverage indicates how many dollars of assets the firm is able to deploy for
each dollar invested by shareholders. As can be seen in the chart, AMD's financial leverage is
quite volatile and two years (2008 and 2009) had to be removed to accurately see the data for
Intel and TXN. Intel's financial leverage, on the other hand, is very consistent over the 10-‐year
period, but did see a jump in 2011 associated with various acquisitions. This suggests Intel
follows a very disciplined approach to using leverage for growth.
Profitability
For profitability, three ratios are investigated: Return on Equity, Return on Assets and
Gross Profit Margin. The Return on Equity data for the 10 year period is shown below.
Return on Common Equity 2004 2005 2006 2007 2008 2009 2010 2011 2012 2013
INTC NA 23% 14% 18% 13% 11% 25% 27% 23% 18%AMD NA 5% -4% -77% -213% 107% 57% 38% -111% -15%TXN NA 19% 37% 25% 20% 15% 32% 21% 16% 20%Industry NA 16% 16% -12% -60% 45% 38% 29% -24% 7%NA = Not available
32
-250%
-200%
-150%
-100%
-50%
0%
50%
100%
150%
2005 2006 2007 2008 2009 2010 2011 2012 2013 INTCAMDTXNIndustry
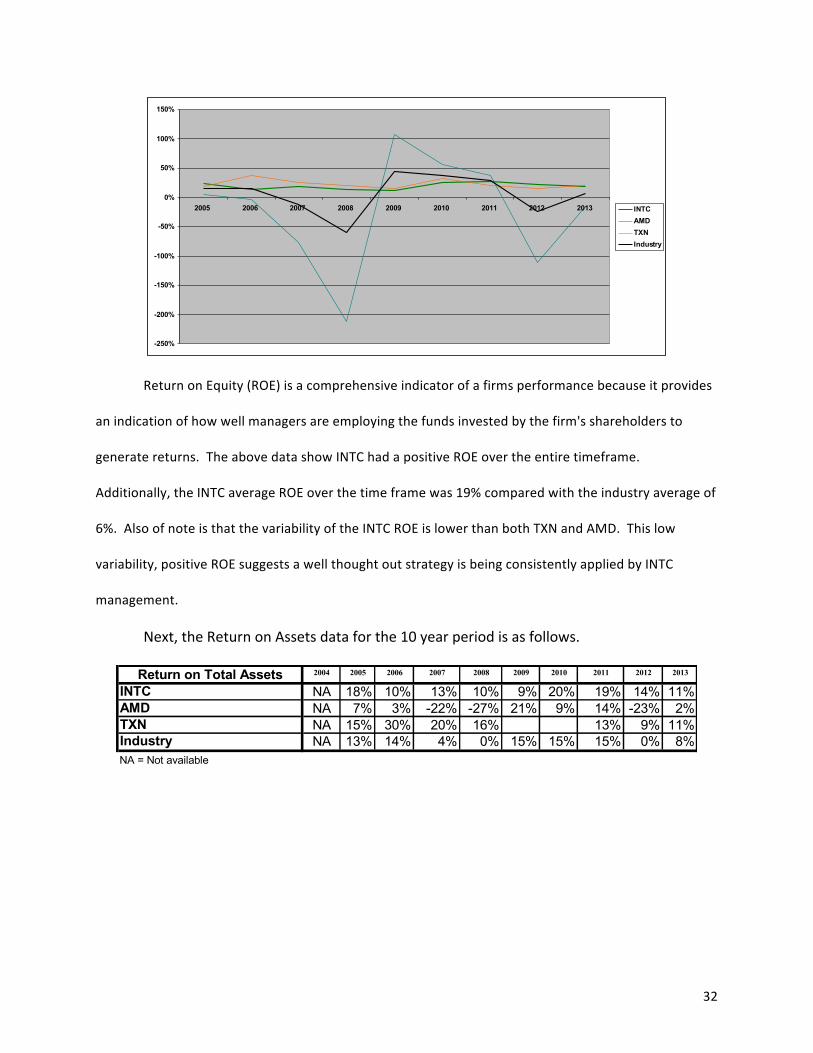
Return on Equity (ROE) is a comprehensive indicator of a firms performance because it provides
an indication of how well managers are employing the funds invested by the firm's shareholders to
generate returns. The above data show INTC had a positive ROE over the entire timeframe.
Additionally, the INTC average ROE over the time frame was 19% compared with the industry average of
6%. Also of note is that the variability of the INTC ROE is lower than both TXN and AMD. This low
variability, positive ROE suggests a well thought out strategy is being consistently applied by INTC
management.
Next, the Return on Assets data for the 10 year period is as follows.
Return on Total Assets 2004 2005 2006 2007 2008 2009 2010 2011 2012 2013
INTC NA 18% 10% 13% 10% 9% 20% 19% 14% 11%AMD NA 7% 3% -22% -27% 21% 9% 14% -23% 2%TXN NA 15% 30% 20% 16% 13% 9% 11%Industry NA 13% 14% 4% 0% 15% 15% 15% 0% 8%NA = Not available
33
-30%
-20%
-10%
0%
10%
20%
30%
40%
2005 2006 2007 2008 2009 2010 2011 2012 2013
INTCAMDTXNIndustry
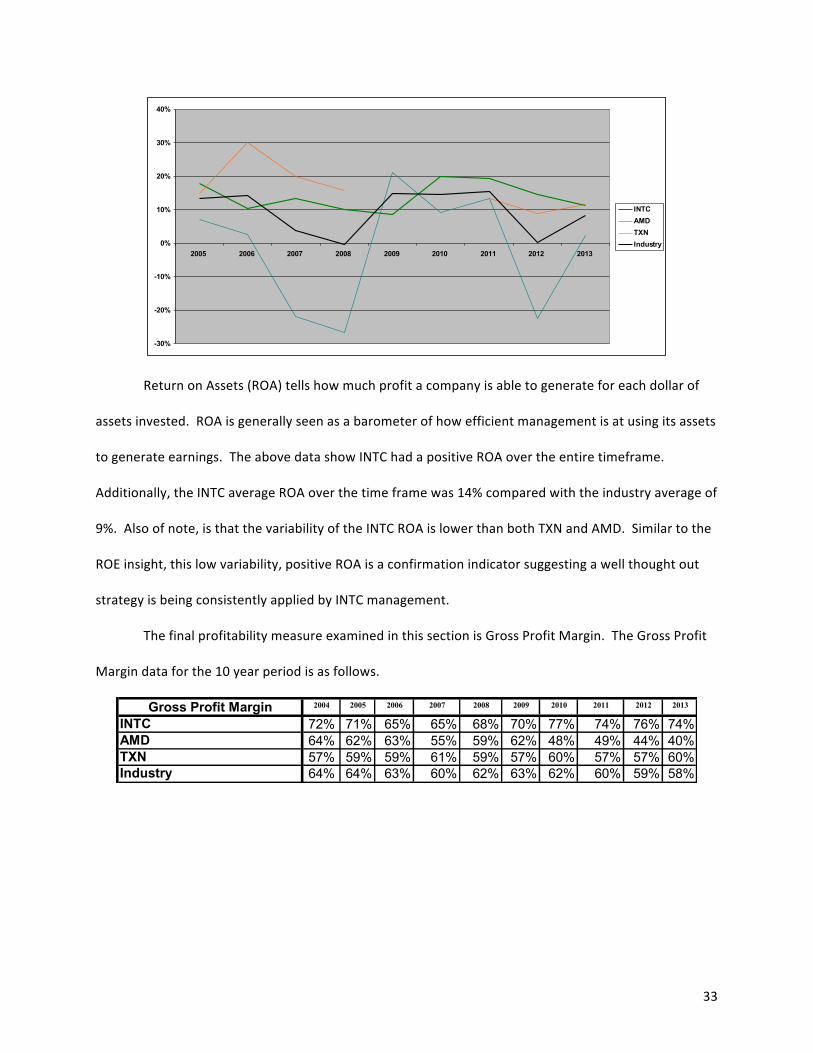
Return on Assets (ROA) tells how much profit a company is able to generate for each dollar of
assets invested. ROA is generally seen as a barometer of how efficient management is at using its assets
to generate earnings. The above data show INTC had a positive ROA over the entire timeframe.
Additionally, the INTC average ROA over the time frame was 14% compared with the industry average of
9%. Also of note, is that the variability of the INTC ROA is lower than both TXN and AMD. Similar to the
ROE insight, this low variability, positive ROA is a confirmation indicator suggesting a well thought out
strategy is being consistently applied by INTC management.
The final profitability measure examined in this section is Gross Profit Margin. The Gross Profit
Margin data for the 10 year period is as follows.
Gross Profit Margin 2004 2005 2006 2007 2008 2009 2010 2011 2012 2013
INTC 72% 71% 65% 65% 68% 70% 77% 74% 76% 74%AMD 64% 62% 63% 55% 59% 62% 48% 49% 44% 40%TXN 57% 59% 59% 61% 59% 57% 60% 57% 57% 60%Industry 64% 64% 63% 60% 62% 63% 62% 60% 59% 58%
34
0%
10%
20%
30%
40%
50%
60%
70%
80%
90%
2004 2005 2006 2007 2008 2009 2010 2011 2012 2013
INTCAMDTXNIndustry
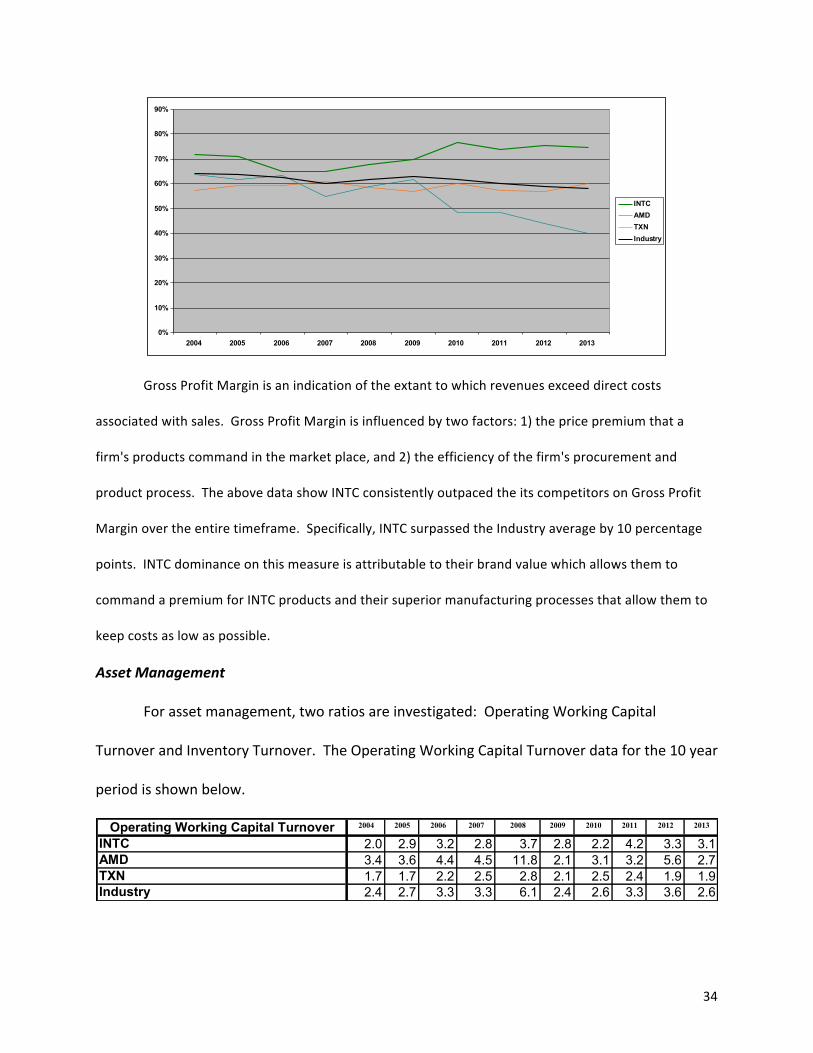
Gross Profit Margin is an indication of the extant to which revenues exceed direct costs
associated with sales. Gross Profit Margin is influenced by two factors: 1) the price premium that a
firm's products command in the market place, and 2) the efficiency of the firm's procurement and
product process. The above data show INTC consistently outpaced the its competitors on Gross Profit
Margin over the entire timeframe. Specifically, INTC surpassed the Industry average by 10 percentage
points. INTC dominance on this measure is attributable to their brand value which allows them to
command a premium for INTC products and their superior manufacturing processes that allow them to
keep costs as low as possible.
Asset Management
For asset management, two ratios are investigated: Operating Working Capital
Turnover and Inventory Turnover. The Operating Working Capital Turnover data for the 10 year
period is shown below.
Operating Working Capital Turnover 2004 2005 2006 2007 2008 2009 2010 2011 2012 2013
INTC 2.0 2.9 3.2 2.8 3.7 2.8 2.2 4.2 3.3 3.1AMD 3.4 3.6 4.4 4.5 11.8 2.1 3.1 3.2 5.6 2.7TXN 1.7 1.7 2.2 2.5 2.8 2.1 2.5 2.4 1.9 1.9Industry 2.4 2.7 3.3 3.3 6.1 2.4 2.6 3.3 3.6 2.6
35
0.0
2.0
4.0
6.0
8.0
10.0
12.0
14.0
2004 2005 2006 2007 2008 2009 2010 2011 2012 2013
INTCAMDTXNIndustry
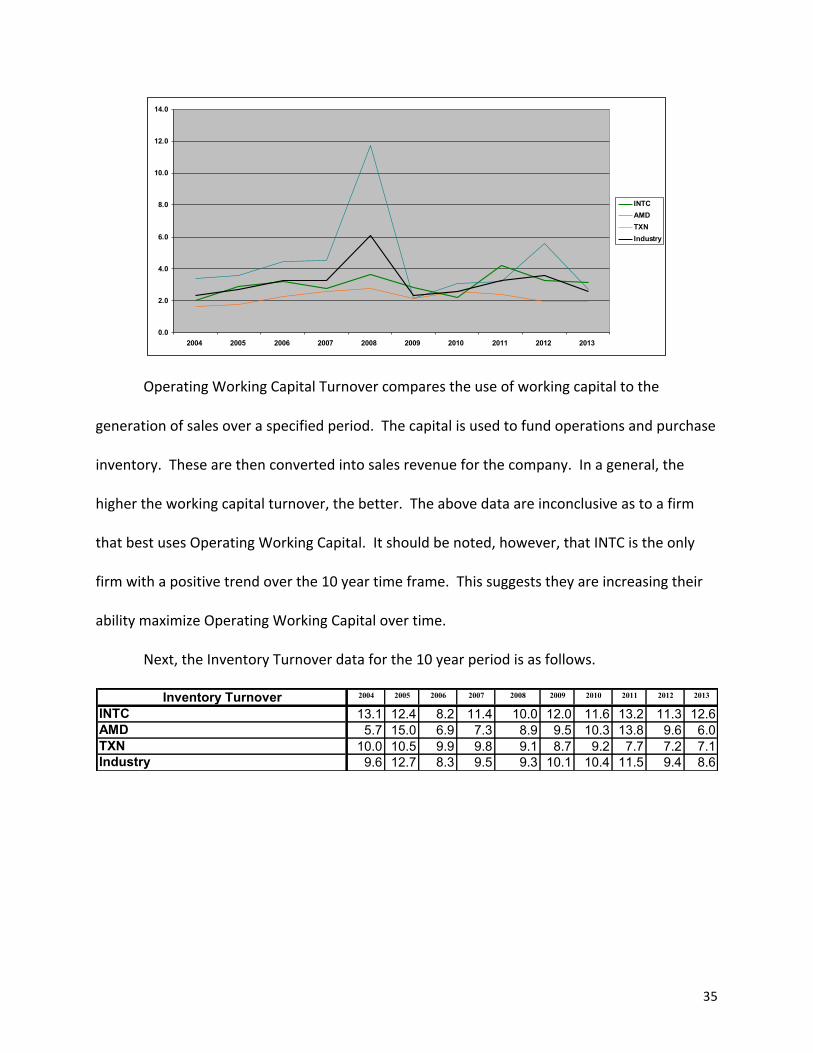
Operating Working Capital Turnover compares the use of working capital to the
generation of sales over a specified period. The capital is used to fund operations and purchase
inventory. These are then converted into sales revenue for the company. In a general, the
higher the working capital turnover, the better. The above data are inconclusive as to a firm
that best uses Operating Working Capital. It should be noted, however, that INTC is the only
firm with a positive trend over the 10 year time frame. This suggests they are increasing their
ability maximize Operating Working Capital over time.
Next, the Inventory Turnover data for the 10 year period is as follows.
Inventory Turnover 2004 2005 2006 2007 2008 2009 2010 2011 2012 2013
INTC 13.1 12.4 8.2 11.4 10.0 12.0 11.6 13.2 11.3 12.6AMD 5.7 15.0 6.9 7.3 8.9 9.5 10.3 13.8 9.6 6.0TXN 10.0 10.5 9.9 9.8 9.1 8.7 9.2 7.7 7.2 7.1Industry 9.6 12.7 8.3 9.5 9.3 10.1 10.4 11.5 9.4 8.6
36
0.0
2.0
4.0
6.0
8.0
10.0
12.0
14.0
16.0
2005 2006 2007 2008 2009 2010 2011 2012 2013
INTCAMDTXNIndustry
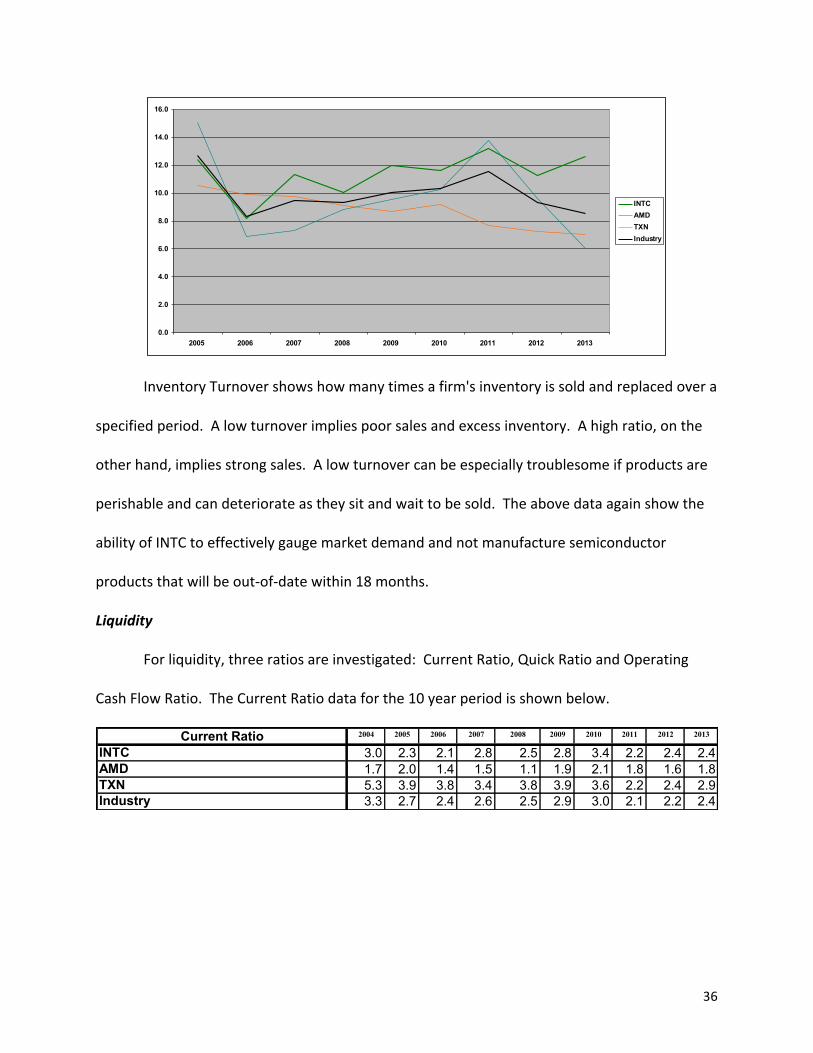
Inventory Turnover shows how many times a firm's inventory is sold and replaced over a
specified period. A low turnover implies poor sales and excess inventory. A high ratio, on the
other hand, implies strong sales. A low turnover can be especially troublesome if products are
perishable and can deteriorate as they sit and wait to be sold. The above data again show the
ability of INTC to effectively gauge market demand and not manufacture semiconductor
products that will be out-‐of-‐date within 18 months.
Liquidity
For liquidity, three ratios are investigated: Current Ratio, Quick Ratio and Operating
Cash Flow Ratio. The Current Ratio data for the 10 year period is shown below.
Current Ratio 2004 2005 2006 2007 2008 2009 2010 2011 2012 2013
INTC 3.0 2.3 2.1 2.8 2.5 2.8 3.4 2.2 2.4 2.4AMD 1.7 2.0 1.4 1.5 1.1 1.9 2.1 1.8 1.6 1.8TXN 5.3 3.9 3.8 3.4 3.8 3.9 3.6 2.2 2.4 2.9Industry 3.3 2.7 2.4 2.6 2.5 2.9 3.0 2.1 2.2 2.4
37
0.0
0.5
1.0
1.5
2.0
2.5
3.0
3.5
4.0
4.5
2005 2006 2007 2008 2009 2010 2011 2012 2013
INTCAMDTXNIndustry
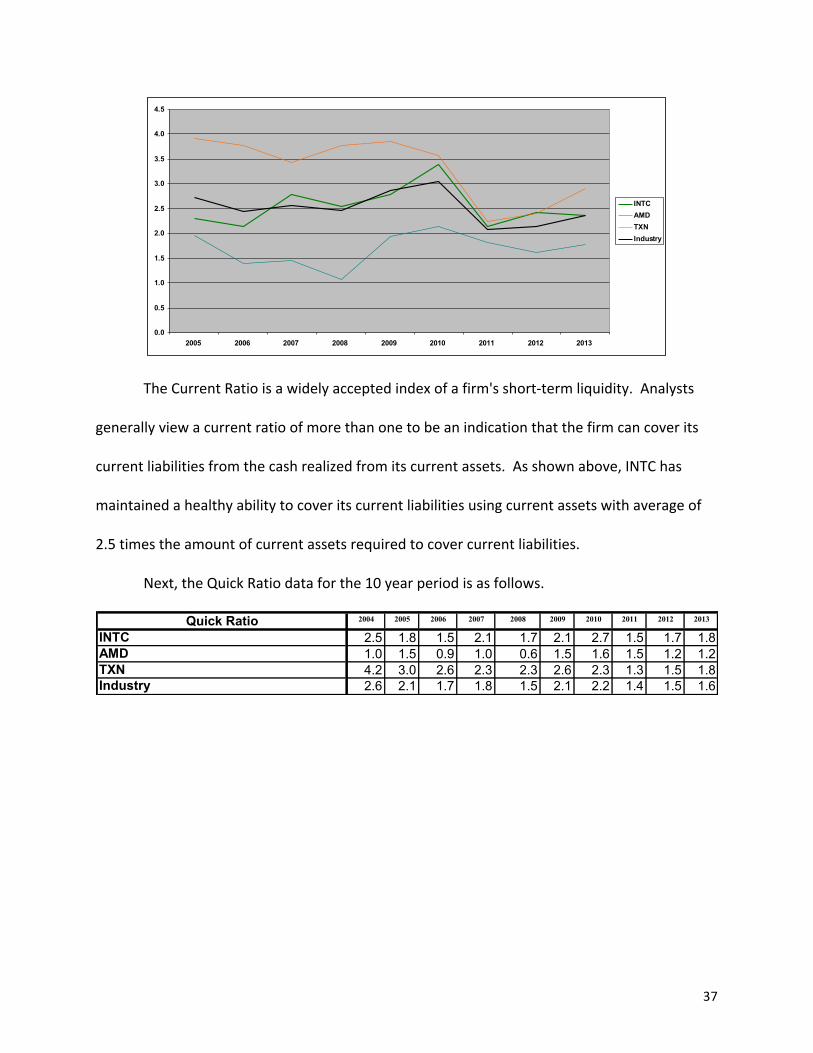
The Current Ratio is a widely accepted index of a firm's short-‐term liquidity. Analysts
generally view a current ratio of more than one to be an indication that the firm can cover its
current liabilities from the cash realized from its current assets. As shown above, INTC has
maintained a healthy ability to cover its current liabilities using current assets with average of
2.5 times the amount of current assets required to cover current liabilities.
Next, the Quick Ratio data for the 10 year period is as follows.
Quick Ratio 2004 2005 2006 2007 2008 2009 2010 2011 2012 2013
INTC 2.5 1.8 1.5 2.1 1.7 2.1 2.7 1.5 1.7 1.8AMD 1.0 1.5 0.9 1.0 0.6 1.5 1.6 1.5 1.2 1.2TXN 4.2 3.0 2.6 2.3 2.3 2.6 2.3 1.3 1.5 1.8Industry 2.6 2.1 1.7 1.8 1.5 2.1 2.2 1.4 1.5 1.6
38
0.0
0.5
1.0
1.5
2.0
2.5
3.0
3.5
2005 2006 2007 2008 2009 2010 2011 2012 2013
INTCAMDTXNIndustry
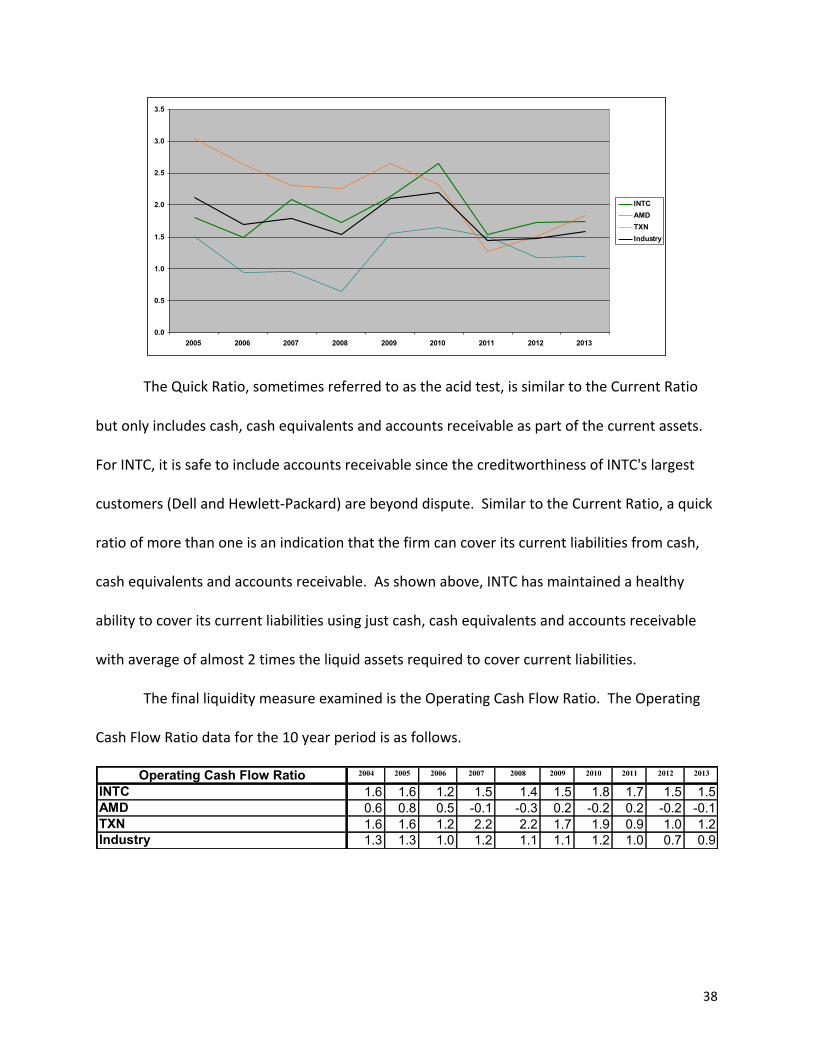
The Quick Ratio, sometimes referred to as the acid test, is similar to the Current Ratio
but only includes cash, cash equivalents and accounts receivable as part of the current assets.
For INTC, it is safe to include accounts receivable since the creditworthiness of INTC's largest
customers (Dell and Hewlett-‐Packard) are beyond dispute. Similar to the Current Ratio, a quick
ratio of more than one is an indication that the firm can cover its current liabilities from cash,
cash equivalents and accounts receivable. As shown above, INTC has maintained a healthy
ability to cover its current liabilities using just cash, cash equivalents and accounts receivable
with average of almost 2 times the liquid assets required to cover current liabilities.
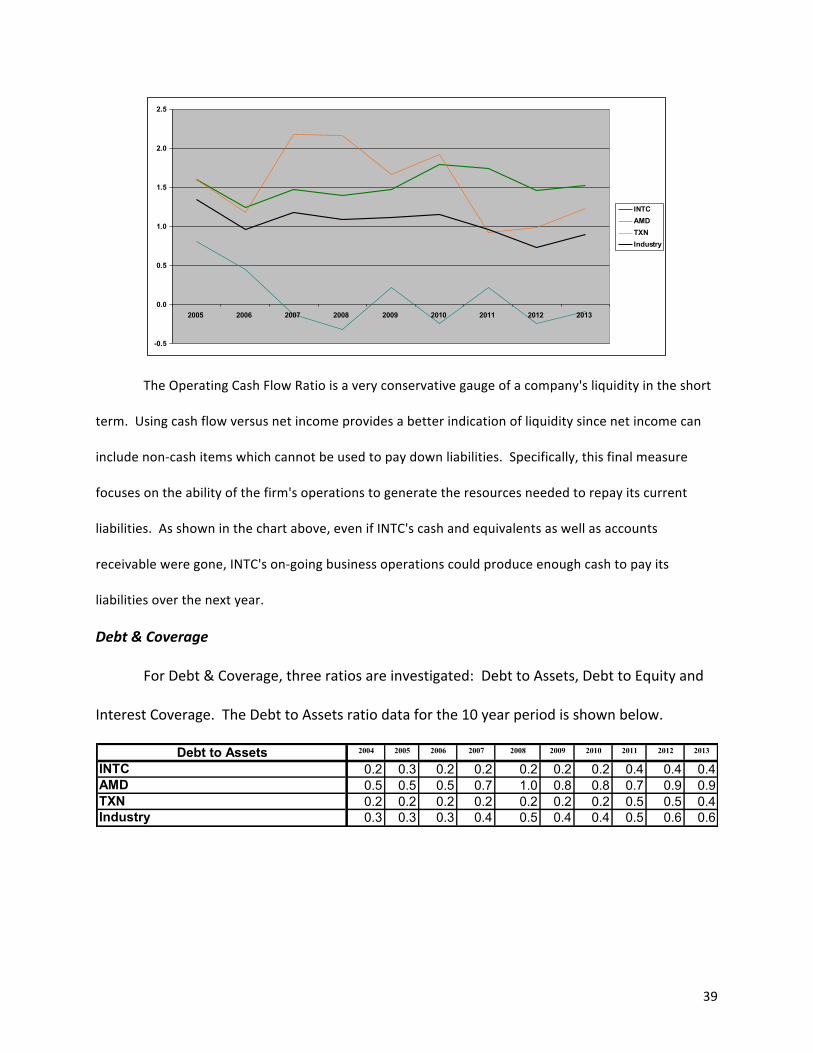
The final liquidity measure examined is the Operating Cash Flow Ratio. The Operating
Cash Flow Ratio data for the 10 year period is as follows.
Operating Cash Flow Ratio 2004 2005 2006 2007 2008 2009 2010 2011 2012 2013
INTC 1.6 1.6 1.2 1.5 1.4 1.5 1.8 1.7 1.5 1.5AMD 0.6 0.8 0.5 -0.1 -0.3 0.2 -0.2 0.2 -0.2 -0.1TXN 1.6 1.6 1.2 2.2 2.2 1.7 1.9 0.9 1.0 1.2Industry 1.3 1.3 1.0 1.2 1.1 1.1 1.2 1.0 0.7 0.9
39
-0.5
0.0
0.5
1.0
1.5
2.0
2.5
2005 2006 2007 2008 2009 2010 2011 2012 2013
INTCAMDTXNIndustry
The Operating Cash Flow Ratio is a very conservative gauge of a company's liquidity in the short
term. Using cash flow versus net income provides a better indication of liquidity since net income can
include non-‐cash items which cannot be used to pay down liabilities. Specifically, this final measure
focuses on the ability of the firm's operations to generate the resources needed to repay its current
liabilities. As shown in the chart above, even if INTC's cash and equivalents as well as accounts
receivable were gone, INTC's on-‐going business operations could produce enough cash to pay its
liabilities over the next year.
Debt & Coverage
For Debt & Coverage, three ratios are investigated: Debt to Assets, Debt to Equity and
Interest Coverage. The Debt to Assets ratio data for the 10 year period is shown below.
Debt to Assets 2004 2005 2006 2007 2008 2009 2010 2011 2012 2013
INTC 0.2 0.3 0.2 0.2 0.2 0.2 0.2 0.4 0.4 0.4AMD 0.5 0.5 0.5 0.7 1.0 0.8 0.8 0.7 0.9 0.9TXN 0.2 0.2 0.2 0.2 0.2 0.2 0.2 0.5 0.5 0.4Industry 0.3 0.3 0.3 0.4 0.5 0.4 0.4 0.5 0.6 0.6
40
0.0
0.2
0.4
0.6
0.8
1.0
1.2
2005 2006 2007 2008 2009 2010 2011 2012 2013
INTCAMDTXNIndustry
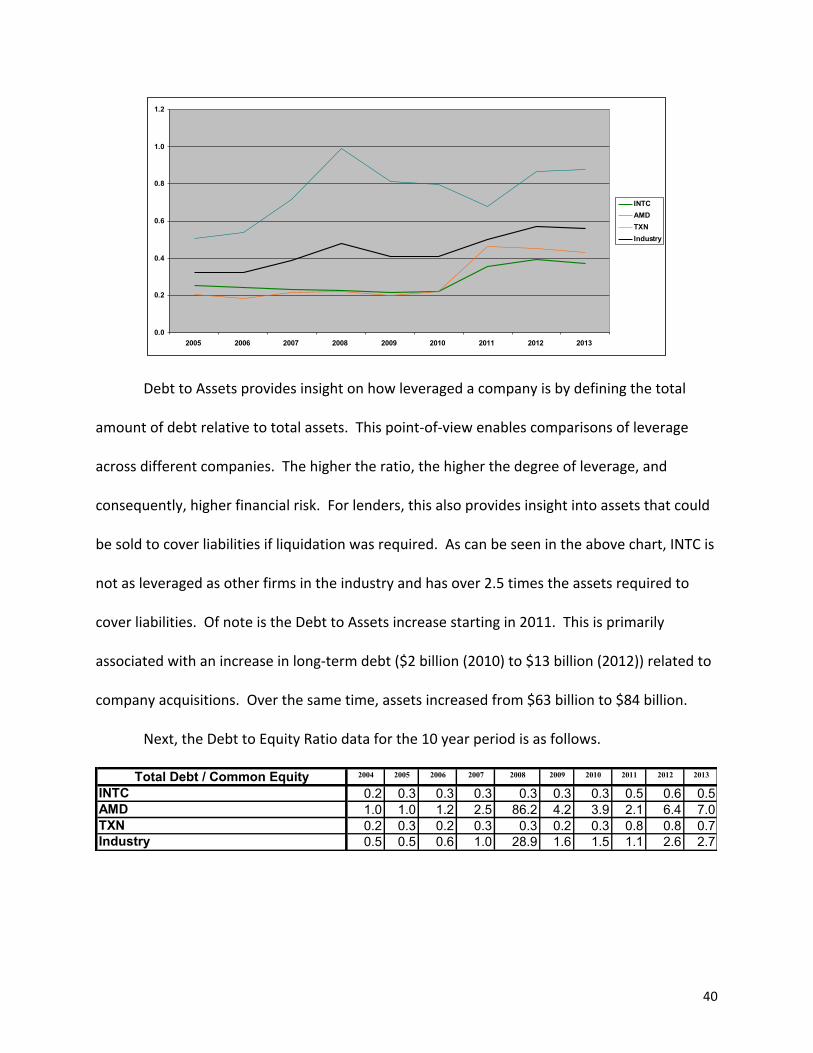
Debt to Assets provides insight on how leveraged a company is by defining the total
amount of debt relative to total assets. This point-‐of-‐view enables comparisons of leverage
across different companies. The higher the ratio, the higher the degree of leverage, and
consequently, higher financial risk. For lenders, this also provides insight into assets that could
be sold to cover liabilities if liquidation was required. As can be seen in the above chart, INTC is
not as leveraged as other firms in the industry and has over 2.5 times the assets required to
cover liabilities. Of note is the Debt to Assets increase starting in 2011. This is primarily
associated with an increase in long-‐term debt ($2 billion (2010) to $13 billion (2012)) related to
company acquisitions. Over the same time, assets increased from $63 billion to $84 billion.
Next, the Debt to Equity Ratio data for the 10 year period is as follows.
Total Debt / Common Equity 2004 2005 2006 2007 2008 2009 2010 2011 2012 2013
INTC 0.2 0.3 0.3 0.3 0.3 0.3 0.3 0.5 0.6 0.5AMD 1.0 1.0 1.2 2.5 86.2 4.2 3.9 2.1 6.4 7.0TXN 0.2 0.3 0.2 0.3 0.3 0.2 0.3 0.8 0.8 0.7Industry 0.5 0.5 0.6 1.0 28.9 1.6 1.5 1.1 2.6 2.7
41
0.0
1.0
2.0
3.0
4.0
5.0
6.0
7.0
8.0
2005 2006 2007 2008 2009 2010 2011 2012 2013
INTCAMDTXNIndustry
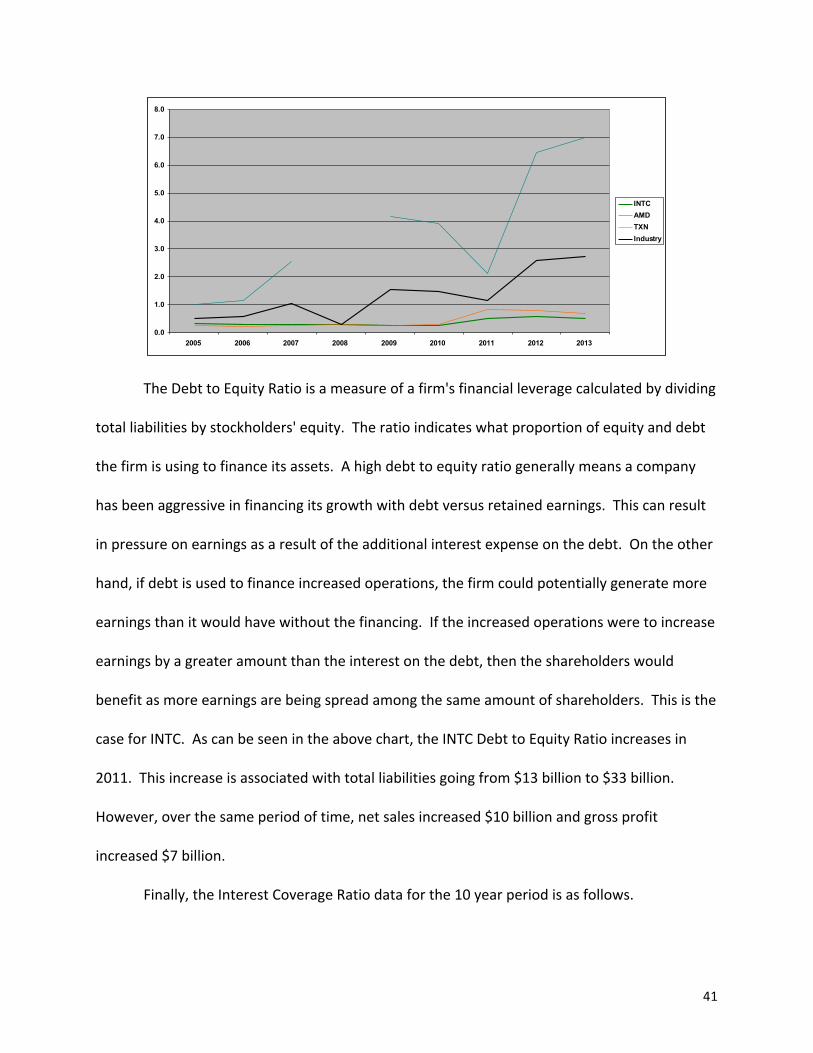
The Debt to Equity Ratio is a measure of a firm's financial leverage calculated by dividing
total liabilities by stockholders' equity. The ratio indicates what proportion of equity and debt
the firm is using to finance its assets. A high debt to equity ratio generally means a company
has been aggressive in financing its growth with debt versus retained earnings. This can result
in pressure on earnings as a result of the additional interest expense on the debt. On the other
hand, if debt is used to finance increased operations, the firm could potentially generate more
earnings than it would have without the financing. If the increased operations were to increase
earnings by a greater amount than the interest on the debt, then the shareholders would
benefit as more earnings are being spread among the same amount of shareholders. This is the
case for INTC. As can be seen in the above chart, the INTC Debt to Equity Ratio increases in
2011. This increase is associated with total liabilities going from $13 billion to $33 billion.
However, over the same period of time, net sales increased $10 billion and gross profit
increased $7 billion.
Finally, the Interest Coverage Ratio data for the 10 year period is as follows.
42
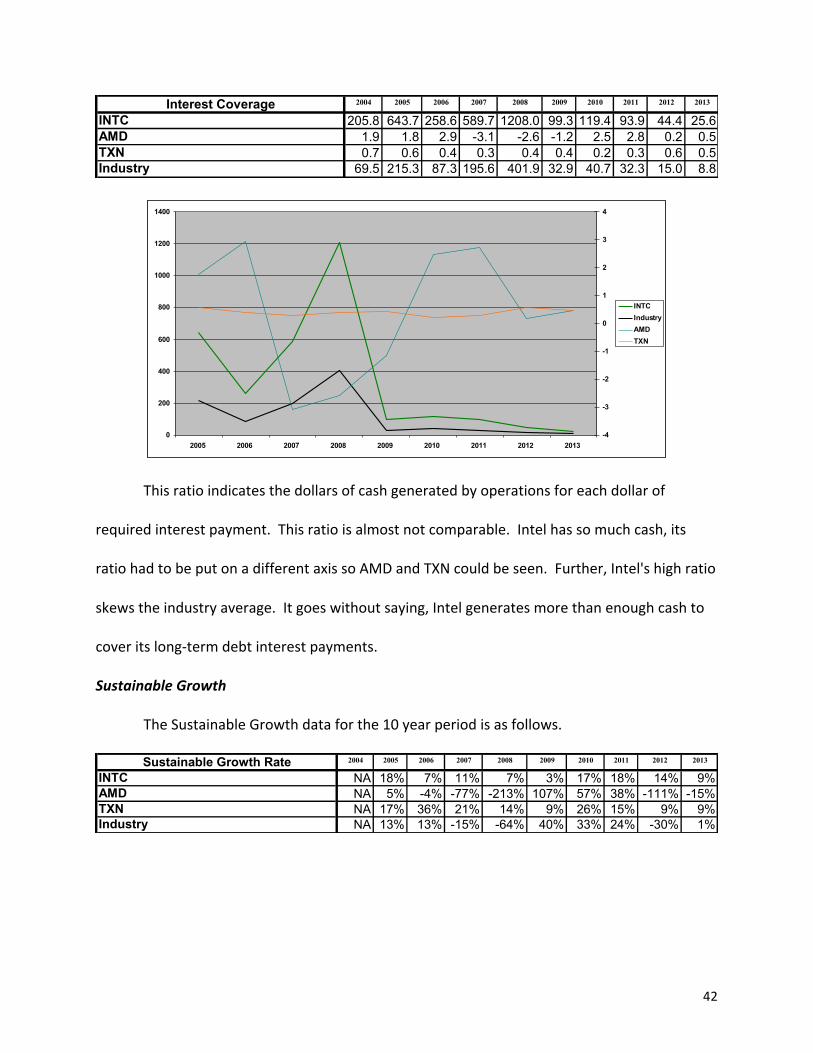
Interest Coverage 2004 2005 2006 2007 2008 2009 2010 2011 2012 2013
INTC 205.8 643.7 258.6 589.7 1208.0 99.3 119.4 93.9 44.4 25.6AMD 1.9 1.8 2.9 -3.1 -2.6 -1.2 2.5 2.8 0.2 0.5TXN 0.7 0.6 0.4 0.3 0.4 0.4 0.2 0.3 0.6 0.5Industry 69.5 215.3 87.3 195.6 401.9 32.9 40.7 32.3 15.0 8.8
0
200
400
600
800
1000
1200
1400
2005 2006 2007 2008 2009 2010 2011 2012 2013 -4
-3
-2
-1
0
1
2
3
4
INTCIndustryAMDTXN
This ratio indicates the dollars of cash generated by operations for each dollar of
required interest payment. This ratio is almost not comparable. Intel has so much cash, its
ratio had to be put on a different axis so AMD and TXN could be seen. Further, Intel's high ratio
skews the industry average. It goes without saying, Intel generates more than enough cash to
cover its long-‐term debt interest payments.
Sustainable Growth
The Sustainable Growth data for the 10 year period is as follows.
Sustainable Growth Rate 2004 2005 2006 2007 2008 2009 2010 2011 2012 2013
INTC NA 18% 7% 11% 7% 3% 17% 18% 14% 9%AMD NA 5% -4% -77% -213% 107% 57% 38% -111% -15%TXN NA 17% 36% 21% 14% 9% 26% 15% 9% 9%Industry NA 13% 13% -15% -64% 40% 33% 24% -30% 1%
43
-250%
-200%
-150%
-100%
-50%
0%
50%
100%
150%
2005 2006 2007 2008 2009 2010 2011 2012 2013 INTCAMDTXNIndustry
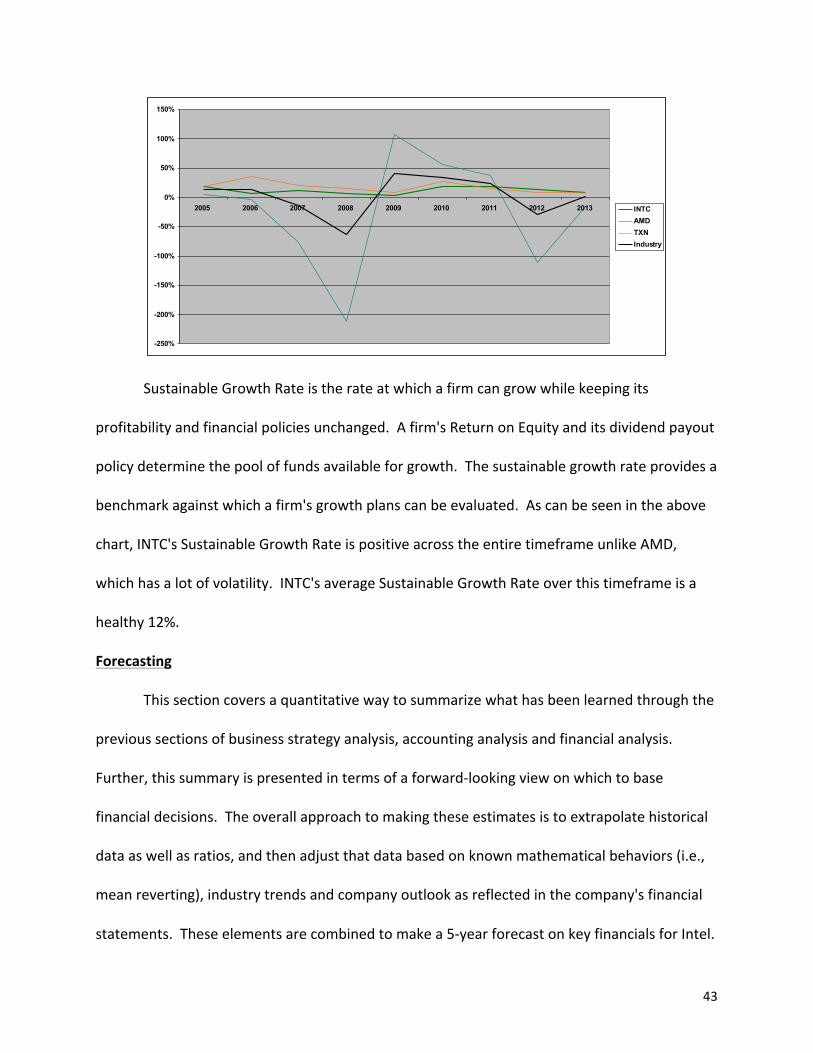
Sustainable Growth Rate is the rate at which a firm can grow while keeping its
profitability and financial policies unchanged. A firm's Return on Equity and its dividend payout
policy determine the pool of funds available for growth. The sustainable growth rate provides a
benchmark against which a firm's growth plans can be evaluated. As can be seen in the above
chart, INTC's Sustainable Growth Rate is positive across the entire timeframe unlike AMD,
which has a lot of volatility. INTC's average Sustainable Growth Rate over this timeframe is a
healthy 12%.
Forecasting
This section covers a quantitative way to summarize what has been learned through the
previous sections of business strategy analysis, accounting analysis and financial analysis.
Further, this summary is presented in terms of a forward-‐looking view on which to base
financial decisions. The overall approach to making these estimates is to extrapolate historical
data as well as ratios, and then adjust that data based on known mathematical behaviors (i.e.,
mean reverting), industry trends and company outlook as reflected in the company's financial
statements. These elements are combined to make a 5-‐year forecast on key financials for Intel.
44
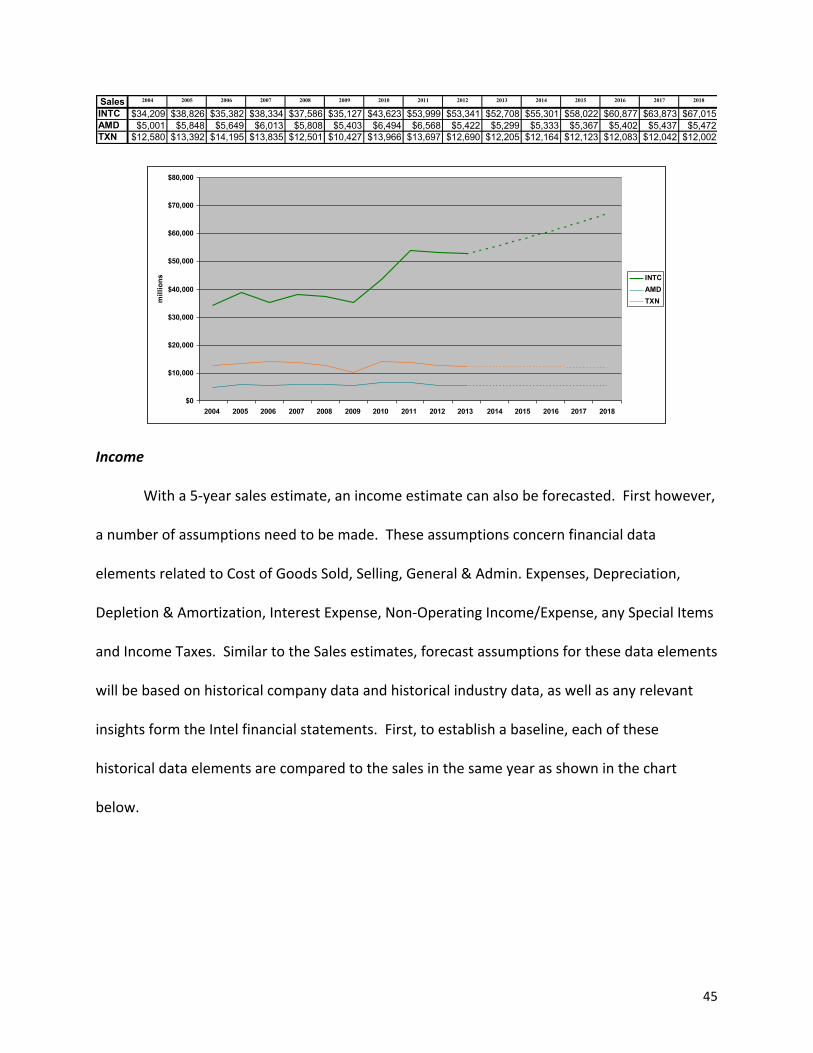
Sales
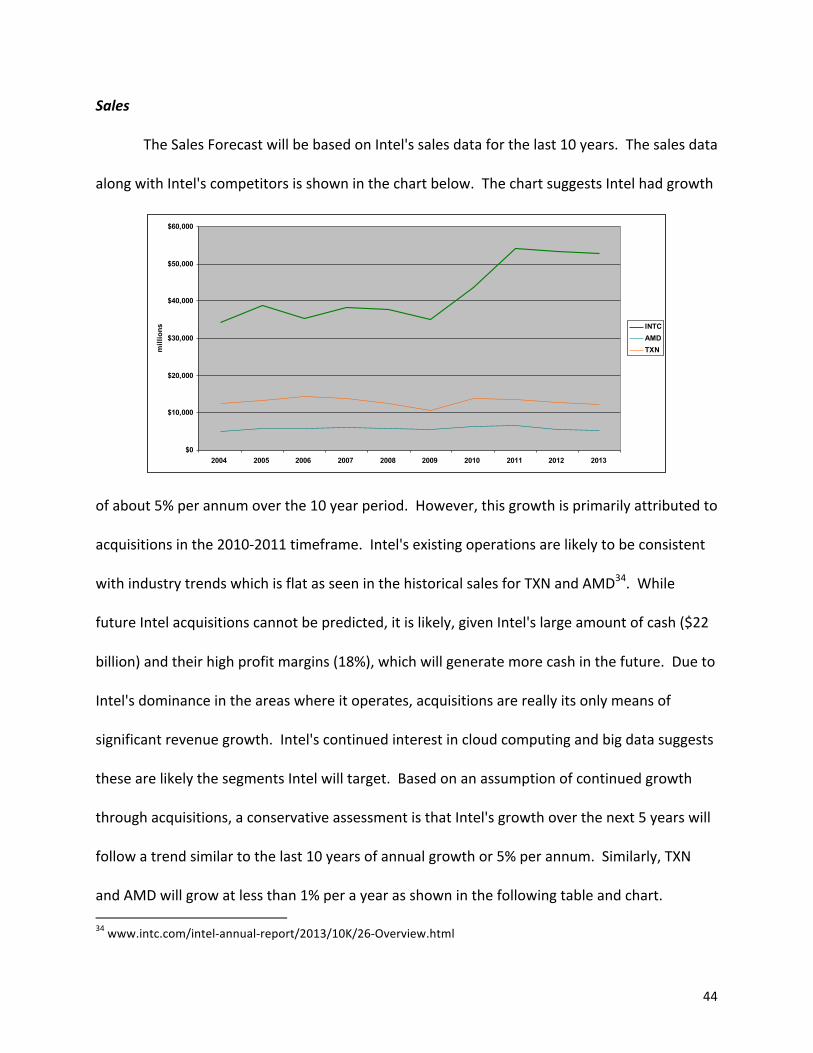
The Sales Forecast will be based on Intel's sales data for the last 10 years. The sales data
along with Intel's competitors is shown in the chart below. The chart suggests Intel had growth
$0
$10,000
$20,000
$30,000
$40,000
$50,000
$60,000
2004 2005 2006 2007 2008 2009 2010 2011 2012 2013
mill
ions INTC
AMDTXN
of about 5% per annum over the 10 year period. However, this growth is primarily attributed to
acquisitions in the 2010-‐2011 timeframe. Intel's existing operations are likely to be consistent
with industry trends which is flat as seen in the historical sales for TXN and AMD34. While
future Intel acquisitions cannot be predicted, it is likely, given Intel's large amount of cash ($22
billion) and their high profit margins (18%), which will generate more cash in the future. Due to
Intel's dominance in the areas where it operates, acquisitions are really its only means of
significant revenue growth. Intel's continued interest in cloud computing and big data suggests
these are likely the segments Intel will target. Based on an assumption of continued growth
through acquisitions, a conservative assessment is that Intel's growth over the next 5 years will
follow a trend similar to the last 10 years of annual growth or 5% per annum. Similarly, TXN
and AMD will grow at less than 1% per a year as shown in the following table and chart. 34 www.intc.com/intel-‐annual-‐report/2013/10K/26-‐Overview.html
45
Sales 2004 2005 2006 2007 2008 2009 2010 2011 2012 2013 2014 2015 2016 2017 2018
INTC $34,209 $38,826 $35,382 $38,334 $37,586 $35,127 $43,623 $53,999 $53,341 $52,708 $55,301 $58,022 $60,877 $63,873 $67,015AMD $5,001 $5,848 $5,649 $6,013 $5,808 $5,403 $6,494 $6,568 $5,422 $5,299 $5,333 $5,367 $5,402 $5,437 $5,472TXN $12,580 $13,392 $14,195 $13,835 $12,501 $10,427 $13,966 $13,697 $12,690 $12,205 $12,164 $12,123 $12,083 $12,042 $12,002
$0
$10,000
$20,000
$30,000
$40,000
$50,000
$60,000
$70,000
$80,000
2004 2005 2006 2007 2008 2009 2010 2011 2012 2013 2014 2015 2016 2017 2018
mill
ions INTC
AMDTXN
Income
With a 5-‐year sales estimate, an income estimate can also be forecasted. First however,
a number of assumptions need to be made. These assumptions concern financial data
elements related to Cost of Goods Sold, Selling, General & Admin. Expenses, Depreciation,
Depletion & Amortization, Interest Expense, Non-‐Operating Income/Expense, any Special Items
and Income Taxes. Similar to the Sales estimates, forecast assumptions for these data elements
will be based on historical company data and historical industry data, as well as any relevant
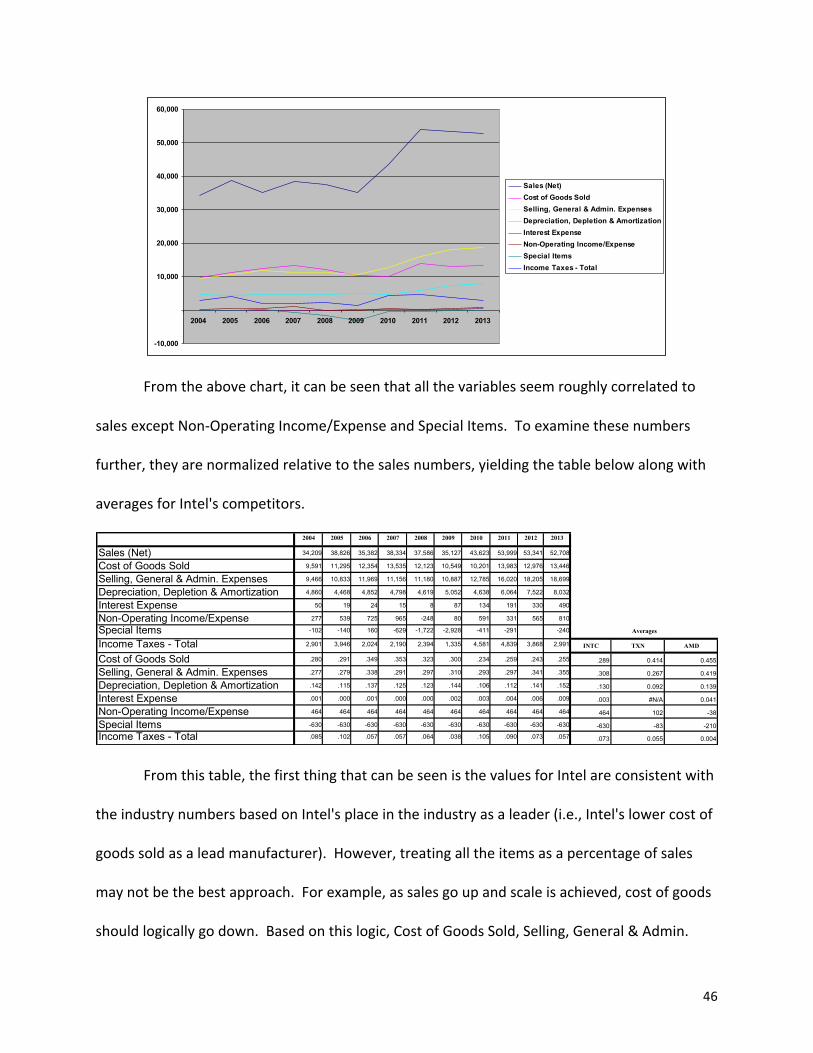
insights form the Intel financial statements. First, to establish a baseline, each of these
historical data elements are compared to the sales in the same year as shown in the chart
below.
46
-10,000
10,000
20,000
30,000
40,000
50,000
60,000
2004 2005 2006 2007 2008 2009 2010 2011 2012 2013
Sales (Net)Cost of Goods SoldSelling, General & Admin. ExpensesDepreciation, Depletion & AmortizationInterest ExpenseNon-Operating Income/ExpenseSpecial ItemsIncome Taxes - Total
From the above chart, it can be seen that all the variables seem roughly correlated to
sales except Non-‐Operating Income/Expense and Special Items. To examine these numbers
further, they are normalized relative to the sales numbers, yielding the table below along with
averages for Intel's competitors.
2004 2005 2006 2007 2008 2009 2010 2011 2012 2013
Sales (Net) 34,209 38,826 35,382 38,334 37,586 35,127 43,623 53,999 53,341 52,708
Cost of Goods Sold 9,591 11,295 12,354 13,535 12,123 10,549 10,201 13,983 12,976 13,446
Selling, General & Admin. Expenses 9,466 10,833 11,969 11,156 11,180 10,887 12,785 16,020 18,205 18,699
Depreciation, Depletion & Amortization 4,860 4,468 4,852 4,798 4,619 5,052 4,638 6,064 7,522 8,032
Interest Expense 50 19 24 15 8 87 134 191 330 490
Non-Operating Income/Expense 277 539 725 965 -248 80 591 331 565 810
Special Items -102 -140 160 -629 -1,722 -2,928 -411 -291 -240
Income Taxes - Total 2,901 3,946 2,024 2,190 2,394 1,335 4,581 4,839 3,868 2,991 INTC TXN AMD
Cost of Goods Sold .280 .291 .349 .353 .323 .300 .234 .259 .243 .255 .289 0.414 0.455
Selling, General & Admin. Expenses .277 .279 .338 .291 .297 .310 .293 .297 .341 .355 .308 0.267 0.419
Depreciation, Depletion & Amortization .142 .115 .137 .125 .123 .144 .106 .112 .141 .152 .130 0.092 0.139
Interest Expense .001 .000 .001 .000 .000 .002 .003 .004 .006 .009 .003 #N/A 0.041
Non-Operating Income/Expense 464 464 464 464 464 464 464 464 464 464 464 102 -38
Special Items -630 -630 -630 -630 -630 -630 -630 -630 -630 -630 -630 -83 -210
Income Taxes - Total .085 .102 .057 .057 .064 .038 .105 .090 .073 .057 .073 0.055 0.004
Averages
From this table, the first thing that can be seen is the values for Intel are consistent with
the industry numbers based on Intel's place in the industry as a leader (i.e., Intel's lower cost of
goods sold as a lead manufacturer). However, treating all the items as a percentage of sales
may not be the best approach. For example, as sales go up and scale is achieved, cost of goods
should logically go down. Based on this logic, Cost of Goods Sold, Selling, General & Admin.
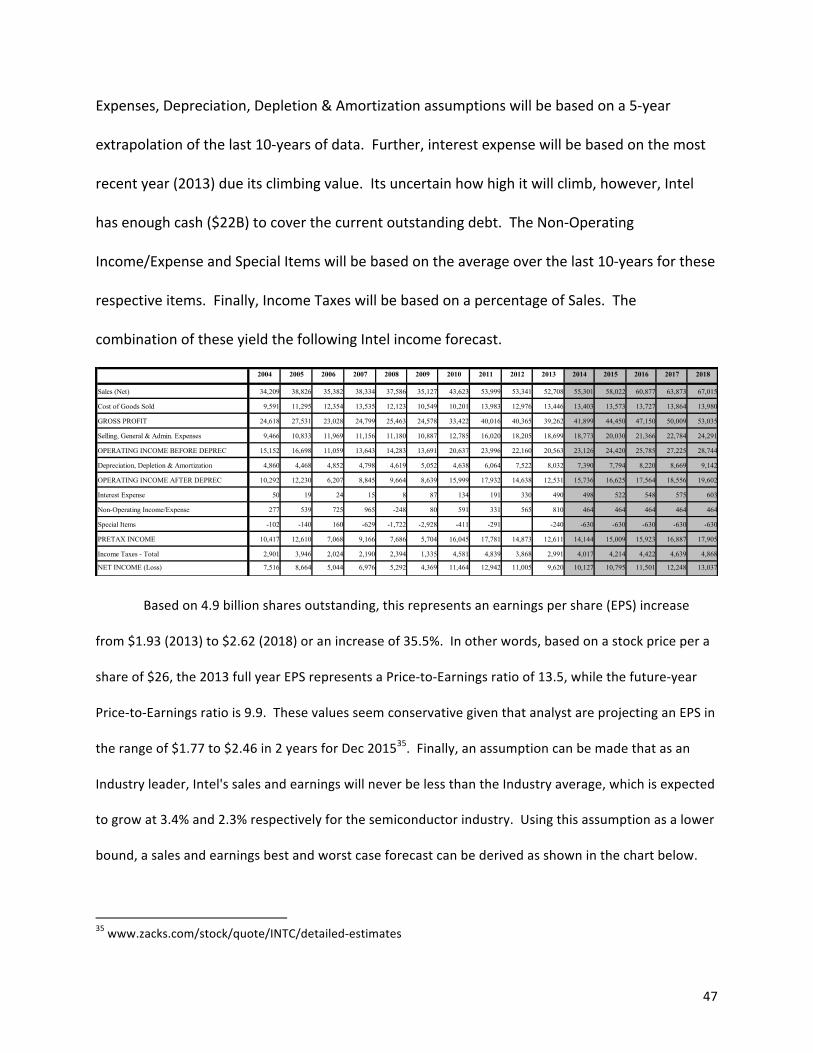
47
Expenses, Depreciation, Depletion & Amortization assumptions will be based on a 5-‐year
extrapolation of the last 10-‐years of data. Further, interest expense will be based on the most
recent year (2013) due its climbing value. Its uncertain how high it will climb, however, Intel
has enough cash ($22B) to cover the current outstanding debt. The Non-‐Operating
Income/Expense and Special Items will be based on the average over the last 10-‐years for these
respective items. Finally, Income Taxes will be based on a percentage of Sales. The
combination of these yield the following Intel income forecast.
2004 2005 2006 2007 2008 2009 2010 2011 2012 2013 2014 2015 2016 2017 2018
Sales (Net) 34,209 38,826 35,382 38,334 37,586 35,127 43,623 53,999 53,341 52,708 55,301 58,022 60,877 63,873 67,015
Cost of Goods Sold 9,591 11,295 12,354 13,535 12,123 10,549 10,201 13,983 12,976 13,446 13,403 13,573 13,727 13,864 13,980
GROSS PROFIT 24,618 27,531 23,028 24,799 25,463 24,578 33,422 40,016 40,365 39,262 41,899 44,450 47,150 50,009 53,035
Selling, General & Admin. Expenses 9,466 10,833 11,969 11,156 11,180 10,887 12,785 16,020 18,205 18,699 18,773 20,030 21,366 22,784 24,291
OPERATING INCOME BEFORE DEPREC 15,152 16,698 11,059 13,643 14,283 13,691 20,637 23,996 22,160 20,563 23,126 24,420 25,785 27,225 28,744
Depreciation, Depletion & Amortization 4,860 4,468 4,852 4,798 4,619 5,052 4,638 6,064 7,522 8,032 7,390 7,794 8,220 8,669 9,142
OPERATING INCOME AFTER DEPREC 10,292 12,230 6,207 8,845 9,664 8,639 15,999 17,932 14,638 12,531 15,736 16,625 17,564 18,556 19,602
Interest Expense 50 19 24 15 8 87 134 191 330 490 498 522 548 575 603
Non-Operating Income/Expense 277 539 725 965 -248 80 591 331 565 810 464 464 464 464 464
Special Items -102 -140 160 -629 -1,722 -2,928 -411 -291 -240 -630 -630 -630 -630 -630
PRETAX INCOME 10,417 12,610 7,068 9,166 7,686 5,704 16,045 17,781 14,873 12,611 14,144 15,009 15,923 16,887 17,905
Income Taxes - Total 2,901 3,946 2,024 2,190 2,394 1,335 4,581 4,839 3,868 2,991 4,017 4,214 4,422 4,639 4,868
NET INCOME (Loss) 7,516 8,664 5,044 6,976 5,292 4,369 11,464 12,942 11,005 9,620 10,127 10,795 11,501 12,248 13,037
Based on 4.9 billion shares outstanding, this represents an earnings per share (EPS) increase
from $1.93 (2013) to $2.62 (2018) or an increase of 35.5%. In other words, based on a stock price per a
share of $26, the 2013 full year EPS represents a Price-‐to-‐Earnings ratio of 13.5, while the future-‐year
Price-‐to-‐Earnings ratio is 9.9. These values seem conservative given that analyst are projecting an EPS in
the range of $1.77 to $2.46 in 2 years for Dec 201535. Finally, an assumption can be made that as an
Industry leader, Intel's sales and earnings will never be less than the Industry average, which is expected
to grow at 3.4% and 2.3% respectively for the semiconductor industry. Using this assumption as a lower
bound, a sales and earnings best and worst case forecast can be derived as shown in the chart below.
35 www.zacks.com/stock/quote/INTC/detailed-‐estimates
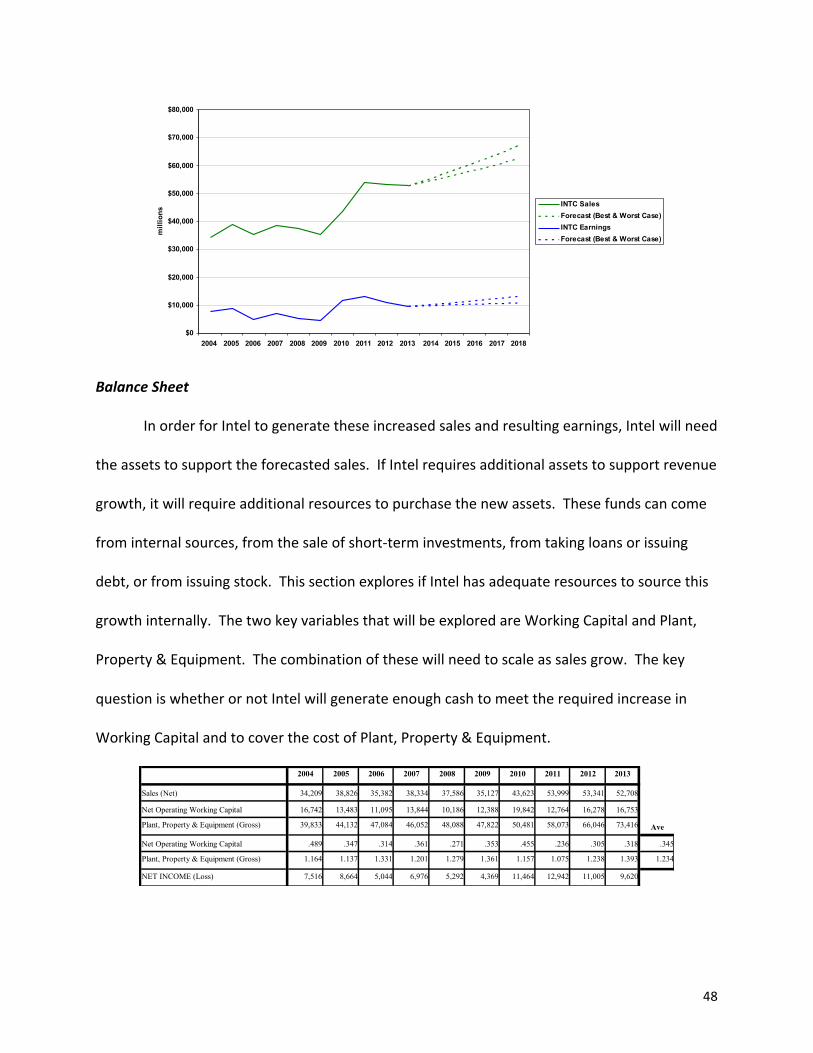
48
$0
$10,000
$20,000
$30,000
$40,000
$50,000
$60,000
$70,000
$80,000
2004 2005 2006 2007 2008 2009 2010 2011 2012 2013 2014 2015 2016 2017 2018
mill
ions
INTC SalesForecast (Best & Worst Case)INTC EarningsForecast (Best & Worst Case)
Balance Sheet
In order for Intel to generate these increased sales and resulting earnings, Intel will need
the assets to support the forecasted sales. If Intel requires additional assets to support revenue
growth, it will require additional resources to purchase the new assets. These funds can come
from internal sources, from the sale of short-‐term investments, from taking loans or issuing
debt, or from issuing stock. This section explores if Intel has adequate resources to source this
growth internally. The two key variables that will be explored are Working Capital and Plant,
Property & Equipment. The combination of these will need to scale as sales grow. The key
question is whether or not Intel will generate enough cash to meet the required increase in
Working Capital and to cover the cost of Plant, Property & Equipment.
2004 2005 2006 2007 2008 2009 2010 2011 2012 2013
Sales (Net) 34,209 38,826 35,382 38,334 37,586 35,127 43,623 53,999 53,341 52,708
Net Operating Working Capital 16,742 13,483 11,095 13,844 10,186 12,388 19,842 12,764 16,278 16,753
Plant, Property & Equipment (Gross) 39,833 44,132 47,084 46,052 48,088 47,822 50,481 58,073 66,046 73,416 Ave
Net Operating Working Capital .489 .347 .314 .361 .271 .353 .455 .236 .305 .318 .345
Plant, Property & Equipment (Gross) 1.164 1.137 1.331 1.201 1.279 1.361 1.157 1.075 1.238 1.393 1.234
NET INCOME (Loss) 7,516 8,664 5,044 6,976 5,292 4,369 11,464 12,942 11,005 9,620
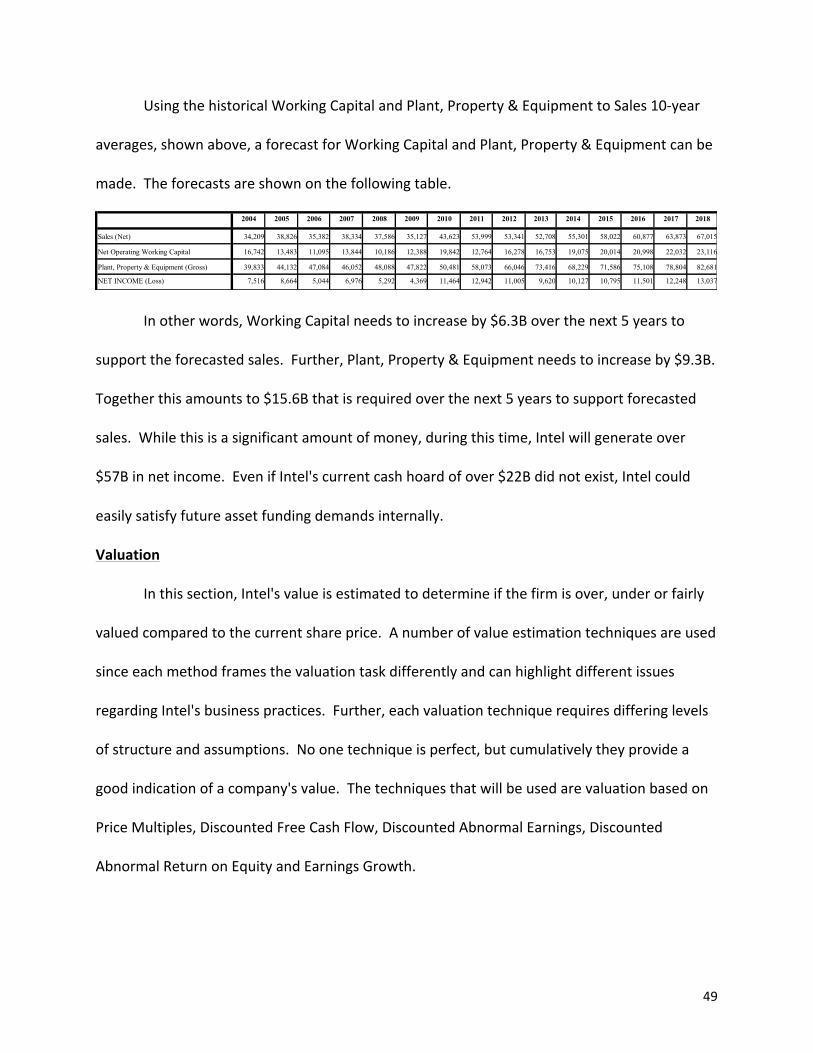
49
Using the historical Working Capital and Plant, Property & Equipment to Sales 10-‐year
averages, shown above, a forecast for Working Capital and Plant, Property & Equipment can be
made. The forecasts are shown on the following table.
2004 2005 2006 2007 2008 2009 2010 2011 2012 2013 2014 2015 2016 2017 2018
Sales (Net) 34,209 38,826 35,382 38,334 37,586 35,127 43,623 53,999 53,341 52,708 55,301 58,022 60,877 63,873 67,015
Net Operating Working Capital 16,742 13,483 11,095 13,844 10,186 12,388 19,842 12,764 16,278 16,753 19,075 20,014 20,998 22,032 23,116
Plant, Property & Equipment (Gross) 39,833 44,132 47,084 46,052 48,088 47,822 50,481 58,073 66,046 73,416 68,229 71,586 75,108 78,804 82,681
NET INCOME (Loss) 7,516 8,664 5,044 6,976 5,292 4,369 11,464 12,942 11,005 9,620 10,127 10,795 11,501 12,248 13,037
In other words, Working Capital needs to increase by $6.3B over the next 5 years to
support the forecasted sales. Further, Plant, Property & Equipment needs to increase by $9.3B.
Together this amounts to $15.6B that is required over the next 5 years to support forecasted
sales. While this is a significant amount of money, during this time, Intel will generate over
$57B in net income. Even if Intel's current cash hoard of over $22B did not exist, Intel could
easily satisfy future asset funding demands internally.
Valuation
In this section, Intel's value is estimated to determine if the firm is over, under or fairly
valued compared to the current share price. A number of value estimation techniques are used
since each method frames the valuation task differently and can highlight different issues
regarding Intel's business practices. Further, each valuation technique requires differing levels
of structure and assumptions. No one technique is perfect, but cumulatively they provide a
good indication of a company's value. The techniques that will be used are valuation based on
Price Multiples, Discounted Free Cash Flow, Discounted Abnormal Earnings, Discounted
Abnormal Return on Equity and Earnings Growth.
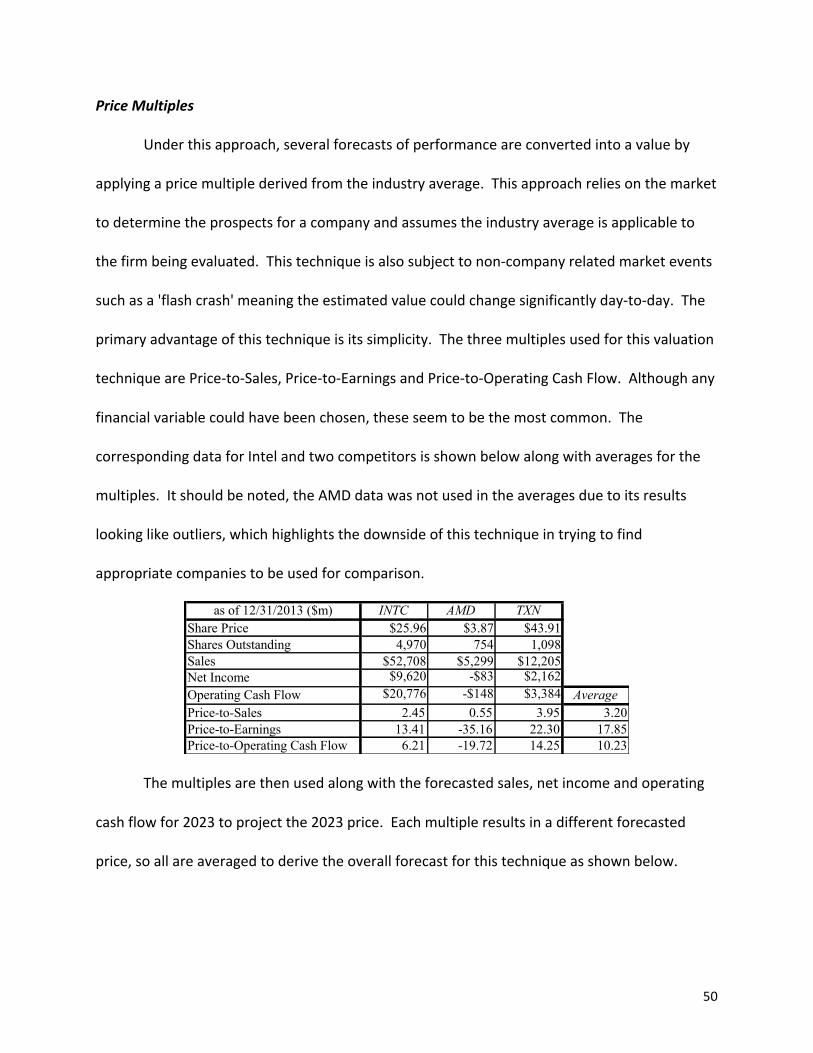
50
Price Multiples
Under this approach, several forecasts of performance are converted into a value by
applying a price multiple derived from the industry average. This approach relies on the market
to determine the prospects for a company and assumes the industry average is applicable to
the firm being evaluated. This technique is also subject to non-‐company related market events
such as a 'flash crash' meaning the estimated value could change significantly day-‐to-‐day. The
primary advantage of this technique is its simplicity. The three multiples used for this valuation
technique are Price-‐to-‐Sales, Price-‐to-‐Earnings and Price-‐to-‐Operating Cash Flow. Although any
financial variable could have been chosen, these seem to be the most common. The
corresponding data for Intel and two competitors is shown below along with averages for the
multiples. It should be noted, the AMD data was not used in the averages due to its results
looking like outliers, which highlights the downside of this technique in trying to find
appropriate companies to be used for comparison.
as of 12/31/2013 ($m) INTC AMD TXNShare Price $25.96 $3.87 $43.91Shares Outstanding 4,970 754 1,098Sales $52,708 $5,299 $12,205Net Income $9,620 -$83 $2,162Operating Cash Flow $20,776 -$148 $3,384 AveragePrice-to-Sales 2.45 0.55 3.95 3.20Price-to-Earnings 13.41 -35.16 22.30 17.85Price-to-Operating Cash Flow 6.21 -19.72 14.25 10.23
The multiples are then used along with the forecasted sales, net income and operating
cash flow for 2023 to project the 2023 price. Each multiple results in a different forecasted
price, so all are averaged to derive the overall forecast for this technique as shown below.
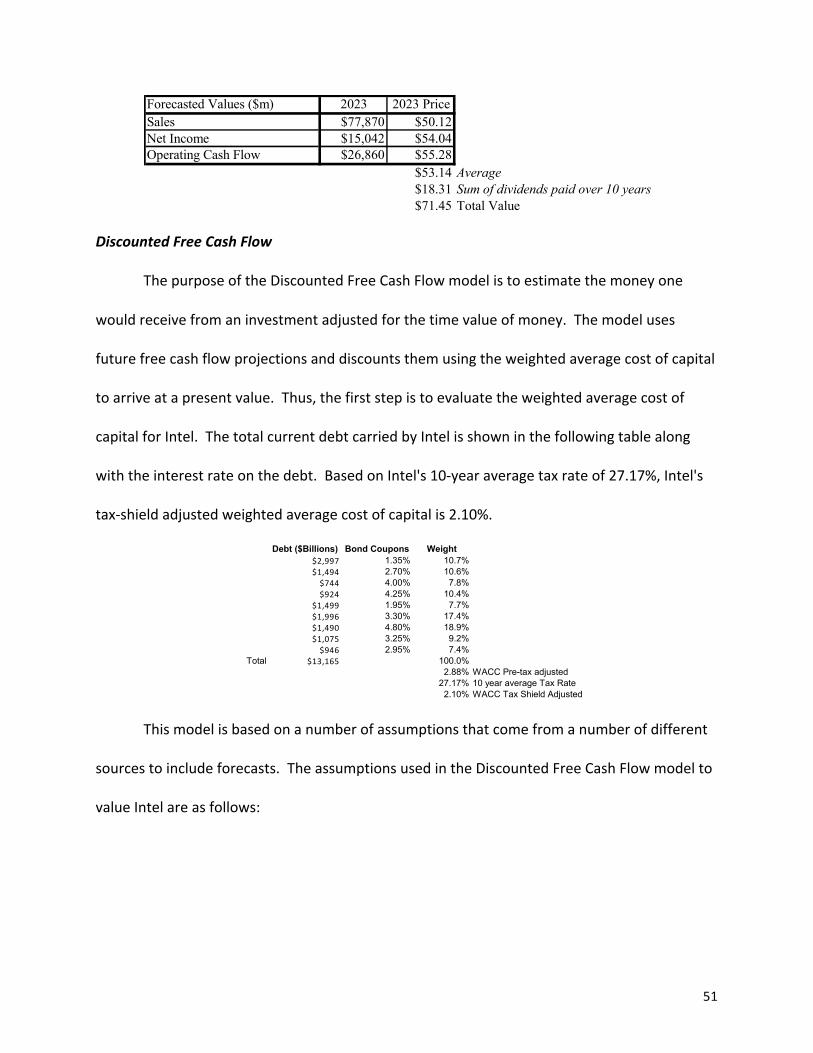
51
Forecasted Values ($m) 2023 2023 PriceSales $77,870 $50.12Net Income $15,042 $54.04Operating Cash Flow $26,860 $55.28
$53.14 Average$18.31 Sum of dividends paid over 10 years$71.45 Total Value
Discounted Free Cash Flow
The purpose of the Discounted Free Cash Flow model is to estimate the money one
would receive from an investment adjusted for the time value of money. The model uses
future free cash flow projections and discounts them using the weighted average cost of capital
to arrive at a present value. Thus, the first step is to evaluate the weighted average cost of
capital for Intel. The total current debt carried by Intel is shown in the following table along
with the interest rate on the debt. Based on Intel's 10-‐year average tax rate of 27.17%, Intel's
tax-‐shield adjusted weighted average cost of capital is 2.10%.
Debt ($Billions) Bond Coupons Weight$2,997 1.35% 10.7%$1,494 2.70% 10.6%$744 4.00% 7.8%$924 4.25% 10.4%
$1,499 1.95% 7.7%$1,996 3.30% 17.4%$1,490 4.80% 18.9%$1,075 3.25% 9.2%$946 2.95% 7.4%
Total $13,165 100.0%2.88% WACC Pre-tax adjusted
27.17% 10 year average Tax Rate2.10% WACC Tax Shield Adjusted
This model is based on a number of assumptions that come from a number of different
sources to include forecasts. The assumptions used in the Discounted Free Cash Flow model to
value Intel are as follows:
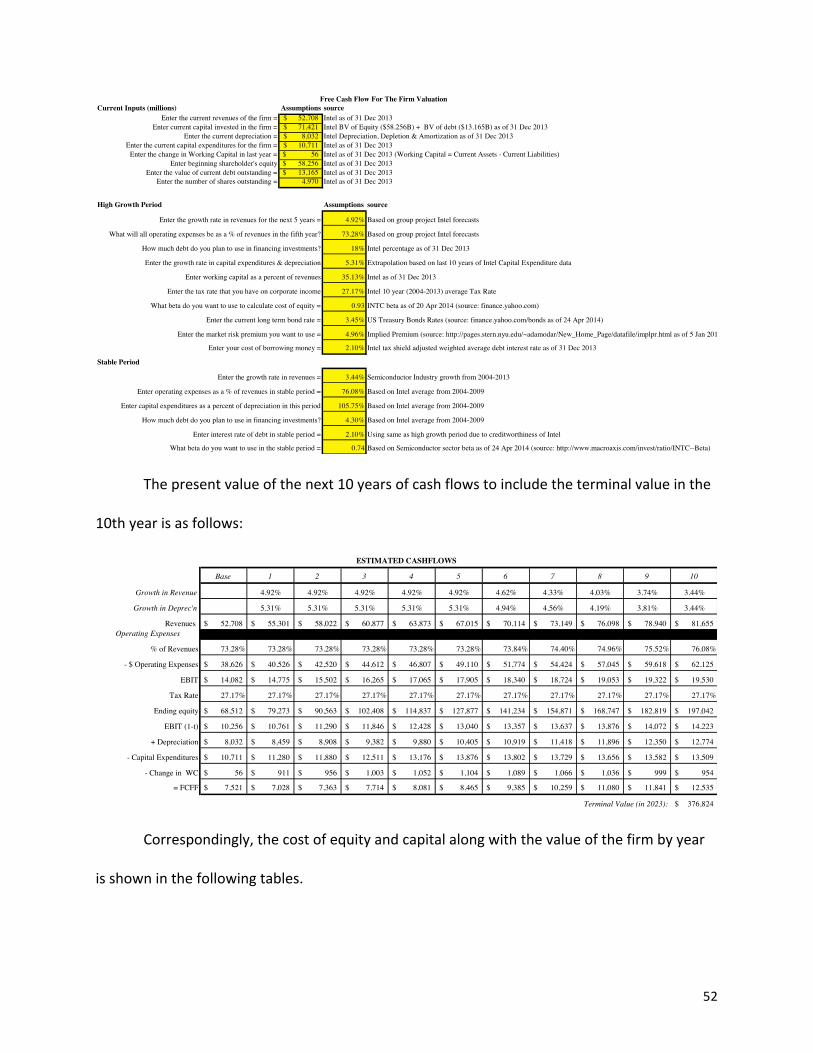
52
Free Cash Flow For The Firm ValuationCurrent Inputs (millions) Assumptions source
Enter the current revenues of the firm = 52,708$ Intel as of 31 Dec 2013Enter current capital invested in the firm = 71,421$ Intel BV of Equity ($58.256B) + BV of debt ($13.165B) as of 31 Dec 2013
Enter the current depreciation = 8,032$ Intel Depreciation, Depletion & Amortization as of 31 Dec 2013Enter the current capital expenditures for the firm = 10,711$ Intel as of 31 Dec 2013
Enter the change in Working Capital in last year = 56$ Intel as of 31 Dec 2013 (Working Capital = Current Assets - Current Liabilities)Enter beginning shareholder's equity 58,256$ Intel as of 31 Dec 2013
Enter the value of current debt outstanding = 13,165$ Intel as of 31 Dec 2013Enter the number of shares outstanding = 4,970 Intel as of 31 Dec 2013
High Growth Period Assumptions source
Enter the growth rate in revenues for the next 5 years = 4.92% Based on group project Intel forecasts
What will all operating expenses be as a % of revenues in the fifth year? 73.28% Based on group project Intel forecasts
How much debt do you plan to use in financing investments? 18% Intel percentage as of 31 Dec 2013
Enter the growth rate in capital expenditures & depreciation 5.31% Extrapolation based on last 10 years of Intel Capital Expenditure data
Enter working capital as a percent of revenues 35.13% Intel as of 31 Dec 2013
Enter the tax rate that you have on corporate income 27.17% Intel 10 year (2004-2013) average Tax Rate
What beta do you want to use to calculate cost of equity = 0.93 INTC beta as of 20 Apr 2014 (source: finance.yahoo.com)
Enter the current long term bond rate = 3.45% US Treasury Bonds Rates (source: finance.yahoo.com/bonds as of 24 Apr 2014)
Enter the market risk premium you want to use = 4.96% Implied Premium (source: http://pages.stern.nyu.edu/~adamodar/New_Home_Page/datafile/implpr.html as of 5 Jan 2014)
Enter your cost of borrowing money = 2.10% Intel tax shield adjusted weighted average debt interest rate as of 31 Dec 2013
Stable Period
Enter the growth rate in revenues = 3.44% Semiconductor Industry growth from 2004-2013
Enter operating expenses as a % of revenues in stable period = 76.08% Based on Intel average from 2004-2009
Enter capital expenditures as a percent of depreciation in this period 105.75% Based on Intel average from 2004-2009
How much debt do you plan to use in financing investments? 4.30% Based on Intel average from 2004-2009
Enter interest rate of debt in stable period = 2.10% Using same as high growth period due to creditworthiness of Intel
What beta do you want to use in the stable period = 0.74 Based on Semiconductor sector beta as of 24 Apr 2014 (source: http://www.macroaxis.com/invest/ratio/INTC--Beta)
The present value of the next 10 years of cash flows to include the terminal value in the
10th year is as follows:
ESTIMATED CASHFLOWS
Base 1 2 3 4 5 6 7 8 9 10
Growth in Revenue 4.92% 4.92% 4.92% 4.92% 4.92% 4.62% 4.33% 4.03% 3.74% 3.44%
Growth in Deprec'n 5.31% 5.31% 5.31% 5.31% 5.31% 4.94% 4.56% 4.19% 3.81% 3.44%
Revenues 52,708$ 55,301$ 58,022$ 60,877$ 63,873$ 67,015$ 70,114$ 73,149$ 76,098$ 78,940$ 81,655$ Operating Expenses
% of Revenues 73.28% 73.28% 73.28% 73.28% 73.28% 73.28% 73.84% 74.40% 74.96% 75.52% 76.08%
- $ Operating Expenses 38,626$ 40,526$ 42,520$ 44,612$ 46,807$ 49,110$ 51,774$ 54,424$ 57,045$ 59,618$ 62,125$
EBIT 14,082$ 14,775$ 15,502$ 16,265$ 17,065$ 17,905$ 18,340$ 18,724$ 19,053$ 19,322$ 19,530$
Tax Rate 27.17% 27.17% 27.17% 27.17% 27.17% 27.17% 27.17% 27.17% 27.17% 27.17% 27.17%
Ending equity 68,512$ 79,273$ 90,563$ 102,408$ 114,837$ 127,877$ 141,234$ 154,871$ 168,747$ 182,819$ 197,042$
EBIT (1-t) 10,256$ 10,761$ 11,290$ 11,846$ 12,428$ 13,040$ 13,357$ 13,637$ 13,876$ 14,072$ 14,223$
+ Depreciation 8,032$ 8,459$ 8,908$ 9,382$ 9,880$ 10,405$ 10,919$ 11,418$ 11,896$ 12,350$ 12,774$
- Capital Expenditures 10,711$ 11,280$ 11,880$ 12,511$ 13,176$ 13,876$ 13,802$ 13,729$ 13,656$ 13,582$ 13,509$
- Change in WC 56$ 911$ 956$ 1,003$ 1,052$ 1,104$ 1,089$ 1,066$ 1,036$ 999$ 954$
= FCFF 7,521$ 7,028$ 7,363$ 7,714$ 8,081$ 8,465$ 9,385$ 10,259$ 11,080$ 11,841$ 12,535$
Terminal Value (in 2023): 376,824$
Correspondingly, the cost of equity and capital along with the value of the firm by year
is shown in the following tables.
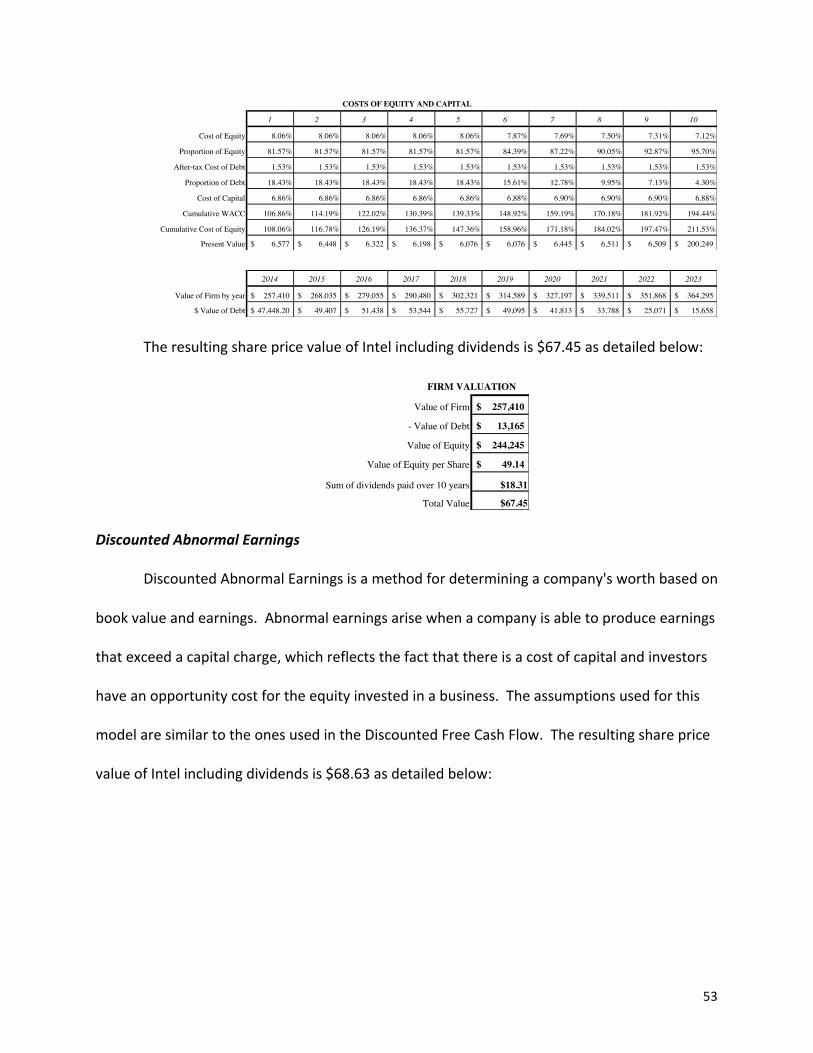
53
COSTS OF EQUITY AND CAPITAL
1 2 3 4 5 6 7 8 9 10
Cost of Equity 8.06% 8.06% 8.06% 8.06% 8.06% 7.87% 7.69% 7.50% 7.31% 7.12%
Proportion of Equity 81.57% 81.57% 81.57% 81.57% 81.57% 84.39% 87.22% 90.05% 92.87% 95.70%
After-tax Cost of Debt 1.53% 1.53% 1.53% 1.53% 1.53% 1.53% 1.53% 1.53% 1.53% 1.53%
Proportion of Debt 18.43% 18.43% 18.43% 18.43% 18.43% 15.61% 12.78% 9.95% 7.13% 4.30%
Cost of Capital 6.86% 6.86% 6.86% 6.86% 6.86% 6.88% 6.90% 6.90% 6.90% 6.88%
Cumulative WACC 106.86% 114.19% 122.02% 130.39% 139.33% 148.92% 159.19% 170.18% 181.92% 194.44%
Cumulative Cost of Equity 108.06% 116.78% 126.19% 136.37% 147.36% 158.96% 171.18% 184.02% 197.47% 211.53%
Present Value 6,577$ 6,448$ 6,322$ 6,198$ 6,076$ 6,076$ 6,445$ 6,511$ 6,509$ 200,249$
2014 2015 2016 2017 2018 2019 2020 2021 2022 2023
Value of Firm by year 257,410$ 268,035$ 279,055$ 290,480$ 302,321$ 314,589$ 327,197$ 339,511$ 351,868$ 364,295$
$ Value of Debt 47,448.20$ 49,407$ 51,438$ 53,544$ 55,727$ 49,095$ 41,813$ 33,788$ 25,071$ 15,658$
The resulting share price value of Intel including dividends is $67.45 as detailed below:
Value of Firm 257,410$
- Value of Debt 13,165$
Value of Equity 244,245$
Value of Equity per Share 49.14$
Sum of dividends paid over 10 years $18.31
Total Value $67.45
FIRM VALUATION
Discounted Abnormal Earnings
Discounted Abnormal Earnings is a method for determining a company's worth based on
book value and earnings. Abnormal earnings arise when a company is able to produce earnings
that exceed a capital charge, which reflects the fact that there is a cost of capital and investors
have an opportunity cost for the equity invested in a business. The assumptions used for this
model are similar to the ones used in the Discounted Free Cash Flow. The resulting share price
value of Intel including dividends is $68.63 as detailed below:
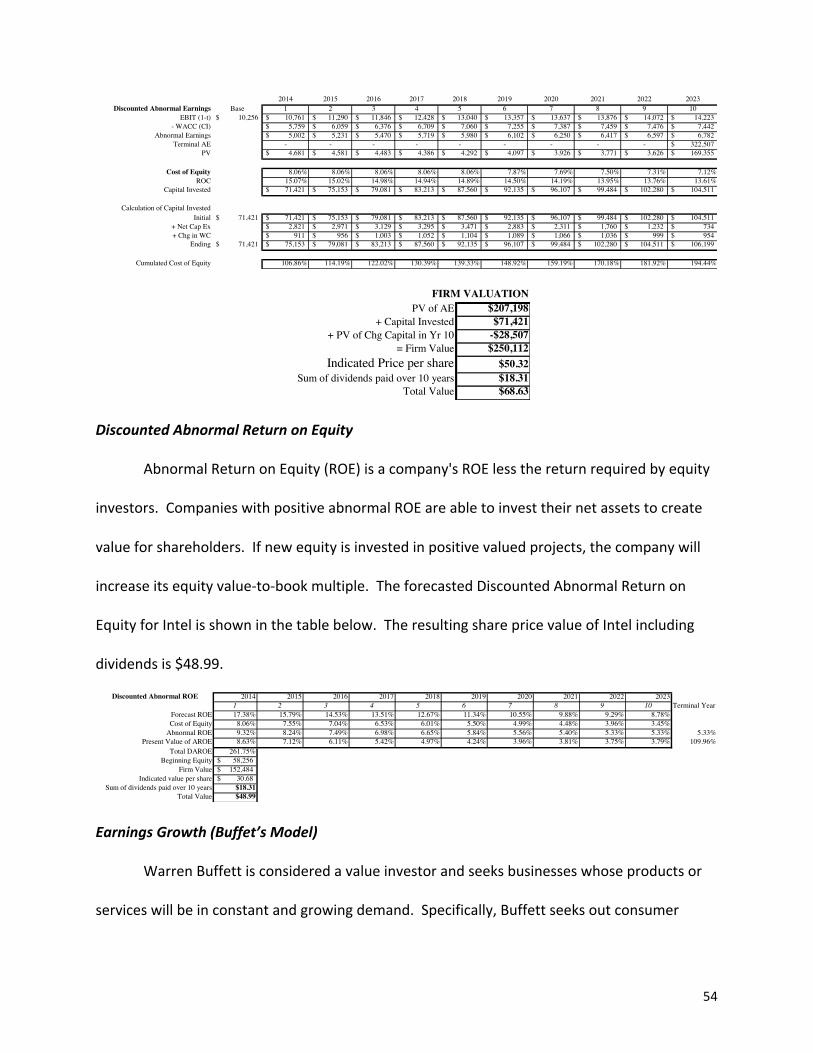
54
2014 2015 2016 2017 2018 2019 2020 2021 2022 2023Discounted Abnormal Earnings Base 1 2 3 4 5 6 7 8 9 10
EBIT (1-t) 10,256$ 10,761$ 11,290$ 11,846$ 12,428$ 13,040$ 13,357$ 13,637$ 13,876$ 14,072$ 14,223$ - WACC (CI) 5,759$ 6,059$ 6,376$ 6,709$ 7,060$ 7,255$ 7,387$ 7,459$ 7,476$ 7,442$
Abnormal Earnings 5,002$ 5,231$ 5,470$ 5,719$ 5,980$ 6,102$ 6,250$ 6,417$ 6,597$ 6,782$ Terminal AE - - - - - - - - - 322,507$
PV 4,681$ 4,581$ 4,483$ 4,386$ 4,292$ 4,097$ 3,926$ 3,771$ 3,626$ 169,355$
Cost of Equity 8.06% 8.06% 8.06% 8.06% 8.06% 7.87% 7.69% 7.50% 7.31% 7.12%ROC 15.07% 15.02% 14.98% 14.94% 14.89% 14.50% 14.19% 13.95% 13.76% 13.61%
Capital Invested 71,421$ 75,153$ 79,081$ 83,213$ 87,560$ 92,135$ 96,107$ 99,484$ 102,280$ 104,511$
Calculation of Capital InvestedInitial 71,421$ 71,421$ 75,153$ 79,081$ 83,213$ 87,560$ 92,135$ 96,107$ 99,484$ 102,280$ 104,511$
+ Net Cap Ex 2,821$ 2,971$ 3,129$ 3,295$ 3,471$ 2,883$ 2,311$ 1,760$ 1,232$ 734$ + Chg in WC 911$ 956$ 1,003$ 1,052$ 1,104$ 1,089$ 1,066$ 1,036$ 999$ 954$
Ending 71,421$ 75,153$ 79,081$ 83,213$ 87,560$ 92,135$ 96,107$ 99,484$ 102,280$ 104,511$ 106,199$
Cumulated Cost of Equity 106.86% 114.19% 122.02% 130.39% 139.33% 148.92% 159.19% 170.18% 181.92% 194.44%
PV of AE $207,198 + Capital Invested $71,421
+ PV of Chg Capital in Yr 10 -$28,507 = Firm Value $250,112
Indicated Price per share $50.32Sum of dividends paid over 10 years $18.31
Total Value $68.63
FIRM VALUATION
Discounted Abnormal Return on Equity
Abnormal Return on Equity (ROE) is a company's ROE less the return required by equity
investors. Companies with positive abnormal ROE are able to invest their net assets to create
value for shareholders. If new equity is invested in positive valued projects, the company will
increase its equity value-‐to-‐book multiple. The forecasted Discounted Abnormal Return on
Equity for Intel is shown in the table below. The resulting share price value of Intel including
dividends is $48.99.
Discounted Abnormal ROE 2014 2015 2016 2017 2018 2019 2020 2021 2022 20231 2 3 4 5 6 7 8 9 10 Terminal Year
Forecast ROE 17.38% 15.79% 14.53% 13.51% 12.67% 11.34% 10.55% 9.88% 9.29% 8.78%Cost of Equity 8.06% 7.55% 7.04% 6.53% 6.01% 5.50% 4.99% 4.48% 3.96% 3.45%
Abnormal ROE 9.32% 8.24% 7.49% 6.98% 6.65% 5.84% 5.56% 5.40% 5.33% 5.33% 5.33%Present Value of AROE 8.63% 7.12% 6.11% 5.42% 4.97% 4.24% 3.96% 3.81% 3.75% 3.79% 109.96%
Total DAROE 261.75%Beginning Equity 58,256$
Firm Value 152,484$ Indicated value per share 30.68$
Sum of dividends paid over 10 years $18.31Total Value $48.99
Earnings Growth (Buffet’s Model)
Warren Buffett is considered a value investor and seeks businesses whose products or
services will be in constant and growing demand. Specifically, Buffett seeks out consumer
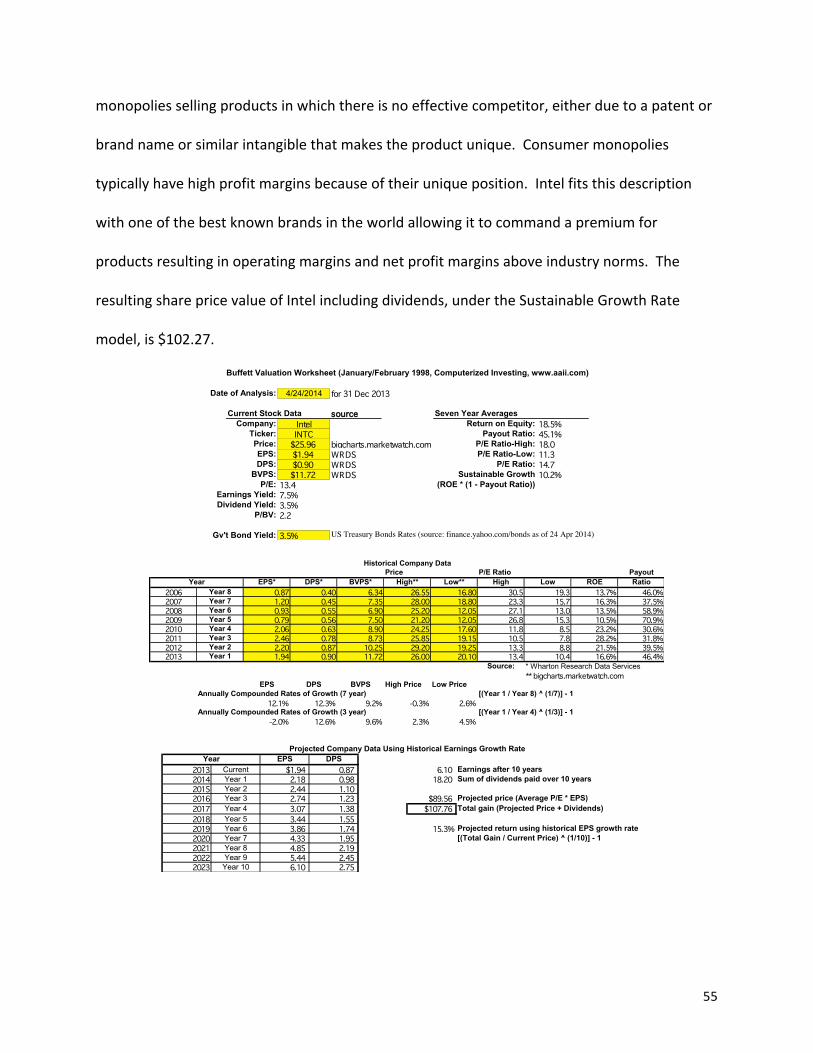
55
monopolies selling products in which there is no effective competitor, either due to a patent or
brand name or similar intangible that makes the product unique. Consumer monopolies
typically have high profit margins because of their unique position. Intel fits this description
with one of the best known brands in the world allowing it to command a premium for
products resulting in operating margins and net profit margins above industry norms. The
resulting share price value of Intel including dividends, under the Sustainable Growth Rate
model, is $102.27.
Date of Analysis: 4/24/2014 for 31 Dec 2013
Current Stock Data source Seven Year AveragesCompany: Intel Return on Equity: 18.5%
Ticker: INTC Payout Ratio: 45.1%Price: $25.96 bigcharts.marketwatch.com P/E Ratio-High: 18.0EPS: $1.94 WRDS P/E Ratio-Low: 11.3DPS: $0.90 WRDS P/E Ratio: 14.7
BVPS: $11.72 WRDS Sustainable Growth 10.2%P/E: 13.4 (ROE * (1 - Payout Ratio))
Earnings Yield: 7.5%Dividend Yield: 3.5%
P/BV: 2.2
Gv't Bond Yield: 3.5% US Treasury Bonds Rates (source: finance.yahoo.com/bonds as of 24 Apr 2014)
Buffett Valuation Worksheet (January/February 1998, Computerized Investing, www.aaii.com)
Price P/E Ratio PayoutEPS* DPS* BVPS* High** Low** High Low ROE Ratio
2006 Year 8 0.87 0.40 6.34 26.55 16.80 30.5 19.3 13.7% 46.0%2007 Year 7 1.20 0.45 7.35 28.00 18.80 23.3 15.7 16.3% 37.5%2008 Year 6 0.93 0.55 6.90 25.20 12.05 27.1 13.0 13.5% 58.9%2009 Year 5 0.79 0.56 7.50 21.20 12.05 26.8 15.3 10.5% 70.9%2010 Year 4 2.06 0.63 8.90 24.25 17.60 11.8 8.5 23.2% 30.6%2011 Year 3 2.46 0.78 8.73 25.85 19.15 10.5 7.8 28.2% 31.8%2012 Year 2 2.20 0.87 10.25 29.20 19.25 13.3 8.8 21.5% 39.5%2013 Year 1 1.94 0.90 11.72 26.00 20.10 13.4 10.4 16.6% 46.4%
Source: * Wharton Research Data Services** bigcharts.marketwatch.com
EPS DPS BVPS High Price Low PriceAnnually Compounded Rates of Growth (7 year) [(Year 1 / Year 8) ^ (1/7)] - 1
12.1% 12.3% 9.2% -0.3% 2.6%Annually Compounded Rates of Growth (3 year) [(Year 1 / Year 4) ^ (1/3)] - 1
-2.0% 12.6% 9.6% 2.3% 4.5%
Historical Company Data
Year
EPS DPS2013 Current $1.94 0.87 6.10 Earnings after 10 years2014 Year 1 2.18 0.98 18.20 Sum of dividends paid over 10 years2015 Year 2 2.44 1.10 2016 Year 3 2.74 1.23 $89.56 Projected price (Average P/E * EPS)2017 Year 4 3.07 1.38 $107.76 Total gain (Projected Price + Dividends)2018 Year 5 3.44 1.55 2019 Year 6 3.86 1.74 15.3% Projected return using historical EPS growth rate2020 Year 7 4.33 1.95 [(Total Gain / Current Price) ^ (1/10)] - 12021 Year 8 4.85 2.19 2022 Year 9 5.44 2.45 2023 Year 10 6.10 2.75
YearProjected Company Data Using Historical Earnings Growth Rate
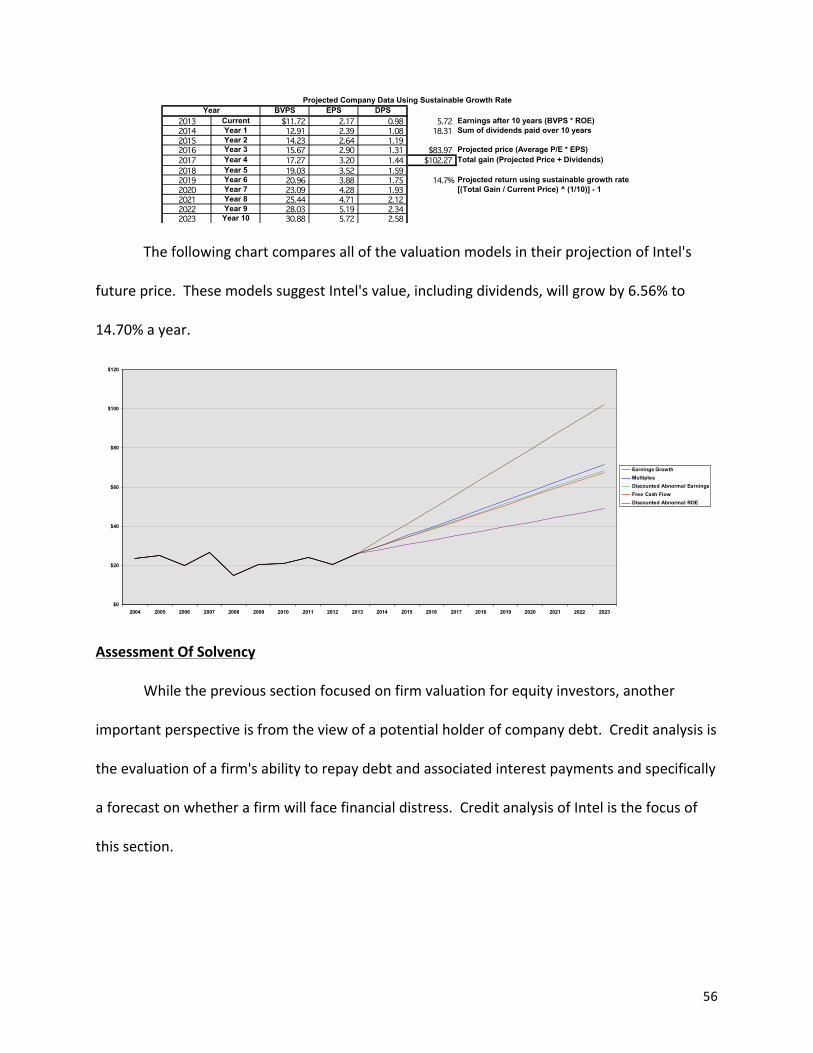
56
BVPS EPS DPS2013 Current $11.72 2.17 0.98 5.72 Earnings after 10 years (BVPS * ROE)2014 Year 1 12.91 2.39 1.08 18.31 Sum of dividends paid over 10 years2015 Year 2 14.23 2.64 1.19 2016 Year 3 15.67 2.90 1.31 $83.97 Projected price (Average P/E * EPS)2017 Year 4 17.27 3.20 1.44 $102.27 Total gain (Projected Price + Dividends)2018 Year 5 19.03 3.52 1.59 2019 Year 6 20.96 3.88 1.75 14.7% Projected return using sustainable growth rate2020 Year 7 23.09 4.28 1.93 [(Total Gain / Current Price) ^ (1/10)] - 12021 Year 8 25.44 4.71 2.12 2022 Year 9 28.03 5.19 2.34 2023 Year 10 30.88 5.72 2.58
Projected Company Data Using Sustainable Growth RateYear
The following chart compares all of the valuation models in their projection of Intel's
future price. These models suggest Intel's value, including dividends, will grow by 6.56% to
14.70% a year.
$0
$20
$40
$60
$80
$100
$120
2004 2005 2006 2007 2008 2009 2010 2011 2012 2013 2014 2015 2016 2017 2018 2019 2020 2021 2022 2023
Earnings GrowthMultiplesDiscounted Abnormal EarningsFree Cash FlowDiscounted Abnormal ROE
Assessment Of Solvency
While the previous section focused on firm valuation for equity investors, another
important perspective is from the view of a potential holder of company debt. Credit analysis is
the evaluation of a firm's ability to repay debt and associated interest payments and specifically
a forecast on whether a firm will face financial distress. Credit analysis of Intel is the focus of
this section.
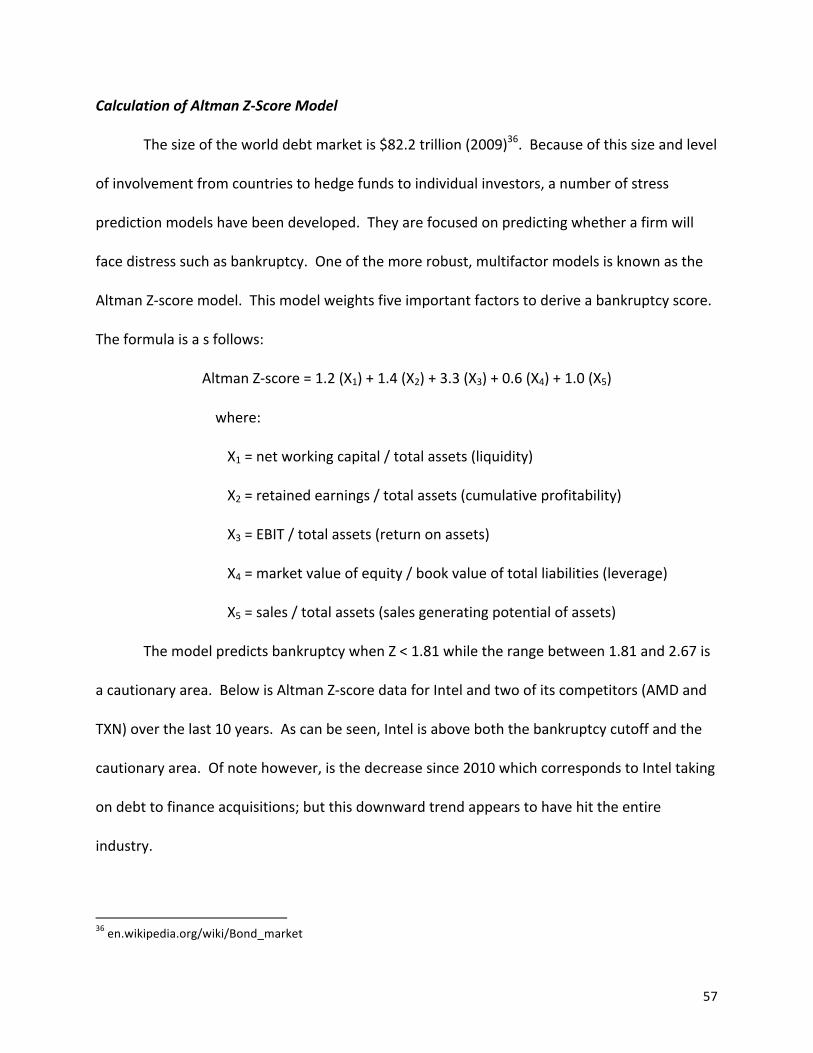
57
Calculation of Altman Z-‐Score Model
The size of the world debt market is $82.2 trillion (2009)36. Because of this size and level
of involvement from countries to hedge funds to individual investors, a number of stress
prediction models have been developed. They are focused on predicting whether a firm will
face distress such as bankruptcy. One of the more robust, multifactor models is known as the
Altman Z-‐score model. This model weights five important factors to derive a bankruptcy score.
The formula is a s follows:
Altman Z-‐score = 1.2 (X1) + 1.4 (X2) + 3.3 (X3) + 0.6 (X4) + 1.0 (X5)
where:
X1 = net working capital / total assets (liquidity)
X2 = retained earnings / total assets (cumulative profitability)
X3 = EBIT / total assets (return on assets)
X4 = market value of equity / book value of total liabilities (leverage)
X5 = sales / total assets (sales generating potential of assets)
The model predicts bankruptcy when Z < 1.81 while the range between 1.81 and 2.67 is
a cautionary area. Below is Altman Z-‐score data for Intel and two of its competitors (AMD and
TXN) over the last 10 years. As can be seen, Intel is above both the bankruptcy cutoff and the
cautionary area. Of note however, is the decrease since 2010 which corresponds to Intel taking
on debt to finance acquisitions; but this downward trend appears to have hit the entire
industry.
36 en.wikipedia.org/wiki/Bond_market
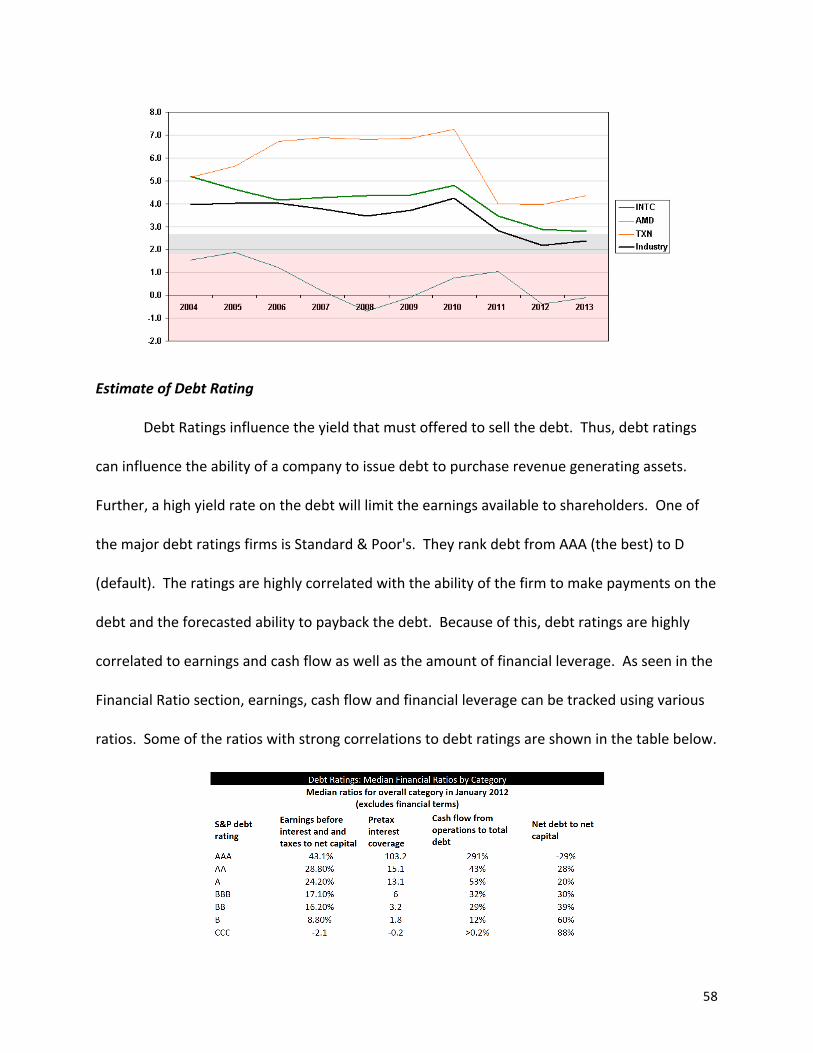
58
Estimate of Debt Rating
Debt Ratings influence the yield that must offered to sell the debt. Thus, debt ratings
can influence the ability of a company to issue debt to purchase revenue generating assets.
Further, a high yield rate on the debt will limit the earnings available to shareholders. One of
the major debt ratings firms is Standard & Poor's. They rank debt from AAA (the best) to D
(default). The ratings are highly correlated with the ability of the firm to make payments on the
debt and the forecasted ability to payback the debt. Because of this, debt ratings are highly
correlated to earnings and cash flow as well as the amount of financial leverage. As seen in the
Financial Ratio section, earnings, cash flow and financial leverage can be tracked using various
ratios. Some of the ratios with strong correlations to debt ratings are shown in the table below.
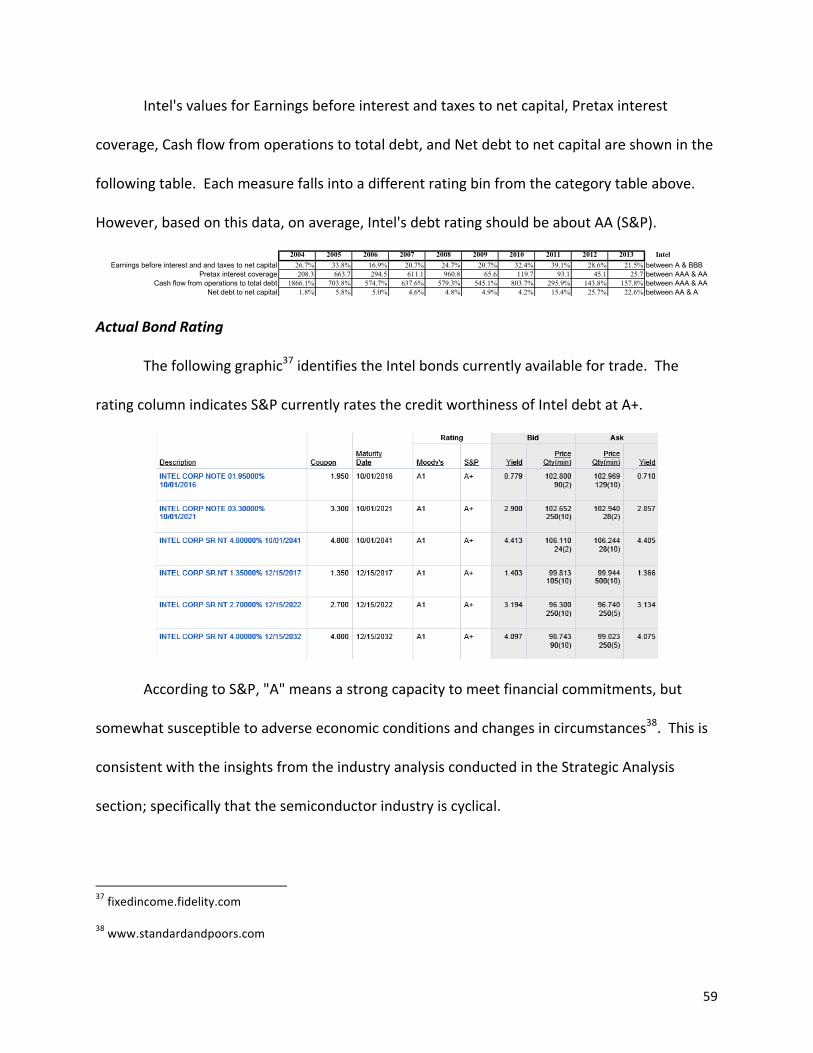
59
Intel's values for Earnings before interest and taxes to net capital, Pretax interest
coverage, Cash flow from operations to total debt, and Net debt to net capital are shown in the
following table. Each measure falls into a different rating bin from the category table above.
However, based on this data, on average, Intel's debt rating should be about AA (S&P).
2004 2005 2006 2007 2008 2009 2010 2011 2012 2013 IntelEarnings before interest and and taxes to net capital 26.7% 33.8% 16.9% 20.7% 24.7% 20.7% 32.4% 39.1% 28.6% 21.5% between A & BBB
Pretax interest coverage 208.3 663.7 294.5 611.1 960.8 65.6 119.7 93.1 45.1 25.7 between AAA & AACash flow from operations to total debt 1866.1% 703.8% 574.7% 637.6% 579.3% 545.1% 803.7% 295.9% 143.8% 157.8% between AAA & AA
Net debt to net capital 1.8% 5.8% 5.0% 4.6% 4.8% 4.9% 4.2% 15.4% 25.7% 22.6% between AA & A
Actual Bond Rating
The following graphic37 identifies the Intel bonds currently available for trade. The
rating column indicates S&P currently rates the credit worthiness of Intel debt at A+.
According to S&P, "A" means a strong capacity to meet financial commitments, but
somewhat susceptible to adverse economic conditions and changes in circumstances38. This is
consistent with the insights from the industry analysis conducted in the Strategic Analysis
section; specifically that the semiconductor industry is cyclical.
37 fixedincome.fidelity.com
38 www.standardandpoors.com
60
Conclusion
The semiconductor industry has been growing for over 40 years with industry annual
revenues of over $200 billion39. The semiconductor industry is characterized by rapid
technological innovation and no one does innovation like Intel. Intel is the world's fifth most
valuable brand worth $35 billion and its microprocessors drive almost 90% of the world's
personal computers. This leadership position gives Intel more latitude to invest in research and
development, which translates into increased efficiency of design and manufacturing. Despite
this strength, Intel is susceptible to the general health of the economy which dictates demand
for semiconductor components. However, Intel has taken steps to diversify by making
acquisitions in the areas of security solutions, wireless options and cloud computing.
Intel has consistently reported strong financial numbers. A review of Intel's financial
statements suggest the firm has considerable accounting flexibility that could potentially be
used to distort their reported numbers. Specifically, Intel makes extensive use of subjective
judgments on the valuation of non-‐marketable equity investments as well as judgments on the
timing of revenue recognition. These could be a mechanism to smooth earnings. However,
Intel is very forthcoming about the extensive use of subjective estimates in their financial
reporting. Further, their accounting practices are in alignment with other firms in the industry.
Overall, the accounting strategy used by Intel seems to accurately represent the company’s
financial activity and health.
Financial metrics paint a very positive picture of Intel's performance and health.
Specifically, on profitability metrics such as Return on Equity, Return on Assets, Gross Profit
39 www.pwc.com/gx/en/technology/publications/semiconductor-‐industry-‐analysis-‐and-‐projections.jhtml
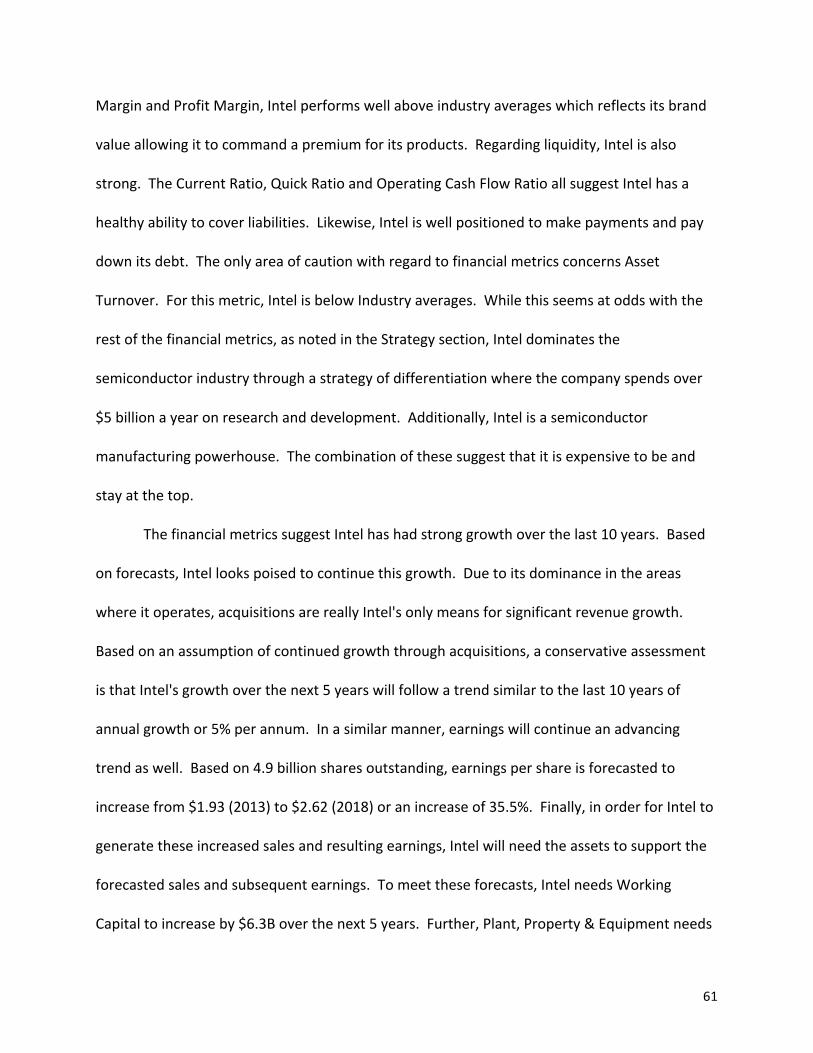
61
Margin and Profit Margin, Intel performs well above industry averages which reflects its brand
value allowing it to command a premium for its products. Regarding liquidity, Intel is also
strong. The Current Ratio, Quick Ratio and Operating Cash Flow Ratio all suggest Intel has a
healthy ability to cover liabilities. Likewise, Intel is well positioned to make payments and pay
down its debt. The only area of caution with regard to financial metrics concerns Asset
Turnover. For this metric, Intel is below Industry averages. While this seems at odds with the
rest of the financial metrics, as noted in the Strategy section, Intel dominates the
semiconductor industry through a strategy of differentiation where the company spends over
$5 billion a year on research and development. Additionally, Intel is a semiconductor
manufacturing powerhouse. The combination of these suggest that it is expensive to be and
stay at the top.
The financial metrics suggest Intel has had strong growth over the last 10 years. Based
on forecasts, Intel looks poised to continue this growth. Due to its dominance in the areas
where it operates, acquisitions are really Intel's only means for significant revenue growth.
Based on an assumption of continued growth through acquisitions, a conservative assessment
is that Intel's growth over the next 5 years will follow a trend similar to the last 10 years of
annual growth or 5% per annum. In a similar manner, earnings will continue an advancing
trend as well. Based on 4.9 billion shares outstanding, earnings per share is forecasted to
increase from $1.93 (2013) to $2.62 (2018) or an increase of 35.5%. Finally, in order for Intel to
generate these increased sales and resulting earnings, Intel will need the assets to support the
forecasted sales and subsequent earnings. To meet these forecasts, Intel needs Working
Capital to increase by $6.3B over the next 5 years. Further, Plant, Property & Equipment needs
62
to increase by $9.3B. Together this amounts to $15.6B that is required over the next 5 years.
While this is a significant amount of money, during this time, Intel will generate over $57B in
net income. Even if Intel's current cash hoard of over $22B did not exist, Intel could easily
satisfy future asset funding demands internally.
Increases in forecasted sales and earnings would indicate Intel is a value relative to its
current share price. A number of value estimation techniques need to be used since each
method frames the valuation task differently and can highlight different issues regarding Intel's
business practices. Further, each valuation technique requires differing levels of structure and
assumptions. No one technique is perfect, but cumulatively they provide a good indication of a
company's value. These models suggest Intel's value, including dividends, will grow by 6.56% to
14.70% a year over the next 10 years.
Another important perspective is from the view of a potential holder of company debt.
Credit analysis is the evaluation of a firm's ability to repay debt and associated interest
payments and specifically a forecast on whether a firm will face financial distress. Credit
analysis of Intel suggests it is healthy and has ample ability to pay liabilities from cash on hand
as well as from on-‐going operations. Further, S&P currently rates the credit worthiness of Intel
debt at A+ suggesting Intel has "a strong capacity to meet financial commitments, but [is]
somewhat susceptible to adverse economic conditions and changes in circumstances."
In closing, the analysis suggests Intel is a leader in the semiconductor industry and is
making the right strategic decisions to ensure they maintain that position. Further, an
examination of the financial statements does not indicate any improprieties. Due to these
insights, along with strong forecasted financial performance, Intel is a BUY.


![Samsung Chassis Ks7a Cw29m064n 1165 [ET]](https://img.pdfslide.us/doc/110x75/542ce1d7219acd4e4b8b4d17/samsung-chassis-ks7a-cw29m064n-1165-et.jpg)