Embed Size (px)
Citation preview
SOUTHWEST AIRLINES STRATEGIC PLAN
• Group 3: Jennifer Kreisler, Hyden Harnarine, Johnathan Wilson, Jose Blancas, John Glasgow
• 12/5/2014
• Prof. Giovanni Leusch-Carnaroli
• BMGT 495 Strategic Management Fall 2014
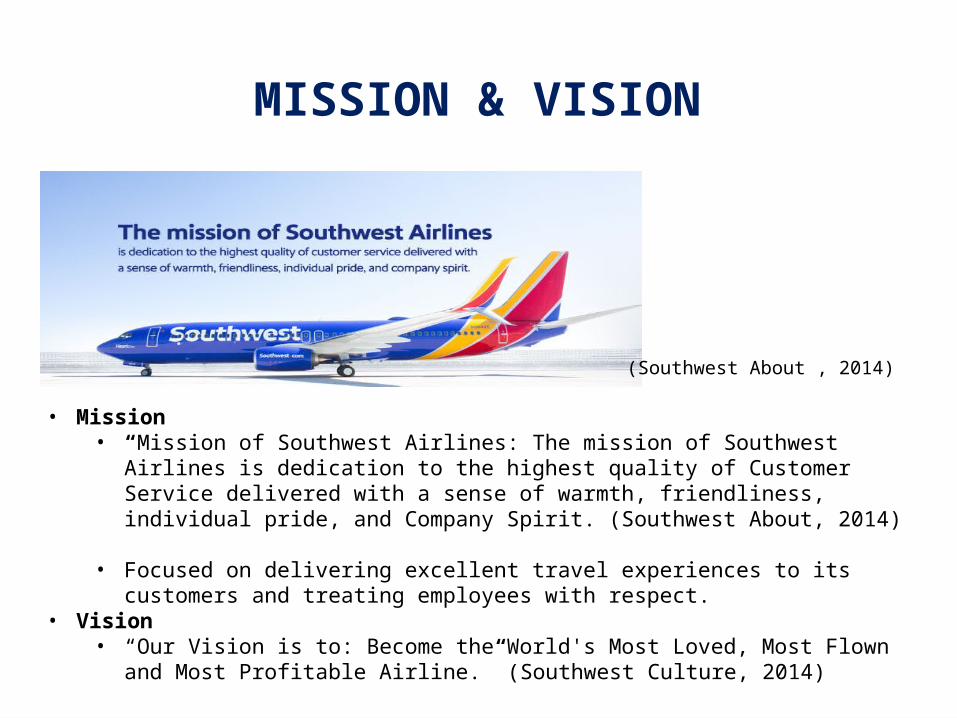
MISSION & VISION
(Southwest About , 2014)
• Mission • “Mission of Southwest Airlines: The mission of Southwest Airlines is dedication to the highest
quality of Customer Service delivered with a sense of warmth, friendliness, individual pride, and Company Spirit. (Southwest About, 2014)
• Focused on delivering excellent travel experiences to its customers and treating employees with respect.
• Vision• “Our Vision is to: Become the World's Most Loved, Most Flown and Most Profitable Airline.”
(Southwest Culture, 2014)
ORGANIZATIONAL BACKGROUND
• Founded in 1967 by Rollin King and Herbert D. Kelleher in Dallas, TX (Funding Universe, 2013) • Began operations in 1971 with only three Boeing 737s
providing service to only Houston, Dallas and San Antonio• Became first airline to offer frequent flyer miles program
in 1987• Recognized as largest low-cost airline in the world• Employs over 44,000, Earned Revenues above $17 billion
and annual profit of $754 million in 2013 (Southwest Investor Relations, 2014)
INDUSTRY ANALYSIS
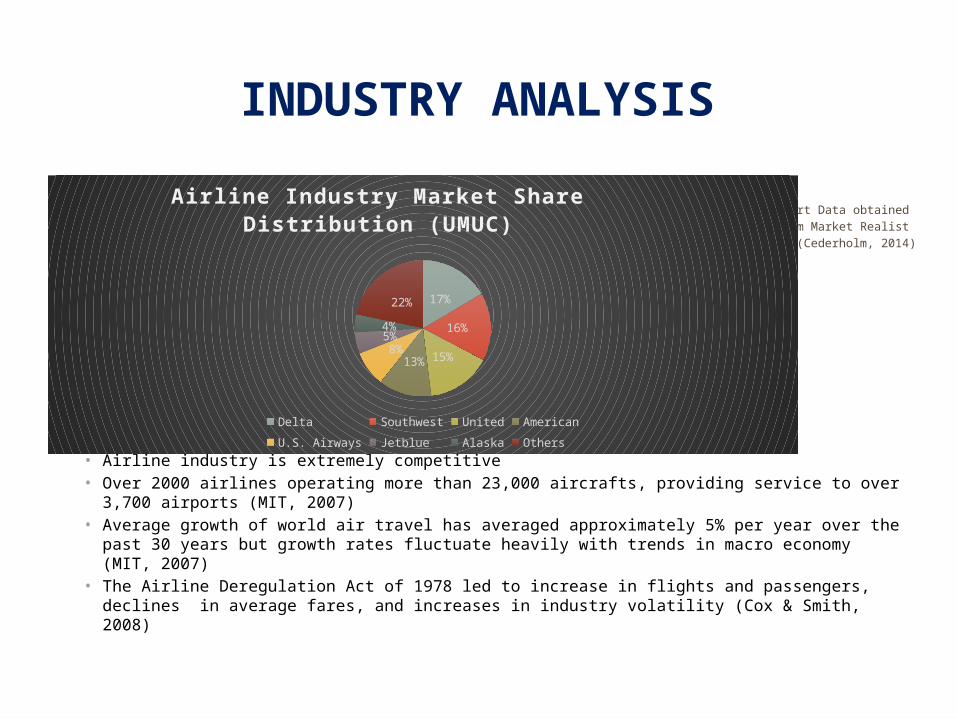
Chart Data obtained from Market Realist
(Cederholm, 2014)
• Airline industry is extremely competitive • Over 2000 airlines operating more than 23,000 aircrafts, providing service to over 3,700 airports (MIT, 2007)• Average growth of world air travel has averaged approximately 5% per year over the past 30 years but
growth rates fluctuate heavily with trends in macro economy (MIT, 2007)• The Airline Deregulation Act of 1978 led to increase in flights and passengers, declines in average fares, and
increases in industry volatility (Cox & Smith, 2008)
17%
16%
15%13%8%
5%4%
22%
Airline Industry Market Share Distribution (UMUC)
Delta Southwest United AmericanU.S. Airways Jetblue Alaska Others
COMPETITIVE ANALYSIS
• Primary competitors: American Airlines, Delta Air Lines, United Airlines, and JetBlue Airways (Hoovers, 2014)
• Competitive Forces: • Competitive Rivalry.
• As Prof. Michael Porter made famous in his five forces model, the airline industry faces extremely intense rivalry (Porter, 2008).
• Difficult for any airline to differentiate on a feature and charge a high price at any scale• Bargaining Power of Suppliers:
• High: Airbus, Boeing, GE have higher profits than airlines, airport gates have high leverage, and high clout of pilots and unionized labor
• Low in that fuel market is globally setting price, some suppliers’ only customers are airlines so they have low leverage
• Bargaining Power of Customers: • High as customers are price sensitive and face low switching costs; difficult to differentiate on more than cost at scale
• Threat of New Entrants: • Seems low due to large start-up costs, regulatory costs,• However it’s higher than before airline deregulation in ‘78 and varies depending on financing availability
• Threat of Substitutes: • Depends on fuel prices and time costs of security and regulation• If cost and/or time to drive, take train etc. is comparable than this will be high, if not it’s low,
FINANCIAL ANALYSIS
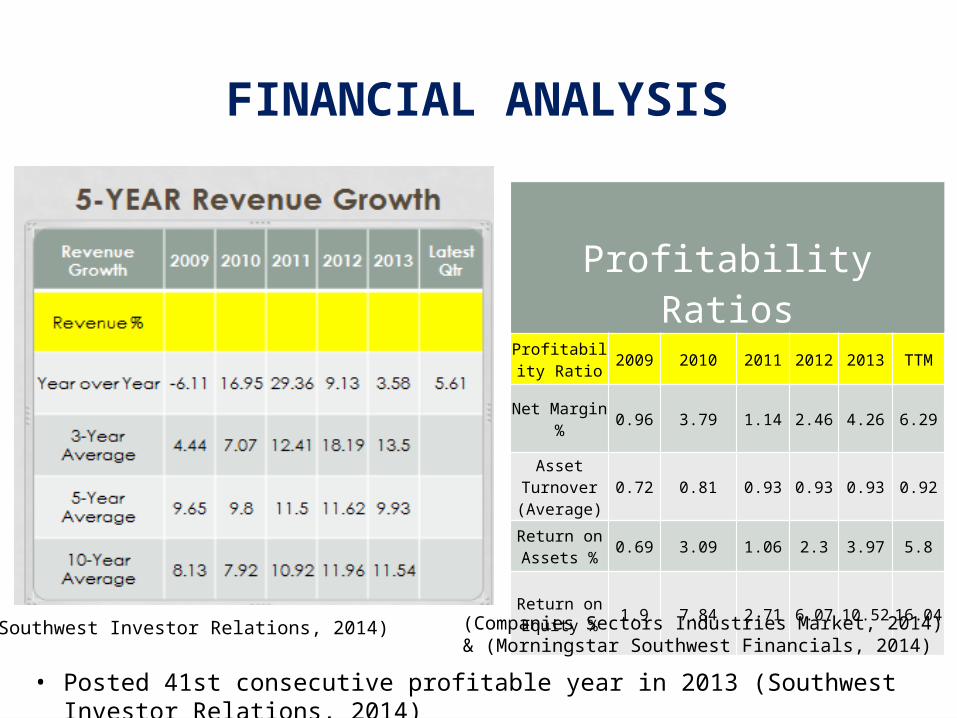
Profitability RatiosProfitability
Ratio 2009 2010 2011 2012 2013 TTM
Net Margin % 0.96 3.79 1.14 2.46 4.26 6.29
Asset Turnover (Average)
0.72 0.81 0.93 0.93 0.93 0.92
Return on Assets % 0.69 3.09 1.06 2.3 3.97 5.8
Return on Equity % 1.9 7.84 2.71 6.07 10.52 16.04
• Posted 41st consecutive profitable year in 2013 (Southwest Investor Relations, 2014)
(Southwest Investor Relations, 2014) (Companies Sectors Industries Market, 2014) & (Morningstar Southwest Financials, 2014)
FINANCIAL ANALYSIS (CONTINUED)
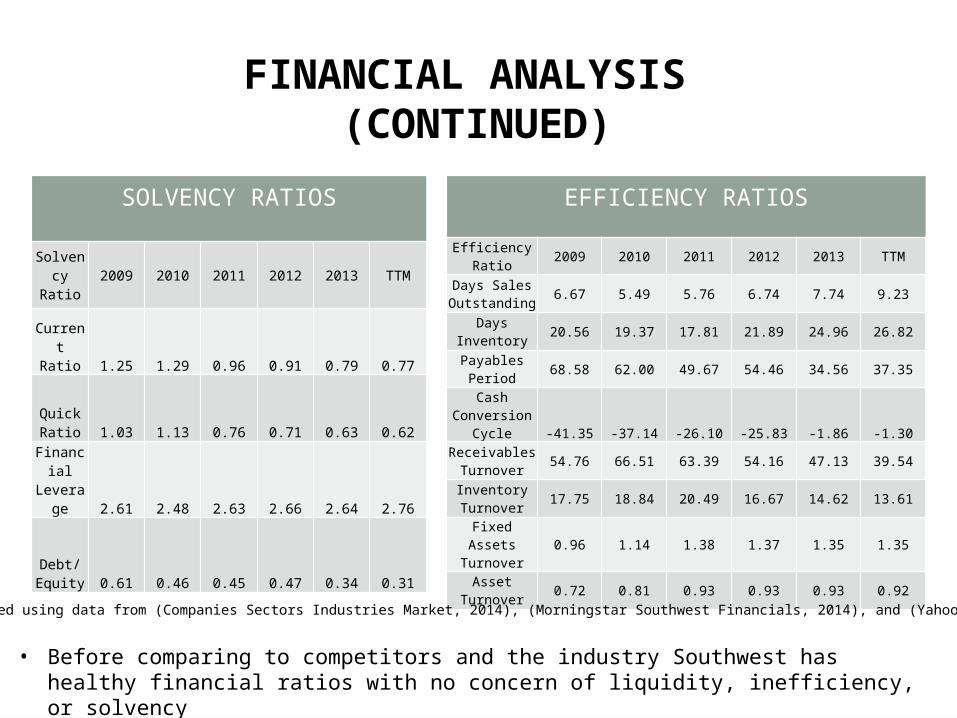
SOLVENCY RATIOS
Solvency Ratio 2009 2010 2011 2012 2013 TTM
Current Ratio 1.25 1.29 0.96 0.91 0.79 0.77
Quick Ratio 1.03 1.13 0.76 0.71 0.63 0.62
Financial Leverage 2.61 2.48 2.63 2.66 2.64 2.76
Debt/Equity 0.61 0.46 0.45 0.47 0.34 0.31
EFFICIENCY RATIOS
Efficiency Ratio 2009 2010 2011 2012 2013 TTM
Days Sales Outstanding 6.67 5.49 5.76 6.74 7.74 9.23
Days Inventory 20.56 19.37 17.81 21.89 24.96 26.82
Payables Period 68.58 62.00 49.67 54.46 34.56 37.35
Cash Conversion
Cycle -41.35 -37.14 -26.10 -25.83 -1.86 -1.30Receivables
Turnover 54.76 66.51 63.39 54.16 47.13 39.54
Inventory Turnover 17.75 18.84 20.49 16.67 14.62 13.61
Fixed Assets Turnover 0.96 1.14 1.38 1.37 1.35 1.35
Asset Turnover 0.72 0.81 0.93 0.93 0.93 0.92
Tables created using data from (Companies Sectors Industries Market, 2014), (Morningstar Southwest Financials, 2014), and (Yahoo! Finance, 2014)
• Before comparing to competitors and the industry Southwest has healthy financial ratios with no concern of liquidity, inefficiency, or solvency
FINANCIAL ANALYSIS (CONTINUED)
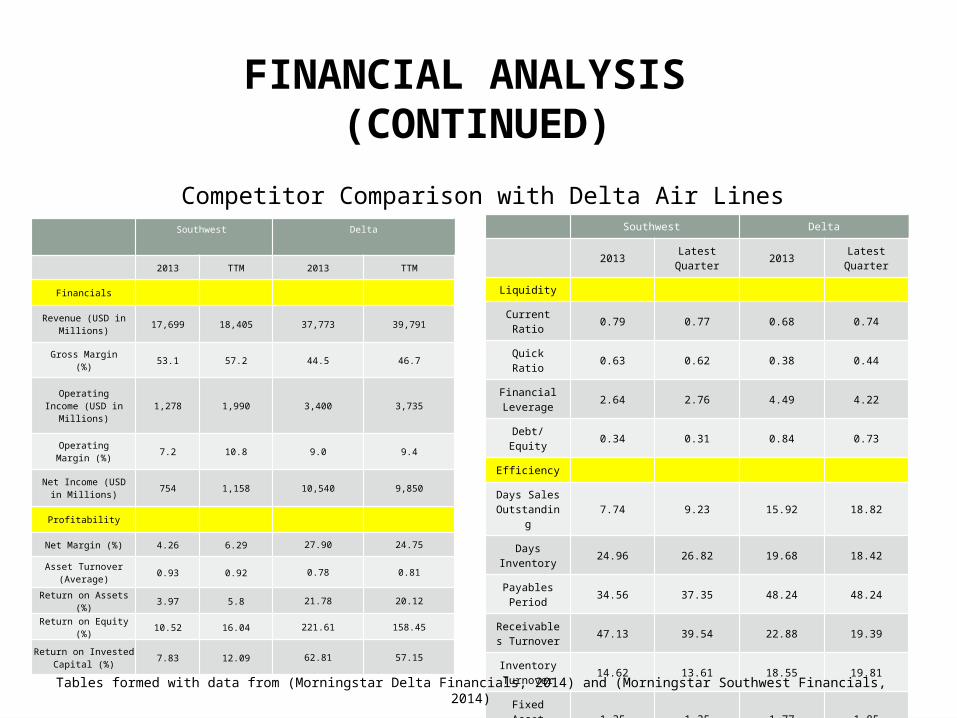
Southwest Delta
2013 TTM 2013 TTM
Financials
Revenue (USD in Millions) 17,699 18,405 37,773 39,791
Gross Margin (%) 53.1 57.2 44.5 46.7
Operating Income (USD in Millions) 1,278 1,990 3,400 3,735
Operating Margin (%) 7.2 10.8 9.0 9.4
Net Income (USD in Millions) 754 1,158 10,540 9,850
Profitability
Net Margin (%) 4.26 6.29 27.90 24.75
Asset Turnover (Average) 0.93 0.92 0.78 0.81
Return on Assets (%) 3.97 5.8 21.78 20.12
Return on Equity (%) 10.52 16.04 221.61 158.45
Return on Invested Capital (%) 7.83 12.09 62.81 57.15
Southwest Delta
2013 Latest Quarter 2013 Latest Quarter
Liquidity
Current Ratio 0.79 0.77 0.68 0.74
Quick Ratio 0.63 0.62 0.38 0.44
Financial Leverage 2.64 2.76 4.49 4.22
Debt/Equity 0.34 0.31 0.84 0.73
Efficiency
Days Sales Outstanding 7.74 9.23 15.92 18.82
Days Inventory 24.96 26.82 19.68 18.42
Payables Period 34.56 37.35 48.24 48.24
Receivables Turnover 47.13 39.54 22.88 19.39
Inventory Turnover 14.62 13.61 18.55 19.81
Fixed Asset Turnover 1.35 1.35 1.77 1.85
Asset Turnover 0.93 0.92 0.78 .081
Competitor Comparison with Delta Air Lines
Tables formed with data from (Morningstar Delta Financials, 2014) and (Morningstar Southwest Financials, 2014)
FINANCIAL ANALYSIS (CONTINUED)
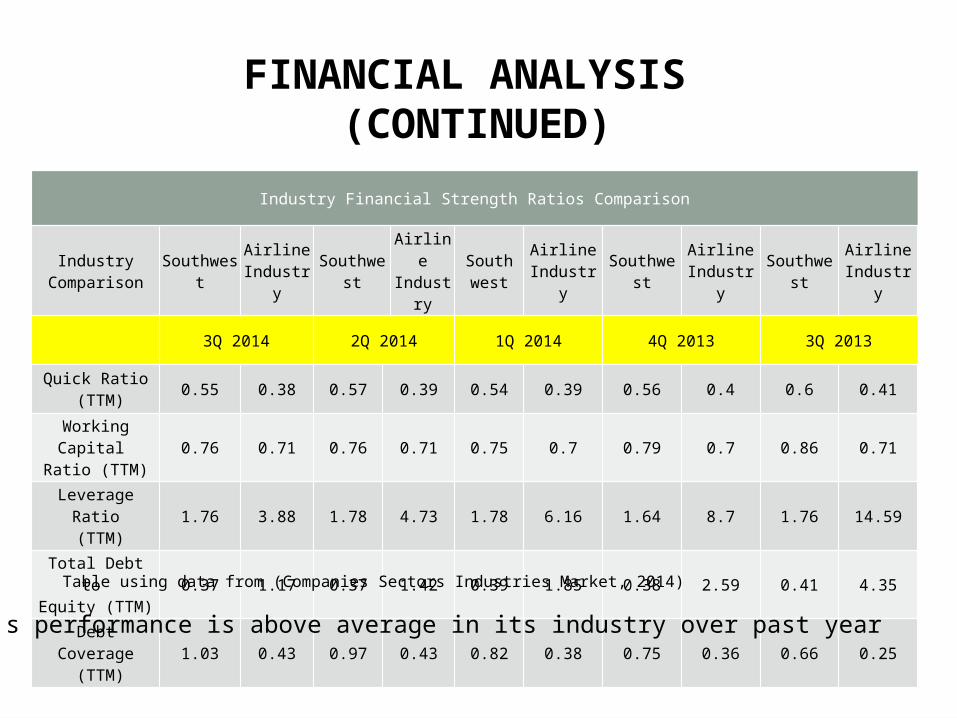
Industry Financial Strength Ratios Comparison
IndustryComparison Southwest Airline
Industry Southwest Airline Industry
Southwest
Airline Industry Southwest Airline
Industry Southwest Airline Industry
3Q 2014 2Q 2014 1Q 2014 4Q 2013 3Q 2013
Quick Ratio (TTM) 0.55 0.38 0.57 0.39 0.54 0.39 0.56 0.4 0.6 0.41
Working Capital Ratio (TTM) 0.76 0.71 0.76 0.71 0.75 0.7 0.79 0.7 0.86 0.71
Leverage Ratio (TTM) 1.76 3.88 1.78 4.73 1.78 6.16 1.64 8.7 1.76 14.59
Total Debt to Equity (TTM) 0.37 1.17 0.37 1.42 0.39 1.85 0.38 2.59 0.41 4.35
Debt Coverage (TTM) 1.03 0.43 0.97 0.43 0.82 0.38 0.75 0.36 0.66 0.25
Table using data from (Companies Sectors Industries Market, 2014)
•Southwest’s performance is above average in its industry over past year
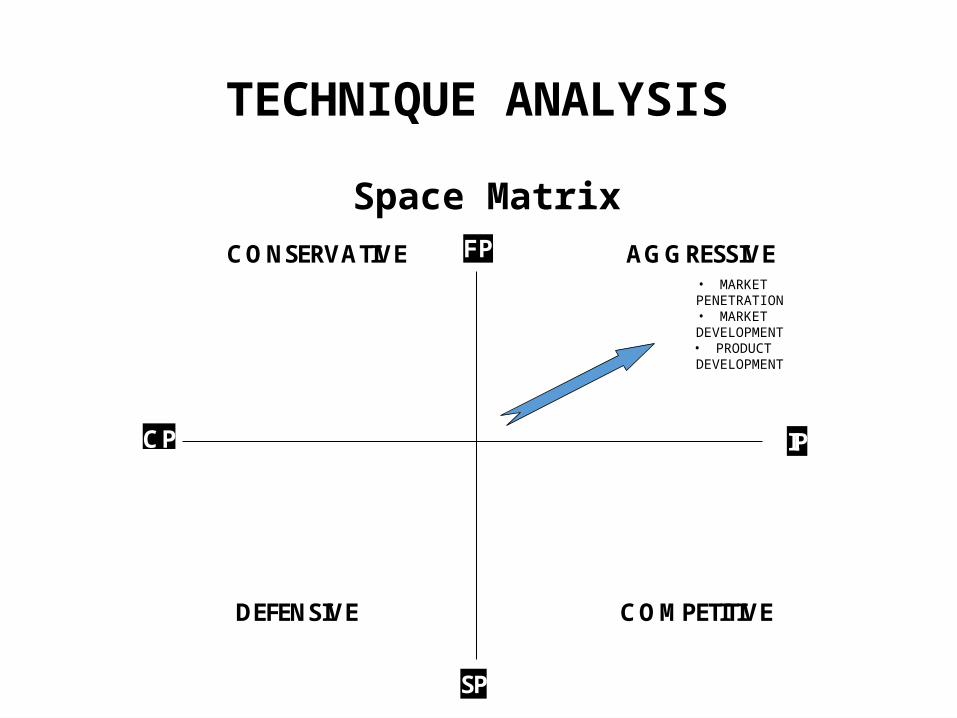
TECHNIQUE ANALYSIS
FP
SP
CP IP
CONSERVATIVE AGGRESSIVE
DEFENSIVE COMPETITIVE
• MARKET PENETRATION• MARKET DEVELOPMENT• PRODUCT DEVELOPMENT
Space Matrix
TECHNIQUE ANALYSIS (CONTINUED)
• Using SPACE Matrix, Southwest Airlines is a very aggressive company (Simister, 2011)
• Southwest should continue to aggressively grow the business,• Forces competition to succeed or cede ground
• Biggest organizational threat is complacency in this highly-competitive industry
• Southwest should continue to invest in innovation to sustain and build its current competitive advantage.
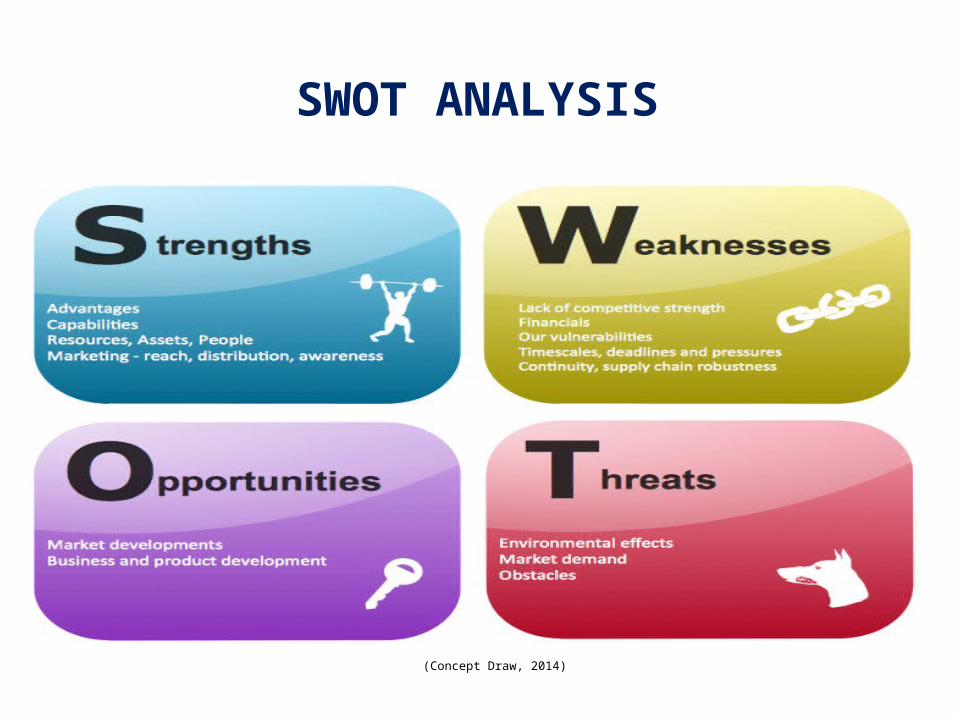
SWOT ANALYSIS
(Concept Draw, 2014)
SWOT ANALYSIS (CONTINUED)
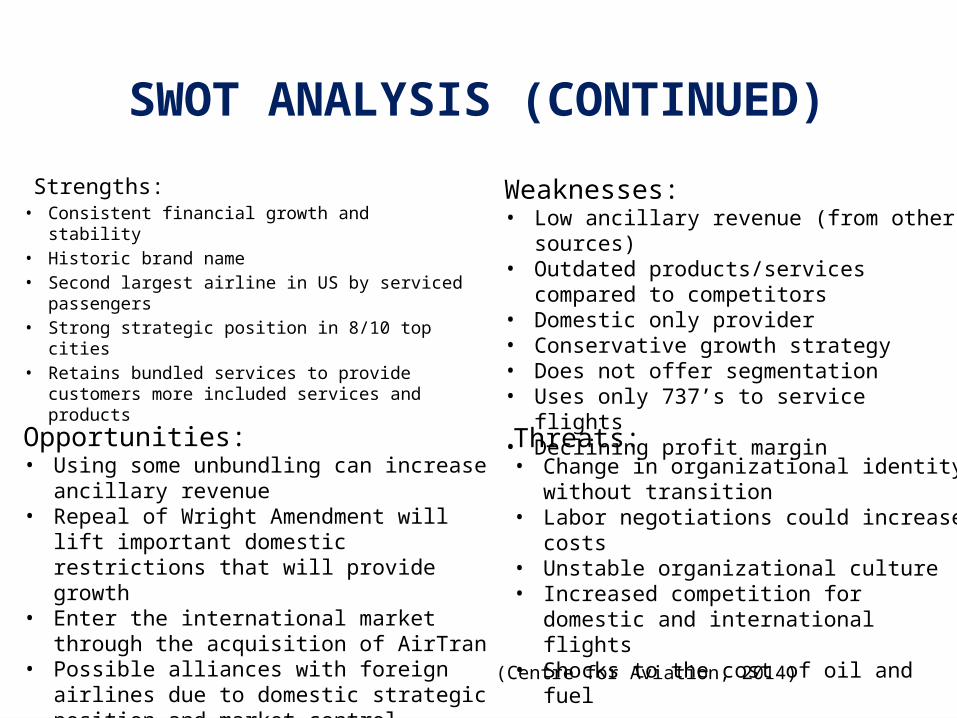
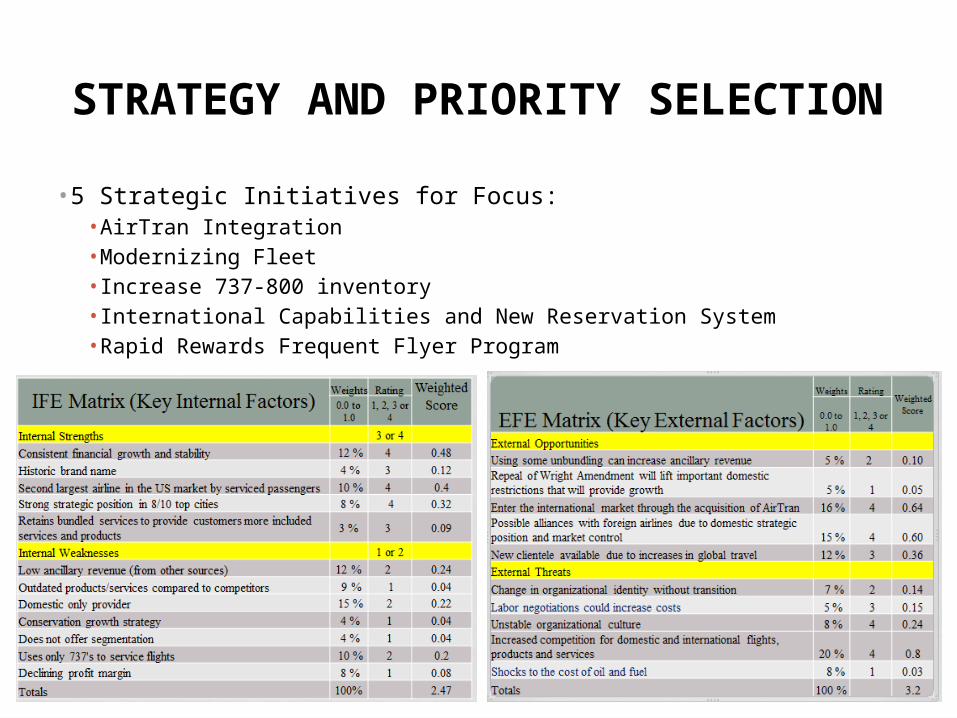
Strengths:• Consistent financial growth and stability• Historic brand name• Second largest airline in US by serviced
passengers• Strong strategic position in 8/10 top cities• Retains bundled services to provide customers
more included services and products
Weaknesses:• Low ancillary revenue (from other sources)• Outdated products/services compared to
competitors• Domestic only provider• Conservative growth strategy• Does not offer segmentation• Uses only 737’s to service flights• Declining profit margin
Opportunities:• Using some unbundling can increase ancillary
revenue• Repeal of Wright Amendment will lift important
domestic restrictions that will provide growth• Enter the international market through the
acquisition of AirTran• Possible alliances with foreign airlines due to
domestic strategic position and market control• New clientele available due to increases in global
travel
Threats:• Change in organizational identity without
transition• Labor negotiations could increase costs• Unstable organizational culture• Increased competition for domestic and
international flights• Shocks to the cost of oil and fuel
(Centre for Aviation, 2014)
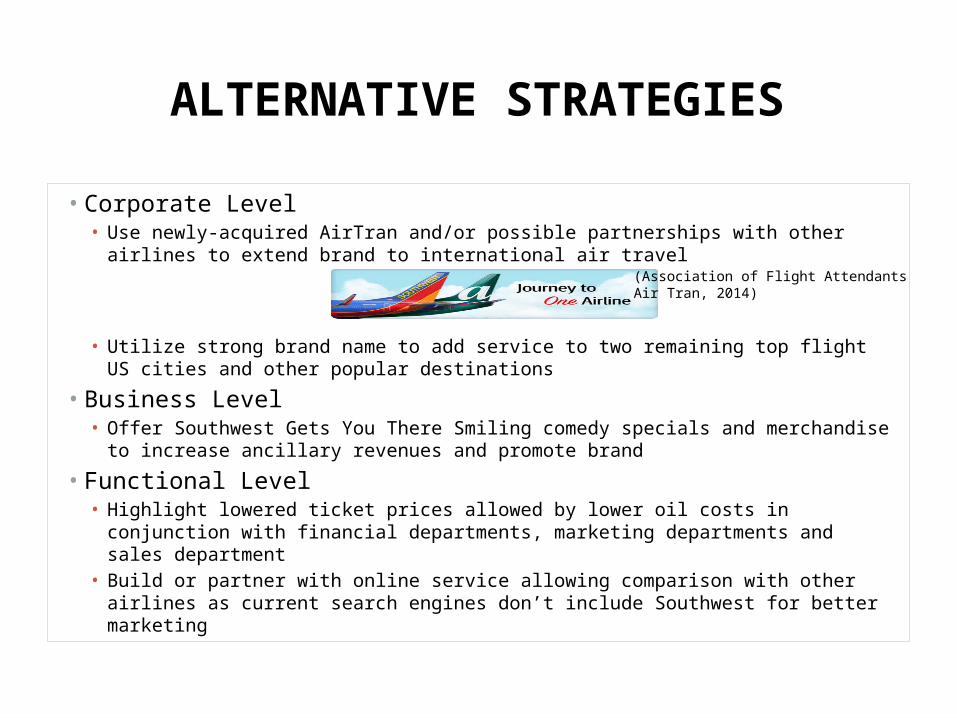
ALTERNATIVE STRATEGIES
• Corporate Level• Use newly-acquired AirTran and/or possible partnerships with other airlines to extend brand to
international air travel
• Utilize strong brand name to add service to two remaining top flight US cities and other popular destinations
• Business Level• Offer Southwest Gets You There Smiling comedy specials and merchandise to increase
ancillary revenues and promote brand
• Functional Level• Highlight lowered ticket prices allowed by lower oil costs in conjunction with financial
departments, marketing departments and sales department• Build or partner with online service allowing comparison with other airlines as current search
engines don’t include Southwest for better marketing
(Association of Flight Attendants Air Tran, 2014)
STRATEGY AND PRIORITY SELECTION
•5 Strategic Initiatives for Focus:•AirTran Integration•Modernizing Fleet •Increase 737-800 inventory•International Capabilities and New Reservation System•Rapid Rewards Frequent Flyer Program
STRATEGY AND PRIORITY SELECTION (CONTINUED)
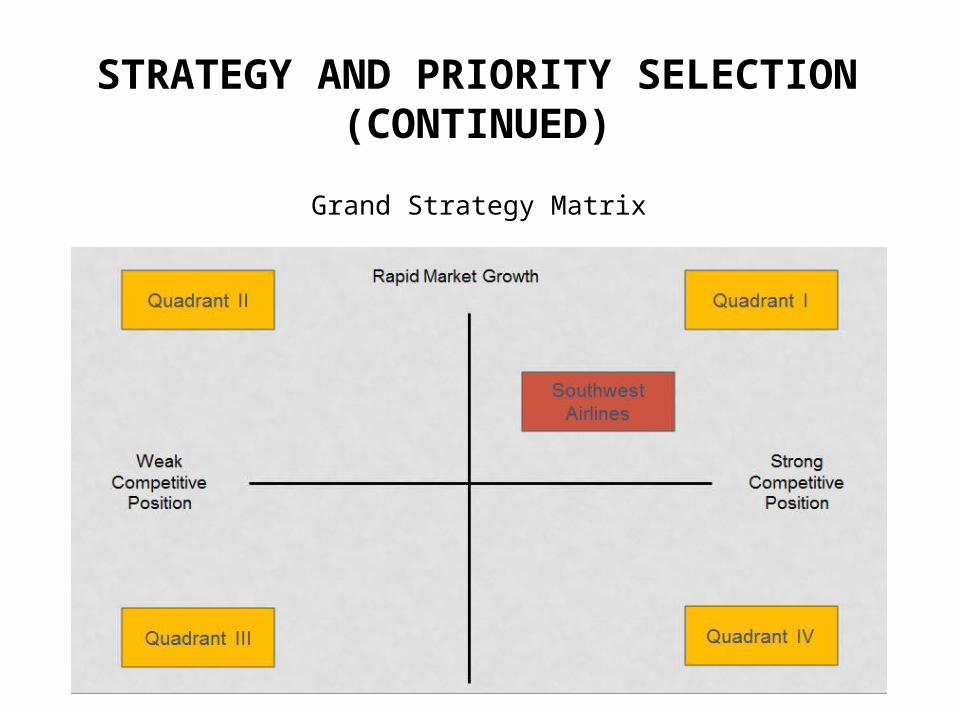
Grand Strategy Matrix
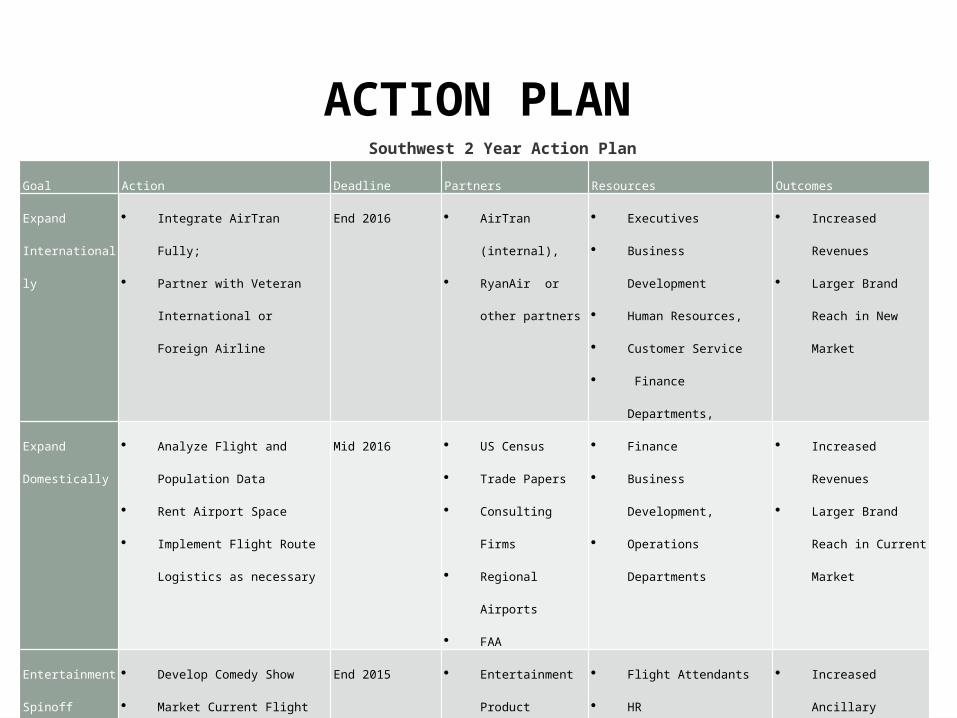
ACTION PLANGoal Action Deadline Partners Resources Outcomes
Expand
Internationally
Integrate AirTran Fully;
Partner with Veteran International
or Foreign Airline
End 2016 AirTran (internal),
RyanAir or other
partners
Executives
Business Development
Human Resources,
Customer Service
Finance Departments,
Increased Revenues
Larger Brand Reach in
New Market
Expand
Domestically
Analyze Flight and Population
Data
Rent Airport Space
Implement Flight Route Logistics
as necessary
Mid 2016 US Census
Trade Papers
Consulting Firms
Regional Airports
FAA
Finance
Business Development,
Operations Departments
Increased Revenues
Larger Brand Reach in
Current Market
Entertainment
Spinoff
Develop Comedy Show
Market Current Flight Attendants
Comedic Acts
End 2015 Entertainment
Product Manager
Comedic Talent,
Comedy Central,
HBO, YouTube
Merchandising Firms
Flight Attendants
HR
IT
Executives
Increased Ancillary
Revenues
Larger Brand in New
Market
Southwest 2 Year Action Plan
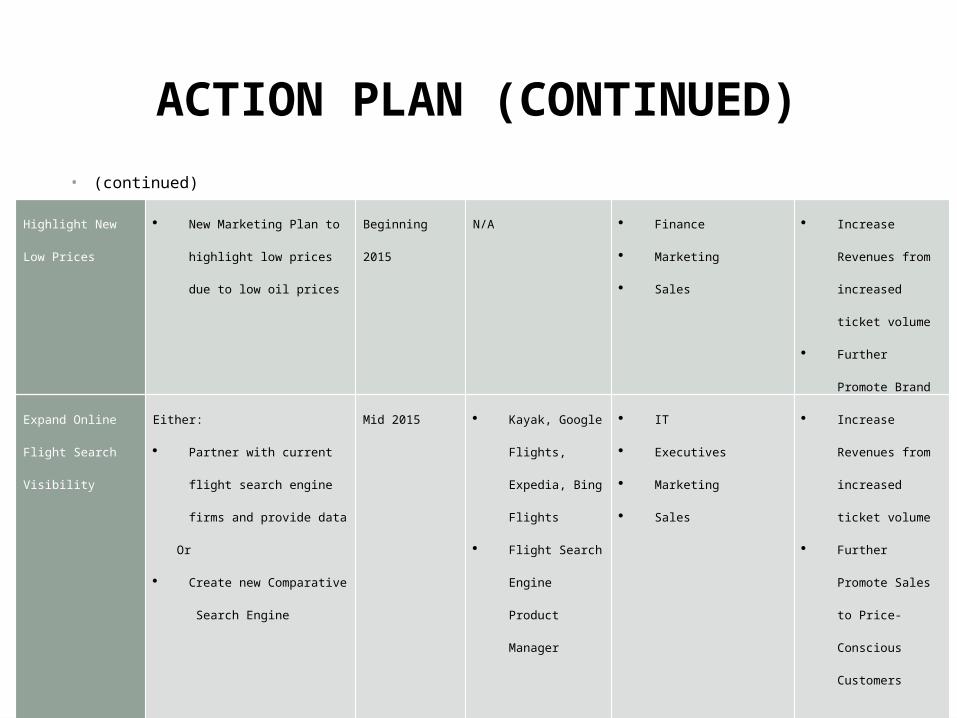
ACTION PLAN (CONTINUED)• (continued)
Highlight New Low
Prices
New Marketing Plan to highlight
low prices due to low oil prices
Beginning 2015 N/A Finance
Marketing
Sales
Increase Revenues
from increased ticket
volume
Further Promote
Brand
Expand Online Flight
Search Visibility
Either:
Partner with current flight search
engine firms and provide data
Or
Create new Comparative Search
Engine
Mid 2015 Kayak, Google
Flights, Expedia,
Bing Flights
Flight Search
Engine Product
Manager
IT
Executives
Marketing
Sales
Increase Revenues
from increased ticket
volume
Further Promote
Sales to Price-
Conscious Customers
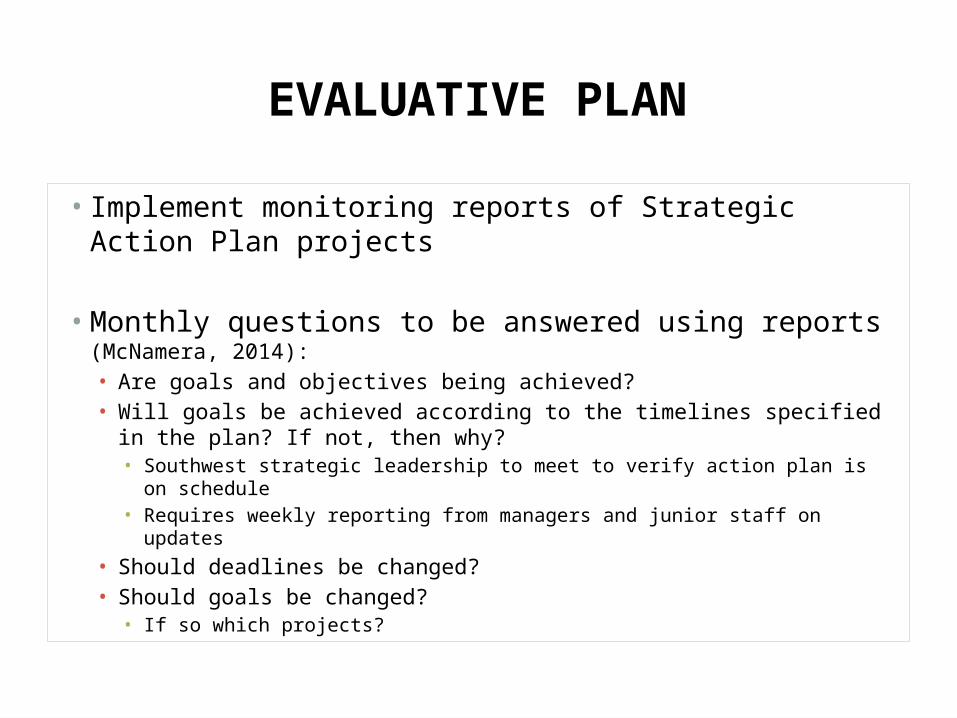
EVALUATIVE PLAN
• Implement monitoring reports of Strategic Action Plan projects
• Monthly questions to be answered using reports (McNamera, 2014):• Are goals and objectives being achieved? • Will goals be achieved according to the timelines specified in the plan? If not,
then why?• Southwest strategic leadership to meet to verify action plan is on schedule• Requires weekly reporting from managers and junior staff on updates
• Should deadlines be changed?• Should goals be changed?• If so which projects?
REFERENCES
• Association of Flight Attendants Air Tran (2014). AFAAirTran. Retrieved from http://www.afaairtran.com/ on 12/5/2014• Cederholm, T. (2014). Market Realist. Performance highlights: The top 6 US airlines in September. Retrieved from http://marketrealist.com/2014/10/performance-
highlights-top-6-us-airlines-september/ on 12/6/2014• Centre for Aviation. (2014). Southwest Airlines SWOT: Financial strength is mainstay, but cost and culture challenges loom large. Retrieved from
http://centreforaviation.com/analysis/southwest-airlines-swot-financial-strength-is-mainstay-but-cost-and-culture-challenges-loom-large-187714 on 12/2/2014• Companies Sectors Industries Market. (2014). Airline Industry Financial Strength Information & Trends. Retrieved from
http://csimarket.com/Industry/industry_Financial_Strength_Ratios.php?ind=1102 on 12/3/2014• Concept Draw. (2014). Examples: SWOT Diagram. Retreived from http://www.conceptdraw.com/examples/swot-diagram on 12/3/2014• Cox, B., & Smith. F. (2008). Library of Economics and Liberty. Airline Deregulation. Retrieved from http://www.econlib.org/library/Enc/AirlineDeregulation.html on
12/6/2014• Funding Universe. (2013). Southwest Airlines Co. History . Retrieved from http://www.fundinguniverse.com/company-histories/southwest-airlines-co-history/ on
12/6/2014• Hoovers. (2014). Southwest Airlines Co. Competition. Retrieved from
http://www.hoovers.com/company-information/cs/competition.Southwest_Airlines_Co.0e6ec4453563eb4d.html on 12/6/2014• McNamera, C. (2014). Free Management Library. Retrieved from http://managementhelp.org/strategicplanning/implementing-plan.htm on 12/7/2014• MIT. (2007). MIT Global Airline Industry Program. Airline Industry Overview. Retrieved from http://web.mit.edu/airlines/analysis/analysis_airline_industry.html on
12/6/2014• Morningstar Delta Financials. (2014). Southwest Airlines Co. Retrieved from http://financials.morningstar.com/ratios/r.html?t=DAL on 12/3/2014• Morningstar Southwest Financials. (2014). Southwest Airlines Co. Retrieved from http://financials.morningstar.com/ratios/r.html?t=LUV on 12/3/2014• Porter, M. (2008). Harvard Business Review. The Five Competitive Forces That Shape Strategy. Retrieved from https://www.youtube.com/watch?v=mYF2_FBCvXw on
12/6/2014• Simister, P. (2011). Differentiate Your Business. Financial Strength In The SPACE Matrix. Retrieved from http://www.differentiateyourbusiness.co.uk/financial-strength-
in-the-space-matrix on 12/6/2014• Southwest About .(2014). Southwest. Retrieved from https://www.southwest.com/html/about-southwest/ on 12/3/2014• Southwest Culture .(2014). Southwest.com. https://www.southwest.com/html/about-southwest/careers/culture.html/ on 12/5/2014• Southwest Investor Relations. (2014) Southwest Airlines Reports Record Fourth Quarter And Full Year Profit; 41st Consecutive Year Of Profitability. Retrieved from
http://southwest.investorroom.com/index.php?s=43&item=1859 on 12/6/2014• Yahoo! Finance (2014). Southwest Airlines Co. (LUV). Retrieved from http://finance.yahoo.com/q?uhb=uh3_finance_vert&fr=&type=2button&s=luv on 12/3/2014