Embed Size (px)
Citation preview
8/7/2019 group 3 accounts project
http://slidepdf.com/reader/full/group-3-accounts-project 1/15
Accounting for decision making project
Submitted to: Dr. Anupam Mehta
Group no 3
Group members:-
Alia Amreen
Kalpesh chopra
Niranjan Balaji
Ritika singh
Subhag Jain
INTRODUCTION
8/7/2019 group 3 accounts project
http://slidepdf.com/reader/full/group-3-accounts-project 2/15
Cement is a basic ingredient for the construction industry. Cement is made out of limestone, shell, clay mined out of a quarry close to the plant. The raw material iscrushed, and then heated at temperature in excess of 1000 ºC in rotating kiln to become clinker. Clinker is then mixed with gypsum and ground to a fine powder
to produce final grade of cement. The technology is a continuous process and ishighly energy intensive.
Cost of cement is 29% energy, 27% raw materials, 32% labour and 12%depreciation.
The weight/to price ratio make transportation cost very high. The competitiveradius of a typical cement plant for most common types of cement extends nomore than 300 kilometers. However, cement can be shipped economically by seaand inland waterway over great distances, extending greatly the competitiveradius of cement plants with access to waterborne shipping lanes. Thus, the
location of a cement plant and the cost to transport the cement it producesthrough its distribution terminals bear significantly on the plant¶s competitive position and the prices it may charge. The minimum efficient size for a cement plant is around 1 million ton a year.
As a consequence of a relatively low minimum efficient plant and transportationcosts cement production is highly fragmented. It is estimated that there arearound 1500 integrated cement production plants in the world. Although theindustry has seen the emergence of strong global players such a Lafarge or CEMEX, the share of the four largest firms account only for 23% of the overalldemand.
Cement is distributed in bags or is delivered to construction sites through readymix lorries.
The major segments of the industries are:
Aggregates: quarries and crushing minerals to be mixed with cement tomake concrete Cement production Ready Mix: distribution of ready to use concrete
Demand
World cement demand was 2,283 million Tons in 2005, with China accounting for 1,064 MT (47% of total).The expected demand for 2010 is estimated at 2836 MT.China will increase its demand by 250 millions tons during the period, anincrease higher than the total yearly European demand.Demand for Cement in Million
8/7/2019 group 3 accounts project
http://slidepdf.com/reader/full/group-3-accounts-project 3/15
UAE Cement Industry:
Dating back to the mid-1970s, the cement industry is one of the oldest manufacturing industriesin the UAE. The first factory, Al Ittihad Cement Company of Ras a l-Khaimah, startedcommercial production in 1975.
This was followed by the construction of several other factories in Al Ain, Sharjah, Dubai,Fujairah, Ajman and Umm al-Qaiwain. The total number of cement factories throughout thecountry had reached nine by the end of 1998. Eight of these produce Portland cement, and onefactory in Ras al-Khaimah manufactures white cement. The total capacity of the eight Portlandcement factories is estimated at 9 million tones.
UAE Cement Factories produce the following Cement Types:
WHY ANALYSE UAE CEMENT COMPANIES ?
The fundamental driver for the UAE cement sector is the growth of theConstruction industry. Amidst the liquidity crisis and global recession woes weanticipate construction growth rates to slow down from 20% in 2008 to 15%and 13% in 2009 and 2010 respectively.
We have an overall negative view on the cement sector due the slowdown of the construction industry, coupled with extensive expansion of clinker andcement capacity in the market. We expect an oversupply of cement in the UAEat the end of 2010/beginning of 2011.
A positive cash position and a strong exposure to equities is a sector wide trendamongst the cement companies in the UAE. In the current climate weanticipate exposed companies to write down significant investment losses onthe back of spiralling markets in the region over the last three months. We seethis as a risk in terms of transparency and net profit volatility for the investor.
Within our sector, we feel that the share prices of RAKCC and,but still the upsides are limited at 2 ± 3% to our 12 monthtarget prices. RAKCC are trading at an estimated 2009 P/E of 6.6, compared to our peer group average of 15.6. We initiatecoverage with a Market Perform rating on these two stocks.
8/7/2019 group 3 accounts project
http://slidepdf.com/reader/full/group-3-accounts-project 4/15
We have an overall negative view on the UAE cement sector due to
the following trends:-
Significant exposure to equities
High production costs coupled with a Government imposed price cap hassqueezed profit margins
Oversupply at the end of 2010 ± a slowdown in construction growth andexpansion plans of cement manufacturers
Clinker shortages limit the amount of cement produced, despite increasesin cement grinding capacity
Volatile net profits due to equity exposure
A positive cash position and a strong exposure to equities is a sector wide trendamongst the cement companies in the UAE. In the current climate we anticipatethese companies to write down significant investment losses on the back of spiralling markets in the region over the last three months. We see this as asignificant risk, not only in terms of the profit and loss, but in terms of transparency and volatility for the investor.
A lose ± lose situation
Unreliable fuel supply and rising costs of cement production have plagued thecement manufacturers in last two years. Coal and oil prices reached an all time highof $143 per tonne and $147 per Bbl in July 08. To compound the issue, theincrease in production costs can not been passed onto the consumer due toGovernment imposed price caps, consequently gross profit margins have beensqueezed from a sector average of 45% in 2006 to 30% in 2008. However, we dosee some relief as fuel prices begin to fall and the price remains, in the short term,at AED 360 per tonne.
The cement companies have responded by installing multi fuel burners so that production is not solely reliant on the supply and the cost of one fuel. Cement
8/7/2019 group 3 accounts project
http://slidepdf.com/reader/full/group-3-accounts-project 5/15
manufacturers that have not entered into fixed price fuel contracts in the first half of the year should begin to see margins increase in 4Q08. Multi fuel systemsshould also improve margins as the cement companies become less reliant on theavailability and price of natural gas and diesel.
Oversupply estimated at the end of 2010
In our opinion, clinker is the limiting factor of cement production. The UAE is anet importer of clinker and the majority of expansion plans in place are for grindingfacilities only. Cement consumption is primarily driven by the size and growth of the construction industry and based on our consumption estimates and expansion plans of cement and clinker producers in the UAE, we envisage the production of cement to surpass consumption at the end of 2010.
Objective:-
The objective of this case is to determine foremost, if the cement industry in UAE is healthy enough to bear
the current turmoil it is going through & whether the balance sheet of the company is strong enough tosurvive the recession by the calculations of various financial ratios & statements. This will help us knowwhether the company has the ability to earn profit and pay back the debts the companies have incurred. Itwill give us a view of the industry during recession.
8/7/2019 group 3 accounts project
http://slidepdf.com/reader/full/group-3-accounts-project 6/15
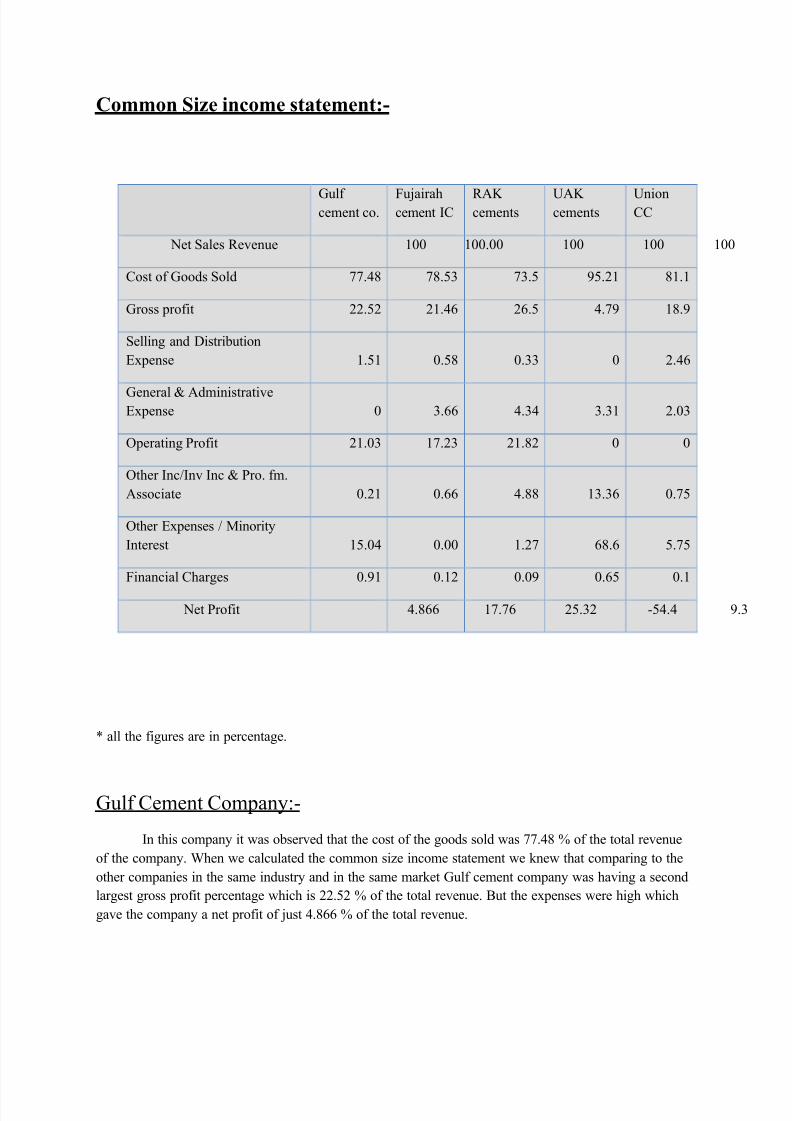
Common Size income statement:-
* all the figures are in percentage.
Gulf Cement Company:-
In this company it was observed that the cost of the goods sold was 77.48 % of the total revenue
of the company. When we calculated the common size income statement we knew that comparing to the
other companies in the same industry and in the same market Gulf cement company was having a second
largest gross profit percentage which is 22.52 % of the total revenue. But the expenses were high which
gave the company a net profit of just 4.866 % of the total revenue.
Gulf cement co.
Fujairahcement IC
RAK cements
UAK cements
UnionCC
Net Sales Revenue 100 100.00 100 100 100
Cost of Goods Sold 77.48 78.53 73.5 95.21 81.1
Gross profit 22.52 21.46 26.5 4.79 18.9
Selling and Distribution
Expense 1.51 0.58 0.33 0 2.46
General & AdministrativeExpense 0 3.66 4.34 3.31 2.03
Operating Profit 21.03 17.23 21.82 0 0
Other Inc/Inv Inc & Pro. fm.
Associate 0.21 0.66 4.88 13.36 0.75
Other Expenses / Minority
Interest 15.04 0.00 1.27 68.6 5.75
Financial Charges 0.91 0.12 0.09 0.65 0.1
Net Profit 4.866 17.76 25.32 -54.4 9.
8/7/2019 group 3 accounts project
http://slidepdf.com/reader/full/group-3-accounts-project 7/15
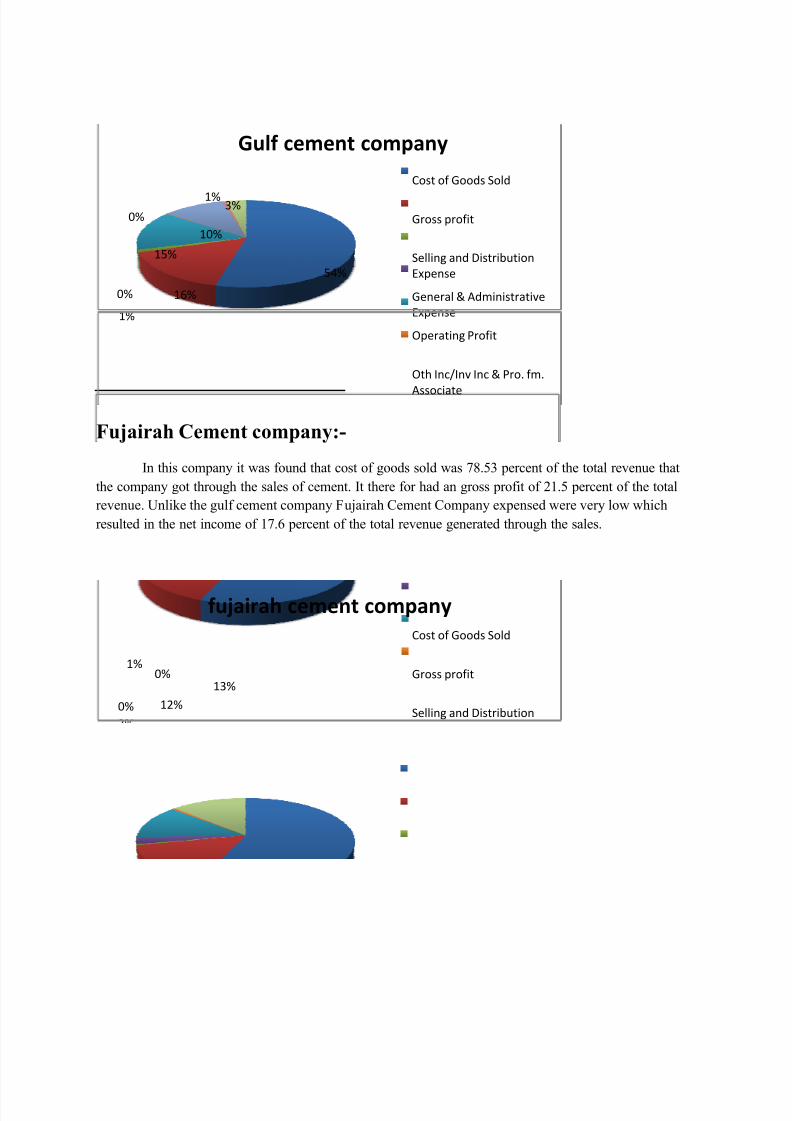
Fujairah Cement company:-
In this company it was found that cost of goods sold was 78.53 percent of the total revenue that
the company got through the sales of cement. It there for had an gross profit of 21.5 percent of the total
revenue. Unlike the gulf cement company Fujairah Cement Company expensed were very low which
resulted in the net income of 17.6 percent of the total revenue generated through the sales.
54%
16%
1%
0%
15%
0%
10%
1% 3%
Gulf cement company
Cost of Goods Sold
Gross profit
Selling and Distribution
Expense
General & Administrative
Expense
Operating Profit
Oth Inc/Inv Inc & Pro. fm.
Associate
56%15%
0%
3%
12%
1%
0%
0%13%
fujairah cement company
Cost of Goods Sold
Gross profit
Selling and Distribution
Expense
General & Administrative
Expense
Operating Profit
Oth Inc/Inv Inc & Pro. fm.
Associate
8/7/2019 group 3 accounts project
http://slidepdf.com/reader/full/group-3-accounts-project 8/15
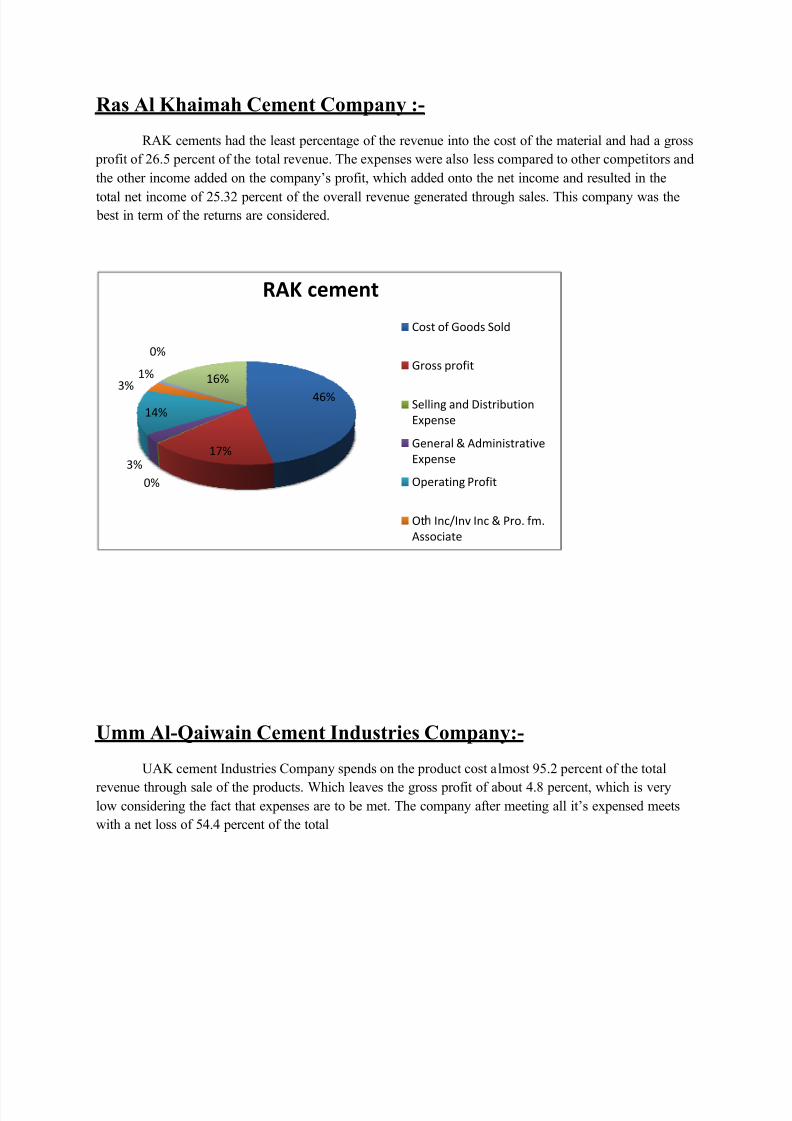
Ras Al Khaimah Cement Company :- RAK cements had the least percentage of the revenue into the cost of the material and had a gross
profit of 26.5 percent of the total revenue. The expenses were also less compared to other competitors and
the other income added on the company¶s profit, which added onto the net income and resulted in the
total net income of 25.32 percent of the overall revenue generated through sales. This company was the best in term of the returns are considered.
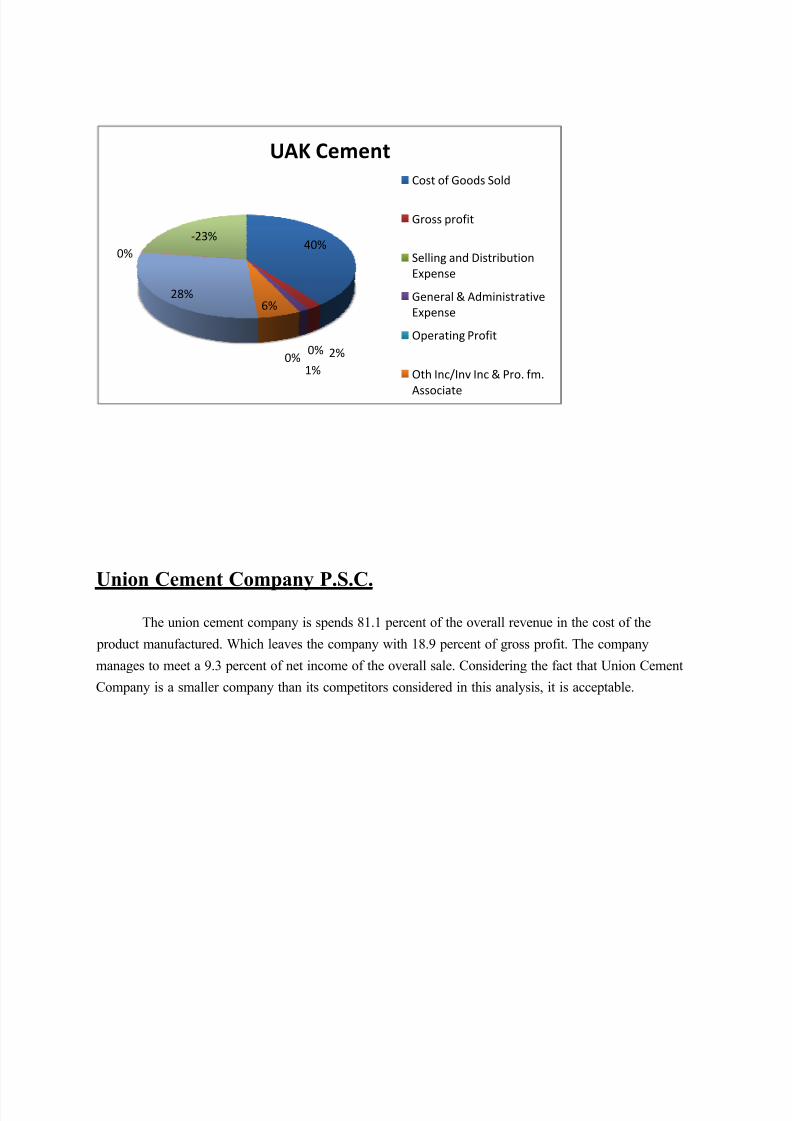
Umm Al-Qaiwain Cement Industries Company:- UAK cement Industries Company spends on the product cost almost 95.2 percent of the total
revenue through sale of the products. Which leaves the gross profit of about 4.8 percent, which is verylow considering the fact that expenses are to be met. The company after meeting all it¶s expensed meets
with a net loss of 54.4 percent of the total
46%
17%
0%
3%
14%
3%1%
0%
16%
RAK cement
Cost of Goods Sold
Gross profit
Selling and Distribution
Expense
General & Administrative
Expense
Operating Profit
Ot
Inc/Inv Inc & Pro. fm.
Associate
8/7/2019 group 3 accounts project
http://slidepdf.com/reader/full/group-3-accounts-project 9/15
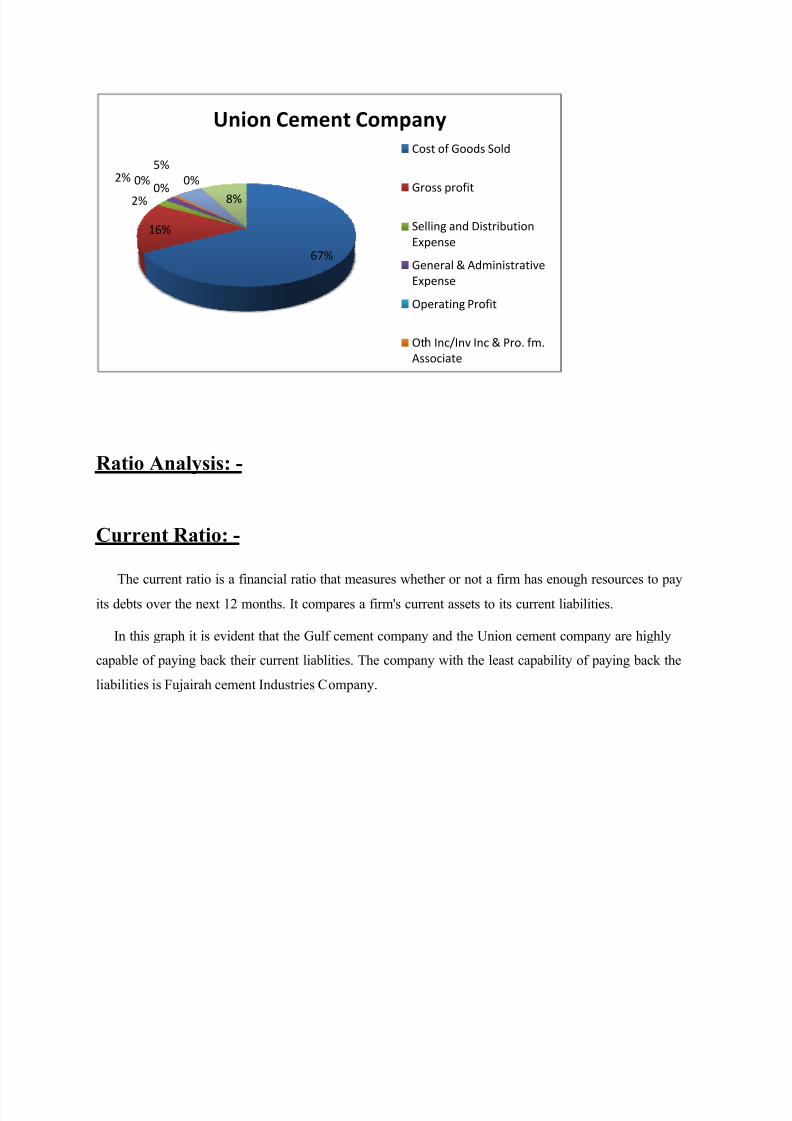
Union Cement Company P.S.C.
The union cement company is spends 81.1 percent of the overall revenue in the cost of the
product manufactured. Which leaves the company with 18.9 percent of gross profit. The company
manages to meet a 9.3 percent of net income of the overall sale. Considering the fact that Union Cement
Company is a smaller company than its competitors considered in this analysis, it is acceptable.
40%
2%0%
1%0%
6%28%
0%
-23%
UAK Cement
Cost of Goods Sold
Gross profit
Selling and Distribution
Expense
General & Administrative
Expense
Operating Profit
Oth Inc/Inv Inc & Pro. fm.
Associate
8/7/2019 group 3 accounts project
http://slidepdf.com/reader/full/group-3-accounts-project 10/15
Ratio Analysis: -
Current Ratio: -
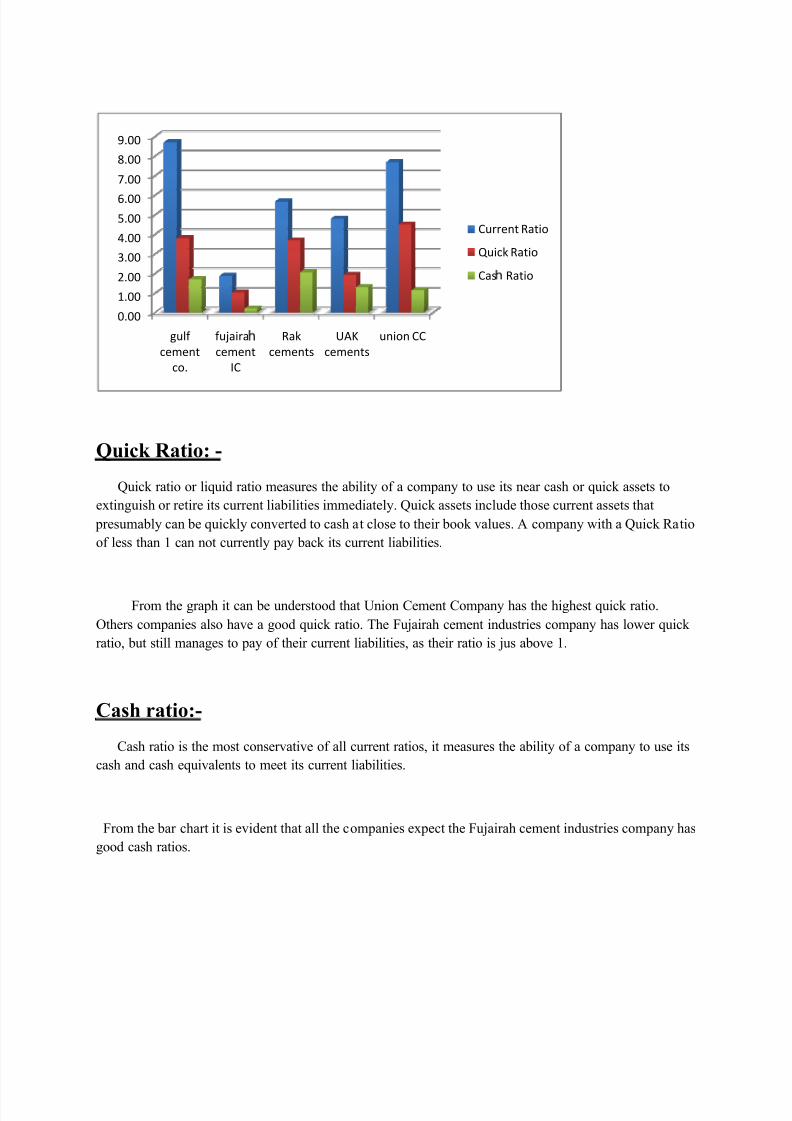
The current ratio is a financial ratio that measures whether or not a firm has enough resources to pay
its debts over the next 12 months. It compares a firm's current assets to its current liabilities.
In this graph it is evident that the Gulf cement company and the Union cement company are highly
capable of paying back their current liablities. The company with the least capability of paying back the
liabilities is Fujairah cement Industries Company.
67%
16%
2%
2% 0%0%
5%
0%
8%
Union Cement Company
Cost of Goods Sold
Gross profit
Selling and Distribution
Expense
General & Administrative
Expense
Operating Profit
Ot ¡ Inc/Inv Inc & Pro. fm.
Associate
8/7/2019 group 3 accounts project
http://slidepdf.com/reader/full/group-3-accounts-project 11/15
Quick Ratio: -
Quick ratio or liquid ratio measures the ability of a company to use its near cash or quick assets to
extinguish or retire its current liabilities immediately. Quick assets include those current assets that
presumably can be quickly converted to cash at close to their book values. A company with a Quick Ratio
of less than 1 can not currently pay back its current liabilities.
From the graph it can be understood that Union Cement Company has the highest quick ratio.
Others companies also have a good quick ratio. The Fujairah cement industries company has lower quick
ratio, but still manages to pay of their current liabilities, as their ratio is jus above 1.
Cash ratio:-
Cash ratio is the most conservative of all current ratios, it measures the ability of a company to use its
cash and cash equivalents to meet its current liabilities.
From the bar chart it is evident that all the companies expect the Fujairah cement industries company has
good cash ratios.
0.00
1.00
2.00
3.00
4.00
5.00
6.00
7.00
8.00
9.00
gulf
cement
co.
fujaira ¢
cement
IC
Rak
cements
UAK
cements
union CC
Current Ratio
Quick Ratio
Cas ¢ Ratio
8/7/2019 group 3 accounts project
http://slidepdf.com/reader/full/group-3-accounts-project 12/15
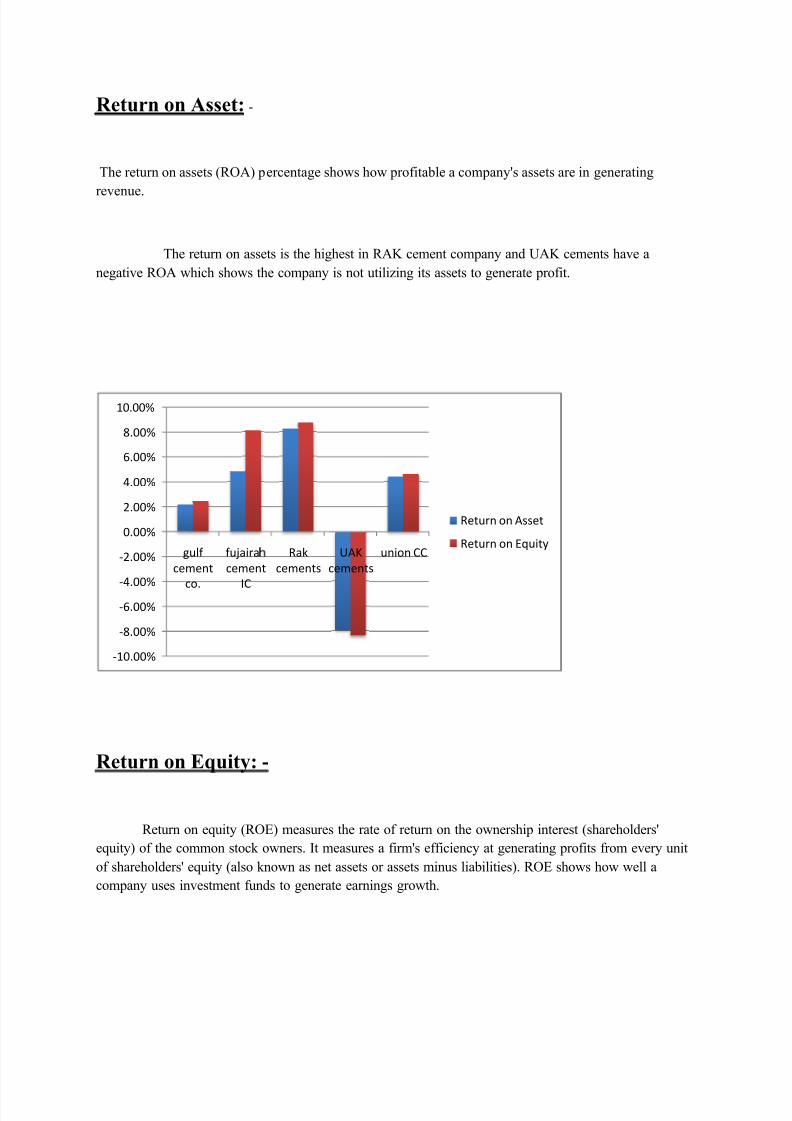
Return on Asset: -
The return on assets (ROA) percentage shows how profitable a company's assets are in generating
revenue.
The return on assets is the highest in RAK cement company and UAK cements have a
negative ROA which shows the company is not utilizing its assets to generate profit.
Return on Equity: -
Return on equity (ROE) measures the rate of return on the ownership interest (shareholders'
equity) of the common stock owners. It measures a firm's efficiency at generating profits from every unit
of shareholders' equity (also known as net assets or assets minus liabilities). ROE shows how well a
company uses investment funds to generate earnings growth.
-10.00%
-8.00%
-6.00%
-4.00%
-2.00%
0.00%
2.00%
4.00%
6.00%
8.00%
10.00%
gulf
cement
co.
fujaira £
cement
IC
Rak
cements
UAK
cements
union CC
Return on Asset
Return on Equity
8/7/2019 group 3 accounts project
http://slidepdf.com/reader/full/group-3-accounts-project 13/15
In this bar chart it is again the RAK cement company with the highest ROE and UAK with the lowest
ROE.
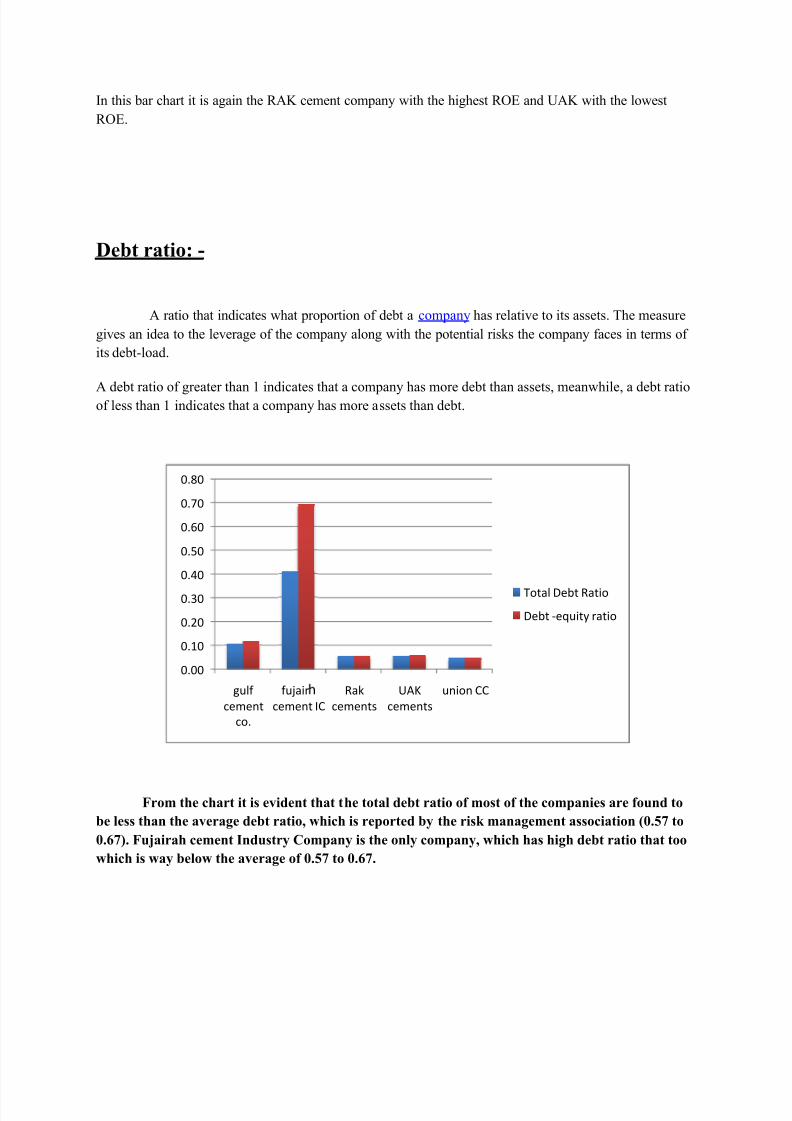
Debt ratio: -
A ratio that indicates what proportion of debt a company has relative to its assets. The measure
gives an idea to the leverage of the company along with the potential risks the company faces in terms of
its debt-load.
A debt ratio of greater than 1 indicates that a company has more debt than assets, meanwhile, a debt ratioof less than 1 indicates that a company has more assets than debt.
From the chart it is evident that the total debt ratio of most of the companies are found to
be less than the average debt ratio, which is reported by the risk management association (0.57 to
0.67). Fujairah cement Industry Company is the only company, which has high debt ratio that too
which is way below the average of 0.57 to 0.67.
0.00
0.10
0.20
0.30
0.40
0.50
0.60
0.70
0.80
gulf
cement
co.
fujair ¤
cement IC
Rak
cements
UAK
cements
union CC
Total Debt Ratio
Debt -equity ratio
8/7/2019 group 3 accounts project
http://slidepdf.com/reader/full/group-3-accounts-project 14/15
Debt equity ratio: -
The debt-to-equity ratio (D/E) is a financial ratio indicating the relative proportion of
shareholders' equity and debt used to finance a company's assets
From the chart it is evident that its only Fujairah cement industries company which hashigher debt-equity ratio. Which is because of the fact that the company has very little amount of
equity compared to that of other companies.
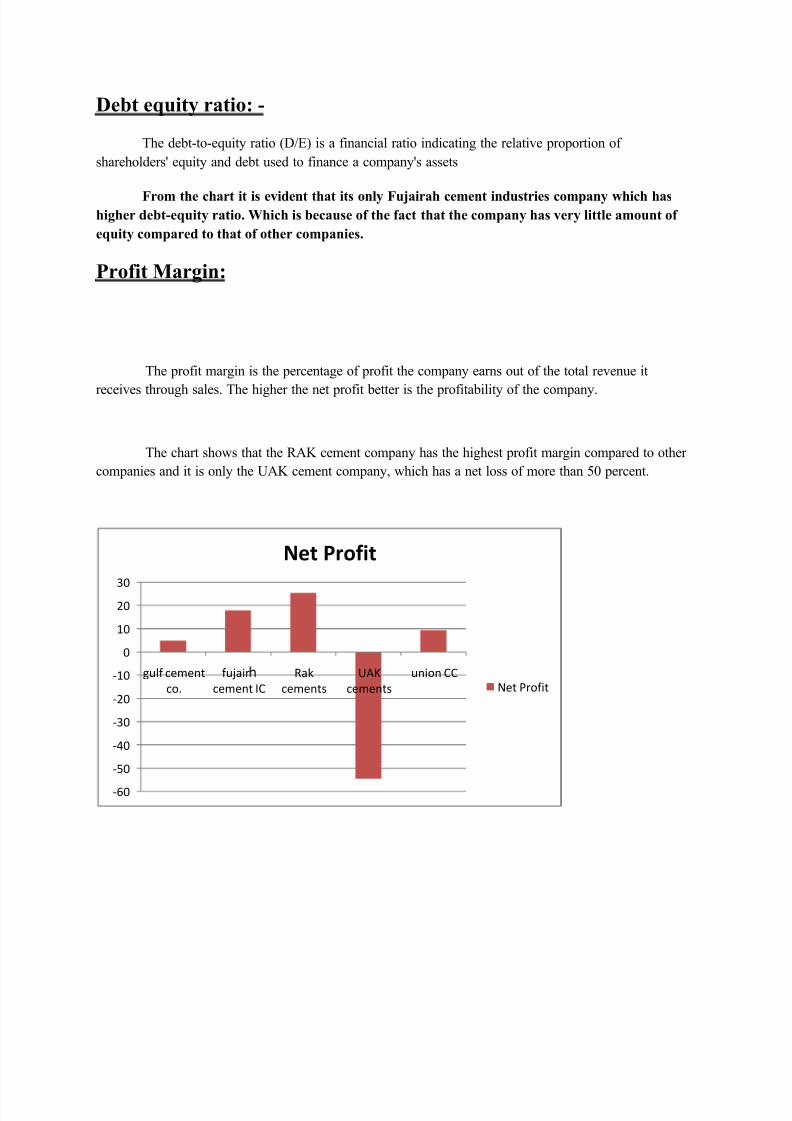
Profit Margin:
The profit margin is the percentage of profit the company earns out of the total revenue it
receives through sales. The higher the net profit better is the profitability of the company.
The chart shows that the RAK cement company has the highest profit margin compared to other
companies and it is only the UAK cement company, which has a net loss of more than 50 percent.
-60
-50
-40
-30
-20
-10
0
10
20
30
gulf cement
co.
fujair ¥
cement IC
Rak
cements
UAK
cements
union CC
Net Profit
Net Profit
8/7/2019 group 3 accounts project
http://slidepdf.com/reader/full/group-3-accounts-project 15/15
Conclusion: -
We have seen the analysis of all the five companies and we can come to the conclusion that
Gulf Cement Company, Fujairah Cement company, Ras Al Khaimah Cement Company, Union
Cement Company P.S.C. are gaining profit and would keep continuing to operate. Whereas the Umm
Al-Qaiwain Cement Industries Company is operating at huge loss and would have to get
their cost of the product down so that they could meet the expenses and gain profit.
With the ratio analysis we found that all the companies had a good liquidity
ratio and could easily meet its current liabilities. The companies could meet their long-term
liabilities as they have a reasonably low debt ratio. The return on equity of the all the companies were
good except Umm Al-Qaiwain Cement Industries Company, which had a negative, return
which is because of their net loss.
After the year 2008, the market for the cement manufacturers have come down
reasonably because of the fact that the construction industry, which is the largest consumer
of cements was hit by recession. But the year 2009 which we analyzed showed that the
companies were still able to meet the expenses and gain profits.
The cement industry in UAE will develop in the near future not at the rate at
which it was in the years of the market boom (2005 ± 2007) but still the situation is expected
to improve.
It was observed that RAK Cement Company is the company with the best
financial position with the highest profit and high liquidity ratio.