Embed Size (px)
Citation preview

1
Group 2:
1. Miss. Duong Sochivy
2. Miss. Im Samphy
3. Miss. Lay Sreyleap
4. Miss. Seng Puthy
ROYAL UNIVERSITY OF PHNOM PENHINSTITUTE OF FOREIGN LANGUAGES
DEPARTMENT OF ENGLISH
Lecturer: Mrs. San Sotheary Subject: TM402
ACADEMIC YEAR: 2009 - 2010
Topic: Interpreting Test Score
2
CONTENTSI. Frequency Distribution (Puthy) II. Measures of central tendency
1. Mode 2. Median 3. Mean
III. Measures of dispersion (Chivy) 1. Range 2. Standard Deviation
IV. Item and Test analysis (Samphy)
1. Item difficulty 2. Item Discrimination
V. Guessing (Leap)VI. Example of Test Score Interpretation

I.FREQUENCY DISTRIBUTION
Mark Tally Frequency 40 39 38 37 36 35 / 1 34 / 1 33 // 2 32 / 1 31 30 // 2 29 // 2 28 27 /// 3 26 ///// 5 25 /// 3 24 / 1 23 // 2 22 / 1 21 20 / 1 19 / 1 18 17 16 15 Total 26
II. MEASURES OF CENTRAL TENDENCY
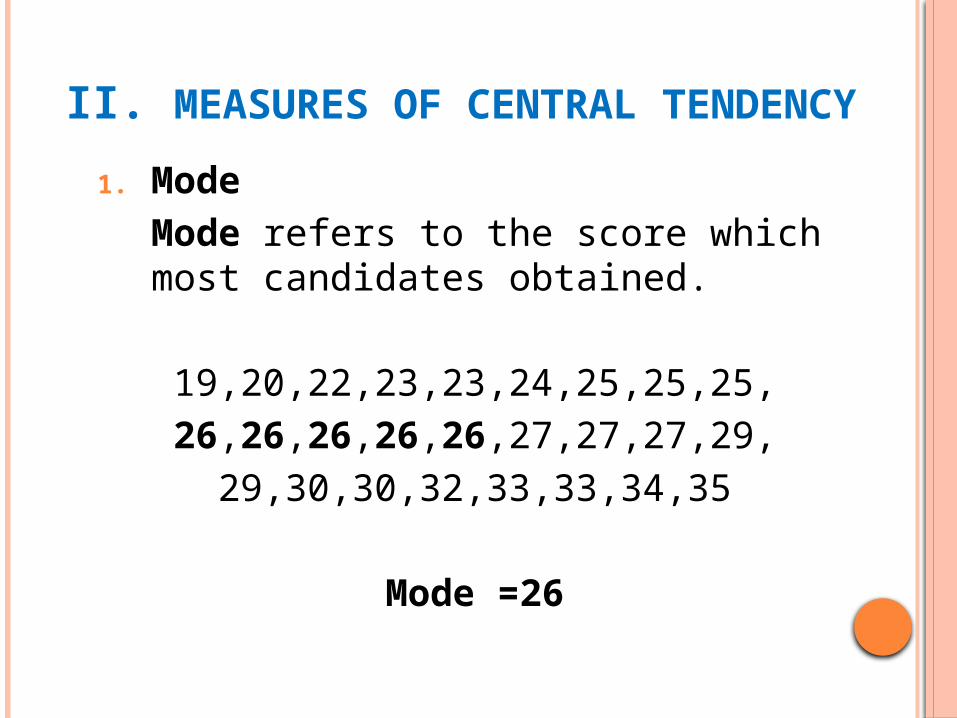
1. ModeMode refers to the score which most candidates obtained.
19,20,22,23,23,24,25,25,25,26,26,26,26,26,27,27,27,29,
29,30,30,32,33,33,34,35
Mode =26
2. MEDIAN
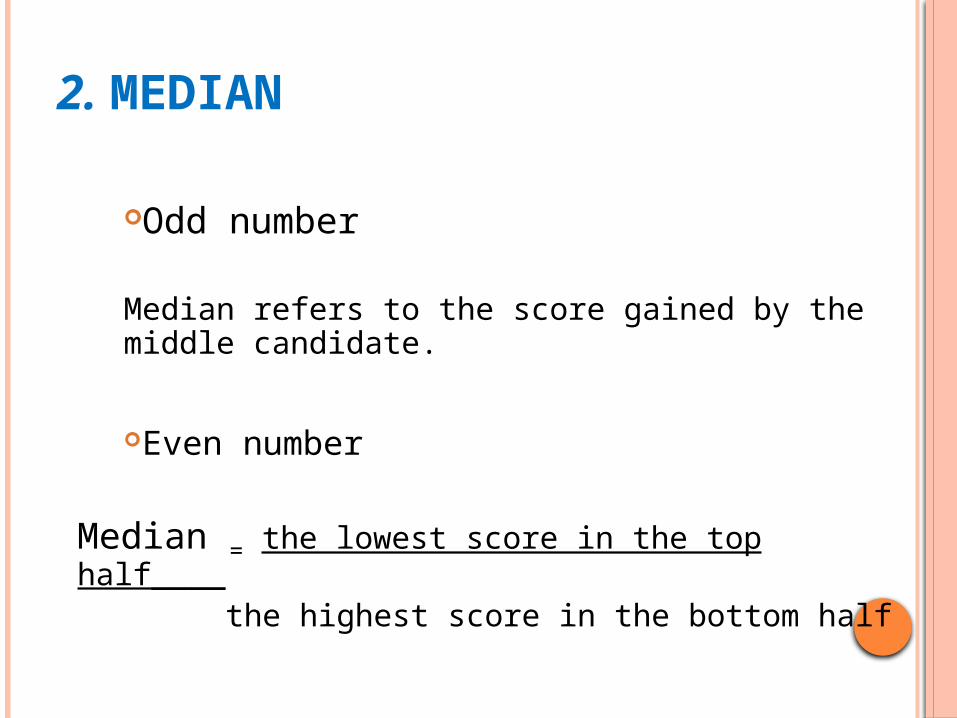
Odd number
Median refers to the score gained by the middle candidate.
Even number
Median = the lowest score in the top half____
the highest score in the bottom half
6
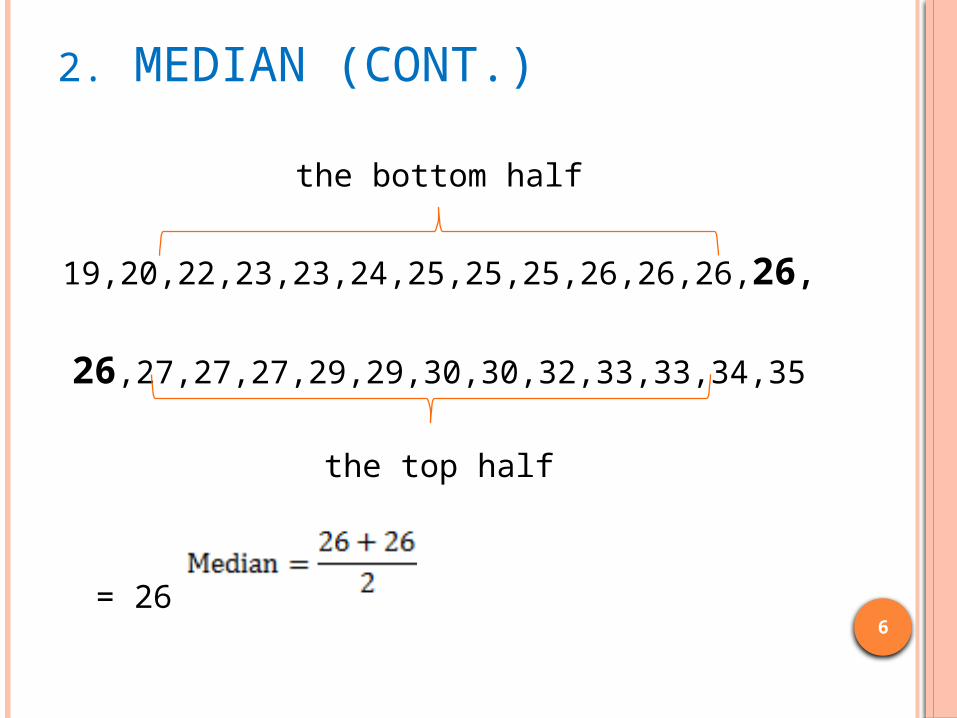
2. MEDIAN (CONT.)
the bottom half
19,20,22,23,23,24,25,25,25,26,26,26,26,
26,27,27,27,29,29,30,30,32,33,33,34,35
the top half
= 26
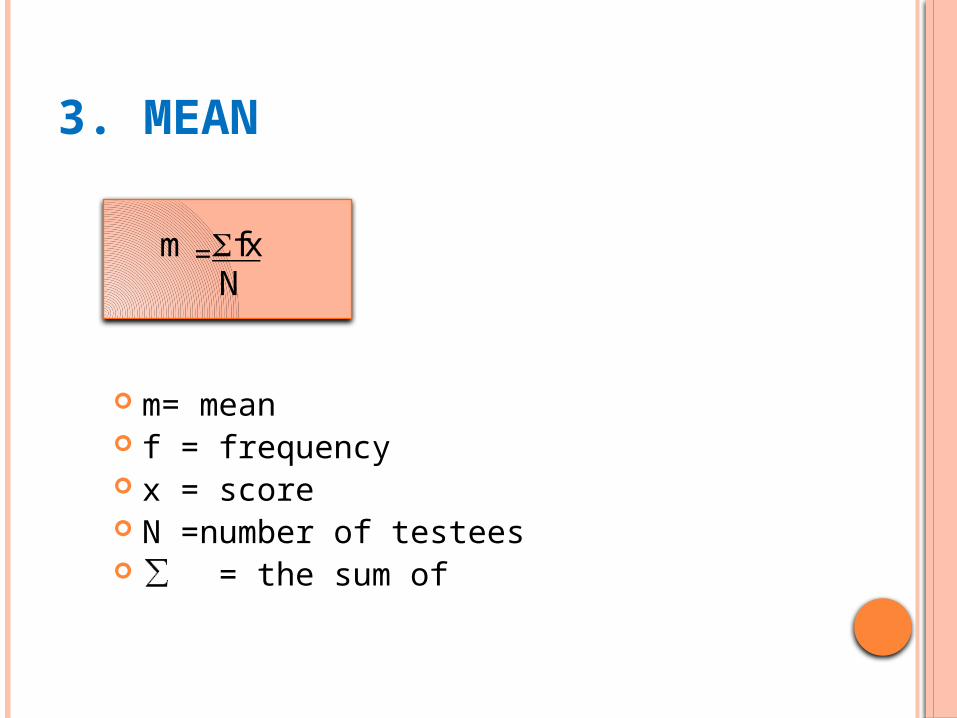
3. MEAN
m= mean f = frequency x = score N =number of testees = the sum of
m fx
N
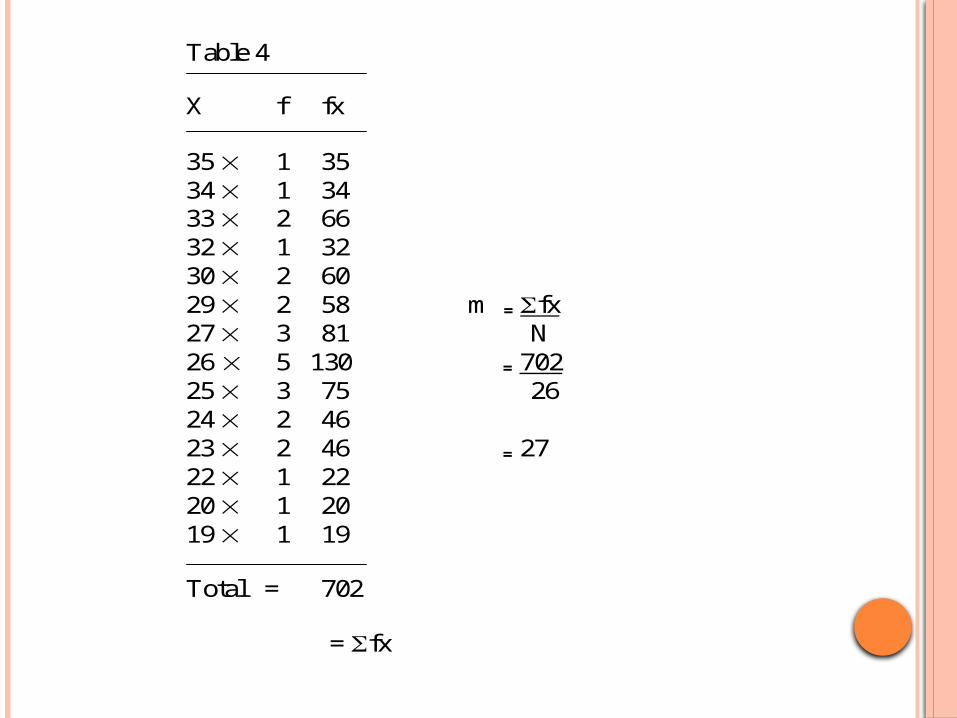
Table 4 X f fx 35 1 35
34 1 34 33 2 66 32 1 32 30 2 60 29 2 58 m = fx
27 3 81 N 26 5 130 = 702 25 3 75 26 24 2 46 23 2 46 = 27 22 1 22 20 1 20 19 1 19 Total = 702 = fx
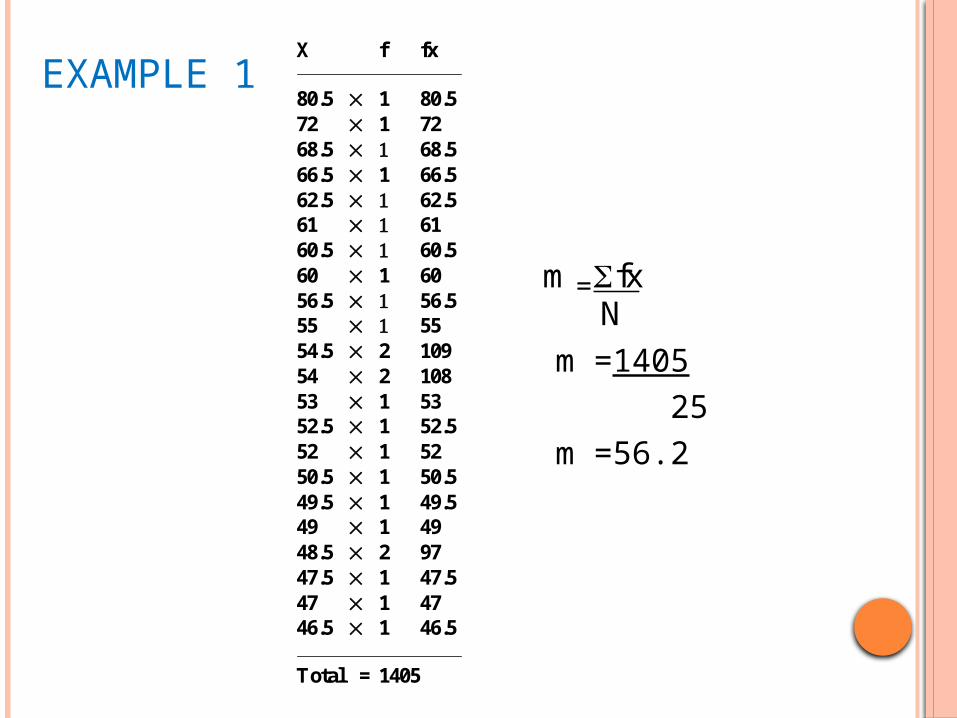
EXAMPLE 1
m =1405 25 m =56.2
X f fx 80.5 1 80.5 72 1 72 68.5 68.5 66.5 1 66.5 62.5 62.5 61 61 60.5 60.5 60 1 60 56.5 56.5 55 55 54.5 2 109 54 2 108 53 1 53 52.5 1 52.5 52 1 52 50.5 1 50.5 49.5 1 49.5 49 1 49 48.5 2 97 47.5 1 47.5 47 1 47 46.5 1 46.5 Total = 1405
m fx
N
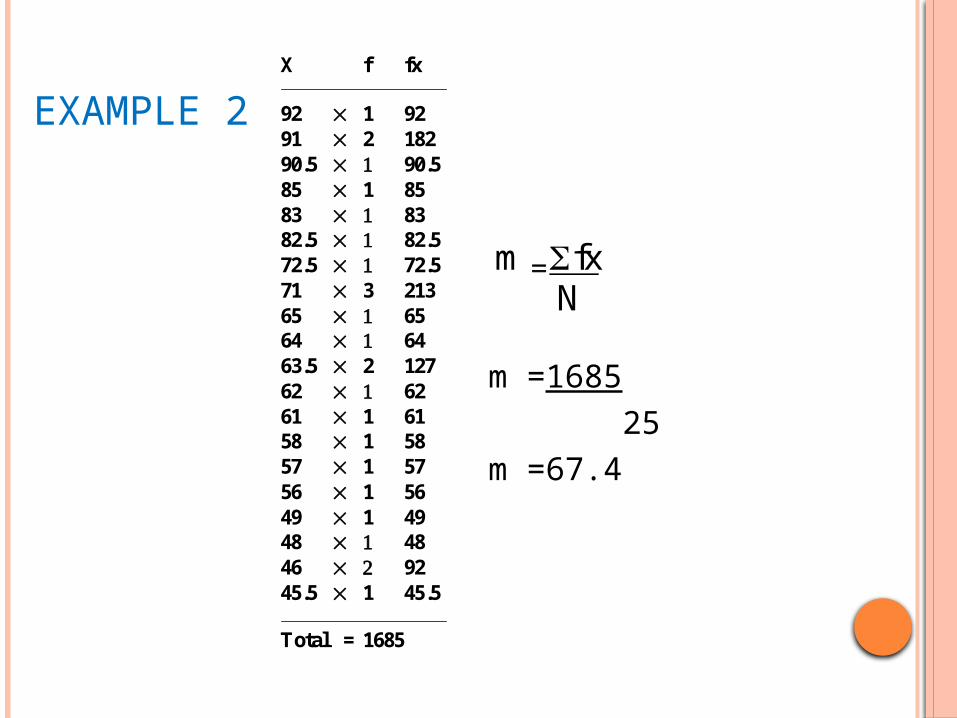
EXAMPLE 2
m =1685 25m =67.4
X f fx 92 1 92 91 2 182 90.5 90.5 85 1 85 83 83 82.5 82.5 72.5 72.5 71 3 213 65 65 64 64 63.5 2 127 62 62 61 1 61 58 1 58 57 1 57 56 1 56 49 1 49 48 48 46 92 45.5 1 45.5 Total = 1685
m fx
N
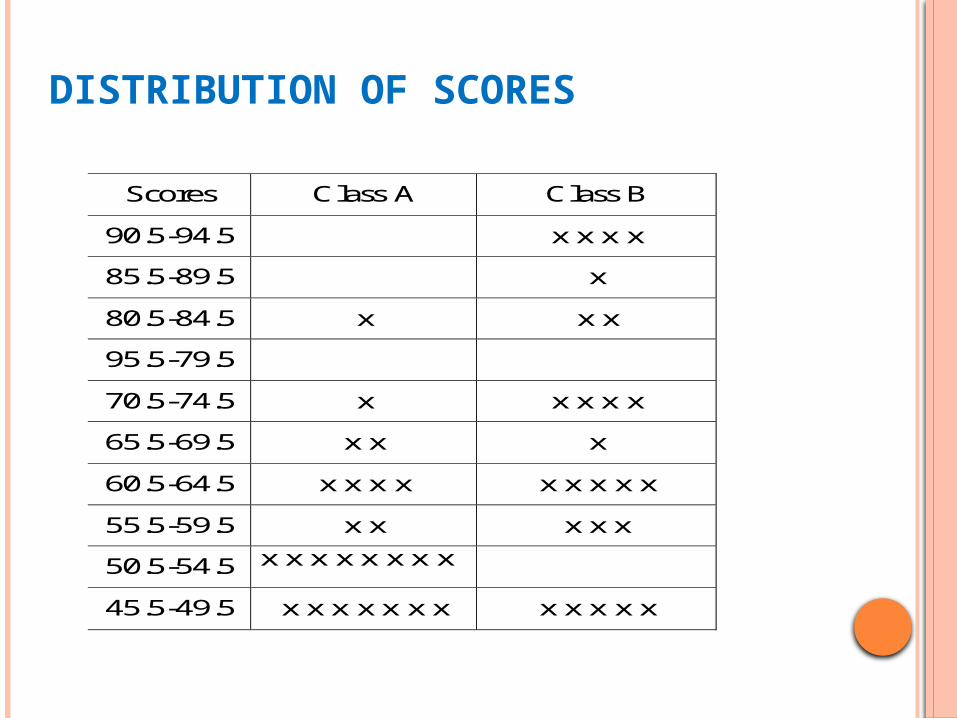
Scores Class A Class B
90.5-94.5 x x x x
85.5-89.5 x
80.5-84.5 x x x
95.5-79.5
70.5-74.5 x x x x x
65.5-69.5 x x x
60.5-64.5 x x x x x x x x x
55.5-59.5 x x x x x
50.5-54.5 x x x x x x x x
45.5-49.5 x x x x x x x x x x x x
DISTRIBUTION OF SCORES
12
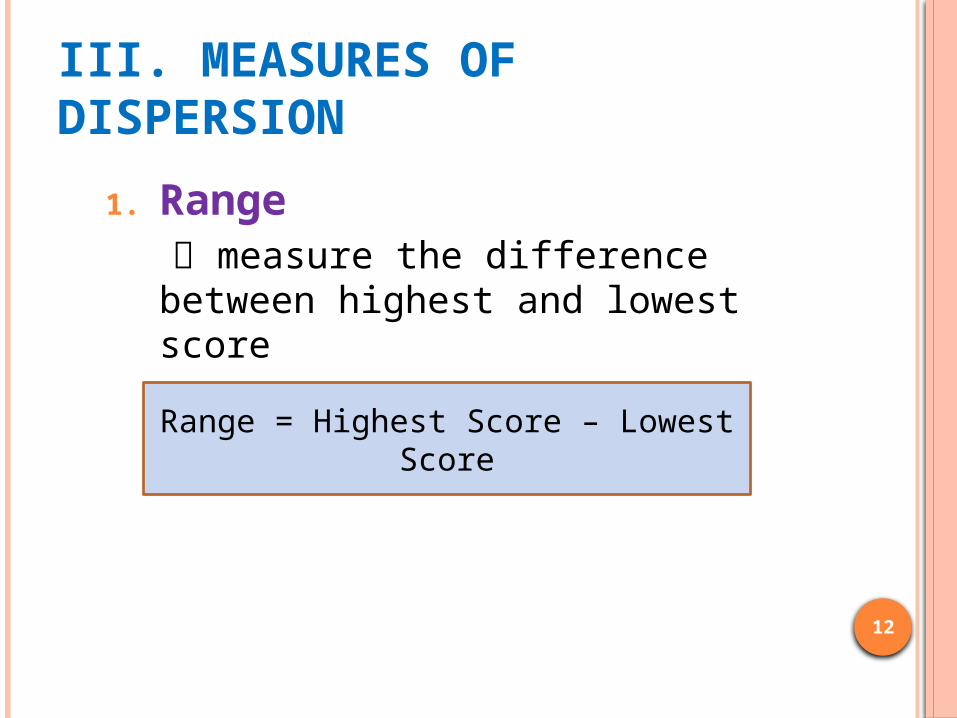
III. MEASURES OF DISPERSION
1. Range measure the difference between
highest and lowest score
Range = Highest Score – Lowest Score
13
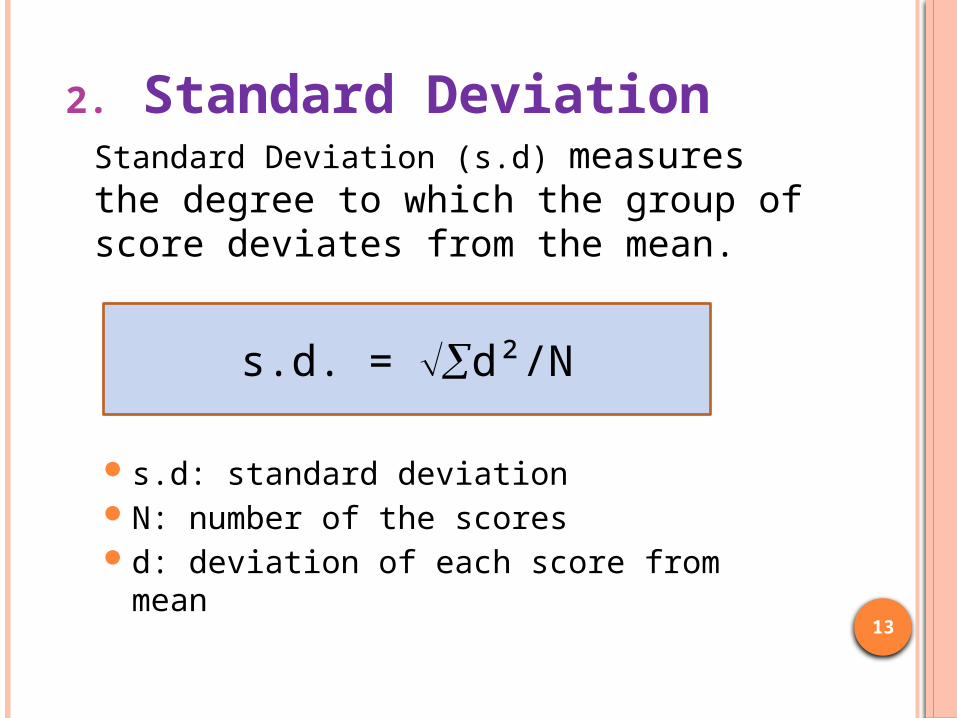
2. Standard DeviationStandard Deviation (s.d) measures the degree to which the group of score deviates from the mean.
s.d: standard deviation N: number of the scores d: deviation of each score from mean
s.d. = d²/N
14
STEPS TO CALCULATE S.D
Microsoft Office Excel Worksheet
15
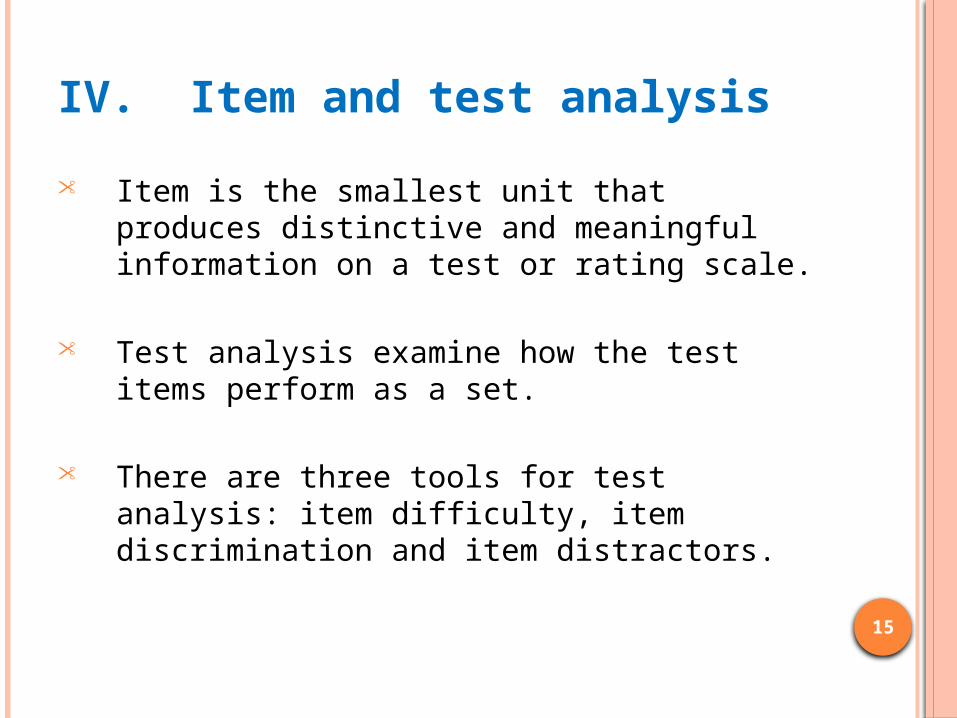
IV. Item and test analysis
• Item is the smallest unit that produces distinctive and meaningful information on a test or rating scale.
• Test analysis examine how the test items perform as a set.
• There are three tools for test analysis: item difficulty, item discrimination and item distractors.
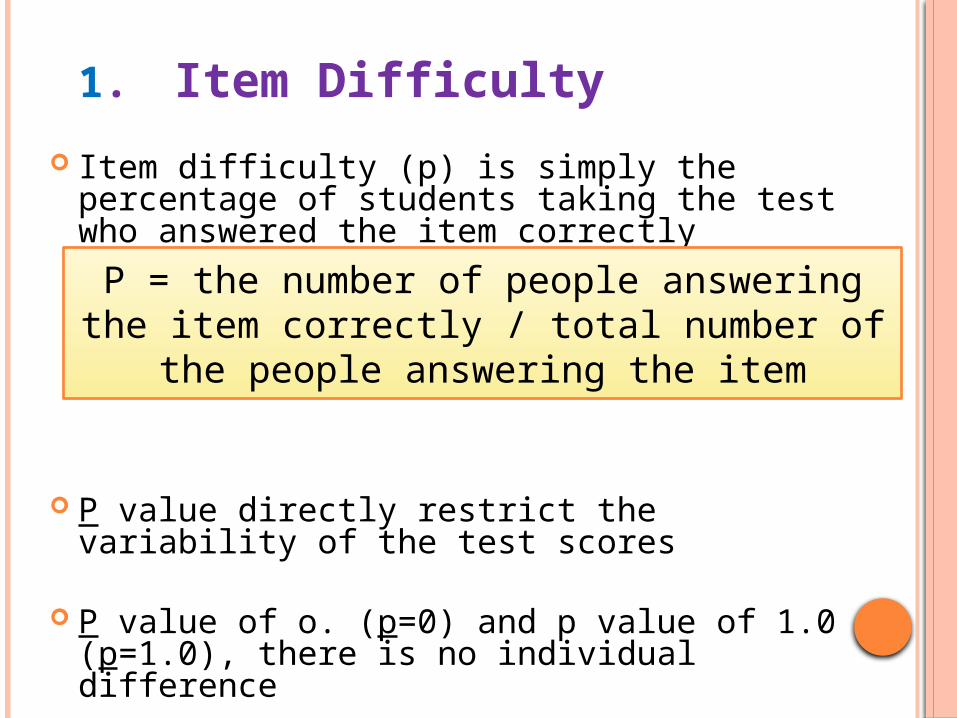
1. Item Difficulty
Item difficulty (p) is simply the percentage of students taking the test who answered the item correctly
P value directly restrict the variability of the test scores
P value of o. (p=0) and p value of 1.0 (p=1.0), there is no individual difference
P = the number of people answering the item correctly / total number of the people answering the item
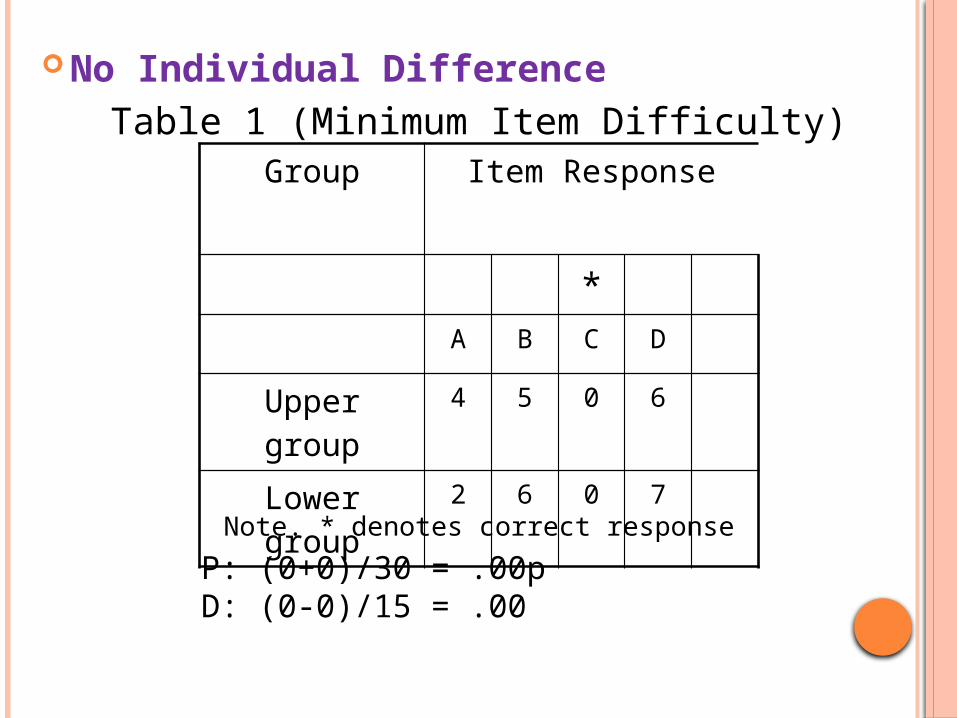
No Individual Difference
Table 1 (Minimum Item Difficulty)
Note. * denotes correct response
Group Item Response
*A B C D
Upper group 4 5 0 6
Lower group 2 6 0 7
P: (0+0)/30 = .00pD: (0-0)/15 = .00
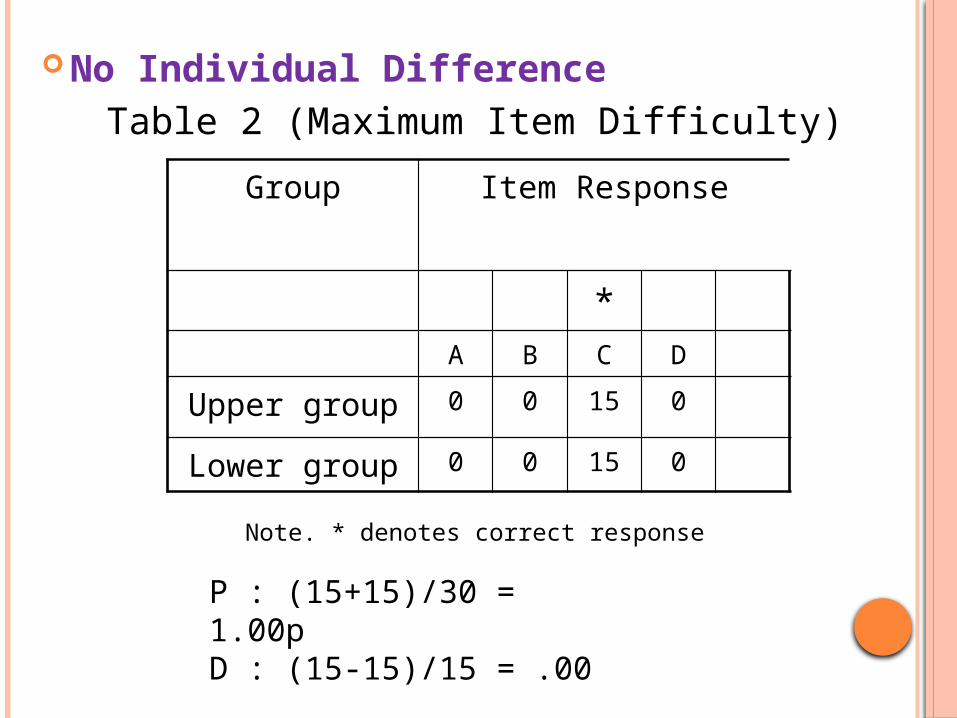
No Individual Difference
Table 2 (Maximum Item Difficulty)
Note. * denotes correct response
Group Item Response
*A B C D
Upper group 0 0 15 0
Lower group 0 0 15 0
P : (15+15)/30 = 1.00pD : (15-15)/15 = .00
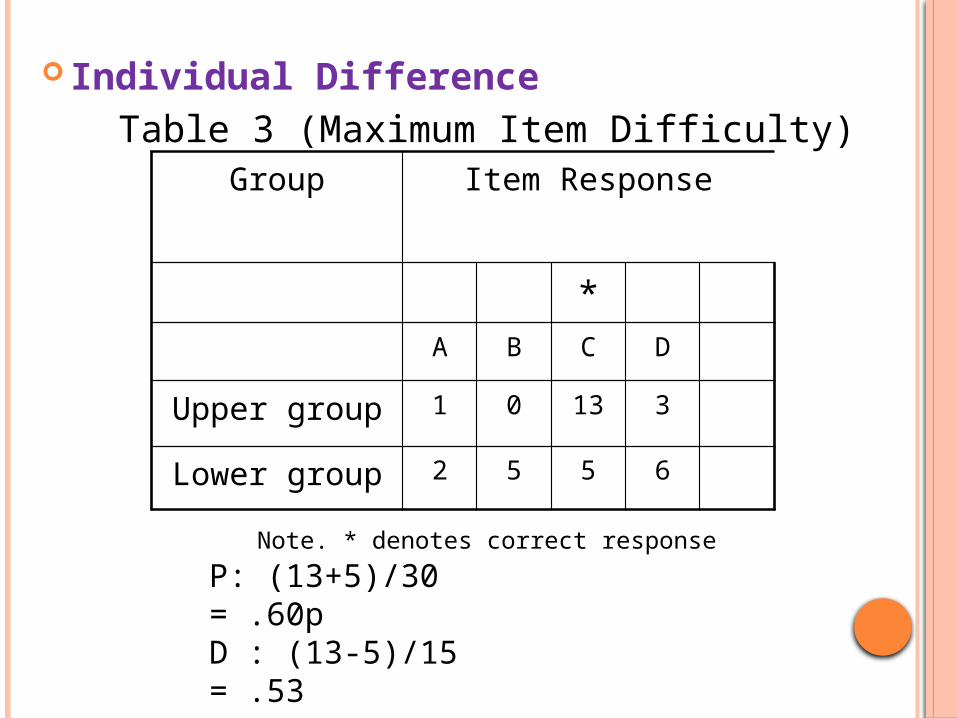
Individual Difference
Table 3 (Maximum Item Difficulty)
Note. * denotes correct response
Group Item Response
*A B C D
Upper group 1 0 13 3
Lower group 2 5 5 6
P: (13+5)/30 = .60pD : (13-5)/15 = .53
2. Item Discrimination
One would expect people who do well on the test to answer that item correctly, and those who do poorly to answer the item incorrectly
Two way can be determined the item discrimination are the item discrimination index, D and discrimination coefficients

A. Item discrimination Index, D
The discrimination index, D, is the number of people in the upper group who answered the item correctly minus the number of people in the lower group who answered the item correctly, divide by the number of people in the largest of two group
A good job of discrimination, when more people in the top-scoring group will have answered the item correctly. (see in table 3)
A negative discrimination index, when number of lower group answered the correct item are more than upper group, thus that such a test doesn’t valid. (see in table 7)
A rule of thumb, in the terms of discrimination index
- .40 and greater are very good items
- .30 t0 .39 are reasonably good but possibly subject to improvement
- .20 t0 .29 are marginal item and need some revision
- below .19 are considered poor items
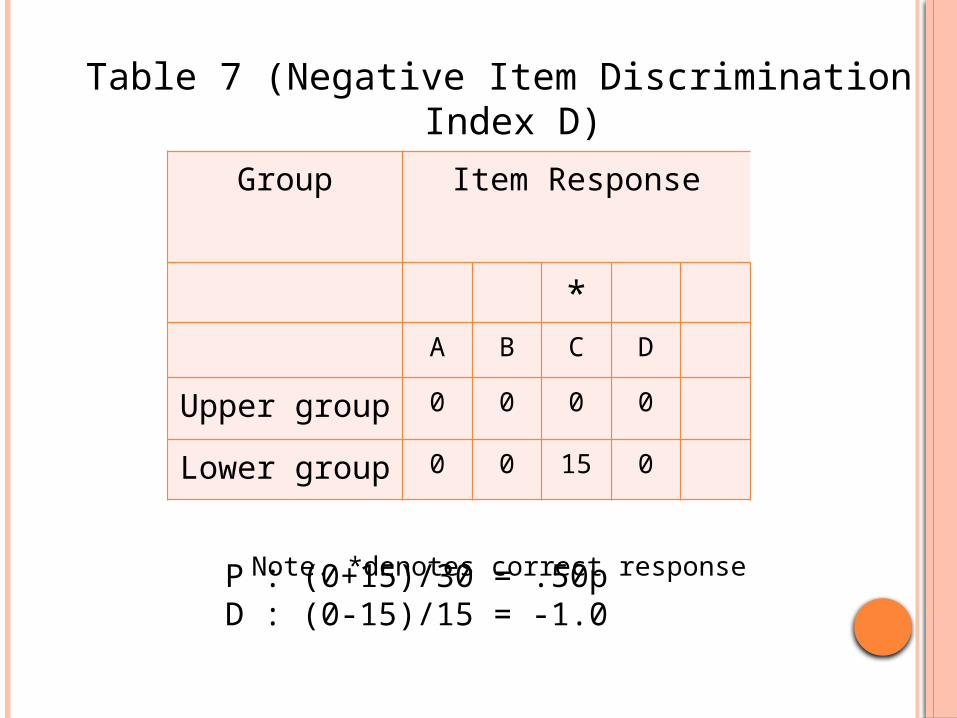
Table 7 (Negative Item Discrimination Index D)
Note. *denotes correct response
Group Item Response
*A B C D
Upper group 0 0 0 0
Lower group 0 0 15 0
P : (0+15)/30 = .50pD : (0-15)/15 = -1.0
B. Distractors
Distractors are the incorrect alternative choices in each item
Items should be modified if students consistently fail to select certain multiple choice alternatives
Distractors should be implausible
25
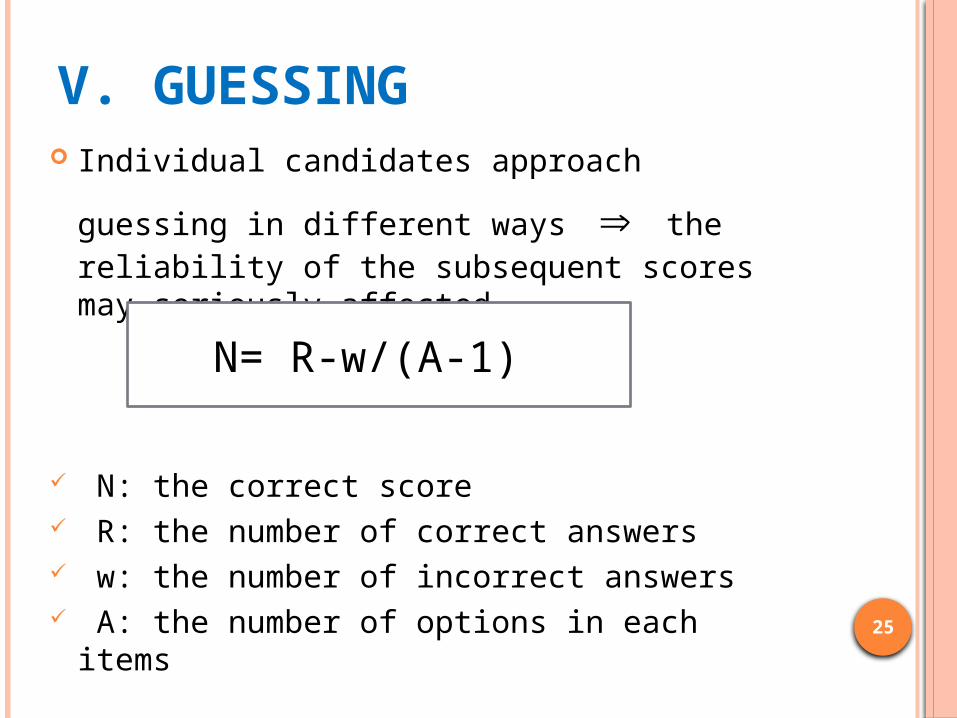
V. GUESSING Individual candidates approach guessing in
different ways the reliability of the subsequent scores may seriously affected.
N: the correct score R: the number of correct answers w: the number of incorrect answers A: the number of options in each items
N= R-w/(A-1)

26
Simpler formula of Correct Score (N)
Option per items Corrected Scores
5 R-1/4w 4 R-1/3w 3 R-1/2w
2 R-w

27
Eg: A student who has scored 61% in a test comprising multiple choice items with 4 options will have 61 correct answers and 39 incorrect.
=> N = 61 – 39/4-1 = 61 – 39/3 = 61 – 13 = 48
This means that the actual ability of that Ss should be 48 without guessing.

28
Compare class A and B taught by the same teacher and explain their implications for further teaching and learning.
It was a progress test conducted to check Ss’ monthly progress in three month of a five month intermediate general English course.
VI. Interpreting Test Score Example
29
80.5 9272 91
68.5 9166.5 90.562.5 85
61 8360.5 82.5
60 72.556.5 71
55 7154.5 7154.5 65
54 6454 63.553 63.5
52.5 6252 61
50.5 5849.5 57
49 5648.5 4948.5 4847.5 46
47 4646.5 45.5
Class A
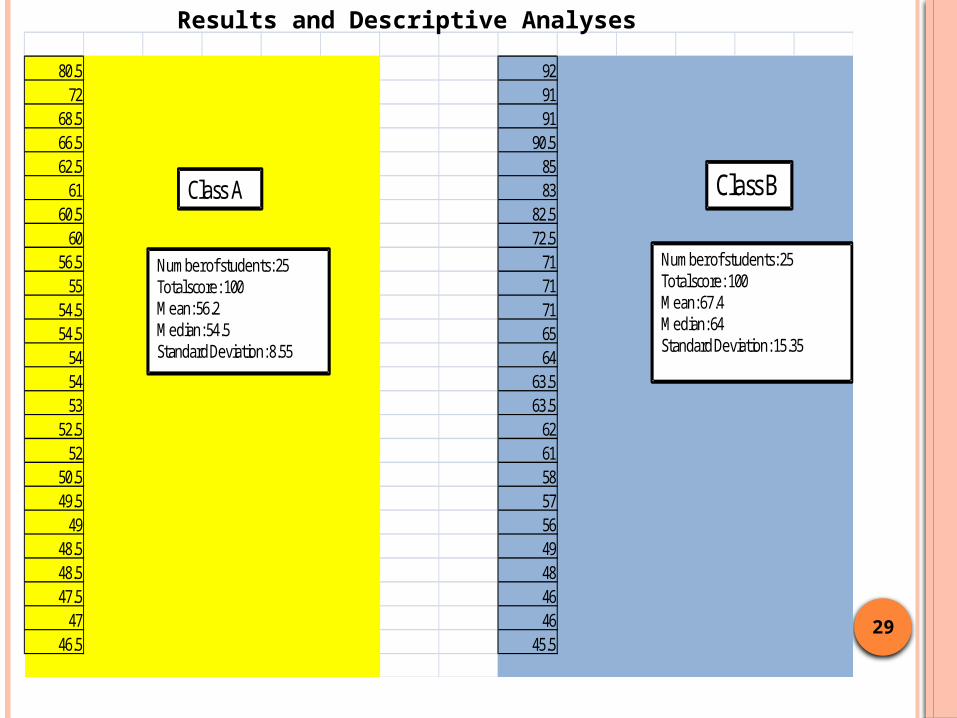
Number of students: 25Total score: 100 Mean: 56.2 Median: 54.5Standard Deviation: 8.55
Class B
Number of students: 25Total score: 100Mean: 67.4Median: 64Standard Deviation: 15.35
Results and Descriptive Analyses
30
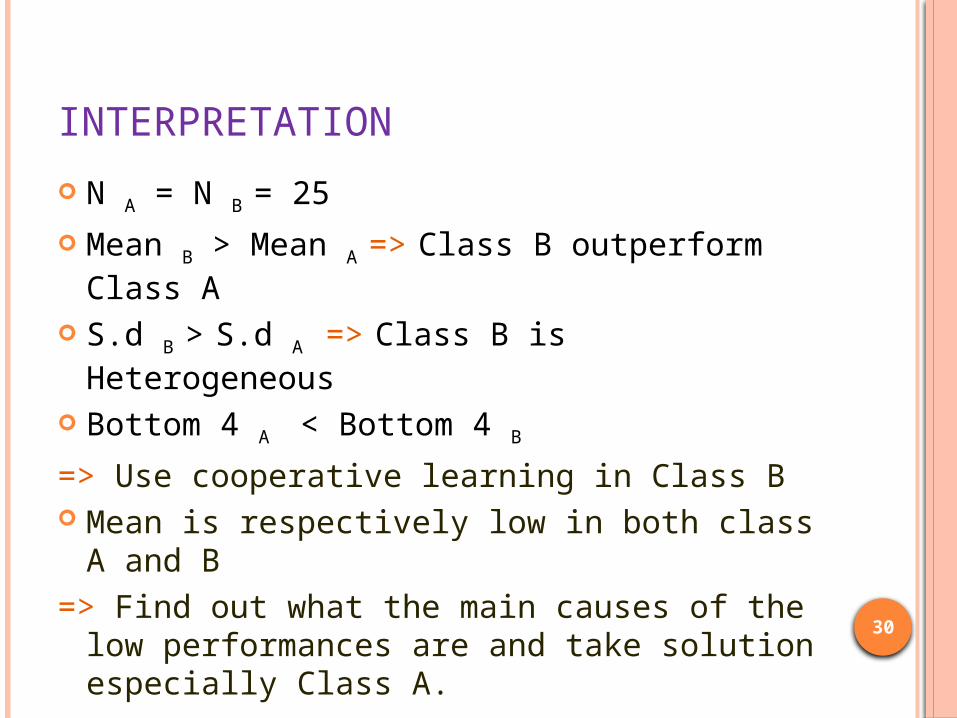
INTERPRETATION
N A = N B = 25
Mean B > Mean A => Class B outperform Class A
S.d B > S.d A => Class B is Heterogeneous
Bottom 4 A < Bottom 4 B
=> Use cooperative learning in Class B Mean is respectively low in both class A and
B=> Find out what the main causes of the low
performances are and take solution especially Class A.

31
Thank 4 your attention