Embed Size (px)
Citation preview

2018 Tennessee’s Roadmap to Securing the Future of Our Water Resources Groundwater Working Group

2
Table of Contents Executive Summary ....................................................................................................................................... 4
Tennessee Groundwater ............................................................................................................................... 9
Introduction ........................................................................................................................ 9
Groundwater Overview .............................................................................................................................. 12
Geology ............................................................................................................................. 12
West TN Geology .............................................................................................................. 13
Basic Geologic Terminology .............................................................................................. 17
Suggested Reading: Geology............................................................................................. 19
Groundwater Availability and Use .............................................................................................................. 22
METHODS AND DATA SOURCES ....................................................................................... 23
PRINCIPAL AQUIFERS ........................................................................................................ 24
ALLUVIAL AQUIFER ......................................................................................................................... 24
TERTIARY SAND AQUIFER SYSTEM ................................................................................................. 25
CRETACEOUS SAND AQUIFER ........................................................................................................ 25
PENNSYLVANIAN SANDSTONE AQUIFER ....................................................................................... 26
MISSISSIPPIAN CARBONATE AQUIFERS ......................................................................................... 26
ORDOVICIAN CARBONATE AQUIFERS ............................................................................................ 27
KNOX AQUIFER ............................................................................................................................... 27
CAMBRIAN-ORDOVICIAN AQUIFER SYSTEM .................................................................................. 27
CRYSTALLINE ROCK AQUIFER ......................................................................................................... 28
GROUND-WATER WITHDRAWALS .................................................................................... 28
GROUNDWATER MONITORING AND WATER-LEVELS ....................................................... 32
SUMMARY ......................................................................................................................... 37
References ........................................................................................................................ 39
Groundwater Recharge ............................................................................................................................... 42
Groundwater Recharge in West Tennessee ..................................................................... 42
Groundwater recharge in Middle and East Tennessee .................................................... 45
Recharge and Contamination ........................................................................................... 46
References ........................................................................................................................ 48
Groundwater and Surface Water Connectivity........................................................................................... 49

3
Various Uses/Records ....................................................................................................... 49
Threats caused by this connectivity .................................................................................. 50
Considerations and Options .............................................................................................. 50
Tennessee Agriculture and Groundwater ................................................................................................... 52
REFERENCES ...................................................................................................................... 54
Wellhead Protection Program .................................................................................................................... 55
Water Use Projections, 2010 – 2040 .......................................................................................................... 57
Introduction and data sources .......................................................................................... 57
Trends in Water Use ......................................................................................................... 57
Method ............................................................................................................................. 61
Public-water supply ....................................................................................................................... 61
Domestic Self-Supplied .................................................................................................................. 62
Self-Supplied Industry .................................................................................................................... 63
Power Generation .......................................................................................................................... 63
Mining, Livestock, and Aquaculture ............................................................................................... 63
Irrigation – Crop ............................................................................................................................. 63
Irrigation – Golf .............................................................................................................................. 64
Projections of Water Withdrawal in Tennessee 2020 - 2040 ........................................... 65
Projections of Water Withdrawal for Public Supply ......................................................... 65
References ........................................................................................................................ 71
Recommendations ...................................................................................................................................... 74

4
Executive Summary
Beneath the lowlands of the Mississippi River valley in the west to under the rolling hills in middle Tennessee up into the ancestral Smoky Mountains to the east, lies a hidden treasure: a precious supply of groundwater. Characterizing our groundwater as an incredible resource is not just a Tennessean axiom, but our groundwater, most especially that in West Tennessee, is considered to be the best, high-quality groundwater in the nation. While media headlines are peppered with stories about declining water availability, water quality degradation, and drinking water contamination, Tennessee is blessed to have an abundance of water and can be considered a water-rich state.
Tennessee’s Grand Divisions: West, Middle and East, divide our State into three topographies, or general configuration of the earth’s surface, including its relief and the location of its natural features. Tennessee is subdivided further into eight physiographic provinces representing distinct geologic regions that result in various types of aquifers. Staying general to the three Grand Divisions, the State’s geology illustrates three major feature types which in turn result in key groundwater system differences. In West TN, the geology is comprised of unconsolidated sediments, thus non-cohesive sands, gravels, silts, and clay, deposited in gently sloping layers toward the Mississippi River. Moving eastward, these unconsolidated sediments thin as the deep underlying consolidate rock rises to the surface just before the Tennessee River. These rocks are comprised mostly of limestone where over millions of years, rain water dissolved solution channels or openings into the weaker limestone called karst. These limestone and other deposits comprise much of Middle and East Tennessee. In far east Tennessee, there exist metamorphic rocks that are comprised of fractures, not solution channels. Groundwater, water that is stored within the open spacing within geologic material (sand/gravel, karst, rock fractures), is a part of a larger system called aquifers.
One of Tennessee’s most prolific aquifer systems underlies West Tennessee, a 21-county region, which boasts the best drinking water in the nation. West Tennessee geology is part of a much larger geologic framework called the Mississippi embayment, a geologic region crossing eight southern states with the majority of coverage occurring in Tennessee, Mississippi and Arkansas. The aquifer systems in West Tennessee follow a pancake-like geology where horizontal layers of aquifer are separated by layers of clay that, for the most part, act to protect our groundwater from contamination. Flowing through enormous quartz sand bodies, the groundwater is over 2000-3000 years old and of excellent quality.
Groundwater produced by public-water systems in Tennessee provided drinking water to more than 2.2 million Tennesseans in 2015. Twenty-one percent of the water withdrawal in the State (exclusive of thermoelectric use) is groundwater. In 2015, groundwater provided more than 298 million gallons per day (mgd) for public and rural-domestic supplies, nearly 52 mgd to self-supplied industries, and more than 60 mgd for irrigation, aquaculture and livestock uses. In West Tennessee, nearly all public supplies, industries, and rural residents use groundwater – Memphis is completely dependent on groundwater for public, industrial, and agricultural needs. Groundwater is also an important resource in Middle Tennessee used primarily for domestic and agricultural water supplies. In East Tennessee, groundwater

5
is relied on for public drinking water supplies throughout the Valley and Ridge including large water systems near Chattanooga and in the Tri-Cities area of northeast Tennessee.
Overall, Tennessee has nine principal aquifers that are relied on to supply drinking water. These aquifers vary in geologic material, spatial extent and thickness, material type, availability of groundwater, and water quality. As mentioned previously, the sand/gravel aquifers in West Tennessee are expansive and produce very high-quality groundwater at high yields (200-2,000 gallons per minute (gal/min)). The limestone aquifers of Middle and East Tennessee vary in yield based on the number and size of interconnect solution channels (50-2,000 gal/min), but due to the inherent nature of karst systems being formed by dissolution of the rock material these groundwaters contain measures of dissolved solids that influence water hardness. Unlike the layered aquifer systems in West Tennessee that have some level of protection from clay capping key sand aquifers, sinkholes in the karst region of Middle and East pose some challenges in preventing contamination from readily entering into the groundwater network. But West Tennessee has encountered challenges of its own like in Shelby County where the protective clay layer has spotty naturally occurring breaches that allow for hydraulic transfer of waters from the shallow aquifer to drain downward into the pristine Memphis aquifer.
Groundwater in Tennessee provided about 256 mgd in 2015 for public-water systems and 2.28 million people. In 2015, public-water systems in 66 Tennessee counties used groundwater for public-water supplies with 36 counties withdrawing more than 1 mgd from groundwater. Of those 36 counties, 17 were in West Tennessee, 9 in Middle Tennessee and 10 in East Tennessee. Of the five largest producing counties, 4 were in West Tennessee and 1 in East Tennessee. The Memphis Sand of the Tertiary Sand aquifer system is the most important aquifer of Tennessee and provided 159 mgd for public-water supply in West Tennessee in 2015. The carbonates aquifer in the Valley and Ridge of East Tennessee was the second most used aquifer in Tennessee providing about 36 mgd for public-water supply. Outside of municipal and industrial use of groundwater, agriculture has a growing reliance on groundwater. According to data from the USDA census and the USDA Farm Services Agency, Tennessee had between 146,000 and 198,000 irrigated acres in the years from 2012 to 2017, respectively. The vast majority of on-farm irrigation from groundwater in Tennessee occurs in West Tennessee and is supplied by the Memphis aquifer. Given that as many as 198,000 of these acres are irrigated farm land, we can conclude that approximately 4.2% of the land above the aquifer is being irrigated. However, the effect this may have on Memphis aquifer is largely unknown. The cost of irrigation, both in financial terms and in terms of the depletion of natural resources, requires water conservation efforts, particularly within the current market conditions agriculture faces. Tennessee farmers have made significant strides in the conservation and protection of water supplies, particularly the Memphis aquifer, through their own voluntary efforts.
Groundwater withdrawals for public supply, industrial supply and irrigation will result in short-term and long-term declines in groundwater levels. The deepening of groundwater levels due to pumping can result in adverse hydrologic and economic impacts. To predict adverse impacts, groundwater monitoring wells are required to both measure water level decline and rise and to obtain samples for water quality analysis. In Tennessee, groundwater monitoring occurs primarily in Shelby County and is

6
very sparse through the rest of the State. Statewide, observations wells used to monitor groundwater levels decreased steadily from 26 in 1970 to a low of only 7 wells across Tennessee in 2000. Since 2000, a few additional observation wells have been added. Currently in 2018, outside of Shelby County, there are 11 observation wells across Tennessee. However, 5 of the 11 wells are located in Hamilton County. The response of groundwater levels to drought, climate changes, and to groundwater withdrawals cannot be assessed in many parts of Tennessee due to the lack of observation wells. However, long-term observations in Shelby County have shown decreasing groundwater withdrawals from a high of about 218 mgd in 2000 to about 182 mgd, with water levels actually on a positive rise due to the decreased pumping rates. This is attributed to industrial reuse of water for plant operations, an increase in the use of water-efficient appliances, and education programs geared toward water conservation. A critical factor in assess groundwater sustainability for Tennessee is recharge, the rate of natural replenishment of our groundwater. The fresh water aquifer systems of Tennessee find replenishment from the cyclic rains and melting snows year after year. A portion of the recharge to groundwater also discharges to surface water and maintains the base flow level of streams and is important for ecological flow conditions. Depending on the difference in river stage and surface water elevations in relation to shallow, near-surface groundwater elevations, these aquifers will also receive recharge from these surface features. Lastly, aquifers can actually recharge other aquifers as water moves slowly through the more resistive material (confining layers) that separates the aquifers. Of these recharge mechanisms, recharge by precipitation and surface water bodies offer the greatest means of replenishment to Tennessee’s aquifers. Based on the differences in Tennessee geology, not surprisingly recharge rates and locations of direct recharge vary. In West Tennessee, recharge occurs as water slowly percolates through the small opening between the grains of sediment. In Middle and East Tennessee, recharge is highly variable and primarily occurs through rock openings and solution channel conduits such as sinkholes with additional recharge percolating down through the soil zone. The majority of groundwater withdrawn in Tennessee occurs in West Tennessee (about 283 mgd, 66% of the State total). The key fresh water aquifers in West Tennessee are the Memphis, Fort Pillow, and McNairy aquifers. In the counties bordering the Mississippi River, these aquifers are confined; however, moving eastward these aquifers connect as they creep in the upslope direction of the Mississippi embayment. Hence, they end up forming a band across West Tennessee that forms the recharge zone where precipitation replenishes these aquifers. Yet for such a pristine, prolific and heavily relied on aquifer system, recharge rates are still a mystery. Some research by academia is shedding light on this important topic, but more is needed to fully understand the complex nature of recharge to these critical aquifers. The groundwater recharge in Middle and East Tennessee supports the baseflow of streams and the groundwater use for water supplies. Groundwater use in Middle Tennessee is about 60 mgd (14% of the State total) and in East Tennessee about 86 mgd (20%). The amount of recharge varies through time with seasonal and annual changes in precipitation, varies regionally depending on the soil, aquifer characteristics, and topography, and can vary locally in the karst areas with direct recharge through sinkholes and disappearing streams in Middle and East Tennessee. Defining recharge will afford

7
city planners and elected officials valuable information to direct growth that won’t drastically reduce natural recharge and encourage developers to employ building practices that promote recharge. There exists an important bond between groundwater and surface water in Tennessee. Understanding this relationship is crucial in assessing short- and long-term effects on water quantity, water quality, ecosystem and habitat vitality, waste discharge and assimilation, and availability of clean drinking water. Simply put, what happens in one resource can directly impact the other. There are two primary ways the interaction between these two water systems occurs. The flow of surface water into the groundwater system is defined as infiltration. The exchange in the opposite direction occurs from springs and base flow into the receiving lake or stream. Information about interaction is gathered from well logs, monitoring wells and surface stream gages. Yet, monitoring the interaction is complicated by our complex geology, data collection methods, the mysteries of groundwater, and no deliberate statewide baseline from which to judge the vigor of any interaction. As Tennessee looks to the future of water availability in the State, we are acting now to protect our valuable groundwater resources from potential contamination. Through numerous means such as illegal dumping, unintentional industrial spills, leaks from aging infrastructure, underground injection, and others, aquifers can become contaminated. Once contaminated, groundwater remediation is required, costing sometimes millions of dollars and years to clean. To be proactive toward contamination prevention, the State of Tennessee wellhead protection program (WHPP) was established following Environmental Protection Agency protocols and enforcement through the Clean Water Act of 1972. Through the WHPP program, two zones of protection are delineated around each wellhead. To ascertain potential contamination of a wellhead, an annual survey of likely contaminant sources is performed, and action is taken by utilities to reduce threats. By 2040, Tennessee is expected to have an abundance of groundwater though its population growth is expected to nearly double over this time. Water-use projections for public-water supply, domestic self-supplied, and golf course irrigation were projected based on projected population growth. Withdrawals for all water use sectors in Tennessee in 2010 totaled about 7.7 billion gallons per day and in 2015 totaled about 6.42 billion gallons per day. Water use from 2010 to 2015 declined for public-supply, self-supplied industry, thermoelectric power, and irrigation for crops. The water-use projections for 2020, 2030, and 2040, based on the assumptions and methods previously described, show a steady increase in water needs for groundwater use in Tennessee. The water-use projections are primarily driven by assumptions on the growth in population in Tennessee and conservative increases in irrigation. Specific to groundwater withdrawal for public supply, withdrawals for public-water supply in Tennessee for 2010 totaled about 890 mgd with about 321 mgd from groundwater sources and 569 mgd from surface water sources. The total state population in 2010 was about 6.35 million people. Population projections for Tennessee are 6.95 million by 2020, 7.53 million by 2030 and 8.34 million by 2040. Respectively, water withdrawals by public-water systems show similar increases of 962 mgd, 1,026 mgd and 1,114 mgd. To meet these projected future demands, following are a list of recommendations that should be implemented by the State in order of priority:

8
1) Develop Tennessee Specific Educational Component on Groundwater. Focus on importance of
groundwater in Tennessee, groundwater protection and conservation, hydrologic process dependencies (e.g., recharge, surface/groundwater interactions with regional considerations), groundwater sustainability and contributing factors to include land processes, shared use, stressors, etc.
2) Promote green infrastructure and conservation techniques using incentives to encourage infiltration of unpolluted/treated rain water into aquifers.
3) Establish monitoring well networks to measure groundwater levels to proactively evaluate trends in groundwater level decline and avert impact. Additionally, conduct simultaneous data collection proximal to the intersection of surface water and groundwater systems.
4) Obtain measures of groundwater withdrawals for agricultural through a voluntary program to farmers. Regionalization should be given high priority resulting in improved data collection, greater cost efficiencies, and more reliable water supply.
5) Promote best management practices across the users of groundwater (i.e., municipal, industrial, agriculture) with an aim toward conservation and sustainability as well as economic growth and vitality.
6) Develop a funding source for scientific assessment and initiatives pertaining to the sustainability of groundwater, most especially in West Tennessee where withdrawals are highest.
7) Determine recharge mechanisms and rates to the key aquifers in West Tennessee by precipitation, surface water-groundwater exchange and inter-aquifer exchange. Derive zones of protection based on critical recharge areas and contamination potential; consider possible designation as sole source aquifer.
8) Encourage better land use planning in and around well head protection areas by integrating program outcomes into municipal planning and/or development operations. Additionally, as groundwater contamination events are from older sources, increase protection zones to 40+ years of travel. Relate source water areas to well head protection.
9) Determine implementation of regulation for using back-flow preventors in situations when flow reversal could contamination the aquifer.

9
Tennessee Groundwater Introduction As part of Tennessee and other’s early childhood education curriculum, the hydrologic cycle is covered in science courses. The basic operation of the hydrologic cycle is learned at this young age where with the sun as the energy driver, precipitation falls to the ground, is taken up by plants or runs off to rivers, lakes or the ocean and is then released back to the atmosphere as evaporation and transpiration (see figure 1). The image shows other forms of water such as snow falling on mountain tops. However, there is a less discussed component to the hydrologic cycle. It is the directional arrows of water movement into the ground, most especially the retention of deeper water well below plants’ roots and that which escapes a shortened return to rivers. This lost component to most classroom discussions is groundwater, yet in Tennessee our groundwater functions as a major source of fresh water to municipalities, agriculture and industries.
Figure 1. Hydrologic Cycle
As is discussed in subsequent sections, Tennessee’s groundwater systems are vast, some considered to be quite prolific and of the highest quality in the nation. Tennessee relies on its vast surface water and groundwater resources to supply the water needs for its cities and towns, rural public districts, agricultural productions and industrial markets. As a result, Tennessee does not face broad water scarcity or regulated distribution like other regions of the United States including California, the Midwest and some areas of the southeast.
During extreme climatic conditions such as drought, surface water systems can become strained as they are linked more directly to precipitation events. As illustrated in the hydrologic cycle, precipitation also serves as the source of recharge to Tennessee’s groundwater. Again, during occurrences of drought groundwater systems witness its effects, yet impact is more muted. As such, Tennessee is able to

10
weather dramatic climatic shifts, thus providing better continuity of water availability year-round and across years.
Tennessee’s groundwater exists in a variety of geologic conditions as will be discussed later in more detail. Subdivided into its three main features: unconsolidated (loose) sediments, karst (caves) and fracture rock, groundwater is found across the entire state. Most prolific are the unconsolidated sand and gravel systems found in West TN. Over 3,000 feet in total thickness, one sand system in particular averages 800 feet thick and is considered the highest quality groundwater in the nation. Being of such high quality, industries tapping into this system require minimal treatment; thereby, reducing operational costs and offering a much improved water reuse program. On average across Tennessee’s 85 counties, total fresh groundwater withdrawals is approximately 430 million gallon per day (see figure 2). In West TN, groundwater supplies water to mostly municipalities and industry (i.e., Shelby County), but the five highest consumers of groundwater for agriculture in the State are all in West TN (see Figure 3). Additionally, of the three major cities adjoining the Mississippi River, only Memphis obtains its drinking water solely from groundwater – St. Louis, Missouri and New Orleans, Louisiana pull their drinking water from the Mississippi River. Largest usage of groundwater in Middle and East TN is by municipality (Carter and Hamilton counties) and industry (Hamilton County) (see figure 3).
Figure 2. Total fresh groundwater withdrawals in 2015 (USGS – unpublished)

11
Figure 3. Largest consumer of fresh groundwater in the State of Tennessee in 2015, by municipalities, agriculture and industry (USGS unpublished).
The utility of groundwater as an invaluable, high-quality supply to municipalities, industries and agriculture highlights Tennessee’s reliance on it as a shared resource. As Tennessee looks to the future of its water resources into 2040, sustainability of our groundwater resources as a shared resource is vastly important. Not any single use category holds a greater weight of apportionment; therefore, it is incumbent on all Tennesseans, policy makers, utility districts, and elected officials to develop a mechanism whereby all may benefit from this great resource while ensuring its availability and great quality for future generations.
Tennessee recognizes that its groundwater resources, though a shared resource within its borders, are also demanded upon by externalities outside of Tennessee. Groundwater flow is not governed or dictated by political boundaries. It flows across jurisdictions, watershed boundaries, and county lines as well as between our neighboring states. As such, Tennessee’s concept of groundwater sustainability must account for its internal shared demands and those imposed external to its borders. This water plan seeks to address these various factors in the forthcoming sections and chapters.

12
Groundwater Overview
Geology Tennessee’s groundwater is impacted by its geology, which in part is directly related to its topography; the general configuration of the earth’s surface, including its relief and the location of its natural features. On the basis of distinct differences in topography, the state is divided into eight regions called physiographic provinces, as shown below. The State of Tennessee is subdivided into three Grand Divisions: West, Middle and East. Likewise, the physiographic provinces approximate these Divisions (see figure 4).
Figure 4. Physiographic Provinces of Tennessee
Though not a direct correlation, these physiographic provinces are also related to the state’s complex geology, as shown on the generalized geologic map of Tennessee. From the perspective of the three Grand Divisions, the State’s geology illustrates three major feature types which in turn result in key groundwater system differences. In West TN, the geology is comprised of unconsolidated sediments, thus non-cohesive sands, gravels, silts, and clay. In the broadest sense, these sediments exist in layers akin to a stack of flapjacks. Moving eastward toward Decatur, Benton and Hardin counties, these unconsolidated sediments thin as the deep underlying consolidate rock rises to the surface just before the Tennessee River. These rocks are comprised mostly of limestone, the result of deep ocean compression of skeletal remains of corals and shell creatures, that in TN have become exposed to weathering by rain and wind. Over millions of years, rain water dissolved solution channels or openings into the weaker limestone called karst. At ground surface, some dissolution has resulted in the formation of sinkholes where the underlying karst (cave) structure has collapsed forming a funnel-like hole at the surface. These limestone and other deposits comprise much of Middle and East TN. As shown in figure 5, the presence of rock formations in East TN changes dramatically compared to their counterparts in Middle TN. In East TN, the rocks follow a more north-south striation orientation. This is the Appalachian Mountains. Once extending from Canada into Texas, they now terminate in central Alabama. This perceived striation results in the rocks being in tight layers in a greater vertical orientation unlike the horizontal layering of the unconsolidated sediments in West TN. In far east TN, there exist metamorphic rocks that are comprised of fractures, not solution channels.

13
Figure 5. Rock Formations
Groundwater, water that is stored underground within the geologic material, is a part of a larger system called aquifers. An aquifer is a geologic formation capable of storing and transmitting water for its intended use. Similar to the three major geology types of Tennessee, aquifers are divided into three main types: unconsolidated sediment like sands and gravels, karst or caves, and fractured rock. As can be seen, Tennessee is host to all three aquifer types. Each aquifer type stores and transmits water differently. For example, groundwater moving through the sand aquifers beneath much of West TN is much slower (days to years) when compared to the karst aquifers in Middle and East TN (hours to days) over the same distance. This expediency of flow also has an impact on water quality whereby contaminant movement within the respective systems is slow or fast.
West TN Geology A special discussion on West TN geology is presented due to the large exploitation of groundwater in this region. As will be discussed in the next section, groundwater withdrawal in TN is greatest in West TN. West TN geology is part of a much larger geologic framework called the Mississippi embayment (ME). The ME is a geologic region underlying portions of eight southern United States with the majority of coverage occurring in TN, MS and AR (figure 6). The ME in TN underlie West TN or 21 counties. The aquifer systems in West TN follow a pancake-like geology where horizontal layers of aquifer are separated by layers of clay (figure 7). The ME was actually the product of tectonic forces that vastly altered the landscape of the United States.

14
Figure 6. Placement of Mississippi embayment in the southern United States.

15
Figure 7. Cross-section of the Mississippi embayment taken from A-A’ as depicted in figure 6. (Modified from
Brahana and Broshears, 2001.) As mentioned before, the Appalachian Mountain range extended from the northeast downward through Tennessee before curving west into Texas1. The central United States drained north and west, not southward into the Gulf of Mexico. As the mid-Atlantic rift continued to expand the size of the Atlantic Ocean whilst the Pacific oceanic plate subducted beneath the North American continent thus shrinking the size of the Pacific Ocean, a section of North America rode atop a hot spot, or shallow magma plume. Once underneath the southeast United States, deep crustal fractures that resulted from the continental collision that first formed the Appalachian Mountains allowed magma to push upwards into the North America continental plate thus, in
1 B Van Arsdale, Roy & Cox, Randel. (2007). The Mississippi's Curious Origins. Scientific American. 296. 76-82, 82B. 10.1038/scientificamerican0107-76.

16
combination with the hotter thermal temperatures, causing the entire land surface to rise. Erosion caused by wind and rain whittled down this high land mass expanse. Yet, the dynamics of the Atlantic and Pacific systems continued. When the North America continent moved off the hot spot, the land cooled and subsided, thus allowing the ocean to wash inland to as far north as the southern tip of Illinois. The continuity of the Appalachian Mountains between Alabama and Texas was lost, and the ancestral Mississippi River now flowed southward into the Gulf of Mexico. Over the next 65 million years, transgression and regression of the ocean deposited layers of sand and clay. Additional deposition by rivers also deposited sands and gravels. This long process produced the prolific aquifer systems that comprise West TN geology. The hot spot still exists, today, but is now in the Atlantic Ocean. This shallow magma plume is called the Bermuda hot spot because it is what is forming the islands of the Bermuda Triangle.

17
Figure 8. Geologic Time Scale for Tennessee
Basic Geologic Terminology
• Basalt – fine-grained, dark, igneous rock that originated as lava. • Cambrian – rocks between 488 and 542 million years old, commonly limestones and shales in Tennessee • Carbonate – sedimentary rock composed of or containing calcium or magnesium carbonate, such as
dolomite or limestone. • Chert – hard, extremely dense sedimentary rock consisting primarily of submicroscopic silica, usually
found in layers and nodules in limestones and dolomites, and persisting on the surface after the enclosing beds decompose
• Clay – extremely fine-grained, natural, earthy material, commonly unconsolidated but less permeable to the flow of groundwater
• Conglomerate – sedimentary rock composed of rounded to subangular fragments larger than 2 mm in diameter set in a fine-grained matrix of sand or silt.
• Cretaceous – rocks between 65.5 and 145.5 million years old, commonly sands, gravels, and siltstones in West Tennessee only

18
• Devonian – rocks between 359 and 416 million years old, commonly shales or limestones in Tennessee • Dolomite – sedimentary rock consisting primarily of the mineral dolomite (calcium magnesium
carbonate) • Granite – coarse-grained, light to medium-colored igneous rock, often with a salt-and-pepper
appearance • Gravel – unconsolidated, natural accumulation of rounded rock fragments, usually deposited by streams
and rivers, consisting primarily of pebbles and small stones • Igneous rocks – formed from the solidification of molten or partially molten material, including
crystalline rocks such as basalt and granite • Limestone – sedimentary rock consisting primarily of the mineral calcite (calcium carbonate) • Loess – wind-blown, silt-sized rock material, originally ground by glacial ice • Metamorphic rocks – rocks that have been recrystallized by heat and pressure and have commonly
developed a “grain” or a preferred direction of breaking. • Metasedimentary – metamorphic rocks derived from sediments or sedimentary rocks. • Mississippian – rocks between 318 and 359 million years old, commonly limestones or shales in
Tennessee • Ordovician – rocks between 488 and 542 million years old, commonly limestones and dolomites in
Tennessee • Pennsylvanian – rocks between 299 and 318 million years old, commonly sandstones and shales in
Tennessee • Precambrian – rocks older than 542 million years, commonly sandstones and siltstones and the
metamorphic rocks of Tennessee’s eastern mountains. • Quartzite – metamorphic rock consisting mainly of the mineral quartz (silicon dioxide) formed from
sandstone or chert • Quaternary – rocks less than 2.6 million years old, primarily sands, gravels, and clays deposited by
present-day rivers • Regolith – layer of loose incoherent rock material, including soils, that underlies the surface of the land
and rests on bedrock. • Sand – rock fragment with a diameter from 1/16 to 2mm, usually quartz • Sandstone – sedimentary rock composed of cemented sand-sized fragments, primarily quartz • Sedimentary rocks – formed from the consolidation of loose sediment that has accumulated in layers,
including chert, dolomite, limestone, sandstone, shale, and siltstone • Shale – sedimentary rock composed of thin layers of clay and silt • Silt – rock particles with a diameter from 1/256 to 1/16mm • Siltstone – sedimentary rock composed of consolidated silt-sized particles • Silurian – rocks between 440 and 488 million years old, primarily sandstones and shale in East
Tennessee, limestones and shales in West Tennessee • Slate – compact, fine-grained metamorphic rock formed from shale • Tertiary – rocks between 2.6 and 65.5 million years old, commonly sands and shales, occurring in West
Tennessee only

19
Suggested Reading: Geology All of the following were published by the Tennessee Division of Geology, the name formerly given to the Tennessee Geological Survey
Bulletins 17. THE WATER POWER OF TENNESSEE (including a report on Doe River by A.H. Horton), 139 p., J.A. Switzer (1914). 20. THE LARGER UNDEVELOPED WATER-POWERS OF TENNESSEE, 35 p., by J.A. Switzer (1918). 34. WATER RESOURCES OF TENNESSEE, 909 + xvi p., 31 pls., 6 figs., W.R. King (1925). 38. THE STRATIGRAPHY OF THE CENTRAL BASIN OF TENNESSEE, 268 + x p., 49 pls., 4 figs., 4 maps, R.S. Bassler (1932). 40. SURFACE WATERS OF TENNESSEE, 165 + xii p., 29 tables, 21 pls., 35 figs., W.R. King (1931). Summary of water resources investigations, 1920-1930; stream flow records of principle rivers by weekly averages; flood records; power sites, etc. 42. PRELIMINARY REPORT OF THE ARTESIAN WATER SUPPLY OF MEMPHIS, TENNESSEE, 34 + iv p., by F.G. Wells (1931). 43. GROUND WATER OF NORTH-CENTRAL TENNESSEE, 238 +viii p., by A.M. Piper (1932). Reprinted (1993). Physiography, stratigraphy, and geologic structure of northern two-thirds of Nashville Basin and northwestern Highland Rim areas and their relations to ground water conditions; summary descriptions of conditions in each county, with tables of data of typical wells and springs. Same as U. S. Geological Survey Water-Supply Paper 640. 44. GROUND WATER RESOURCES OF WESTERN TENNESSEE, 319 + vii p., 16 pls.,18 figs., F.G.Wells (1933). Similar in scope to Bull. No. 43. Covers area west of Tennessee River. Ground-water resources of each county summarized with tables of data on flow, depth, water-bearing horizons, etc., logs of typical wells, and water analyses; colored geologic map. Same as U.S. Geol. Survey Water-Supply Paper 656. 46. GROUND WATER OF SOUTH-CENTRAL TENNESSEE, 182 + v p., 7 pls., 2 figs., C.V. Theis (1936). Companion volume to Bulls. 43 and 44. Covers southern part of Western Highland Rim and Central Basin. Same as U.S. Geol. Survey Water-Supply Paper 677. 56. PRE-CHATTANOOGA STRATIGRAPHY IN CENTRAL TENNESSEE, 415 + xx p., 28 pls., 89 figs., by C.W. Wilson, Jr. (1949). Second Edition, 1990. The Ordovician, Silurian, and Devonian sedimentary rocks of Central Tennessee and the western valley of the Tennessee River are described in detail, and work of earlier geologists in the area is carefully reviewed. Common fossils are shown in 26 plates, and numerous measured sections are reproduced in graphic columnar logs. 58-pt.1 GROUND-WATER RESOURCES OF EAST TENNESSEE, 393 + x p., 15 pls., 1 fig., 83 tables, by G.D. DeBuchananne and R.M. Richardson (1956). Text is principally tabular data for typical wells and springs in 28 counties; also discharge measurements of selected springs, and analyses of ground water. Plates

20
consist of 14 colored geologic maps on a scale of 1:125,000 (1 inch=2 miles), showing locations of wells and springs inventoried; one sheet of geologic cross sections. Text and maps (not available separately). 58-pt.2 GEOLOGIC MAP OF EAST TENNESSEE WITH EXPLANATORY TEXT, 168 + vi p., by John Rodgers (1953). 61. GEOLOGY, MINERAL RESOURCES, AND GROUND WATER OF THE CLEVELAND AREA, TENNESSEE, 125 + v p., 8 figs., 5 pls., 6 tables, by George D. Swingle (1959). Reprinted (1993). Prepared in cooperation with the U.S. Geological Survey. Stratigraphy, structural geology, mineral resources, and ground-water resources of a 240-square mile area in the Valley and Ridge province. Plates (in pocket) include 4 geologic maps (scale 1:31,680), a well and spring location map, and hydrographs of observation wells. 74. THE GEOLOGIC HISTORY OF TENNESSEE, 64 p., 47 figs., by Robert A. Miller (1974, with 1979 update). Reprinted (2008). Describes the relationship of rock units in Tennessee to modern topography and their historical record. Includes a description of life forms throughout geologic time in Tennessee, past environments of deposition, climate, mountain-building, and volcanism. 75. STRATIGRAPHY OF THE OUTCROPPING UPPER CRETACEOUS, PALEOCENE, AND LOWER EOCENE IN WESTERN TENNESSEE (INCLUDING DESCRIPTIONS OF YOUNGER FLUVIAL DEPOSITS), 125 p., 75 figs., 2 tables, 3 pls., 19 meas. sect., by Ernest E. Russell and William S. Parks (1975). Reprinted (2005) Includes colored geologic map in pocket (scale 1:250,000) prepared in cooperation with the U.S. Geological Survey. A description of the lithologic characteristics and stratigraphic relationships of the geologic units. 79. GEOLOGY OF HAMILTON COUNTY, TENNESSEE, 120 p., 56 figs., 15 tables, 2 plates, 8 contributors (1978). Includes papers on the stratigraphy, structure, mineral resources, coal mining and ground water.
86. TENNESSEE TOPOGRAPHY, 248 p., 64 figs., 3 tables, by David D. Starnes (2009). A study of the topography of Tennessee, including area data; high and low elevations; elevations of cities, towns, and rural communities; major topographic features; and a general description of the topography and water features of each of the state’s 95 counties. Includes topographic indexes for each county and measurements of land and water area and physiographic provinces; a summary of Tennessee’s physiographic provinces, general geology, and drainage basins, plus a brief discussion of topographic maps; 4 appendixes, a glossary, and a list of suggested readings and additional resources.
Reports of Investigations
1. GEOLOGIC SOURCE AND CHEMICAL QUALITY OF PUBLIC GROUND WATER SUPPLIES IN WESTERN TENNESSEE, 69 p., by C.R. Lanphere (1955). Prepared in cooperation with U.S. Geological Survey. Source, daily pumpage, storage information, and complete chemical analyses of water from wells supplying 62 towns in 21 West Tennessee counties. 4. GROUND WATER IN THE CENTRAL BASIN OF TENNESSEE, 81 + v p., by Roy Newcome, Jr. (1958). Reprinted (1998) A progress report on underground water conditions, prepared in cooperation with U.S. Geological Survey. Contains, in tabular form, records of more than 600 wells in 17 Middle Tennessee counties.

21
6. CRETACEOUS, PALEOCENE, AND LOWER EOCENE GEOLOGIC HISTORY OF THE NORTHERN MISSISSIPPI EMBAYMENT, 24 p., (reprinted from Bulletin of the Geological Society of America, 1957), by Richard G. Stearns (1958). 7. GEOLOGY OF GROUND-WATER RESOURCES OF THE DYERSBURG QUADRANGLE, TENNESSEE, 61 p., 10 figs., 3 pls., 5 tables, by Raymond L. Schreurs and Melvin V. Marcher (1959). Prepared in cooperation with the U.S. Geological Survey. Geology, hydrology, and water resources of a 240-square-mile area in the Mississippi Embayment. Plates (in pocket) include a geologic map in color (scale 1:63,360) with cross sections, a physiographic map in color, and a water resources map. 44-pt I THE KARST HYDROGEOLOGY OF THE CUMBERLAND PLATEAU ESCARPMENT OF TENNESSEE, 43 + ix p., 21 figs., 1 table, 5 plates, by Nicholas C. Crawford (1987). This report deals with the subterranean stream invasion, conduit cave development, and slope retreat in the Lost Creek Cove area of White County, Tennessee. 44-pt II THE KARST HYDROGEOLOGY OF THE CUMBERLAND PLATEAU ESCARPMENT OF TENNESSEE, 41 + ix p., 17 figs., 2 tables, 2 plates, by Nicholas C. Crawford (1989). This report deals with the subterranean stream invasion, conduit cave development, and slope retreat in the Grassy Cove area of Cumberland County, Tennessee. 44-pt IIITHE KARST HYDROGEOLOGY OF THE CUMBERLAND PLATEAU ESCARPMENT OF TENNESSEE, 23 + viii p., 11 figs., 1 table, by Nicholas C. Crawford (1992). Deals with karst valley development in the Lost Cove area of Franklin County, Tennessee. 44-pt IVTHE KARST HYDROGEOLOGY OF THE CUMBERLAND PLATEAU ESCARPMENT OF TENNESSEE, 143 + ix p., 64 figs., 13 tables, by Nicholas C. Crawford (1996). Details the completion of a valuable 4 part research project in karst hydrogeology of the Cumberland Plateau escarpment in East Tennessee. Outlines instrumentation of drainage systems. Discusses water sample data. Explains methods used in water and suspended sediment analysis.
Information Circulars4. IRRIGATION IN TENNESSEE IN 1955, 7 p.,by E.M. Cushing and R. M. Richardson (1957). Prepared in cooperation with U.S. Geological Survey. Mostly tabular data, by counties, on total number of irrigation systems, type and quantity of water used, and acres irrigated.
Environmental Geology Series
2. ENVIRONMENTAL GEOLOGY SUMMARY OF THE KINGSTON SPRINGS QUADRANGLE, TENNESSEE, 24 p., 5 figs., 8 tables, 4 pls., by Robert A, Miller (1973). Reprinted (1993). Maps show areal geology, structure, economic geology, areas of known flooding, potentially unstable slopes, and water availability. Text includes rock and soil unit description and basic engineering characteristics, hydrologic data, and topographic data. Rock and soil units are rated on the basis of suitability for certain classes of land-use.
Journal Publications
A PALEOAQUIFER AND ITS RELATION TO ECONOMIC MINERAL DEPOSITS: THE LOWER ORDOVICIAN KINGSPORT FORMATION AND MASCOT DOLOMITE-A Symposium; Economic Geology, Geology, v. 66, no. 5, Aug. 1971. A symposium of 14 papers.
Miscellaneous Charts

22
Chart 1. Ground Water Investigations-SUBSURFACE GEOLOGIC CROSS SECTION FROM CLAYBROOK, MADISON COUNTY TO MEMPHIS, SHELBY COUNTY, TENNESSEE, by Robert Schneider and R.R. Blankenship (1950). Chart 5. Ground-Water Investigations-STRUCTURE CONTOUR MAP ON TOP OF THE KNOX DOLOMITE IN MIDDLE TENNESSEE, size 19x26 inches, by Roy Newcome, Jr. (1954). Contour interval 100 feet. Prepared in cooperation with the U.S. Geological Survey.
Groundwater Availability and Use Groundwater produced by public-water systems in Tennessee provided drinking water to more than 2.2 million Tennesseans in 2015. Twenty-one percent of the water withdrawal in the State (exclusive of thermoelectric use) is groundwater. In 2015, groundwater provided more than 298 million gallons per day (mgd) for public and rural-domestic supplies, nearly 52 mgd to self-supplied industries, and more than 60 mgd for irrigation, aquaculture and livestock uses. In West Tennessee, nearly all public supplies, industries, and rural residents use groundwater; Memphis is completely dependent on groundwater for public, industrial, and agricultural needs. Groundwater is also an important resource in Middle and East Tennessee, and is used primarily for domestic and agricultural water supplies in Middle Tennessee. In East Tennessee, groundwater is relied on for public drinking water supplies throughout the Valley and Ridge including large water systems near Chattanooga and in the Tri-Cities area of northeast Tennessee. Differing physiography and geologic features in Tennessee cause significant differences in groundwater conditions. The Coastal Plain province of West Tennessee is underlain by unconsolidated sand, gravel, and clay that dip to the west and contain water in intergranular openings. The Highland Rim and Central Basin in Middle Tennessee and the Western Valley are underlain by nearly horizontal lying carbonate rocks that contain water in solution-enlarged openings (termed karst). The Cumberland Plateau is underlain by sandstone, conglomerate, and shale. The Sequatchie Valley and the Valley and Ridge province of East Tennessee are underlain by intensely faulted and folded limestone, dolomite, sandstone, and shale. Water exists in fractures, faults, and bedding-plane openings. The mountains of the Blue Ridge province are underlain by massive crystalline and metasedimentary rocks which contain water in fractures. The areal distribution of the principal aquifers in Tennessee is shown in figure 9. The aquifer descriptions are modified from Bradley and Hollyday (1985).

23
Figure 9. – Principal aquifers in Tennessee. Modified from Bradley and Hollyday, 1985 METHODS AND DATA SOURCES The estimates for water use in Tennessee are compiled every 5 years as part of the United States Geological Survey (USGS) National Water-Use Program (USGS 2018a) and in cooperation with the Tennessee Department of Environment and Conservation (TDEC). The methods used in compiling and estimating water withdrawals are described in Bradley (2017) and Robinson (2018). Public-water systems and self-supplied industries withdrawing more than 10,000 gallons per day report withdrawals by source to the TDEC’s Division of Water Resources (DWR). The reported data are compiled by the USGS and aggregated to the county level. Water-use data by county and source for 1985 – 2010 are available through the USGS National Water-Use Program (USGS 2018a) and the USGS National Water Information System (NWIS, USGS 2018b). Public-water supply and self-supplied industrial withdrawal data for 2015 were provided by TDEC-DWR and compiled by county and aquifer for the TN H2O report and in preparation for the 2015 compilation of water use in the United States by the USGS. Estimates for

24
the 2015 water use by public water supplies and for self-supplied domestic use are available in Dieter and Maupin (2017) and Dieter et al (2017). PRINCIPAL AQUIFERS Tennessee has nine principal aquifers that are relied on to supply drinking water. Eight of the nine aquifers are used for public supply, domestic supply and agricultural and industrial water supply. The principal aquifers in Tennessee are:
• Alluvial aquifer (primarily the Mississippi River alluvial deposits and the alluvial deposits west of the Tennessee River valley;
• Tertiary sand aquifers of West Tennessee that includes the Memphis aquifer which provides the most water and is the most important aquifer in Tennessee (the deeper Fort Pillow aquifer is also one of the Tertiary sand aquifers);
• Cretaceous sand aquifer in West Tennessee; • Pennsylvanian sandstone aquifer which provides water from fractures and cracks in the rocks of
the Cumberland Plateau; • Mississippian carbonate aquifer which includes the limestones of the Western and eastern
Highland Rim; • Ordovician carbonate which includes the limestones in the Central Basin; • Knox aquifer in Middle Tennessee (the Knox aquifer is a deep unit, 750 to 1200 feet below land
surface and is typically only used for domestic water wells when the shallower formations do not provide enough water for a domestic water supply);
• Cambrian-Ordovician carbonate aquifers of the Valley and Ridge in East Tennessee; and • Crystalline rock aquifer of the Blue Ridge mountains in East Tennessee.
ALLUVIAL AQUIFER The alluvial aquifer underlies the flood plain of the Mississippi River and its tributaries and the southern end of the Western Valley of the Tennessee River. The alluvial aquifers, which consist of sand and gravel with interbeds of clay, are used primarily for rural-domestic supplies and for some irrigation, but do include some use for public water supply along the Tennessee River. The alluvial aquifers are capable of yielding more than 1,500 gallons per minute (gal/min) to wells depending on the thickness of sand and gravel in the aquifer. At the southern end of the Western Valley of the Tennessee River, the alluvial aquifer supplied 1.9 mgd for public supplies in Hardin and Henderson counties during 2015. The Mississippi River alluvial aquifer is an important source of irrigation in Lake, Dyer, and Lauderdale Counties. Data for the irrigated acres in Lake, Dyer, and Lauderdale counties were compiled from US Census and US Department of Agriculture for 1934 – 2012 (Robinson, 2018b). The three counties had the largest increase in irrigated acres from 2002 to 2012 for all of the counties in Tennessee: Lake 4,160 to 15,447 acres; Dyer 5,162 to 16,534 acres; and Lauderdale 2,330 to 13,165 acres (Robinson, 2018b). Although the Mississippi River alluvial aquifer only occurs under about 46% of Dyer County and 38% of Lauderdale County, the increase in irrigated acres is indicative in the increasing importance of irrigation from this aquifer. The water quality of the alluvial aquifer is generally good, but in some areas, iron

25
concentrations exceed 1.0 milligrams per liter (Bradley and Hollyday, 1985; Welch et al, 2009). The last published compilation of water use by aquifer in the United States was for 2000 (Maupin and Barber, 2005). In 2000, irrigation from the Mississippi River alluvial aquifer in Tennessee was 1.34 million gallons per day compared with more than 6.3 billion gallons per day for Arkansas and 1.3 billion gallons per day combined in both Missouri and Mississippi.
TERTIARY SAND AQUIFER SYSTEM The Tertiary sand aquifer is the most productive aquifer in Tennessee. The aquifer system underlies the western part of the Coastal Plain in West Tennessee and includes the Memphis Sand of the Claiborne Group and the Fort Pillow Sand of the Wilcox Group (Parks and Carmichael, 1989; Parks and Carmichael, 1990). The Tertiary sand aquifer consists of a sequence of interbedded sand and clay that ranges in thickness from 100 feet in the outcrop area where groundwater is unconfined to about 2,000 feet near the Mississippi River where the groundwater is confined. This aquifer supplies water to most industries and municipalities in West Tennessee. Major withdrawal centers include Memphis, Millington, Germantown, Jackson, Union City, and Dyersburg (figure 10). Well yields from the Tertiary sand aquifer commonly range from 200 to 1,000 gal/min and can exceed 2,000 gal/min. The Tertiary sand aquifer system supports about 85 public-water systems producing about 189 million gallons of water per day for more than 1.3 million Tennesseans. The Memphis aquifer is the most productive aquifer in this system, and is the most important aquifer in Tennessee. The Memphis aquifer is used to produce more than 159 million gallons per day for public-water systems used by more than 1.2 million people. Public-water systems that rely on the Memphis aquifer include Memphis Light Gas and Water, Jackson, Barlett, Collierville, Germantown, and Dyersburg. About 97 of the 120 groundwater based public-water systems in West Tennessee utilize groundwater from the Tertiary sand aquifer system.
CRETACEOUS SAND AQUIFER The formations of the Cretaceous sand aquifer are the McNairy and the Coffee Sands and the Tuscaloosa Formation. The Cretaceous aquifer supplies about 7 million gallons per day to about 64,000 people. Paris, Tennessee is the largest city utilizing the Cretaceous aquifers. The Cretaceous sand aquifer is used primarily in and near the outcrop area where it supplies water for municipal, industrial, and rural use. The aquifer crops out in the eastern part of the Coastal Plain and underlies the Tertiary sand aquifers to the west. Water in the aquifer is unconfined in the outcrop area and confined by the overlying Porters Creek Clay in the subsurface farther west. The Cretaceous sand aquifer is underlain by the Ordovician carbonate aquifer and Knox aquifer just west of the Tennessee River. Groundwater from the Cretaceous aquifers is generally of very good quality in the outcrop area with dissolved solid concentrations increasing down gradient to more than 1,000 milligrams per liter in parts of Shelby County (Brahana and others, 1986a). High iron concentrations occur in the Cretaceous aquifers in some areas.

26
PENNSYLVANIAN SANDSTONE AQUIFER The Pennsylvanian sandstone aquifer occurs in the Cumberland Plateau of Tennessee and includes sandstone and conglomerate. In 2015, the sandstone aquifers provided 0.37 million gallons per day to public-water systems supplying about 4,200 people. Several systems previously using groundwater have transitioned to a mix of groundwater and surface and/or purchased water from other suppliers. Groundwater use for public supply on the Cumberland Plateau was about 1.35 million gallons per day in 1990, 0.5 million gallons per day in 2000 and has decreased to 0.37 million gallons per day in 2015 (Hutson, 1995; Webbers, 2003). The water-bearing openings in these rocks consist of fractures, faults, and bedding-plane openings. Well yields generally are 5 to 50 gal/min, although some wells have been reported to produce more than 100 gal/min. The quantity of groundwater available from wells is highly variable from place to place and locally may not be sufficient for larger public-supply needs (Brahana et al, 1986b). Historically, some small public-water systems on the Cumberland Plateau have used the Pennsylvanian sandstones for a water supply (Alexander et al, 1984). The sandy soils and sandstone of the Cumberland Plateau have minimal buffering capacity so the groundwater can have high iron and high bacteria concentrations. (Bradley and Hollyday, 1985).
MISSISSIPPIAN CARBONATE AQUIFERS The Mississippian carbonate aquifers occur in the eastern and western Highland Rim in Middle Tennessee and are primarily limestone and dolomite. The limestone aquifers supplied about 17 million gallons per day in 2015 to public-water systems in Tennessee and was used by about 218,000 people. Groundwater use from the Mississippian aquifers by public-water systems exceeded 2 million gallons per day from Franklin, Lawrence, Lincoln, and Montgomery counties. The limestones are also important sources of drinking water for rural domestic users. Water in these aquifers occurs in solution-enlarged openings including fractures, bedding plains, and small to large caves (Brahana and Bradley, 1986). The limestones are overlain by regolith and soil that can be 30 to 100 feet thick. In some areas of the southeastern Highland Rim, gravel zones in the regolith yield as much as 400 gal/min to wells and were used in the past to supply water in the Manchester area (Burchett and Hollyday, 1974). Groundwater in the limestone aquifers are confined to partly confined near land surface and may be confined at depth. The principal water-bearing formations of the Mississippian carbonate aquifer are the Ste. Genevieve, Monteagle, St. Louis, and Warsaw Limestones and the Fort Payne Formation. The Chattanooga Shale underlies the Mississippian formations. In places where the Chattanooga Shale is within about 200 to 250 feet below land surfaces, wells that drill into or near the Chattanooga Shale may encounter naturally occurring hydrocarbons, radionuclides and high trace metal concentrations. The Mississippian carbonate aquifers are connected to land surface by caves and sinkholes in many areas; thus, they are susceptible to contamination. In general, the water hardness exceeds 200 mg/L as calcium carbonate. In the Highland Rim, iron and sulfate concentrations in water from the Mississippian carbonate aquifer may exceed 0.30 and 500 mg/L, respectively (Brahana and Bradley, 1986).

27
ORDOVICIAN CARBONATE AQUIFERS The Ordovician carbonate aquifer is composed of limestone and dolomite in the Central Basin of Middle Tennessee. In 2015, the Ordovician limestones provided about 2 million gallons per day to public-water systems supplying about 75,000 people. The Ordovician aquifers were used for public-water supply during 2015 in DeKalb, Williamson, and Wilson counties. Several of the public-water systems using groundwater from the Ordovician aquifers also use surface water or purchase water from other systems. These aquifers are sources of drinking water for rural domestic water supplies. The Ordovician aquifers are composed of limestone and dolomite, with small amounts of shale. The principal water-bearing formations of the Ordovician carbonate aquifer are the Bigby, Carters, Ridley, and Murfreesboro Limestones (Brahana and Bradley, 1985). Water in these carbonate aquifers occurs in solution-enlarged openings and is unconfined to partly confined near land surface; water may be confined at depth. The regolith overlying the limestone is much thinner in the Central Basin and in places may be less than 3 feet thick with bedrock exposed at land surface. The Ordovician carbonate aquifers are connected to land surface by caves and sinkholes in many areas and are susceptible to contamination. Because of the thin regolith and presence of karst features (sinkholes, disappearing streams and caves), the groundwater from the aquifer can have high concentrations of nutrients and bacteria. The connection between the sinkholes and other karts features and surface water can result in flooding at sinkholes and impact the water quality of the aquifer (Bradley and Hileman, 2006)
KNOX AQUIFER The Knox aquifer underlies Middle Tennessee and parts of West Tennessee (Brahana and Bradley, 1985; Newcome and Smith, 1962). The Knox is not used as for a public-water supply, but does provide an important source of domestic water supply in areas where the shallower aquifers do not provide sufficient groundwater. Water in the aquifer flows through interconnected solution openings and along bedding planes in the upper two formations of the Knox Group at depths of about 700 to 1,500 ft. Although the aquifer is not a principal aquifer in terms of significant numbers of users or in providing large amounts to single users, it does provide water for rural-domestic use where groundwater cannot be obtained at shallower depths. Water well data reported by well drillers to the TDEC Water Well program indicates that about 5% of the rural domestic wells installed in the Central Basin are installed to depths greater than 700 feet. Water from the Knox aquifer typically has fluoride concentrations that exceed 2 to 3 milligrams per liter and in rare cases may exceed the proposed maximum contaminant level of 4.0 mg/L (TDEC 2016). Sulfate concentrations that exceed 500 mg/L and sulfide gas are problems in some areas. Dissolved-solids concentrations in water from the Knox aquifer may exceed 10,000 mg/Lin areas outside the Central Basin (Brahana and Bradley, 1985).
CAMBRIAN-ORDOVICIAN AQUIFER SYSTEM The Cambrian- Ordovician Aquifer System includes the limestone, dolomite, sandstone, and shales in the Valley and Ridge province of East Tennessee (DeBuchananne and Richardson, 1956). In 2015, the aquifers in the Valley and Ridge were the second most used groundwater system in Tennessee. Public-water systems in East Tennessee produced about 39 million gallons per day to supply water to about

28
565,000 people. Major areas of groundwater withdrawal in 2015 occur for public-water systems in Bradley (2.2 million gallons per day), Carter (5.9 million gallons per day), Hamilton (11.1 million gallons per day), and Washington (2.7 million gallons per day) counties. The primary aquifers are the limestone and dolomite formations (Hollyday and Hileman, 1996). The aquifer consists of extensively faulted limestone, dolomite, sandstone, and shale. The principal water-bearing units are carbonate rocks of the Chickamauga Limestone, the Knox Group, and the Honaker Dolomite of the Conasauga Group (Brahana et al, 1986). Some wells that penetrate large, extensive, and interconnected solution openings yield as much as 2,000 gal/min. The hardness of the water in the Cambrian-Ordovician carbonate aquifer generally exceeds 200 mg/L as calcium carbonate. Brines may be present below a depth of 3,000 feet.
CRYSTALLINE ROCK AQUIFER The crystalline rock aquifer of the Blue Ridge province includes fractured igneous, metamorphic, and metasedimentary rocks, and in some places, dolomite and limestone in karst valleys and coves along the western edge of the Blue Ridge province. Public water systems using groundwater from the aquifers in the Blue Ridge produced 0.2 million gallons per day in 2015 to supply about 1,650 people. The formations are also used for rural domestic water supplies. Wells and springs in dolomite yield more than 1,000 gal/min. Wells in the igneous and metamorphic rocks yield 5 to 50 gal/min from fractures. Some wells in regolith, which is present in some valleys, yield more than 100 gal/min. Iron concentrations that exceed 1.0 mg/L and pH of less than 6.0 are problems in several areas in the Blue Ridge province.
GROUNDWATER WITHDRAWALS Groundwater in Tennessee provided about 256 million gallons per day in 2015 for public-water systems and 2.28 million people. In 2015, public-water systems in 66 Tennessee counties used groundwater for public-water supplies with 36 counties withdrawing more than 1 million gallons per day from groundwater (table 1). Of those 36 counties, 17 were in West Tennessee, 9 in Middle Tennessee and 10 in East Tennessee.

29
Table 1. Tennessee counties withdrawing more than 1 million gallons per day groundwater for public-water supplies in 2015
[Data from TDEC – Division of Water Resources]
Population Served,
thousands Withdrawal, million
gallons per day Shelby County 935.250 146.93 Madison County 85.110 12.95 Hamilton County 86.851 11.06 Carter County 41.913 5.98 Obion County 30.474 4.62 Gibson County 38.455 3.80 Montgomery County 32.474 3.65 Tipton County 59.840 3.35 Lawrence County 34.819 2.87 Dyer County 36.437 2.71 Washington County 96.154 2.70 McNairy County 23.355 2.54 Lauderdale County 26.633 2.53 Carroll County 16.724 2.48 Weakley County 19.352 2.26 Franklin County 17.945 2.23 Bradley County 94.305 2.21 Hardeman County 13.656 2.20 Wilson County 21.159 2.12 Henry County 18.394 2.11 Lincoln County 31.069 1.93 Hardin County 18.758 1.86 McMinn County 20.996 1.71 Macon County 19.753 1.70 Bledsoe County 4.658 1.66 Crockett County 12.908 1.56 Hamblen County 54.402 1.50 Haywood County 13.959 1.49 Fayette County 18.253 1.47 Unicoi County 16.074 1.46 Roane County 6.280 1.36 Lewis County 9.145 1.31 Humphreys County 8.884 1.24 Marion County 10.511 1.15 Lake County 4.767 1.11 Jefferson County 38.302 1.01

30
Groundwater withdrawal data were compiled from TDEC- Division of Water Resources and used to estimate withdrawal from the principal aquifers in Tennessee for the 2015 USGS compilation. The data were further divided to estimate withdrawals form the Memphis and Fort Pillow aquifers of the Tertiary Sand aquifer system and the alluvial aquifers. Groundwater withdrawals for public-water systems in Tennessee in 2015 are listed in table 2. The Memphis Sand of the Tertiary Sand aquifer system is the most important aquifer in Tennessee and provided 159 million gallons per day for public-water supply in West Tennessee in 2015. The carbonates aquifer in the Valley and Ridge of East Tennessee was the second most used aquifer in Tennessee providing about 36 million gallons per day for public-water supply (table 2). The distribution of public-water systems across Tennessee utilizing groundwater is shown in figure 10. Table 2. Withdrawals from the principal aquifers by public-water systems in Tennessee, 2015
[Data compiled from TDEC – Division of Water Resources]
Aquifer System
Withdrawals in million gallons per
day Alluvial Aquifers Mississippi River alluvial aquifer 0 Western Valley of the Tenn. River 1.87 Tertiary sand aquifer system Memphis aquifer 159 Fort Pillow aquifer 2.97 Tertiary undifferentiated 26.54 Cretaceous sand aquifer system 6.95 Mississippian carbonate aquifer system 16.63 Ordovician carbonate aquifer system 2.4 Knox aquifer, Middle Tennessee 0 Pennsylvanian sandstone aquifer system 0.37 Valley and Ridge aquifer system 36.2 Blue Ridge aquifer system 2.94

31
Figure 10. Distribution public-water systems withdrawing groundwater from the regional aquifers in
Tennessee (Modified from Water Resources Technical Advisory Committee, 2015)

32
GROUNDWATER MONITORING AND WATER-LEVELS Groundwater withdrawals for public supply, industrial supply and irrigation will result in short-term and long-term declines in groundwater levels. The deepening of groundwater levels due to pumping can result in adverse hydrologic and economic impacts (Alley et al., 1999). Groundwater observation wells are utilized to monitor the changing groundwater levels, identify short-term and long-term trends in groundwater levels due to climatic change, and aid in evaluations on the impacts of groundwater withdrawals. In Tennessee, groundwater monitoring occurs primarily in Shelby County and is very sparse through the rest of the State. Statewide, observation wells used to monitor groundwater levels decreased steadily from 26 in 1970 to a low of only 7 wells across Tennessee in 2000. Since 2000, additional observation wells have been added in cooperation with Hixson and Savannah Valley Utility Districts, Arnold Air Force Base, TDEC, and the USGS Groundwater Monitoring Program. Currently in 2018, outside of Shelby County, there are 11 observation wells across Tennessee. However, 5 of the 11 wells are located in Hamilton County. The distribution of observation wells through time and the areas in Tennessee with no water level data available to evaluate drought conditions or pumping effects are shown in figure 11. Hydrographs for selected observation wells across Tennessee are shown in figure WL1. The water levels show the effect of climatic conditions and the effect of local pumping in Coffee and Hamilton counties. The evaluation and number of observation wells does not include local networks or short-term observation wells where data are not readily available to water-resources agencies or the general public. Water level data and location of observation wells were compiled from the Tennessee Active Water Level Network (USGS, 2018c) USGS National Water Information System (USGS, 2018b), and the National Groundwater Monitoring Network (ACWI, 2018).

33
Legend Location of observation well Regions in Tennessee with no observation wells to monitor groundwater levels.
Figure 11. Location of observation wells, outside of Shelby County, through time and regions not monitored in Tennessee.
2018
1990
2000
1970

34
Figure 12. Hydrographs for selected observation wells
in Tennessee July 2016 – May 2018

35
The Shelby County-Memphis area groundwater monitoring network is operated by the USGS in cooperation with Memphis Light, Gas and Water, Germantown, Tennessee, Arkansas Natural Resources Commission, the National Groundwater Monitoring Network – Climate Response Network, and TDEC Division of Water Supply. The network consists of 44 wells in Tennessee, eastern Arkansas, and northern Mississippi (figure 13). The water-level data in the Memphis area network (link to web page for network) show the long-term drawdown associated with groundwater production in the area (figure 14). Groundwater use in Shelby County has decreased from a high of about 218 million gallons per day (public-supply and industrial) in 2000 to about 182 million gallons per day (public supply and industrial), and the network shows water levels rising due to the decreased pumping rates (figure 14).
Figure 13. Memphis area groundwater monitoring network, Tennessee, 2018

36

37
Figure 14. Hydrographs for two observation wells in Memphis, Tennessee showing long-term changes in water levels due to changes in groundwater withdrawals, 1908 – 2018.
SUMMARY Groundwater in Tennessee is a critical resource that is used for domestic, public, industrial, agriculture, and irrigation water supplies. In 2015, groundwater was used by public-water systems to supply more than 2.28 million Tennesseans. Groundwater withdrawals in 2015 were more than 298 million gallons per day (mgd) for public and rural-domestic supplies, nearly 52 mgd to self-supplied industries, and more than 60 mgd for irrigation, aquaculture and livestock uses. The principal aquifers in Tennessee provide water supply in West, Middle, and East Tennessee. West Tennessee is most dependent on groundwater with nearly all public-water systems, industry, domestic, and irrigation supplies utilizing groundwater. The Memphis aquifer of the Tertiary sands aquifer system is the most important aquifer in Tennessee. The Memphis aquifer provides 159 million gallons per day for public-water supplies, or about 62 percent of the total public-supply withdrawals from groundwater (256 million gallons per day) in Tennessee. The limestone aquifers in East Tennessee are the second most used aquifer system in Tennessee. In Tennessee the aquifers in East Tennessee produced more than 36 million gallons per day for public-water supplies. In 2015, public-water systems in 66 Tennessee counties used groundwater for public-water supplies with 36 counties withdrawing more than 1 million gallons per day from groundwater (table 1). Of those 36 counties, 17 were in West Tennessee, 9 in Middle Tennessee and 10 in East Tennessee.
Groundwater conditions in Tennessee are monitored by a series of observation wells across the State. The groundwater observation wells are utilized to monitor changing groundwater levels, identify short-term and long-term trends in groundwater levels due to climatic change, and aid in evaluations on the impacts of groundwater withdrawals. The groundwater monitoring network in Tennessee consists of about 44 wells in the Memphis, Shelby County area and a very sparse network of 11 wells across the rest of Tennessee, including 5 wells in Hamilton County. The network of wells in Shelby County show the long-term decline of water levels associated with groundwater production in the county even though during the past one to two decades there has been some rebound. Groundwater use for public and industrial supply in Shelby County has decreased from about 218 million gallons per day in 2000 to about 182 million gallons per day in 2018 and the groundwater levels are rising in response to the decreased pumping. The response of groundwater levels to drought, climate changes, and to groundwater withdrawals cannot be assessed in many parts of Tennessee due to the lack of observation wells. Though a direct correlation study does not exist, it is believed withdrawals have decreased due to water reclamation and reuse by industries, the use of energy efficient appliances, and a general reduction due to conservation measures by the citizens.

38

39
References ACWI, 2018, National Ground-Water Monitoring Network: Advisory Committee on Water Information,
Web page, version 2.1.1, https://cida.usgs.gov/ngwmn/ Alexander, F.M., Keck, L.A., Conn, L.G. and Wentz, S. J., 1984, Drought-related impacts on municipal and
major self-supplied industrial withdrawals in Tennessee – Part B: U.S. Geological Survey, Water-Resources Investigation 84-4074, 398 p.
Alley, W. M., Reilly, T. E., and Franke, O.L., 1999, Sustainability of Ground-Water Resources: U.S.
Geological Survey, Circular 1186, 79 p. https://pubs.er.usgs.gov/publication/cir1186 Bradley, Michael W., comp., 2017, Guidelines for preparation of State water-use estimates for 2015: U.S.
Geological Survey Open-File Report 2017–1029, 54 p., https://doi.org/10.3133/ofr20171029 Bradley, M.W., and Hileman, G.E., 2006, Sinkhole flooding in Murfreesboro, Rutherford County,
Tennessee, 2001–02: U.S. Geological Survey Scientific Investigations Report 2005–5281, 38 p, https://pubs.er.usgs.gov/publication/sir20055281
Bradley, Michael W., and Hollyday, Estes F., 1985, Summary of Tennessee ground-water resources, p.
391-396, in USGS, 1984, National Water Summary 1984, Hydrologic Events, Selected Water-Quality Trends, and Ground-Water Resources: U.S. Geological Survey, Water Supply Paper 2275, 467 p. https://pubs.er.usgs.gov/publication/wsp2275
Brahana; J. V., and Bradley, M. W., 1985, Delineation and description of the regional aquifers of
Tennessee--The Central Basin aquifer system: U.S. Geological Survey Water-Resources Investigations Report 82-4002. 35 p. https://pubs.usgs.gov/wri/wrir82-4002/
Brahana; J. V., and Bradley, M. W., 1985, Delineation and description of the regional aquifers of
Tennessee -- the Knox Aquifer in central and west Tennessee: U.S. Geological Survey, Water-Resources Investigations Report 83-4012, 32 p. https://pubs.er.usgs.gov/publication/wri834012
Brahana, John V. and Bradley, Michael W., 1986, Preliminary delineation and description of the regional
aquifers of Tennessee : the Highland Rim aquifer system: U.S. Geological Survey, Water-Resources Investigations Report 82-4054, 38 p. https://pubs.er.usgs.gov/publication/wri824054
Brahana, John V., Mulderink, D., and Bradley, M.W., 1986a, Preliminary delineation and description of
the regional aquifers of Tennessee; the Cretaceous aquifer system of west Tennessee: U.S. Geological Survey, Water-Resources Investigations Report 83-4039, 20 p., https://pubs.er.usgs.gov/publication/wri834039

40
Brahana, J.V., Macy, J.A., Mulderink, D., and Zemo, D., 1986, Delineation and description of the regional aquifer systems of Tennessee; Cumberland Plateau aquifer system: U.S. Geological Survey, Open-File Report 82-338, 25 p., https://pubs.er.usgs.gov/publication/ofr82338
Brahana, J.V., Mulderink, Dolores, Macy, J.A., and Bradley, M.W, 1986, Preliminary delineation and
description of the regional aquifers of Tennessee The East Tennessee aquifer system: U.S. Geological Survey Water-Resources Investigations Report 82-4091, 30 p
Burchett, C.R., and Hollyday, E.F., 1974, Tennessee’s newest aquifer [abs.]: Geological Society of America
Abstracts with Programs, Annual Meeting, v.6, no.1, p.338. DeBuchananne, G.D., and Richardson, R.M., 1956, Ground-water resources of East Tennessee:
Tennessee Division of Geology, Bulletin 58, pt. 1,393 p. Dieter, C.A., and Maupin, M.A., 2017, Public supply and domestic water use in the United States, 2015:
U.S. Geological Survey Open-File Report 2017–1131, 6 p., https://doi.org/10.3133/ofr20171131 Dieter, C.A., Linsey, K.S., Caldwell, R.R., Harris, M.A., Ivahnenko, T.I., Lovelace, J.K., Maupin, M.A., and
Barber, N.L., 2017, Estimated use of water in the United States county-level data for 2015: U.S. Geological Survey data release, https://doi.org/10.5066/F7TB15V5
Hollyday, E. F., and Hileman, G.E., 1996, Hydrogeologic Terranes and Potential Yield of Water to Wells in
the Valley and Ridge Physiographic Province in the Eastern and Southeastern United States: U.S. Geological Survey, Professional Paper 1422-C, 30p, https://pubs.er.usgs.gov/publication/pp1422C
Hutson, Susan S., 1995, Ground-water use by public-supply systems in Tennessee in 1990: U.S.
Geological Survey, Open-File Report 94-483, 1 plate, https://pubs.er.usgs.gov/publication/ofr94483 Maupin, M.A., and Barber, N.L., 2005, Estimated withdrawals from principal aquifers in the United
States, 2000: U.S. Geological Survey Circular 1279, 46 p., https://pubs.usgs.gov/circ/2005/1279. Newcome, Roy, Jr., and Smith, Ollie, Jr., 1958, Ground-water resources of the Cumberland Plateau in
Tennessee-A reconnaissance report: Tennessee Division Water Resources Series 1, 72 p. Parks, William S., and Carmichael, John K., 1989, Geology and ground-water resources of the Fort Pillow
Sand in western Tennessee: U.S. Geological Survey, Water-Resources Investigations Report 89-4120, 20 p., https://pubs.er.usgs.gov/publication/wri894120
Parks, William S., and Carmichael, John K., 1990, Geology and ground-water resources of the Memphis
Sand in western Tennessee: U.S. Geological Survey, Water-Resources Investigations Report 88-4182, 30 p., https://pubs.er.usgs.gov/publication/wri884182

41
Robinson, J.A., 2017, Water Use in Tennessee, 2010: U.S. Geological Survey data release, https://doi.org/10.5066/F7V9868K.
Robinson, J.A., 2018a, Public-supply water use and self-supplied industrial water use in Tennessee, 2010:
U.S. Geological Survey Scientific Investigation Report 2018–5009, 30 p., https://doi.org/10.3133/sir20185009
Robinson, J.A., 2018b, Irrigated acreage in Tennessee Counties, 1934 to 2012: U.S. Geological Survey
data release, https://doi.org/10.5066/F7833R7H. Tennessee Department of Environment and Conservation, 2016, Rules of Tennessee Department of
Envronment and Conservation, Division of Water Resources, Chapter 0400-45-01, Public Water Systems: TCA 0400-45-01-.01 through 0400-45-01-.41, 350 p., http://publications.tnsosfiles.com/rules/0400/0400-45/0400-45-01.20160605.pdf
USGS, 2018a, Water Use in the United States: U.S. Geological Survey web page
https://water.usgs.gov/watuse/, accessed May 18, 2018. USGS 2018b, National Water Information System: Web Interface, Water Use Data for Tennessee: U.S.
Geological Survey web page https://waterdata.usgs.gov/tn/nwis/wu, accessed May 18, 2018. USGS 2018c, Groundwater Watch, Tennessee Active Water Level Network: U.S. Geological Survey web
page https://waterdata.usgs.gov/tn/nwis/wu, accessed May 30, 2018. Webbers, Ank, 2003, Ground-water use by public water-supply systems in Tennessee, 2000: United
States Geological Survey, Open-File Report 2003-47, 1 plate, https://pubs.er.usgs.gov/publication/ofr0347
Welch, H.L., Kingsbury, J.A., Tollett, R.W., and Seanor, R.C., 2009, Quality of shallow groundwater and
drinking water in the Mississippi embayment-Texas coastal uplands aquifer system and the Mississippi River Valley alluvial aquifer, south-central United States, 1994–2004: U.S. Geological Survey Scientific Investigations Report 2009–5091, 51 p, https://pubs.usgs.gov/sir/2009/5091/
WRTAC, 2014, Statewide Analysis of Hydrologic and Water System Information—WRTAC
Recommendations: Water Resources Technical Advisory Committee, Final report to TDEC, 42 p.

42
Groundwater Recharge The fresh water aquifer systems of Tennessee find replenishment from the cyclic rains and melting snows year after year. A portion of the recharge to groundwater also discharges to surface water and maintains the base flow level of streams and is important for ecological flow conditions. Depending on the difference in river stage and surface water elevations in relation to shallow, near-surface groundwater elevations, these aquifers will also receive recharge from these surface features. Lastly, aquifers can actually recharge other aquifers as water moves slowly through the more resistive material (confining layers) that separates the aquifers. Of these recharge mechanisms, recharge by precipitation and surface water bodies offer the greatest means of replenishment to Tennessee’s aquifers.
Based on the differences in Tennessee geology, not surprisingly recharge rates and locations of direct recharge vary. In West Tennessee, which hosts the unconsolidated sediment aquifers comprised mainly of sand and gravel, recharge occurs as water slowly percolates through the small opening between the grains of sediment. In Middle and East Tennessee where a majority of the aquifers are comprised of consolidated rock, with caves and sinkholes (karst) and rock fractures that can be exposed at land surface, recharge is highly variable and primarily occurs through rock openings and solution channel conduits such as sinkholes with additional recharge percolating down through the soil zone. The importance of recharge in Middle and East Tennessee in supporting streamflow and ecological flows is discussed in the Surface Water section.
Groundwater Recharge in West Tennessee As discussed in the Groundwater Availability and Use subsection, the majority of groundwater withdrawn in Tennessee occurs in West Tennessee (about 283 million gallons per day, 66% of the State total). Depending on one’s location, the primary use aquifers may be unconfined or confined. When considering recharge by precipitation, infiltrating waters can only enter an aquifer when it is unconfined; therefore, it is not overlain by a layer of less permeable material. In such cases, the parent aquifer material such as the sands or gravels are exposed at the surface (i.e., in gullies or river valleys) or may be covered with topsoil which in West Tennessee is typically loess.
The key fresh water aquifers in West Tennessee are the Memphis, Fort Pillow, and McNairy aquifers. In the counties bordering the Mississippi River, these aquifers are confined; however, moving eastward these aquifers connect as they creep in the updip direction of the Mississippi embayment (see figure 15). Hence, they end up forming a band across West Tennessee that forms the recharge zone where precipitation replenishes these aquifers.

43
Figure 15. Band of units across TN forming recharge zone. (Lloyd and Lyke, 1995, figure 126)
As discussed previously, the Mississippi embayment is a large geologic area underlying portions of eight southern states. As such, the key aquifers of West Tennessee do not reside solely in Tennessee but extend into adjoining states. Yet unlike the rise and exposure of these aquifer materials to the surface along the embayment’s eastern flank, along the western flank, where some of these aquifers (and their counterparts) rise in the updip structure of the embayment, these aquifers are overlain by the Mississippi River alluvial aquifer: a sand/gravel unconfined aquifer used heavily by agriculture (see figure 16). Therefore, direct recharge by precipitation occurs mainly in the band such as seen in West Tennessee. Why is this important? These aquifers underlie multiple state boundaries and, where use within any single state is shared between municipalities, industry and agriculture, groundwater from these aquifers must also be shared between states. As the Mississippi River alluvial aquifer in Eastern Arkansas becomes depleted, farmers are extending wells into the Sparta (i.e., Memphis aquifer equivalent) that will strain this resource regionally; yet direct recharge of the Memphis aquifer by precipitation is in West Tennessee, not in Arkansas.

44
Figure 16. West-east cross-section showing aquifer rise exposure to surface (Lloyd and Lyke, 1995, figure 128)
To accurately ascertain groundwater sustainability in West TN, the mechanism and rate of recharge to the key aquifers in West Tennessee be determined. If we treat an aquifer as “the box” and the groundwater withdrawal as what leaves the box, how can this precious resource be managed if one does not know what goes into the box, that being the recharge component? Attempts have been made to numerically derive recharge rates through use of computer groundwater modeling2,3,4. Such methods offer an approximation, yet the derived recharge rates are assigned over large regions. Academic research is beginning to unravel the mechanism of recharge occurring within the band crossing West Tennessee. At a more local scale, water infiltrating into the subsurface can take tens to hundreds of years to reach groundwater along ridgelines, yet this timescale reduces to seasonal in the gullies and stream valleys (figure 17). Defining recharge at these smaller spatial and temporal scales will afford city planners and elected officials valuable information to direct growth that won’t drastically reduce natural recharge and encourage developers to employ building practices that promote recharge.
2 Brahana, J.V., and Broshears, R.E., 2001. Hydrogeology and Groundwater Flow in the Memphis and Fort Pillow Aquifers in the Memphis Area, Tennessee. U.S. Geological Survey Water-Resources Investigation Report 89-4131, 56 pp. 3 Arthur, J.K., and Taylor, R.E., 1998. Ground-water flow analysis of the Mississippi embayment aquifer system, south-central United States. U.S. Geological Survey Professional Paper 1416-I, 48 pp. 4 Clark, B.R., and Hart, R.M., 2009, The Mississippi Embayment Regional Aquifer Study (MERAS): Documentation of a groundwater-flow model constructed to assess water availability in the Mississippi Embayment: U.S. Geological Survey Scientific Investigations Report 2009-5172, 61 p.

45
Figure 17. Local recharge occurring at different timescales as dependent on spatial location.
Groundwater recharge in Middle and East Tennessee Recharge from precipitation to groundwater is an important component of the overall water budget and one that is difficult to directly measure. The groundwater recharge in Middle and East Tennessee supports the baseflow of streams and the groundwater use for water supplies. Groundwater use in Middle Tennessee is about 60 million gallons per day (14 % of the State total) and in East Tennessee about 86 million gallons per day (20 %). The amount of recharge varies through time with seasonal and annual changes in precipitation, varies regionally depending on the soil, aquifer characteristics, and topography, and can vary locally in the karst areas with direct recharge through sinkholes and disappearing streams in Middle and East Tennessee.
Streamflow can be used to estimate the components of direct overland flow and the baseflow groundwater discharge to streams. The baseflow of streams is supported by the movement of groundwater from the aquifers to maintain low flow in the Tennessee streams. The variability of the baseflow has been and mapped at regional scales by major aquifer and physiographic provinces in Tennessee (Bingham, 1986). The regional recharge to groundwater in Middle and East Tennessee were estimated as part of an investigation in cooperation with the Tennessee State Planning Office and Tennessee Department of Health and Environment. The investigation analyzed baseflow records for 63 basins to estimate recharge rates under high, average, and low flow conditions (Hoos, 1990). The results of the analysis are summarized in table 3 and identify some regional differences in recharge patterns in Middle and East Tennessee (Hoos, 1990). The Cumberland Plateau sandstone aquifers and the Central Basin carbonate aquifers have the lowest annual median recharge at about 5.7 and 5.8 inches per year. The low recharge rates are consistent with the characteristic thin soils and limited groundwater storage in the aquifers of those regions. The carbonate rock aquifers of the Highland Rim and the Valley and Ridge provinces have median annual recharge rates of 7.6 and 6.5 inches per year. The Blue Ridge region has the highest median annual recharge of 10.9 inches per year, due in part to higher rainfall in that region and the storage capacity of the alluvial deposits in the stream valleys.

46
Table 3. – Statistical summary of recharge rates during an average flow year by major aquifers in Middle and East Tennessee (from Hoos, 1990)
Province and major aquifer
Number of basin
estimates
Net annual recharge in inches per year Range Mean Median Standard
Deviation Highland Rim 14 4.9 – 9.8 7.4 7.6 1.7 Central Basin 15 4.1 - 7.8 5.6 5.8 1.0 Cumberland Plateau
9 4.3 – 8.9 6.5 5.7 1.8
Valley and Ridge
12 5.2-8.2 6.6 6.5 0.9
Blue Ridge 8 8.0-16.8 11.7 10.9 3.0 All aquifer 63 4.1-16.8 7.3 6.5 2.5
Recharge in specific areas and for different time frames will vary from the regional ranges determined by Hoos, 1990. Recharge in the Hixson area of Hamilton County, Tennessee was evaluated as part of a study of the groundwater resources for Hixson Utility District. A groundwater flow model had been developed and was used to evaluate the groundwater supply. Hixson Utility District was withdrawing 7.8 million gallons per day for public-water supply. The groundwater study identified recharge rates of 10.5 to 15 in/year based on hydrograph separation for streamflow (Haugh, 2002). The groundwater flow model for the Hixson area was calibrated with two zones of direct recharge of 8 in/year and 20 in/year. The high recharge rates are due to localized karst regions and an area of disappearing streamflow. Groundwater use in Hamilton County in 2015 was 16.3 million gallons per day, third highest for total groundwater use in Tennessee. Groundwater-monitoring at 5 wells in Hamilton County show the effects of short-term pumping, but do not show long-term decline in groundwater levels that would indicate groundwater withdrawals are exceeding recharge to the groundwater system. The water-level data for Hamilton County can be accessed at the Tennessee Groundwater Network web page (https://groundwaterwatch.usgs.gov/netmapT9L1.asp?ncd=TGN).
Recharge and Contamination The movement of water from land surface down through the soil zone to the water not only provides a source of recharge to groundwater, but also can transport contaminants from land surface and the soil zone down into the aquifer. Once in the aquifer, the contaminated groundwater can adversely impact drinking water supplies and require a significant expense and time for remediation, if remediation is even feasible. The variability of recharge and variations in the groundwater systems across Tennessee result in variations in the potential travel times for the movement of water and contaminants through the aquifers. If data were readily available for known contamination sites, the locations could be plotted relative to groundwater features of concern, such as recharge areas, wellhead protection zones, springs, sources-water areas, and domestic water wells. However, a single, unified data base for known

47
groundwater contamination does not exist. Individual databases exist for the separate types of contamination sites (CERCLA, RCRA, UST, etc.), but a single database is not available.
Groundwater contamination and the rates of groundwater movement vary across Tennessee. Studies on water-quality changes and the time-of-travel along groundwater flow paths in Fayette and Shelby County indicate that groundwater in West Tennessee varies with distance from the outcrop area and is affected by areas of high groundwater production and leakage from overlying aquifers (Kingsbury and others, 2017). Groundwater ages in the outcrop (recharge area) are years to decades and increase in age (centuries and millennia) to the west as the aquifer becomes confined and further removed from direct recharge. Areas with high groundwater production can result in recent water moving through breaches in an overlying confining unit (see figure 18) resulting in wells with a component of young water (< 30 years old) when groundwater ages of more than 500 years or even more than 2,000 years would be expected (Kingsbury and others, 2017).
In Middle and East Tennessee, similar studies on groundwater age and flow paths have not been consistently conducted. Samples have been collected from public-supply wells in East Tennessee as part of the USGS National Water Quality Assessment project (Lindsey and Belitz, 2016). The water-quality analysis indicated that tritium was present in all samples and that the water likely recharged the groundwater system since the 1960’s. Groundwater flow rates in fractured and karst systems in Middle and East Tennessee can be very fast with direct movement of water from land surface through fractures and sinkholes into the groundwater system. Flow rates have been measured as fast as 20,000 feet per day through a cave system (B. Miller USGS written communication 2018).
Figure 18. Genral groundwater age in the Memphis aquifer along an east-west flow path (modified from Kinsbury et al., 2017).

48
References Bingham, R. H., 1986, Regionalization of low-flow characteristics of Tennessee streams: U.S. Geological Survey Water-Resources Investigations Report 85-4191, 63 p. https://pubs.er.usgs.gov/publication/wri854191 Hoos, Anne B., 1990, Recharge rates and aquifer hydraulic characteristics for selected drainage basins in Middle and East Tennessee: : U.S. Geological Survey Water-Resources Investigations Report, 90-4015, 34 p. https://pubs.er.usgs.gov/publication/wri904015 Kingsbury, J.A, Barlow, J.R., Jurgens, B.C., McMahon, P.B., and Carmichael J.K, 2017, Fraction of young water as an indicator of aquifer vulnerability along two regional flow paths in the Mississippi Embayment aquifer system, southeastern USA: Journal of Hydrology, Vol 25, pp 1661-1678. https://doi.org/10.1007/s10040-017-1566-4 Lindsey, Bruce, and Belitz, Kenneth, 2016, Groundwater quality in the Valley and Ridge and Piedmont and Blue Ridge carbonate-rock aquifers, Eastern United States: U.S. Geological Survey Fact Sheet 2016-3079, 4 p., http://dx.doi.org/10.3133/fs20163079. Lloyd, O. and Lyke, W., 1995. Ground Water Atlas of the United States: Segment 10. U.S. Geological Survey Hydrologic Investigations Atlas 730-K, pp. 32.
Arthur, J.K., and Taylor, R.E., 1998. Ground-water flow analysis of the Mississippi embayment aquifer system, south-central United States. U.S. Geological Survey Professional Paper 1416-I, 48 pp.
Brahana, J.V., and Broshears, R.E., 2001. Hydrogeology and Groundwater Flow in the Memphis and Fort Pillow Aquifers in the Memphis Area, Tennessee. U.S. Geological Survey Water-Resources Investigation Report 89-4131, 56 pp.

49
Groundwater and Surface Water Connectivity Tennessee’s surface water bodies like lakes and perennial streams and shallow groundwater systems are intricately woven together. Climatic conditions, soil properties, water levels, along other natural and man-made factors directly impact the exchange of surface water and groundwater. Even though this is a common physical occurrence, little is known about the connectivity between surface water and aquifer systems in Tennessee. Understanding this relationship is critical in assessing short- and long-term effects on water quantity, water quality, ecosystem and habitat vitality, waste discharge and assimilation, and availability of clean drinking water. The interaction between surface water and groundwater varies greatly across the three geographic regions (East, Middle and West) in the State of Tennessee, each constituting about one-third of the state’s land area. These three geographic regions are also known as the Grand Divisions of Tennessee. Surface water and groundwater exchange in the West differs from that in the Middle and the East. In the West, landforms consist primarily of sands, gravels and silts that interact slowly with the aquifer system as water must travel a tortuous path between open spaces in the granules of soil. In the Middle and the East, the karst landscape comprised of unconsolidated sediments and fractured rock acts like a piping network that allows for a more rapid exchange with the aquifer system. Fractured rock has been widened by natural processes, providing storage and faster transmission of water. There are two primary ways that this interaction occurs. The flow of surface water into the groundwater system is defined as infiltration. The exchange in the opposite direction occurs from springs and base flow into the receiving lake or stream. Information about interaction is gathered from well logs, monitoring wells and surface stream gages. Understanding this interaction is important because what happens in one resource can directly impact the other. The exchange occurring between surface water and groundwater creates exposure to contamination. In the West, this exchange occurs over a period of years while in the Middle and East, this exchange can occur much quicker due to the karst terrain with its numerous underground features. Monitoring the interaction is complicated by our complex geology, data collection methods, the mysteries of groundwater, and no deliberate statewide baseline from which to judge the vigor of any interaction. The State of Tennessee does not require contaminate testing for private water sources; however, strict testing and treatment are required for public water systems.
Various Uses/Records Humans often affect this interaction between surface water and groundwater. For example, wells pumping an aquifer may cause spring flows and base flows to decline or even cease, affecting flow in surface streams. In extreme cases, pumping of an aquifer can cause the interaction between the aquifer and the stream to reverse: before pumping, water flowed from the aquifer to the stream; after

50
pumping, water flowed from the stream into the aquifer. Similarly, stream flow intercepted before it can infiltrate into an aquifer affects water levels and flow in the aquifer. The Grand Divisions of Tennessee contain portions of eight principal aquifers from which water is withdrawn in varying amounts for various purposes. The rate at which water is withdrawn from these eight aquifers varies from less than 1 million gallons per day (Mgal/d) in the Middle and Eastern regions to over 200 Mgal/d in the Western Region. In Tennessee, over 75% of the groundwater usage is for human consumption with the remainder being used by mining, industry, livestock and irrigation. In the Western Region, groundwater is the main source of drinking water.
Threats caused by this connectivity Surface water is abundant in Tennessee and serves numerous functions including groundwater recharge, public, agricultural, and industrial water supplies, waste assimilation, navigation, and biological habitat and species sustainability. Tennessee shares most of its major streams and river systems with neighboring states which makes them potential subjects for interstate water disputes. Surface water quality is impacted by point and nonpoint sources of pollution. Point sources include industrial and municipal wastewater discharge and confined animal feeding operations. Nonpoint sources include urban storm water runoff, erosion and sedimentation, and excessive nutrient runoff. Maintaining in-stream flows is an essential component of a sustainable water future and quality of life across Tennessee. Planning and implementation of best management practices are essential for sustainability of this vital resource. Surface water protection is accomplished through sustainable water-use policies and effective water quality regulations. Water quantity regulation is a state responsibility and must be based on sound scientific data and effective water-use policies. Water quality protection is a shared state\federal responsibility through enforcement of the Clean Water Act and other regulations. Recharge areas include locations where water infiltrates into an aquifer from a surface or sub-surface source. The recharge area for an unconfined alluvial aquifer is practically everywhere on the surface where water can vertically infiltrate. Recharge areas for confined aquifers are limited to areas where the aquifers are at the ground surface or near the surface covered by permeable materials. Identifying recharge areas throughout the three geographic regions of Tennessee is critical to understanding threats.
Considerations and Options Collection of surface water and groundwater data is essential to understanding the interdependence between the two. Surface water and groundwater data collection activities are on-going by Federal, state, and local entities including academia. The data collected are in a variety of formats and stored in numerous repositories. There is much duplication among data sets and the data repositories are not connected. Thoughtful consideration should be given to how these data will be collected, stored and

51
utilized in the future so that there is a more comprehensive understanding of the connectivity between surface water and groundwater. Consideration should be given but not limited to: 1. Implementing engineering features that allow infiltration where significant impermeable surfaces cover recharge areas. 2. Protection of recharge areas through recognition and preservation where aquifers are at or near the land surface or are not overlain by relatively impermeable confining layers. 3. Monitoring of surface water and groundwater withdrawals to ensure protection of human health and potable sources of groundwater. 4. Development of a comprehensive grid network of monitoring wells unique to each of the three regions of Tennessee. 5. Maintaining and expanding the surface water stream gaging network in strategic watersheds. 6. Simultaneous data collection proximal to the intersection of surface water and groundwater systems. 7. Funding and support for scientific assessments and initiatives. 8. Focused efforts on aquifer protection and groundwater policy development through comprehensive analyses of groundwater-use data.

52
Tennessee Agriculture and Groundwater Tennessee’s agricultural heritage runs deep, so much so that the word “Agriculture” is emblazoned in the very center of the Great Seal of the State of Tennessee. Agriculture is, in fact, the most important driver of Tennessee’s economy with more than 65,000 farms covering nearly 11 million acres. In 2015, agriculture and forestry employed more than 350,000 individuals, or 9.2% of the total number of workers (Murray 49-50). When multiplier effects are taken into account, agriculture and forestry contributed approximately $81.8 billion (12.8%) of the state’s total economic activity.
If future generations are to continue farming in Tennessee, today’s farmers must protect natural resources. Chief among these is an abundant and safe groundwater supply for irrigation. According to data from the USDA census and the USDA Farm Services Agency, Tennessee had between 146,000 and 198,000 irrigated acres in the years from 2012 to 2017. (2012 USDA Census of Agriculture, Leib). The vast majority of on-farm irrigation from groundwater in Tennessee occurs in West Tennessee and is supplied by the Memphis aquifer. This amazing natural resource underlies approximately 7,400 square miles (or 4.74 million acres) of West Tennessee (Parks and Carmichael, 1988). Given that as many as 198,000 of these acres are irrigated farm land, we can conclude that approximately 4.2% of the land above the aquifer is being irrigated. However, the effect this may have on Memphis aquifer is largely unknown.
The cost of irrigation, both in financial terms and in terms of the depletion of natural resources, requires water conservation efforts, particularly within the current market conditions agriculture faces. As agricultural use of irrigation has increased in recent years, Tennessee farmers have responded in several ways:
• Reducing the amount of natural resources needed to produce their crops – Data from the USDA Farm Services Agency shows a drastic reduction in new irrigated acreage in Tennessee in recent years. Further, Tennessee farmers have increased their use of center pivot irrigation systems, thereby reducing the amount of groundwater required for irrigation. According to the U.S. Census of Agriculture, the number of wells in Tennessee used for on-farm irrigation in 2013 was 1,472, compared to 14,670 such wells in Mississippi and 48,310 in Arkansas (USDA-NASS). Mississippi and Arkansas also have considerable acreage of furrow and flood irrigation, which uses more water per irrigated acre than center pivot irrigation. Mississippi and Arkansas wells pump far more water than Tennessee wells for agricultural use. Many of the irrigation companies that were in business in Tennessee have removed their operations from the state. Many experts on irrigation believe that the increase in center pivot irrigation systems in the last few years was due to increases in commodity pricing which has since changed. • Minimizing the impacts of pesticides on groundwater. Tennessee agricultural interests partnered together in the 1990’s and early 2000’s to incentivize pesticide storage facilities and provide training on proper handling, mixing, and storing of pesticides. An ongoing program is in place for the collection and disposal of waste agricultural pesticides and chemicals across Tennessee (TDA).
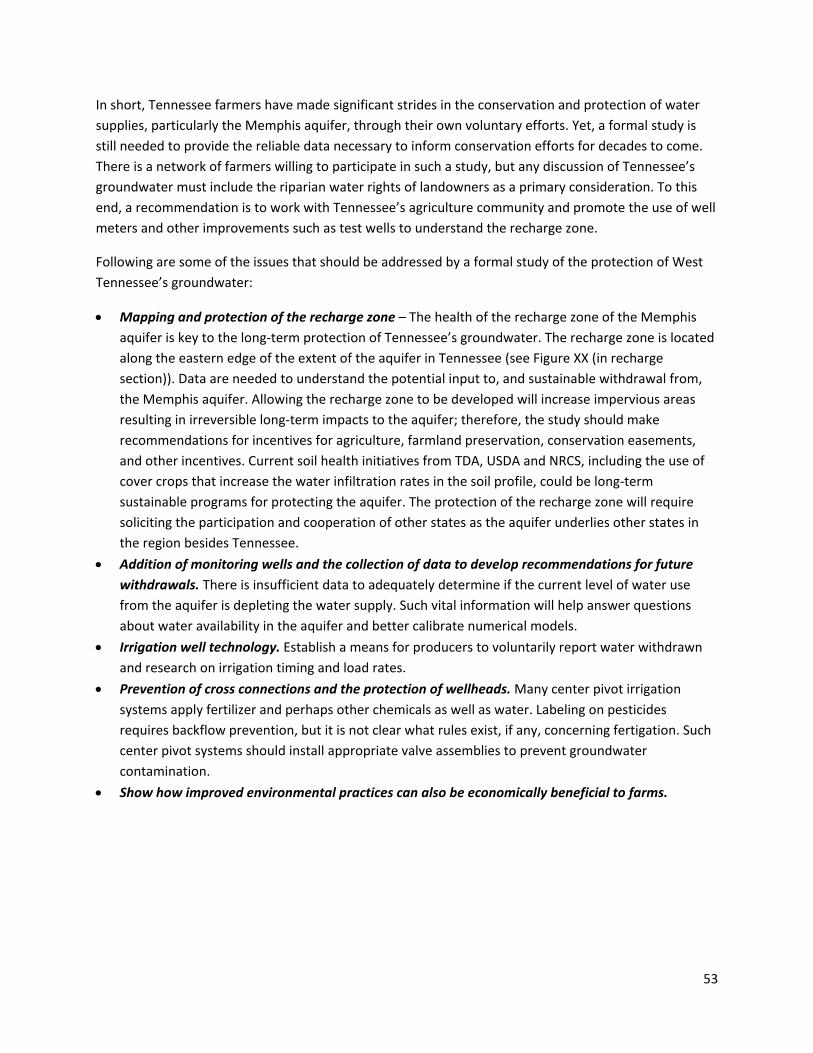
53
In short, Tennessee farmers have made significant strides in the conservation and protection of water supplies, particularly the Memphis aquifer, through their own voluntary efforts. Yet, a formal study is still needed to provide the reliable data necessary to inform conservation efforts for decades to come. There is a network of farmers willing to participate in such a study, but any discussion of Tennessee’s groundwater must include the riparian water rights of landowners as a primary consideration. To this end, a recommendation is to work with Tennessee’s agriculture community and promote the use of well meters and other improvements such as test wells to understand the recharge zone.
Following are some of the issues that should be addressed by a formal study of the protection of West Tennessee’s groundwater:
• Mapping and protection of the recharge zone – The health of the recharge zone of the Memphis aquifer is key to the long-term protection of Tennessee’s groundwater. The recharge zone is located along the eastern edge of the extent of the aquifer in Tennessee (see Figure XX (in recharge section)). Data are needed to understand the potential input to, and sustainable withdrawal from, the Memphis aquifer. Allowing the recharge zone to be developed will increase impervious areas resulting in irreversible long-term impacts to the aquifer; therefore, the study should make recommendations for incentives for agriculture, farmland preservation, conservation easements, and other incentives. Current soil health initiatives from TDA, USDA and NRCS, including the use of cover crops that increase the water infiltration rates in the soil profile, could be long-term sustainable programs for protecting the aquifer. The protection of the recharge zone will require soliciting the participation and cooperation of other states as the aquifer underlies other states in the region besides Tennessee.
• Addition of monitoring wells and the collection of data to develop recommendations for future withdrawals. There is insufficient data to adequately determine if the current level of water use from the aquifer is depleting the water supply. Such vital information will help answer questions about water availability in the aquifer and better calibrate numerical models.
• Irrigation well technology. Establish a means for producers to voluntarily report water withdrawn and research on irrigation timing and load rates.
• Prevention of cross connections and the protection of wellheads. Many center pivot irrigation systems apply fertilizer and perhaps other chemicals as well as water. Labeling on pesticides requires backflow prevention, but it is not clear what rules exist, if any, concerning fertigation. Such center pivot systems should install appropriate valve assemblies to prevent groundwater contamination.
• Show how improved environmental practices can also be economically beneficial to farms.

54
REFERENCES 2012 USDA Census of Agriculture. Retrieved from
https://www.agcensus.usda.gov/Publications/2012/Full_Report/Volume_1,_Chapter_1_State_Level/Tennessee/st47_1_011_011.pdf
Developing precision irrigation scheduling with a physiologically based or a substrate physical properties-based system for nursery production. Basiri Jahromi, N., F. R. Walker, A. Fulcher, and J. E. Altland. 2017. International Symposium on Growing Media, soilless Cultivation, and Compost Utilization in Horticu.
An Economic Report to the Governor of the State of Tennessee: The State’s Economic Outlook January 2018. Murray, Matthew N. Retrieved from http://cber.haslam.utk.edu/erg/erg2018.pdf.
Geology and Ground-water Resources of the Memphis Sand in Western Tennessee. Parks, W. S., and J. K. Carmichael. Water Resources Investigation Report 88-4182, U. S. Geological Survey.
Leib,Brian, UT Extension. Personal communication.
Tennessee Department of Agriculture website. Retrieved from https://www.tn.gov/agriculture/businesses/pesticides/ag-businesses-pesticide-collection.html.
USDA-NASS. Irrigation Wells Used on Farms. 2013.

55
Wellhead Protection Program Through numerous means such as illegal dumping, unintentional industrial spills, leaks from aging infrastructure, underground injection, and others, aquifers can become contaminated. Once contaminated, groundwater remediation is required, costing sometimes millions of dollars and taking years to clean. In an effort to be proactive toward contamination prevention, the State of Tennessee wellhead protection program (WHPP) was established following Environmental Protection Agency (EPA) protocols and enforcement through the Clean Water Act of 1972.
A wellhead represents the physical location of the well pumping groundwater from an aquifer. Through the WHPP program, two zones of protection are delineated around each wellhead. These zones represent times of travel; therefore, the time it takes a plug of groundwater to move at an average speed through the aquifer over some distance. Different rates of withdrawal result in different sized zones. The larger the withdrawal, the larger the zone of influence. Again, there are two zones of influence. The first zone, or Zone 1, represents a small distance from a wellhead whereby a contaminant released into the groundwater would very readily impact the well. Zone 1 is a critical zone. The second zone, or Zone 2, is a much larger delineated area where contaminates may take longer to reach a wellhead. Such contaminants might be able to be remediated before impacting a well.
To ascertain potential contamination of a wellhead, an annual survey of likely contaminant sources is performed within the Zone 2 delineation. There are numerous contaminant sources that pose a pollution threat to groundwater. An unexhaustive list is available at the TDEC Division of Water wellhead protection website. Some of the most common potential contamination threats are underground storage tanks such as those at every gas station, dry cleaners where solvents are used to chemically clean clothes, mechanic shops where there is oil, gas and other cleaning solvents, landfills where leachate may bypass the protective bottom liner, septic systems whereby e. coli and cryptosporidium create biologic hazards, and industries that formulate or store chemicals.
Much of groundwater contamination stems from the misuse and improper disposal of liquid and solid wastes; the illegal dumping or abandonment of household, commercial, or industrial chemicals; the accidental spilling of chemicals from trucks, railways, aircraft, handling facilities, and storage tanks; or the improper siting, design, construction, operation, or maintenance of liquid and solid waste disposal facilities. Generally, when the potential sources are used and managed properly, groundwater contamination is minimized or much less likely to occur.
Tennessee's WHPP also serves another vital role: city and regional planning benefit from incorporating current and future Zones 1 and 2 delineations into their planning process and suggested best management practices for developers. Hence, a fully implemented WHPP requires the cooperation of state and local government, private companies and the general public. However, such inclusion of a WHPP into the planning decision process is only encouraged, not enforced nor regulated. It is incumbent upon city planners and elected officials to add such valuable information into their planning process.

56
A growing threat to groundwater contamination is injection wells, categorized by EPA as class V wells. These wells pump undesirable fluids directly into an aquifer, one that is typically much deeper than those relied on for drinking water. However due to water pressure differences and preferential flow paths, these fluids can migrate into drinking water aquifers thereby contaminating them; hence, they are a sizeable threat to water supplies. The threat to groundwater from Class V practices can be significantly reduced by the utilization of best management practices and careful monitoring at permitted facilities within wellhead protection areas.

57
Water Use Projections, 2010 – 2040
Introduction and data sources Water use in Tennessee by the public-water systems in the state has been projected to 2040 based on available population projections. Data on the population and water use for 2010 are used as the base year for the evaluation. The population projections for 2020 and 2030 are based on projections from the US Census Bureau and the 2040 population projections are based on data from Woods and Poole. The use of the Woods and Poole 2040 data was based on evaluation and decision of the Infrastructure working group for the TN H2O report.
The 2010 water-use data for public-water systems in Tennessee was compiled from records reported to and maintained by the TDEC Division of Water Resources. The compilation was conducted by the USGS as part of the 2010 national water use compilation. The data are published in Robinson (2018) for Tennessee and Maupin et al (2014) at the national level. The data for Tennessee are also available for download through ScienceBase (Robinson, 2017) and the USGS National Water Information System (USGS, 2018).
Trends in Water Use Water use data have been compiled at 5-year intervals since the 1950’s by the USGS National Water Use Information Program. The data compilation for Tennessee has been conducted in cooperation with TDEC Division of Water Resources. Since 1990, the compilations have used a consistent definition of the various water-use sectors and the published data can be used directly to evaluate trends and changes in water use in Tennessee. Water use by sector for 1990 – 2015 are listed in table 4 and shown in figure 19. The water-use data used in the analysis are available at the USGS Water Use in the United States web page (https://water.usgs.gov/watuse/) and published in Solley et al (1993, 1998), Hutson et al (2004), Kenny et al (2009), Maupin et al (2014), and Dieter et al (2018). Water-use data for Tennessee have been published in Hutson (1994, 1995, and 1999), Webbers (2003), Robinson and Brooks (2010), and Robinson (2018).

58
Table 4. – Reported water use in Tennessee, 1990 – 2015
[ Population in thousands; All withdrawals in million gallons per day]
1990 1995 2000 2005 2010 2015
Population
4,877
5,256
5,689
5,963
6,346
6,600
Total withdrawals
9,190
10,100
10,900
10,800
7,700
6,420
Public supply
695
777
890
914
918
850
Self-supplied Domestic
59
54
33
37
39
43
Livestock
21
8
31
30
28
23
Irrigation
38
25
22
55
72
64
Thermoelectric power
7,320
8,300
9,040
8,940
5,800
4,620
Self-supplied industrial
882
863
842
783
776
734
Mining
90
6
14
22
15
31
Aquaculture
28
28
44
60
53
57
Groundwater Total
503
435
456
489
470
430
Surface Water Total
8,690
9,640
10,500
10,300
7,230
5,990

59
600
650
700
750
800
850
900
950
4,500
5,000
5,500
6,000
6,500
7,000
1985 1990 1995 2000 2005 2010 2015 2020
Wat
er w
ithdr
awal
s, m
illio
n ga
llons
pe
r day
Popu
latio
n, in
thou
sand
s
Population
public supply
Industrial
-
20
40
60
80
100
120
4,500
5,000
5,500
6,000
6,500
7,000
1985 1990 1995 2000 2005 2010 2015 2020
Wat
er w
ithdr
awal
s, m
illio
n ga
llons
per
day
Popu
latio
n, in
thou
sand
s
Population Self-Supplied Domestic
Irrigation Mining
Linear (Irrigation)

60
- 10 20 30 40 50 60 70 80 90 100
4,500
5,000
5,500
6,000
6,500
7,000
1985 1990 1995 2000 2005 2010 2015 2020
Wat
er w
ithdr
awal
s, m
illio
n ga
llons
per
day
Popu
latio
n, in
thou
sand
s
Population LivestockAquaculture Linear (Livestock)Log. (Aquaculture)

61
Figure 19. Trends in water use in Tennessee, 1990 – 2015.
Method Water-use data for the national compilation are compiled from a variety of sources utilizing a variety of methods (Bradley, 2017). The water-use projections prepared for the TN H2O process currently only include the water withdrawals for public-water systems in Tennessee. The water withdrawals by the public-water systems are dependent on the population and the data are reported monthly providing a dataset that can be evaluated with a quality assurance/quality control (QA/QC) process. Self-supplied industrial water withdrawals are also reported to TDEC Division of Water Resources, but the projection of industrial water-use is complicated by changes in economic conditions, changes in manufacturing processes, and other factors that make accurate water-use projections difficult. Water-use for other sectors are also complicated by changes in economic conditions and the fact that estimates of water-use rely on indirect methods such as estimating crop irrigation based on field acreage. The water-withdrawal data by county and source for 2010 (Robinson, 2018) were used as the base year for the water use projections. The 2010 population data from the U.S. Census Bureau were used as the base population for the projections. The rate of population change for 2020, 2030, and 2040, relative to 2010, was calculated based on the population projections for those years. Water-use projections for public-water supply, domestic self-supplied, and golf course irrigation were projected based on projected population growth. Water use projections for the other sectors are based on trends, coordination with other agencies, or set at constant rates.
Public-water supply The water-use projections for public-supply withdrawals to 2040 in Tennessee were developed using a simple relation between population and the withdrawal rates. The method is modified and simplified from methods applied in other investigations at local scales (Hutson, 2008; Hutson et al, 2000) or for the Cumberland River basin (Robinson, 2017b) and the TVA service area (Bowen and Springston, 2018). The base year for the public-water supply water-use projections was 2010 to correspond to the 2010 population data from Woods and Poole used for the TN H2O analysis. The rate of change in population by county was then applied to the groundwater and surface-water withdrawal data for 2010 to estimate the projected water withdrawals for 2020, 2030, and 2040. This implies that there is a strong correlation between population and withdrawals. The relative distribution between groundwater and surface water for 2010 for each county was applied for the projections.
The method used to estimate the projected water use has the advantage of being a simple analysis that can be adjusted based on population projections. The population projections are developed utilizing a base year, usually a decadal census year, and projected population changes based on birth rates, death rates, net migration rates, and other factors (Boyd Center, 2017). The method used in this analysis allows the selection of a population projection that best meets the assumptions on overall rates of population change. Population projections are available with differing assumptions from the U.S. Census Bureau, the Tennessee State Data Center and the Boyd Center, Woods and Poole, and other sources. Using the simple county population method to project water use does have limitations based

62
on the lack of detailed adjustments and assumptions used in the analysis. The assumptions utilized in the analysis are:
• The distribution of withdrawals from groundwater and surface-water sources by county are based on the reported sources for 2010 (Robinson, 2018).
• The distribution of withdrawals from groundwater and surface water were assumed to remain constant and were not adjusted for the projected years.
• Total county populations are used in the analysis even though a population in each county utilizes wells and springs for domestic self-supplied drinking water. Total county population was used to eliminate uncertainties due to under- or over-counted population based on the estimated population served by each water system as well as uncertainties owing to amount of water supplied to multiple counties by some systems.
• No adjustments were made for decreases in per capita use due to increased use of water-efficient appliances and reduction in system leaks. No adjustments were made for increased per capita use due to increased use of water for the commercial sector and light industry supplied by public-water systems.
• Changes in the county population served by a public-water system versus self-supplied domestic water uses were not evaluated for this analysis. The extension of water-service lines into previously unserved areas will increase the population served and increase the needed water-withdrawals by public-water systems.
• Changes in water-withdrawal patterns due to changes in interconnections and contracts between public-water systems, changes between sources of water, and changes in interbasin transfers were not included in the analysis.
The extension of water lines is a local decision and an evaluation of those possible changes was beyond the scope of this study. Evaluations of the potential changes in per capita use, positive or negative, was also beyond the scope of this analysis.
Domestic Self-Supplied Domestic self-supplied water-use includes the rural water used by citizens from wells or springs for domestic water-use. The amount of domestic water-use are indirect estimates based on the estimated county population not served by a public-water system. The population not served by a public water system is calculated from the total county population from the US Census minus the population served as reported by the public-water systems. The method is complicated by the fact that the population served is based on a variety of data reported by public-water systems including population, residential connections or accounts, households served, or other factors. The self-supplied population is multiplied by a regional per capita water-use factor to estimate the self-supplied water-use by county. All self-supplied water-use is assumed to be from groundwater, either domestic wells or springs. The projected growth rate, relative to 2010, for the population of each county was calculated based on the Woods and Poole population projections. This growth rate was then was multiplied by the 2010 estimated self-supplied domestic water use for each county to estimate the projected water use for 2020, 2030, and 2040.

63
Self-Supplied Industry The water used by self-supplied industry is determined from the water-withdrawal data reported to TDEC Division of Water Resources for water withdrawals of more than 10,000 gallons per day. The reported water withdrawals include the amount of water and the source of water, either groundwater or surface water. The data are used for the 5-year compilations of water use for Tennessee and the National compilations. The overall trends for self-supplied industrial water-use are downward (Dieter et al, 2018) as industrial water-use becomes more efficient and some industries convert to water from public-water systems instead of self-supplied sources. Industrial water use can be difficult to project since industrial water use is affected by economic, production, and other factors not related to population growth. For this analysis, the self-supplied industrial water-use for 2020, 2030, and 2040 has been projected as a constant level equal to the reported 2015 water withdrawals. The data for 2015 were used instead of 2010 because of the continued downward trend in industrial water use from 2010 to 2015.
Power Generation Only a very small quantity of groundwater is withdrawn for thermo-electric power as compared to surface water. In 2015 according to Dieter et al (2018), 2.18 MGD of groundwater was used for thermo-electric while 4,620 MGD of surface water was used. In Tennessee in 2015, the sole county using groundwater for thermo-electric is Haywood County in West TN for the TVA Brownsville Combustion Turbine Plant. Coming online by 2020, the TVA Allen Combined Cycle Plant will also use groundwater for producing steam for its turbines. Originally using its own wells on-site, TVA is presently purchasing groundwater from MLGW as there is concern of connection between the shallow aquifer and the Memphis aquifer in the vicinity of the new plant.
Mining, Livestock, and Aquaculture The water use for mining, livestock, and aquaculture in Tennessee are based on the 5-year national compilations for water use in the United States. The water use for these three sectors are all indirect estimates of water use based on other factors. Water use for mining is based on reported production from mining and quarry operations (Lovelace, 2009a). The livestock and aquaculture water withdrawals are estimated from livestock and aquaculture production data reported by the USDA National Agriculture Statistical Service (Lovelace, 2009b, 2009c). Since the water-use estimates for these categories are based on indirect methods, the water-use projections for 2020, 2030, and 2040 are held constant at the 2010 estimated withdrawals rates.
Irrigation – Crop Water use for crop irrigation is an indirect estimate based on the irrigated acres reported by the USDA National Agricultural Statistic Service and a coefficient for the amount of water used per acre. Although the estimate is an indirect measurement, the amount of water used for irrigation can be a substantial amount. Irrigation in West Tennessee showed a dramatic increase from the 2005 to the 2010 water-use compilation. The increase in irrigation was a result of the favorable economic and crop conditions during that period. The projection of water-use for irrigation can be difficult. Crop production and irrigation are dependent on weather conditions, crop production, changes in type of crop, farming

64
practices, and changes in domestic and international markets. The projections used in this analysis have the following assumptions:
• The 2015 estimated irrigation rates by county are used as a base year to account for changes in irrigation from 2010 to 2015.
• Irrigation is not separated as groundwater or surface water. The majority of irrigation is derived from a groundwater source, especially in West TN.
• Irrigation for all counties in West Tennessee are projected to increase 10% from 2015 to 2040 to account for the growth in center-pivot irrigation systems in West Tennessee.
• Irrigation for the counties in Middle and East Tennessee estimated to use more than 0.5 million gallons per day for irrigation in 2015 are projected to have a 10% increase in irrigation from 2015 – 2040. These counties are Coffee, Franklin, Giles, Lincoln, Robertson, and Warren.
• Irrigation rates for all other counties in Middle and East Tennessee are assumed to have zero growth from 2015 – 2040.
Irrigation – Golf The water use for golf-course irrigation is determined from the water-use data reported to TDEC Division of Water Resources for water withdrawals of more than 10,000 gallons per day. The data reported includes the source of water and amount of water-use. The projected growth rate, relative to 2010, for the population of each county was calculated based on the Woods and Poole population projections. This was multiplied by the 2010 water-use for golf-course irrigation for each county to estimate the projected water use for 2020, 2030, and 2040.

65
Projections of Water Withdrawal in Tennessee 2020 - 2040 Withdrawals for all sectors in Tennessee in 2010 totaled about 7.7 billion gallons per day and in 2015 totaled about 6.42 billion gallons per day. Water use from 2010 to 2015 declined for public-supply, self-supplied industry, thermoelectric power, and irrigation for crops. The water-use projections for 2020, 2030, and 2040, based on the assumptions and methods previously described, show a steady increase in water needs for groundwater use in Tennessee. The water-use projections are primarily driven by assumptions on the growth in population in Tennessee and conservative increases in irrigation. Total estimated water use for 2010 and 2015 and the projected water use to 2040 are shown in table 5.
Table 5. Projections of water withdrawals (in million gallons per day) from groundwater and surface-water sources by all water sectors in Tennessee 2010 – 2040.
State Population Groundwater Withdrawals
Surface-Water Withdrawals
Total Withdrawals
2010 6,346,105 (Census)
487.6 7,209 7,797
2015 6,502,017 (Census)
449.9 5,972 6,422
2020 6,950,696 (W&P)
492.8 7,238 7,731
2030 7,525,026 (W&P)
512.7 7,315 7,828
2040 8,344,764 (W&P)
526.4 7,388 7,915
Projections of Water Withdrawal for Public Supply Withdrawals for public-water supply in Tennessee for 2010 totaled about 890 million gallons per day (Mgal/d) with about 321 Mgal/d from groundwater sources and 569 Mgal/d from surface water sources. The total state population in 2010 was about 6.35 million people. Population projections for Tennessee are: 2020 – 6.95 million; 2030 – 7.53 million; 2040 – 8.34 million. Water withdrawals by public-water systems show similar increases: 2020 – 962 Mgal/d; 2030 – 1,026 Mgal/d; 2040 – 1,114 Mgal/d. The total projected increases in water withdrawals by source in Tennessee are listed in table 6. Projected population change and the associated projected withdrawals for public-water supply for 2020, 2030, and 2040 by source of water for Tennessee counties are shown in table 7.
Table 5. Projections of water withdrawals (in million gallons per day) from groundwater and surface-water sources by public-water systems in Tennessee 2010 – 2040.
State Population Groundwater Withdrawals
Surface-Water Withdrawals
Total Withdrawals
2010 6,346,105 320.7 568.8 889.5 2020 6,950,696 333.6 629.0 962.6 2030 7,525,026 341.3 684.7 1,026

66
2040 8,344,764 356.5 757.7 1,114
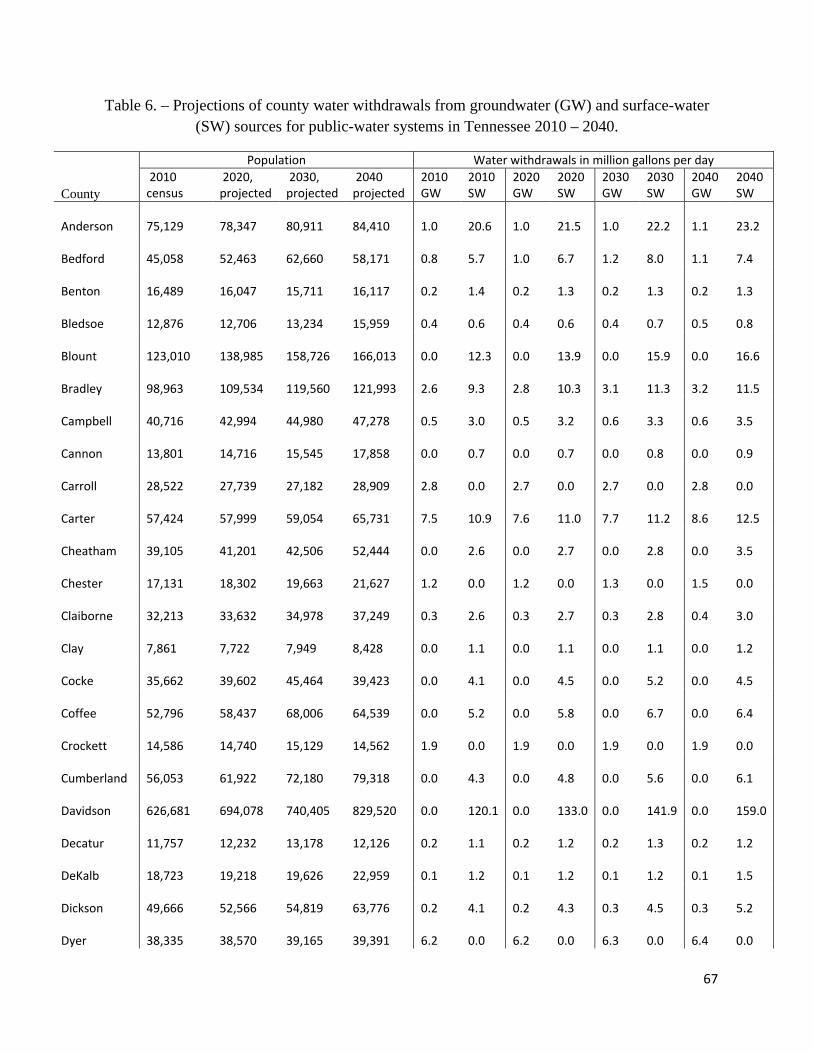
67
Table 6. – Projections of county water withdrawals from groundwater (GW) and surface-water (SW) sources for public-water systems in Tennessee 2010 – 2040.
Population Water withdrawals in million gallons per day
County 2010 census
2020, projected
2030, projected
2040 projected
2010 GW
2010 SW
2020 GW
2020 SW
2030 GW
2030 SW
2040 GW
2040 SW
Anderson 75,129
78,347
80,911
84,410 1.0 20.6 1.0 21.5 1.0 22.2 1.1 23.2
Bedford 45,058
52,463
62,660
58,171 0.8 5.7 1.0 6.7 1.2 8.0 1.1 7.4
Benton 16,489
16,047
15,711
16,117 0.2 1.4 0.2 1.3 0.2 1.3 0.2 1.3
Bledsoe 12,876
12,706
13,234
15,959 0.4 0.6 0.4 0.6 0.4 0.7 0.5 0.8
Blount 123,010
138,985
158,726
166,013 0.0 12.3 0.0 13.9 0.0 15.9 0.0 16.6
Bradley 98,963
109,534
119,560
121,993 2.6 9.3 2.8 10.3 3.1 11.3 3.2 11.5
Campbell 40,716
42,994
44,980
47,278 0.5 3.0 0.5 3.2 0.6 3.3 0.6 3.5
Cannon 13,801
14,716
15,545
17,858 0.0 0.7 0.0 0.7 0.0 0.8 0.0 0.9
Carroll 28,522
27,739
27,182
28,909 2.8 0.0 2.7 0.0 2.7 0.0 2.8 0.0
Carter 57,424
57,999
59,054
65,731 7.5 10.9 7.6 11.0 7.7 11.2 8.6 12.5
Cheatham 39,105
41,201
42,506
52,444 0.0 2.6 0.0 2.7 0.0 2.8 0.0 3.5
Chester 17,131
18,302
19,663
21,627 1.2 0.0 1.2 0.0 1.3 0.0 1.5 0.0
Claiborne 32,213
33,632
34,978
37,249 0.3 2.6 0.3 2.7 0.3 2.8 0.4 3.0
Clay 7,861
7,722
7,949
8,428 0.0 1.1 0.0 1.1 0.0 1.1 0.0 1.2
Cocke 35,662
39,602
45,464
39,423 0.0 4.1 0.0 4.5 0.0 5.2 0.0 4.5
Coffee 52,796
58,437
68,006
64,539 0.0 5.2 0.0 5.8 0.0 6.7 0.0 6.4
Crockett 14,586
14,740
15,129
14,562 1.9 0.0 1.9 0.0 1.9 0.0 1.9 0.0
Cumberland 56,053
61,922
72,180
79,318 0.0 4.3 0.0 4.8 0.0 5.6 0.0 6.1
Davidson 626,681
694,078
740,405
829,520 0.0 120.1 0.0 133.0 0.0 141.9 0.0 159.0
Decatur 11,757
12,232
13,178
12,126 0.2 1.1 0.2 1.2 0.2 1.3 0.2 1.2
DeKalb 18,723
19,218
19,626
22,959 0.1 1.2 0.1 1.2 0.1 1.2 0.1 1.5
Dickson 49,666
52,566
54,819
63,776 0.2 4.1 0.2 4.3 0.3 4.5 0.3 5.2
Dyer 38,335
38,570
39,165
39,391 6.2 0.0 6.2 0.0 6.3 0.0 6.4 0.0

68
Population Water withdrawals in million gallons per day
County 2010 census
2020, projected
2030, projected
2040 projected
2010 GW
2010 SW
2020 GW
2020 SW
2030 GW
2030 SW
2040 GW
2040 SW
Fayette 38,413
47,109
58,512
60,694 1.6 0.0 1.9 0.0 2.4 0.0 2.5 0.0
Franklin 41,052
42,750
46,741
48,898 2.0 2.4 2.1 2.5 2.2 2.7 2.3 2.8
Gibson 49,683
52,493
54,271
49,919 7.0 0.0 7.4 0.0 7.6 0.0 7.0 0.0
Giles 29,485
29,286
28,861
32,411 0.3 3.4 0.3 3.3 0.3 3.3 0.3 3.7
Grainger 22,657
24,040
26,364
28,741 0.0 0.0 0.0 0.0 0.0 0.0 0.0 0.0
Greene 68,831
72,407
76,332
75,298 0.0 8.1 0.0 8.5 0.0 9.0 0.0 8.9
Grundy 13,703
13,349
13,569
14,988 0.0 1.6 0.0 1.6 0.0 1.6 0.0 1.8
Hamblen 62,544
66,374
70,865
76,418 1.0 8.1 1.1 8.6 1.2 9.2 1.3 9.9
Hamilton 336,463
355,420
358,976
394,060 10.5 50.4 11.0 53.3 11.1 53.8 12.2 59.1
Hancock 6,819
6,734
7,145
6,563 0.0 0.4 0.0 0.4 0.0 0.4 0.0 0.3
Hardeman 27,253
26,051
25,795
25,558 2.7 0.0 2.5 0.0 2.5 0.0 2.5 0.0
Hardin 26,026
26,377
27,058
28,236 2.4 0.7 2.4 0.7 2.5 0.8 2.6 0.8
Hawkins 56,833
58,290
57,154
66,942 1.2 2.9 1.3 3.0 1.2 2.9 1.4 3.4
Haywood 18,787
18,085
18,421
17,248 1.9 0.0 1.8 0.0 1.9 0.0 1.7 0.0
Henderson 27,769
28,864
29,978
30,257 0.4 3.5 0.4 3.7 0.4 3.8 0.4 3.9
Henry 32,330
33,058
33,748
33,394 3.1 0.0 3.2 0.0 3.3 0.0 3.2 0.0
Hickman 24,690
24,902
25,401
29,133 0.0 2.3 0.0 2.3 0.0 2.4 0.0 2.7
Houston 8,426
8,454
8,500
9,910 0.2 1.0 0.2 1.0 0.2 1.0 0.2 1.1
Humphreys 18,538
18,601
18,807
20,178 1.2 1.1 1.2 1.1 1.2 1.1 1.3 1.2
Jackson 11,638
11,553
11,760
13,189 0.0 0.5 0.0 0.5 0.0 0.5 0.0 0.6
Jefferson 51,407
58,580
67,085
65,797 0.6 2.7 0.7 3.1 0.8 3.5 0.8 3.5
Johnson 18,244
18,258
18,919
20,642 0.9 1.2 0.9 1.2 1.0 1.3 1.0 1.4
Knox 432,226
486,462
537,892
575,880 0.9 61.2 1.0 68.9 1.2 76.1 1.2 81.5
Lake 7,832
7,412
6,960
7,394 1.3 0.0 1.2 0.0 1.1 0.0 1.2 0.0

69
Population Water withdrawals in million gallons per day
County 2010 census
2020, projected
2030, projected
2040 projected
2010 GW
2010 SW
2020 GW
2020 SW
2030 GW
2030 SW
2040 GW
2040 SW
Lauderdale 27,815
27,180
27,459
27,479 3.9 0.0 3.8 0.0 3.9 0.0 3.9 0.0
Lawrence 41,869
42,357
42,172
49,436 2.4 1.9 2.4 1.9 2.4 1.9 2.8 2.2
Loudon 48,556
54,303
58,576
69,880 2.1 8.4 2.3 9.4 2.5 10.2 3.0 12.1
Macon 22,248
24,612
27,162
28,007 2.2 0.3 2.5 0.3 2.7 0.3 2.8 0.4
Madison 98,294
101,536
102,743
105,922 15.1 0.0 15.6 0.0 15.8 0.0 16.2 0.0
Marion 28,237
29,237
30,266
33,211 0.8 2.7 0.8 2.8 0.8 2.9 0.9 3.2
Marshall 30,617
32,671
36,611
36,380 0.2 2.8 0.2 2.9 0.2 3.3 0.2 3.3
Maury 80,956
83,751
85,708
112,826 1.0 10.6 1.1 10.9 1.1 11.2 1.4 14.7
McMinn 52,266
54,688
56,799
53,903 2.6 2.9 2.7 3.0 2.8 3.1 2.7 3.0
McNairy 26,075
27,716
29,853
28,858 3.4 0.0 3.6 0.0 3.9 0.0 3.8 0.0
Meigs 11,753
12,782
13,193
14,621 0.6 0.0 0.6 0.0 0.7 0.0 0.7 0.0
Monroe 44,519
49,216
53,796
56,255 0.6 5.0 0.6 5.5 0.7 6.1 0.7 6.3
Montgomery 172,331
206,226
232,640
307,206 4.4 16.2 5.3 19.4 6.0 21.9 7.9 28.9
Moore 6,362
6,436
6,694
7,502 0.0 0.6 0.0 0.6 0.0 0.6 0.0 0.6
Morgan 21,987
22,178
22,968
27,376 0.0 1.1 0.0 1.1 0.0 1.1 0.0 1.3
Obion 31,807
31,220
31,076
30,135 5.7 0.0 5.5 0.0 5.5 0.0 5.4 0.0
Overton 22,083
23,254
24,690
25,026 0.0 2.8 0.0 2.9 0.0 3.1 0.0 3.2
Perry 7,915
8,110
8,072
8,977 0.0 0.8 0.0 0.8 0.0 0.8 0.0 0.9
Pickett 5,077
4,957
4,945
5,871 0.0 0.6 0.0 0.6 0.0 0.6 0.0 0.7
Polk 16,825
16,655
17,043
18,250 0.4 0.2 0.4 0.2 0.4 0.2 0.5 0.2
Putnam 72,321
85,376
98,902
94,856 0.0 12.0 0.0 14.2 0.0 16.4 0.0 15.8
Rhea 31,809
35,346
37,587
36,077 0.8 2.7 0.9 3.0 0.9 3.2 0.9 3.1
Roane 54,181
54,788
55,549
58,321 0.2 6.2 0.2 6.2 0.2 6.3 0.2 6.6
Robertson 66,283
76,228
84,425
97,668 0.0 5.2 0.0 6.0 0.0 6.6 0.0 7.6
Rutherford 262,604
348,509
448,367
502,922 0.0 27.3 0.0 36.2 0.0 46.6 0.0 52.3

70
Population Water withdrawals in million gallons per day
County 2010 census
2020, projected
2030, projected
2040 projected
2010 GW
2010 SW
2020 GW
2020 SW
2030 GW
2030 SW
2040 GW
2040 SW
Scott 22,228
22,108
23,082
24,730 0.1 2.4 0.1 2.4 0.1 2.5 0.1 2.6
Sequatchie 14,112
16,547
19,090
21,137 0.0 0.7 0.0 0.8 0.0 0.9 0.0 1.0
Sevier 89,889
103,553
119,791
141,034 0.2 5.4 0.3 6.2 0.3 7.2 0.4 8.5
Shelby 927,644
958,198
965,763
1,003,931 187.8 0.0 194.0 0.0 195.6 0.0 203.3 0.0
Smith 19,166
20,663
22,606
21,501 0.0 1.7 0.0 1.9 0.0 2.0 0.0 1.9
Stewart 13,324
14,127
15,031
15,344 0.4 0.3 0.4 0.4 0.4 0.4 0.4 0.4
Sullivan 156,823
162,289
164,836
165,012 0.4 25.1 0.4 26.0 0.4 26.4 0.4 26.4
Sumner 160,645
188,866
215,510
266,481 0.0 24.6 0.0 28.9 0.0 33.0 0.0 40.8
Tipton 61,081
69,438
78,345
81,395 6.2 0.0 7.1 0.0 8.0 0.0 8.3 0.0
Trousdale 7,870
8,766
9,692
10,207 0.0 0.7 0.0 0.8 0.0 0.9 0.0 0.9
Unicoi 18,313
18,582
18,927
18,581 2.2 0.0 2.2 0.0 2.3 0.0 2.2 0.0
Union 19,109
19,765
20,459
24,738 0.6 0.0 0.6 0.0 0.6 0.0 0.7 0.0
Van Buren 5,548
5,518
5,617
6,512 0.0 0.9 0.0 0.9 0.0 0.9 0.0 1.1
Warren 39,839
41,604
44,153
43,682 0.0 12.3 0.0 12.8 0.0 13.6 0.0 13.5
Washington 122,979
141,908
157,966
159,031 3.7 2.5 4.3 2.8 4.8 3.2 4.8 3.2
Wayne 17,021
16,659
16,125
18,666 0.2 0.8 0.2 0.8 0.2 0.8 0.2 0.9
Weakley 35,021
35,780
36,001
33,661 2.5 0.0 2.6 0.0 2.6 0.0 2.4 0.0
White 25,841
28,573
32,077
30,570 0.0 3.5 0.0 3.8 0.0 4.3 0.0 4.1
Williamson 183,182
234,069
291,506
473,000 0.2 1.9 0.2 2.4 0.3 3.0 0.5 4.9
Wilson 113,993
137,726
158,936
238,338 1.3 10.6 1.5 12.9 1.8 14.8 2.6 22.2

71
References Bowen, Amanda K., and Springston, Gary L., 2018, Water Use in the Tennessee Valley for 2015 and
Projected Use in 2040: TENNESSEE VALLEY AUTHORITY, Land & River Management, 63 p., accessed June 27, 2018 at https://www.tva.gov/file_source/TVA/Site%20Content/Environment/Managing%20the%20River/2015%20Water%20Use%20Report_2040%20Projections.pdf
Boyd Center, 2017, Population Projections 2017, Methodology, Executive Summary, and Notes: Tennessee State Data Center, Boyd Center for Business and Economic Research, 5 p. http://tndata.utk.edu/Data/Projection%20narrative%202017.pdf
Bradley, M.W., comp., 2017, Guidelines for preparation of State water-use estimates for 2015: U.S. Geological Survey Open-File Report 2017–1029, 54 p., https://doi.org/10.3133/ofr20171029,
Dieter, C.A., Maupin, M.A., Caldwell, R.R., Harris, M.A., Ivahnenko, T.I., Lovelace, J.K., Barber, N.L., and Linsey, K.S., 2018, Estimated use of water in the United States in 2015: U.S. Geological Survey Circular 1441, 65 p., https://doi.org/10.3133/cir1441
Hutson, S.S., 1994, Estimated use of water in Tennessee, 1990: U.S. Geological Survey Water-Resources Investigations Report 94-4055, 1 sheet.
Hutson, S.S., 1995, Ground-water use by public-supply systems in Tennessee, 1990: Open-File Report 94-483, 1 sheet.
Hutson, S.S. and Schwarz, G.E., 1996, Estimates of future water demand for selected water-service areas in the upper Duck River basin, central Tennessee with a section on methodology used to develop population forecasts for Bedford, Marshall, and Maury Counties, Tennessee, from 1933 to 2050: U.S. Geological Survey Water-Resources Investigations Report 96-4140, 58 p.
Hutson, S.S., 1999, Public water-supply systems and associated water use in Tennessee, 1995: U.S. Geological Survey Water-Resources Investigations Report 99-4052, 91 p.
Hutson, S.S., Koroa, M.C., and Murphree, C.M., 2004, Estimated use of water in the Tennessee River watershed in 2000 and projections of water use to 2030: U.S. Geological Survey Water Resources Investigations Report 2003-4302, 89 p.
Hutson, S.S., 2008, Estimated use of water in the upper Duck River watershed, central Tennessee, and water-demand projections through 2030: U.S. Geological Survey Scientific Investigations Report 2008-5058, 16 p. https://pubs.er.usgs.gov/publication/sir20085058
Hutson, S.S., Strom, E.W., Burt, D.E., and Mallory, M.J., 2000, Simulation of Projected Water Demand and Ground-Water Levels in the Coffee Sand and Eutaw-McShan Aquifers in Union County, Mississippi, 2010 through 2050: U.S. GEOLOGICAL SURVEY Water-Resources Investigations Report 00-4268, 38 p., https://pubs.usgs.gov/sir/2008/5058/

72
Hutson, S.S., Barber, N.L., Kenny, J.F., Linsey, K.S., Lumia, D.S., and Maupin, M.A., 2004, Estimated use of water in the United States in 2000: Reston, Va., U.S. Geological Survey Circular 1268, 46 p. https://pubs.usgs.gov/circ/2004/circ1268/
Kenny, J.F., Barber, N.L., Hutson, S.S., Linsey, K.S., Lovelace, J.K., and Maupin, M.A., 2009, Estimated use of water in the United States in 2005: U.S. Geological Survey Circular 1344, 52 p. https://pubs.usgs.gov/circ/1344/
Lovelace, J.K., 2009a, Methods for estimating water withdrawals for mining in the United States, 2005: U.S. Geological Survey Scientific Investigations Report 2009–5053, 7 p. https://pubs.usgs.gov/sir/2009/5053/
Lovelace, John K., 2009b, Method for estimating water withdrawals for livestock in the United States, 2005: U.S. Geological Survey Scientific Investigations Report 2009–5041, 7 p. https://pubs.usgs.gov/sir/2009/5041/
Lovelace, John K., 2009c, Methods for estimating water withdrawals for aquaculture in the United States, 2005: U.S. Geological Survey Scientific Investigations Report 2009–5042, 13 p. https://pubs.usgs.gov/sir/2009/5042/
Maupin, M.A., Kenny, J.F., Hutson, S.S., Lovelace, J.K., Barber, N.L., and Linsey, K.S., 2014, Estimated use of water in the United States in 2010: U.S. Geological Survey Circular 1405, 56 p., https://dx.doi.org/10.3133/cir1405.
Robinson, J.A., 2017, Water Use in Tennessee, 2010: U.S. Geological Survey data release, https://doi.org/10.5066/F7V9868K.
Robinson, J.A., 2017b, Public Supply Water Use in the Cumberland River Watershed in 2010 and Projections of Public-supply Water Use to 2040: U.S. Geological Survey data release, https://doi.org/10.5066/F7M043KK.
Robinson, J.A., 2018, Public-supply water use and self-supplied industrial water use in Tennessee, 2010: U.S. Geological Survey Scientific Investigation Report 2018–5009, 30 p., https://doi.org/10.3133/sir20185009
Robinson, J.A., and Brooks, J.M., 2010, Public water-supply systems and associated water use in Tennessee, 2005: U.S. Geological Survey Open-File Report 2010–1226, 100 p.
Solley, Wayne B., Pierce, Robert R., and Perlman, Howard A., 1998 Estimated Use of Water in the United States in 1995: U.S. Geological Survey Circular 1200, 71 p. https://pubs.er.usgs.gov/publication/cir1200
Solley, Wayne B., Pierce, Robert R., and Perlman, Howard A., 1993, Estimated Use of Water in the United States in 1990: U.S. Geological Survey Circular 1081, 76 p. https://pubs.er.usgs.gov/publication/cir1081

73
USGS 2018, National Water Information System: Web Interface, Water Use Data for Tennessee: U.S. Geological Survey web page https://waterdata.usgs.gov/tn/nwis/wu, accessed May 18, 2018.
Webbers, Ank, 2003, Public water-supply systems and associated water use in Tennessee, 2000: U.S. Geological Survey Water-Resources Investigations Report 03-4264, 90 p.

74
Recommendations Tennessee is blessed with great groundwater resources. From the prolific, high quality groundwater of the Memphis aquifer in West Tennessee to the limestone karst and fractured rock aquifers of Middle and East Tennessee, municipalities, industry and agriculture have much to gain from our abundance of groundwater. As projected growth in Tennessee suggests a parallel increased demand on its water, it is incumbent upon Tennesseans and those who wish to benefit from our available groundwater to in-turn be good stewards of these resources. To best facilitate this action, following are recommendations in rank of most importance to lower importance as determined by the TN H2O Groundwater Subcommittee. It is our sincere hope that resources and action plans will result from these suggested recommendations through partnerships developed among government agencies, private industry, non-profits, and engaged citizens.
1) Develop TN Specific Educational Component on Groundwater. Focus on importance of groundwater in TN, groundwater protection and conservation, hydrologic process dependencies (e.g., recharge, surface/groundwater interactions with regional considerations), groundwater sustainability and contributing factors to include land processes, shared use, stressors, etc.
2) Establish monitoring well networks to measure groundwater levels so as to proactively evaluate trends in groundwater levels and impacts. Additionally, conduct simultaneous data collection proximal to the intersection of surface water and groundwater systems.
3) Determine recharge mechanisms and rates to the key aquifers in West Tennessee by precipitation, surface water-groundwater exchange and inter-aquifer exchange. Derive zones of protection based on critical recharge areas and contamination potential; consider possible designation as preferred sole source aquifer.
4) Develop funding sources for scientific assessment and initiatives pertaining to the sustainability of groundwater, especially in West Tennessee where withdrawals are highest.
5) Obtain measures of groundwater usage for agriculture through a voluntary program with producers. 6) Promote best management practices for the users of groundwater (i.e., municipal, industrial,
agriculture) with an aim toward conservation and sustainability as well as economic health. 7) Promote best management and conservation practices to encourage aquifer infiltration and
restoration. 8) Encourage better land use planning in and around well head protection areas by integrating
program outcomes into municipal and/or development planning. Additionally, as groundwater contamination events are typically from older sources, increase protection zones to 40+ years of travel. Relate source water areas to well head protection.
9) Create a central repository of groundwater contamination sites for public awareness and future planning.
10) Consider regional collaborative efforts (i.e., water compacts, etc.).