Embed Size (px)
Citation preview
GROUNDWATER RESOURCES A PRIMER
for the Compact District
of the Ohio River Basin
ILLINOIS INDIANA
KENTUCKY NEW YORK
OHIO PENNSYLVANIA
VIRGINIA WEST VIRGINIA
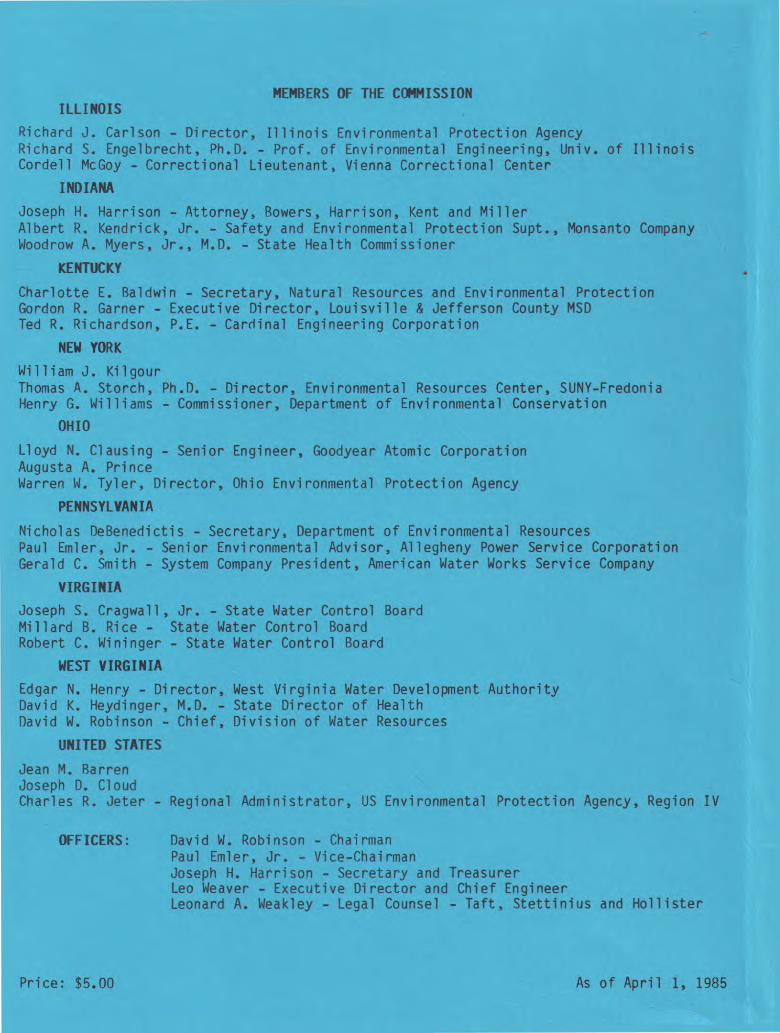
MEMBERS OF THE COMMISSION ILLINOIS
Richard J. Carlson - Director, Illinois Environmental Protection Agency Richard S. Engelbrecht, Ph.D. - Prof. of Environmental Engineering, Univ. of Illinois Cordell McGoy - Correctional Lieutenant, Vienna Correctional Center
INDIANA
Joseph H. Harrison - Attorney, Bowers, Harrison, Kent and Miller Albert R. Kendrick, Jr. - Safety and Environmental Protection Supt., Monsanto Company Woodrow A. Myers, Jr., M.D. - State Health Commissioner
KENTUCKY
Charlotte E. Baldwin - Secretary, Natural Resources and Environmental Protection Gordon R. Garner - Executive Director, Louisville & Jefferson County MSD Ted R. Richardson, P.E. - Cardinal Engineering Corporation
NEW YORK
William J. Kilgour Thomas A. Storch, Ph.D. - Director, Environmental Resources Center, SUNY-Fredonia Henry G. Williams - Commissioner, Department of Environmental Conservation
OHIO
Lloyd N. Clausing - Senior Engineer, Goodyear Atomic Corporation Augusta A. Prince Warren W. Tyler, Director, Ohio Environmental Protection Agency
PENNSYLVANIA
Nicholas DeBenedictis - Secretary, Department of Environmental Resources Paul Emler, Jr. - Senior Environmental Advisor, Allegheny Power Service Corporation Gerald C. Smith - System Company President, American Water Works Service Company
VIRGINIA
Joseph S. Cragwall , Jr. - State Water Control Board Millard B. Rice - State Water Control Board Robert C. Wininger - State Water Control Board
WEST VIRGINIA
Edgar N. Henry - Director, West Virginia Water Development Authority David K. Heydinger, M.D. - State Director of Health David W. Robinson - Chief, Division of Water Resources
UNITED STATES
Jean M. Barren Joseph D. Cloud Charles R. Jeter -
OFFICERS:
Regional Administrator, US Environmental Protection Agency, Region IV
David W. Robinson - Chairman Paul Emler, Jr. - Vice-Chairman Joseph H. Harrison - Secretary and Treasurer Leo Weaver - Executive Director and Chief Engineer Leonard A. Weakley - Legal Counsel - Taft, Stettinius and Hollister
Price: $5.00 As of April 1, 1985
A PRIMER ON
GROUNDWATER RESOURCES
IN THE COMPACT DISTRICT OF THE
OHIO RIVER BASIN
SEPTEMBER, 1984
OHIO RIVER VALLEY WATER SANITATION COMMISSION 414 WALNUT STREET
CINCINNATI, OH 45202

FOREWORD
In 1983, the Ohio River Valley Water Sanitation
Commission established an Energy Roundtable to
provide a forum for discussion of policy issues and
problems concerned with energy management and water
pollution control, and related environmental-economic
issues that have regional or multistate effects. The
goal is to facilitate early and open communications
through periodic meetings between the energy industry
and related interests and the signatory states. The
Energy Roundtable serves as a public forum for any
and all energy matters of interest to the Ohio Valley
public interests. Groundwater resources was the
initial topic selected for discussion by the Energy
Roundtable. Information and research in this report
was compiled as a source document dedicated to
various issues related to groundwater resources.
Special acknowledgment is due Mr. William L.
Klein, Assistant Executive Director and Randy D.
Meyer, Graduate
Intern, who researched the
literature, prepared the map of major aquifers in the
Compact District, and drafted the initial report.
Russell Brant, Geologist with the Kentucky Geological
Survey, reviewed the hydrogeological sections.
Membership on the Energy Roundtable consists of
one Commissioner from each of the signatory states;
one Commissioner from the federal government; a
member of the Public Interest Advisory Committee; and
one member each from the Power Industry Committee and
East Central Area Reliability Council (ECAR).
Members of the Energy Roundtable are:
Illinois: Richard J. Carlson, Director Illinois Environmental Protection Agency
Indiana: Albert R. Kendrick, Jr. Safety & Environmental Protection Superintendent - Monsanto Company
Kentucky: Gordon R. Garner, Executive Director Louisville & Jefferson County Metropolitan Sewer District
New York: Henry G. Williams, Commissioner Department of Environmental Conservation
Ohio: Robert H. Maynard, Director Ohio Environmental Protection Agency
Pennsylvania: Paul Emler, Jr. Senior Environmental Advisor Allegheny Power Service Corporation
Virginia: Joseph S. Cragwall, Jr. State Water Control Board
West Virginia: David W. Robinson, Chief Division of Water Resources West Virginia Department of Natural
Resources
Federal: Jean M. Barren Steubenville, OH
Public Interest Advisory Committee:
Power Industry Committee:
Lindley V. Pryor Salamanca, NY
Caryl Pfeiffer, Environmentalist (Chairman) Kentucky Utilities Company
ECAR Coordination Agreement: Thomas N. Hand, Executive Manager
East Central Area Reliability
Commission Staff Liaison:
William L. Klein Assistant Executive Director
TABLE OF CONTENTS
PAGE
EXECUTIVE SUMMARY I
INTRODUCTION 1
Principal Aquifers 7
GROUNDWATER AVAILABILITY 20
GROUNDWATER QUALITY 32
Groundwater Contamination Groundwater Cleanup
CONCLUSIONS
54
BIBLIOGRAPHY 57
38 48

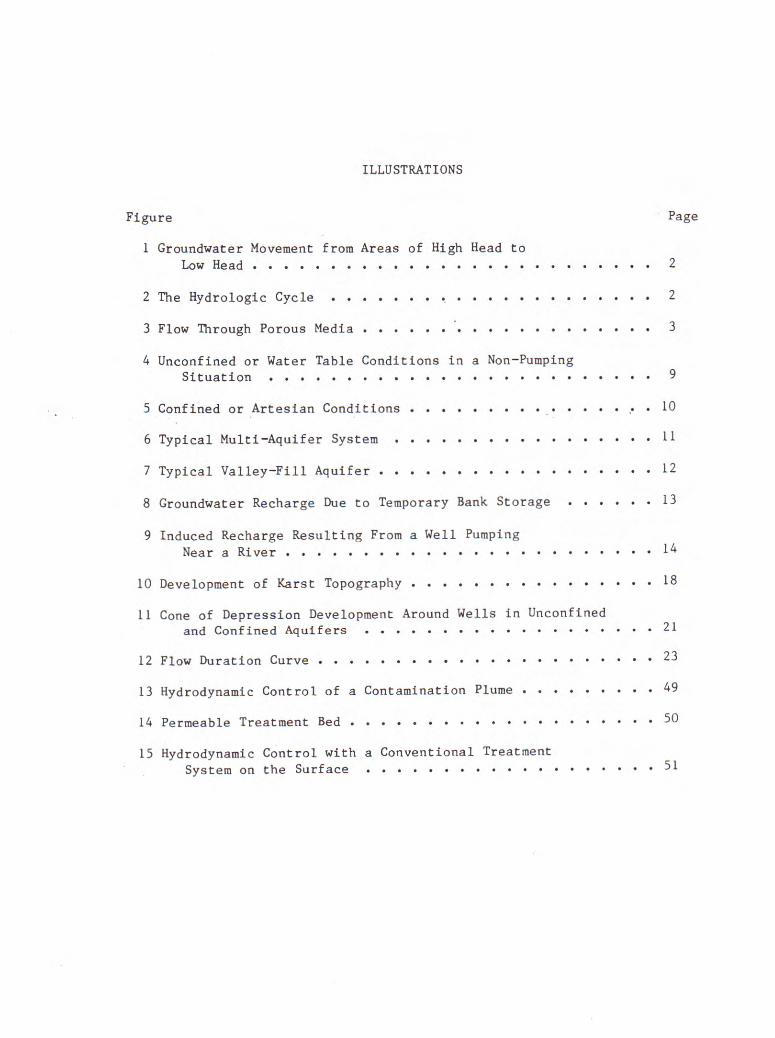
ILLUSTRATIONS
Figure Page
1 Groundwater Movement from Areas of High Head to Low Head 2
2 The Hydrologic Cycle 2
3 Flow Through Porous Media 3
4 Unconfined or Water Table Conditions in a Non-Pumping Situation 9
5 Confined or Artesian Conditions 10
6 Typical Multi-Aquifer System 11
7 Typical Valley-Fill Aquifer 12
8 Groundwater Recharge Due to Temporary Bank Storage 13
9 Induced Recharge Resulting From a Well Pumping Near a River 14
10 Development of Karst Topography 18
11 Cone of Depression Development Around Wells in Unconfined and Confined Aquifers 21
12 Flow Duration Curve 23
13 Hydrodynamic Control of a Contamination Plume 49
14 Permeable Treatment Bed 50
15 Hydrodynamic Control with a Conventional Treatment System on the Surface 51

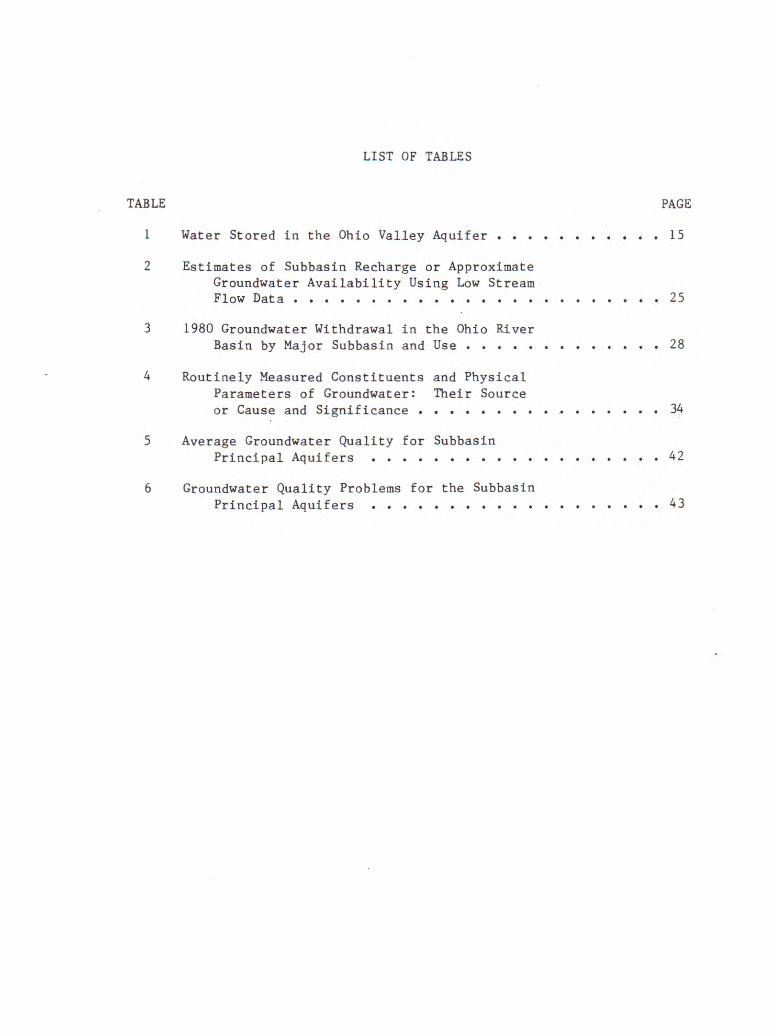
LIST OF TABLES
TABLE PAGE
1 Water Stored in the Ohio Valley Aquifer 15
2 Estimates of Subbasin Recharge or Approximate Groundwater Availability Using Low Stream Flow Data 25
3 1980 Groundwater Withdrawal in the Ohio River Basin by Major Subbasin and Use 28
4 Routinely Measured Constituents and Physical Parameters of Groundwater: Their Source
or Cause and Significance 34
5 Average Groundwater Quality for Subbasin Principal Aquifers 42
6 Groundwater Quality Problems for the Subbasin Principal Aquifers 43

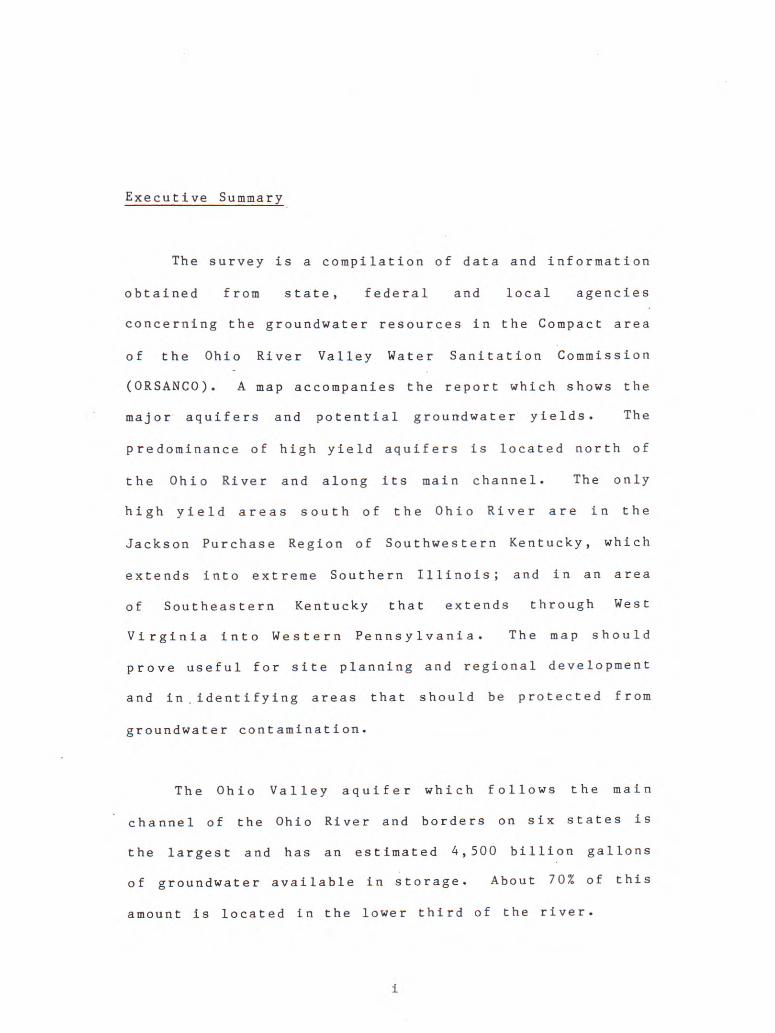
Executive Summary
The survey is a compilation of data and information
obtained from state, federal and local agencies
concerning the groundwater resources in the Compact area
of the Ohio River Valley Water Sanitation Commission
(ORSANCO). A map accompanies the report which shows the
major aquifers and potential groundwater yields. The
predominance of high yield aquifers is located north of
the Ohio River and along its main channel. The only
high yield areas south of the Ohio River are in the
Jackson Purchase Region of Southwestern Kentucky, which
extends into extreme Southern Illinois; and in an area
of Southeastern Kentucky that extends through West
Virginia into Western Pennsylvania. The map should
prove useful for site planning and regional development
and in identifying areas that should be protected from
groundwater contamination.
The Ohio Valley aquifer which follows the main
channel of the Ohio River and borders on six states is
the largest and has an estimated 4,500 billion gallons
of groundwater available in storage. About 70% of this
amount is located in the lower third of the river.
1
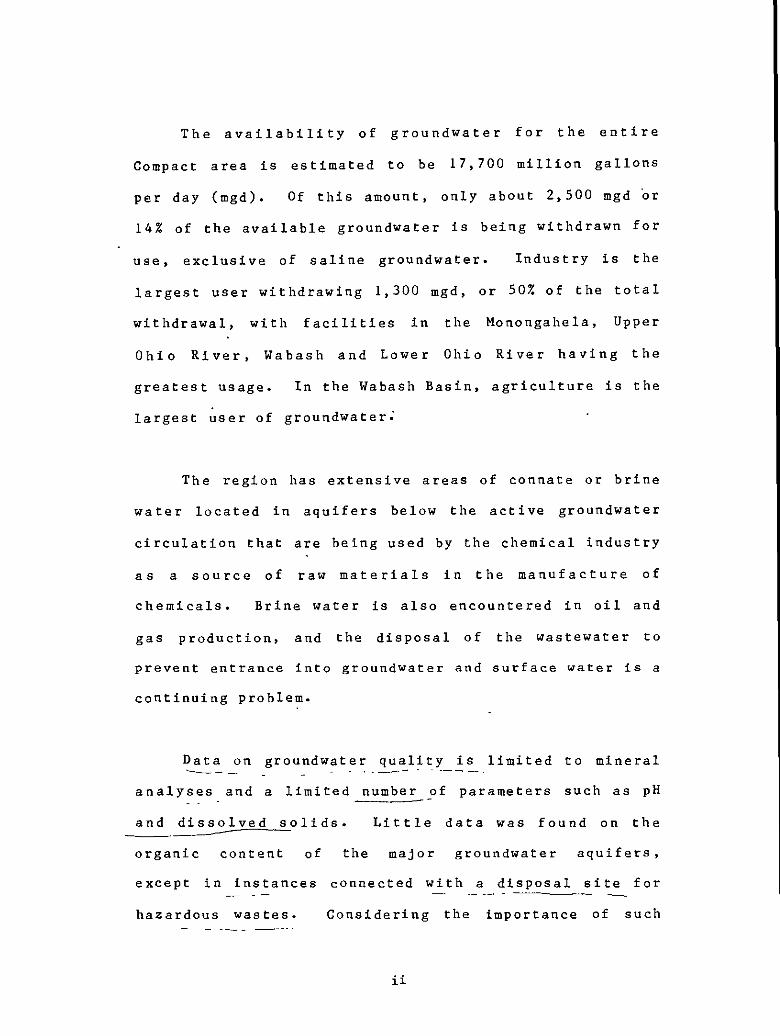
The availability of groundwater for the entire
Compact area is estimated to be 17,700 million gallons
per day (mgd). Of this amount, only about 2,500 mgd r
14% of the available groundwater is being withdrawn for
use, exclusive of saline groundwater. Industry is the
largest user withdrawing 1,300 mgd, or 50% of the total
withdrawal, with facilities in the Monongahela, Upper
Ohio River, Wabash and Lower Ohio River having the
greatest usage. In the Wabash Basin, agriculture is the
largest user of groundwater;
The region has extensive areas of connate or brine
water located in aquifers below the active groundwater
circulation that are being used by the chemical industry
as a source of raw materials in the manufacture of
chemicals. Brine water is also encountered in oil and
gas production, and the disposal of the wastewater to
prevent entrance into groundwater and surface water is a
continuing problem.
Data on groundwater quality is limited to mineral
analyses and a limited number of parameters such as ph
and dissolved solids. Little data was found on the
organic content of the major groundwater aquifers,
except in instances connected with a disposal site for
hazardous wastes. Considering the importance of such
11
data and the toxicity of many organic compounds, there
is a need to increase the level of surveillance.
An increasing number of cases of groundwater
contamination is being reported, such as the two cases
cited in the report. Because many of the major aquifers
transcend state lines, failure to protect groundwater
resources has far-reaching implications. Seventy
percent of the surface impoundments -- farm ponds,
reservoirs, ash settling ponds, etc. nationwide
overlie very permeable aquifers. Ninety percent of
these impoundments are located within one mile of a
drinking water source. Little or no information was
found on the extent of groundwater pollution that may
transcend state borders involving organic chemicals in
the principal aquifers of the Compact area.
111

INTRODUCTION
The Ohio River Valley is blessed with an
abundance of water. The USGS (1984) estimates that
about 7% of all freshwater withdrawn in 1980,
excluding hydroelectric power generation, was
groundwater, constituting a significant part of the
total water resource. A simple water budget reveals
that once evapotranspiration and groundwater recharge
demands are satisfied, the precipitation excess is
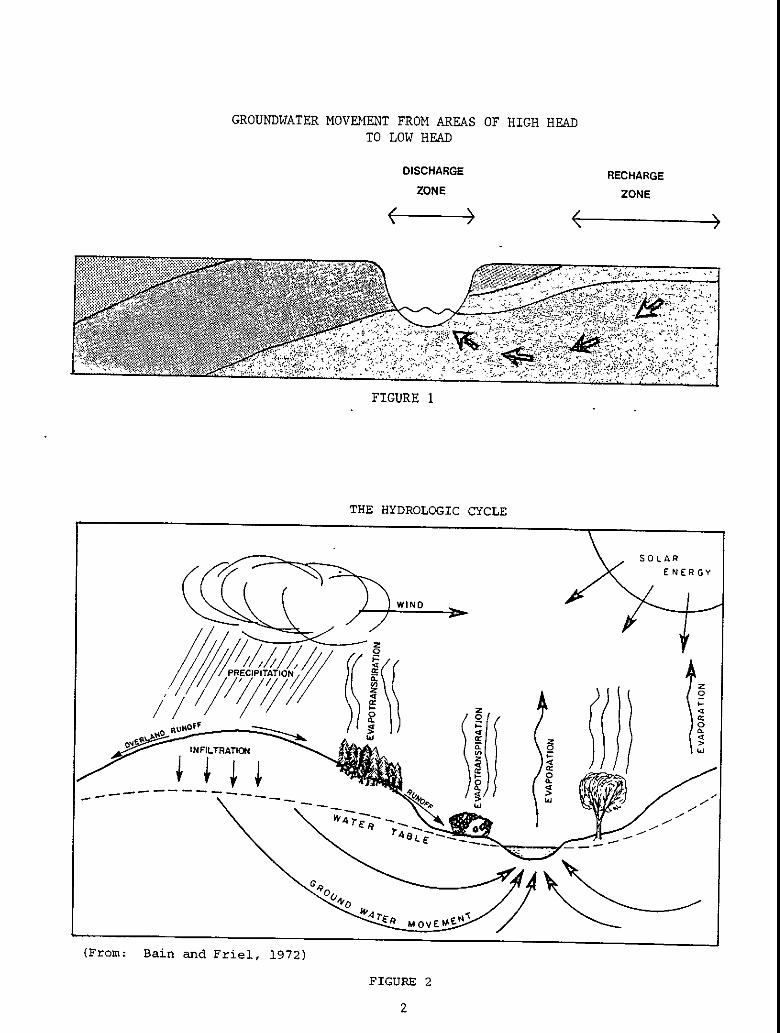
considered runoff to the stream. Having reached the
saturated subsurface or phreatic zone, groundwater
generally moves from areas of high head (i.e., high
elevation) to low head (i.e., low elevation),
primarily under the influence of gravity (Figure 1).
During dry weather, when there is little or no
surface runoff, groundwater is responsible for the
flow of perennial streams and springs. This- is known
as base flow and contributes to surface flow at a
relatively constant rate all year. As the hydrologic
cycle shows (Figure 2) discharged groundwater becomes
surface water, (after some delay), evaporates to the
atmosphere, and eventually returns via precipitation.
1
SOLAR ENERGY
WINO
z // / , 0
jf c/f ECIPITATIO,//' 1 I
jl I' Z I\ c \\
112 /1 c >
NP LTRATION " Z
12 ! IglI
IsI
z 0
GROUNDWATER MOVEMENT FROM AREAS OF HIGH HEAD TO LOW HEAD
DISCHARGE RECHARGE ZONE ZONE >
FIGURE 1
THE HYDROLOGIC CYCLE
(From: Bain and Friel, 1972)
FIGURE 2
2
Direction of flow
(From: Todd, 1980)
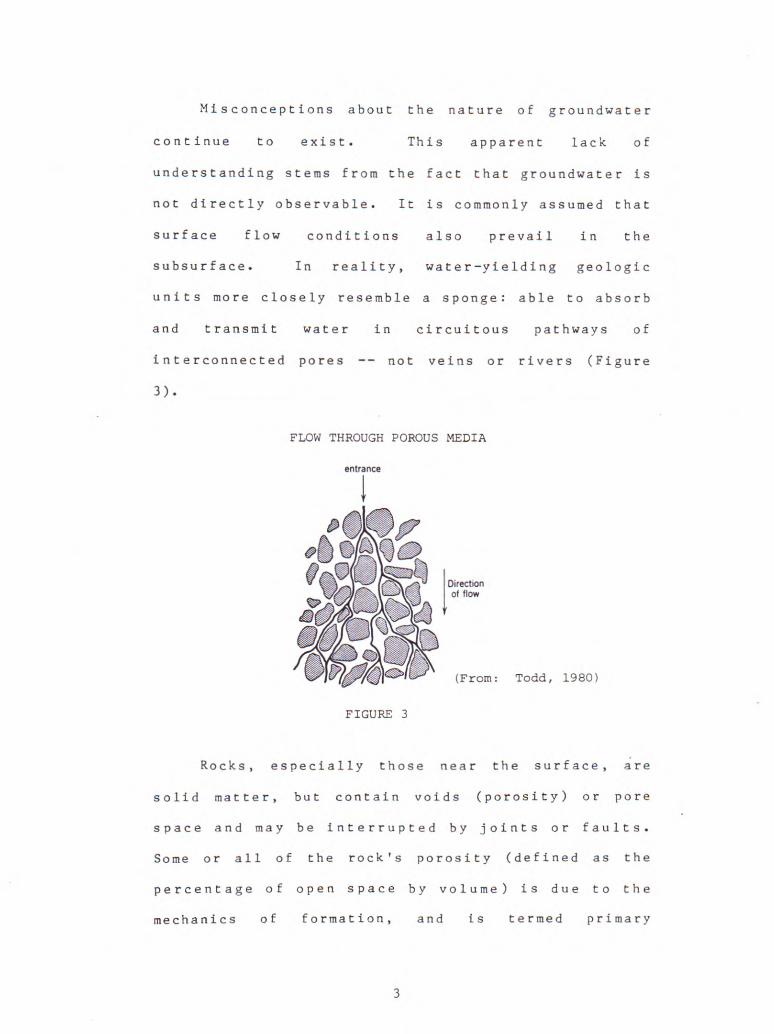
Misconceptions about the nature of groundwater
continue to exist. This apparent lack of
understanding stems from the fact that groundwater is
not directly observable. It is commonly assumed that
surface flow conditions also prevail in the
subsurface. In reality, water-yielding geologic
units more closely resemble a sponge: able to absorb
and transmit water in circuitous pathways of
interconnected pores not veins or rivers (Figure
3).
FLOW THROUGH POROUS MEDIA
entrance
FIGURE 3
Rocks, especially those near the surface, are
solid matter, but contain voids (porosity) or pore
space and may be interrupted by joints or faults.
Some or all of the rock's porosity (defined as the
percentage of open space by volume) is due to the
mechanics of formation, and is termed primary
3
porosity. Porosity which is generated subsequent to
rock formation due to various chemical and mechanical
processes (e.g., stress relief, faulting, and
weathering) is secondary porosity.
Profuse space is not enough to sustain a large
groundwater resource. There must also be pore
interconnection or permeability. The ability of
water to move through rock is known as hydraulic
conductivity, and varies widely among materials. It
is highly dependent upon pore size, shape, and
arrangement. Consequently, permeable rock units
generally perform like pipelines filled with sand in
their ability to conduct water under a head
differential. In fact, Henry Darcy used an analogous
physical model in 1856 to develop tire groundwater
movement equation about which all scientific study of
groundwater revolves. Darcy's law states that QKAI
where:
Q is the quantity of water per unit time
(gallons per minute);
K is the hydraulic conductivity (gallons per
minute/sq. ft.);
A is the cross—sectional area normal to the
direction of flow (sq. ft.); and
I is the hydraulic gradient or change in head
per unit distance (dimensionless).
4
141
Because hydraulic conductivity (K) and
cross-sectional area (A) are approximately constant,
the quantity of water (Q) is directly proportional to
the hydraulic gradient (I). This suggests that fluid
flow is laminar (i.e., streamlined) or nearly so.
Most geological conditions are conducive to laminar
flow. When flow becomes turbulent, such as occurs in
Karst regions (e.g., caves) and other large rock
openings, the equation is no longer valid.
Porous rock, with high permeability, and a
copious supply of recharge will result in a large,
renewable supply of groundwater that may be tapped
naturally by springs and streams or by wells.
Groundwater is ubiquitous in the Ohio River Valley.
Digging or drilling will produce groundwater
anywhere, although not necessarily in a usable
quantity. If groundwater is available, then the
water-bearing layer (formation) is defined as an
aquifer. It may or may not be in usable quantity or
quality. For example, an aquifer or water-bearing
unit capable of yielding several hundred gallons per
day (GPD) would be an aquifer suitable for domestic
water supply purposes, but would not be adequate for
an industry requiring this volume per minute.
5
Commonly, aquifers are classified by their
potential yield in gallons per minute (GPM) on a
sustained basis. For the Ohio River Valley, the
principal aquifers have been defined as those capable
of yielding 100 GPM or more to many individual wells.
Although 100 GPM is an arbitrary value depending
upon, among other things, well construction and pump
size, it represents the production level necessary to
constitute a water supply for most large industry and
medium to large municipalities. It is aquifers such
as these that were deemed to be regionally
significant, and have been chosen for detailed study
because of their potential yield and other quality
characteristics.
6
PRINCIPAL AQUIFERS
There are two broad types of principal aquifers
in the Ohio River Valley: the unconsolidated sands
and gravels of glacial and coastal plain deposits and
consolidated sedimentary rocks or bedrock. Plate 1
shows potential groundwater yields in the Compact
District. The dark blue represents areas capable of
yielding 100 GPM or more per well. The light blue
represents areas capable of yielding more than 20 GPM
but less than 100 GPM. The white represents areas
capable of yielding less than 20 GPM. It should be
noted that groundwater may occur in more than one
geologic unit. Therefore, the Indicated yield may be
available from more than one aquifer. This is
especially true north of the Ohio River where high
yield glacial outwash overlies high yield bedrock in
many places. Note that the shape of glacial and
other aquifers that are not extensive may be
completely masked by more extensive aquifers In the
same location.
The map shows the predominance of high yield
aquifers north of the Ohio River and along its
channel. The only high yield areas south of the Ohio
7
River are in the Jackson Purchase Region of
southwestern Kentucky and in the extensive sandstones
and conglomerates running from southeastern Kentucky,
through West Virginia, and into western Pennsylvania.
The map is particularly useful for site planning and
regional development. For example, industries and
other groundwater users, who know their demand for
groundwater, can restrict their regional site search
to those areas capable of satisfying their needs.
Additionally, the map can be used to delineate areas
that
should be aggreàsively pt'otected from
groundwater contamination.
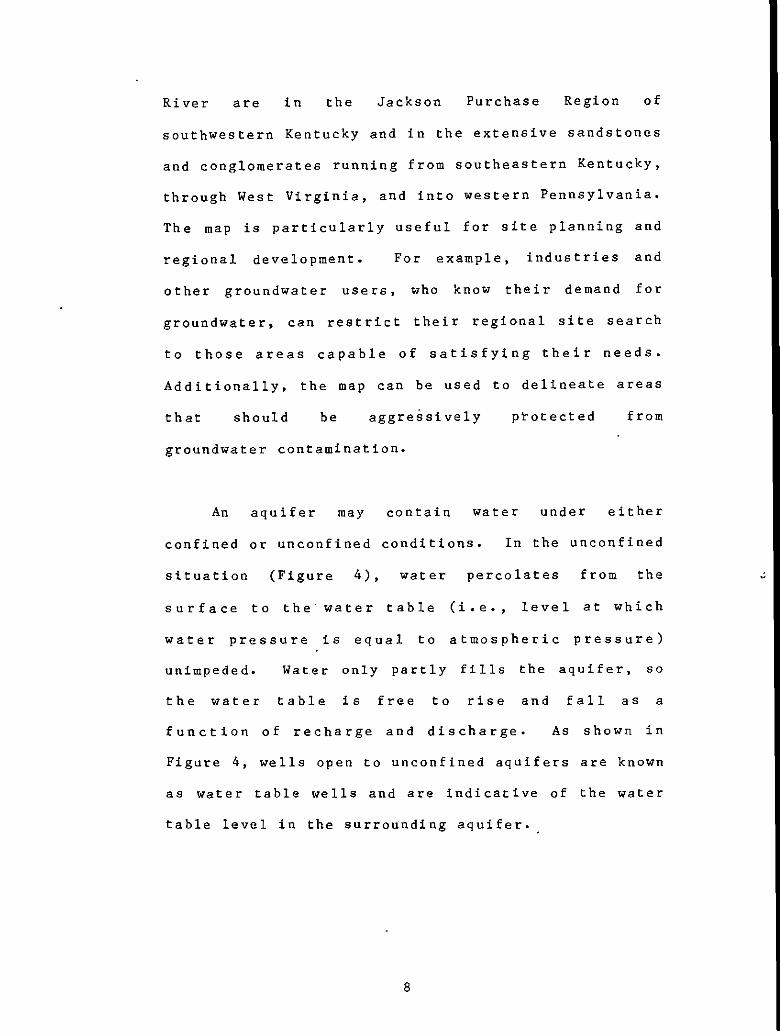
An aquifer may contain water under either
confined or unconfined conditions. In the unconfined
situation (Figure 4), water percolates from the
surface to the water table (i.e., level at which
water pressure is equal to atmospheric pressure)
unimpeded. Water only partly fills the aquifer, so
the water table is free to rise and fall as a
function of recharge and discharge. As shown in
Figure 4, wells open to unconfined aquifers are known
as water table wells and are indicative of the water
table level in the surrounding aquifer. -
8
UNCONFINED OR WATER TABLE CONDITIONS IN A NON-PUMPING SITUATION
WATER TABLE
WELL
FIGURE 4
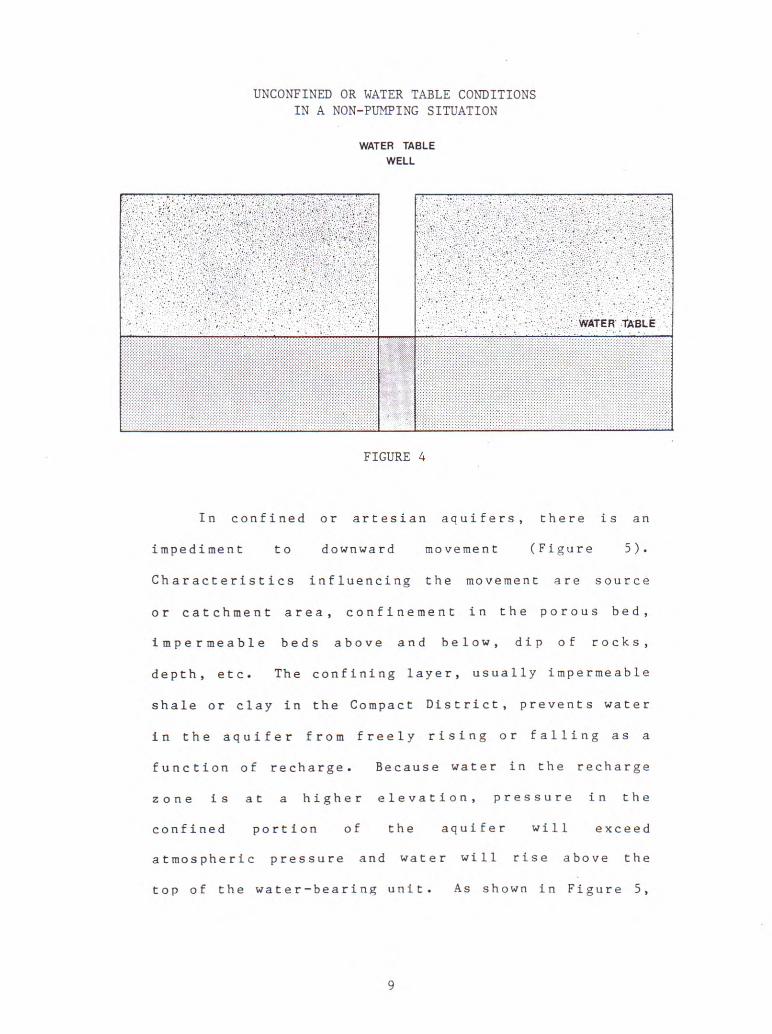
In confined or artesian aquifers, there is an
impediment to downward movement (Figure 5).
Characteristics influencing the movement are source
or catchment area, confinement in the porous bed,
impermeable beds above and below, dip of rocks,
depth, etc. The confining layer, usually impermeable
shale or clay in the Compact District, prevents water
in the aquifer from freely rising or falling as a
function of recharge. Because water in the recharge
zone is at a higher elevation, pressure in the
confined portion of the aquifer will exceed
atmospheric pressure and water will rise above the
top of the water-bearing unit. As shown in Figure 5,
9
Recharge area
Water t table Ground Flowing
surfaceJWeU
.'IIA-
Artesian well
Impermeable strata
conrined aquifer
(After: Todd. 1980)
this level will sometimes be above land surface,
resulting in a flowing artesian well.
CONFINED OR ARTESIAN CONDITIONS
FIGURE 5
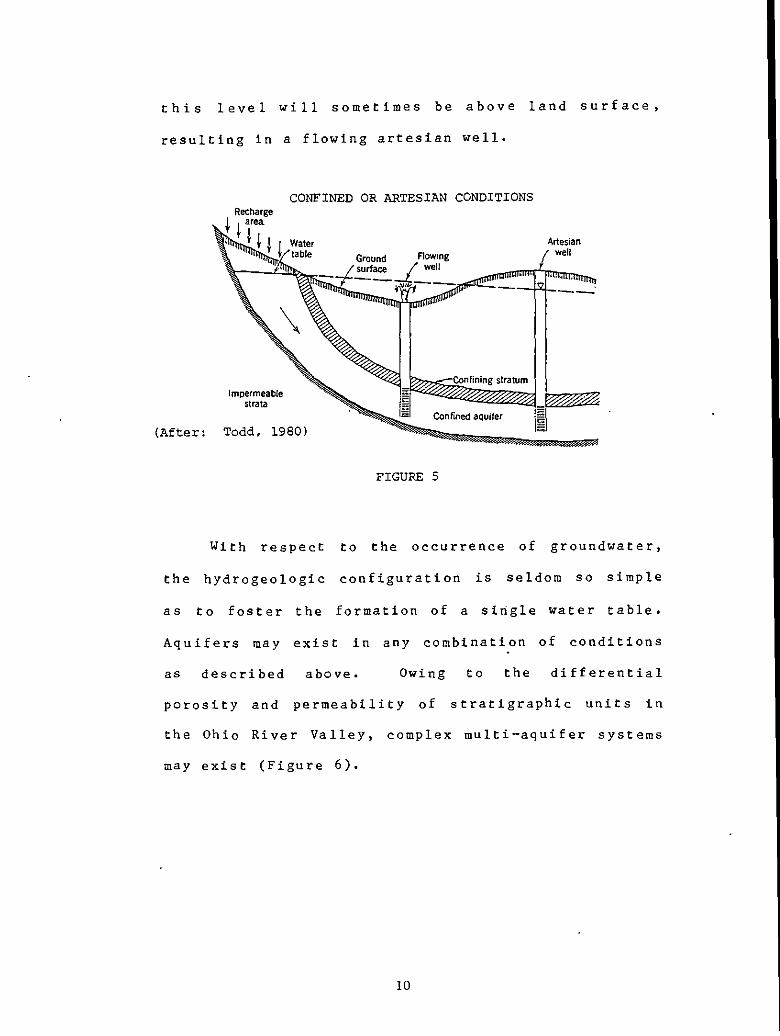
With respect to the occurrence of groundwater,
the hydrogeologic configuration is seldom so simple
as to foster the formation of a single water table.
Aquifers may exist in any combination of conditions
as described above. Owing to the differential
porosity and permeability of stratigraphic units in
the Ohio River Valley, complex multi—aquifer systems
may exist (Figure 6).
10
AQUIF
AQUIFER
WATERTABLE
(After: Davis and DeWiest, 1966)
CONFINED WATER
FIGURE 6
AQUIFER
SPRINGS-
LAND SURFACE
WATERTABLE
STREAM
TYPICAL MULTI-AQUIFER SYSTEM
Glacial aquifers are, for the most part, limited
to areas north of the Ohio River and along its
channel. These aquifers, sometimes known as
valley-fill aquifers, have a distinct, riverine
geometry because they occupy the valleys of
preglacial streams. These buried valleys are filled
with sand and gravels to depths sometimes exceeding
200 feet, forming high yield aquifers capable of
sustaining intensive groundwater development.
Because of the complexity of glacial and outwash
processes, most valley-fill aquifers have
discontinuous clay lenses and extensive layers of
impermeable silt and clay associated with them
11

800 600
450 450
350 0
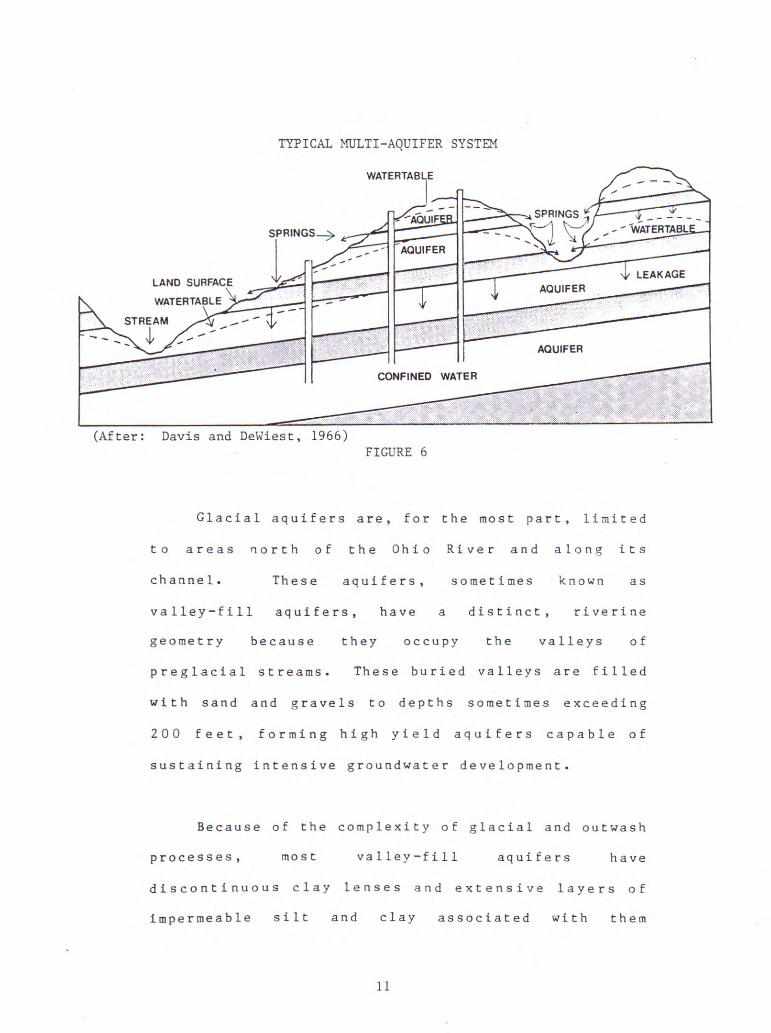
TYPICAL VALLEY-FILL AQUIFER A, A
CLAY
SAuD
GRAVCI.
SHALE
LIMESTONE
50
5CALZ IN fliT
5208
$08 P 208 TAt.
500
400
a
(Figure 7); producing complex flow systems where
pressure conditions change rapidly in time and space.
(From: Schmidt, 1959)
FIGURE 7
Many valley-fill aquifers have major streams flowing
on their surface. If hydraulically connected to the
groundwater, modern streams serve as a source of
additional recharge should the normal hydraulic
gradient be reversed by high stream flow (Figure 8)
or heavy pumping (Figure 9). As shown in Figure 9,
12
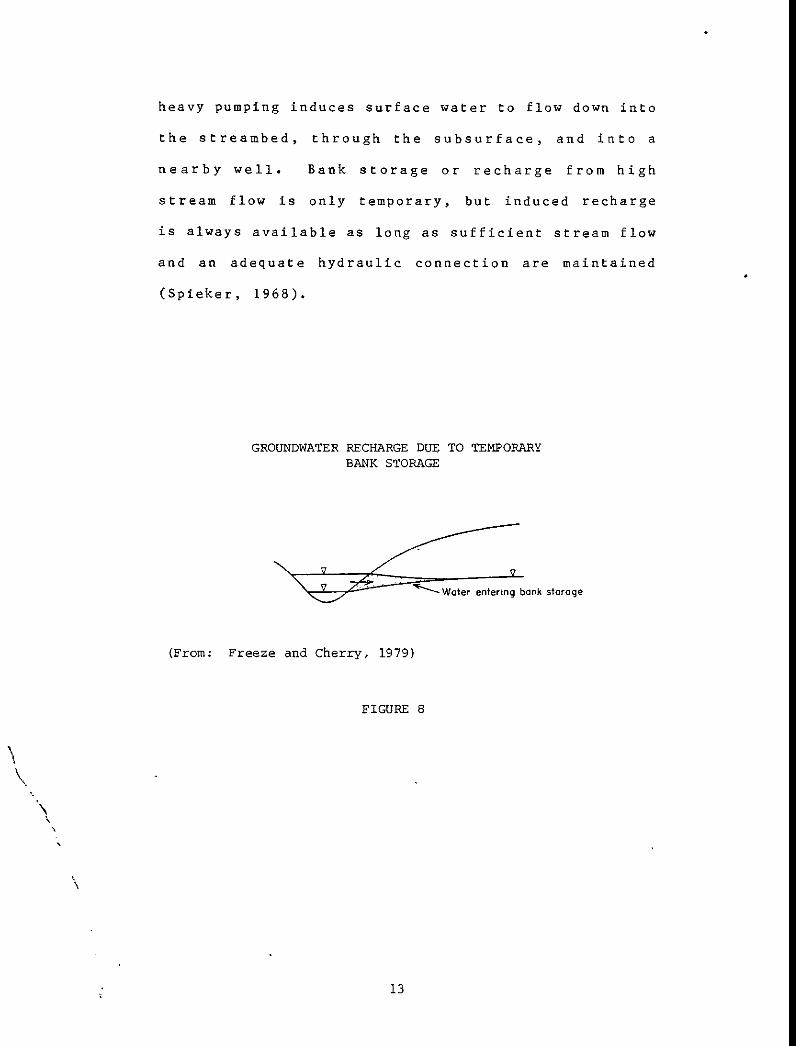
heavy pumping induces surface water to flow down into
the streambed, through the subsurface, and into a
nearby well. Bank storage or recharge from high
stream flow is only temporary, but induced recharge
is always available as long as sufficient stream flow
and an adequate hydraulic connection are maintained
(Spieker, 1968).
GROUNDWATER RECHARGE DUE TO TEMPORARY BANK STORAGE
Water entering bank storage
(From: Freeze and Cherry, 1979)
FIGURE 8
13
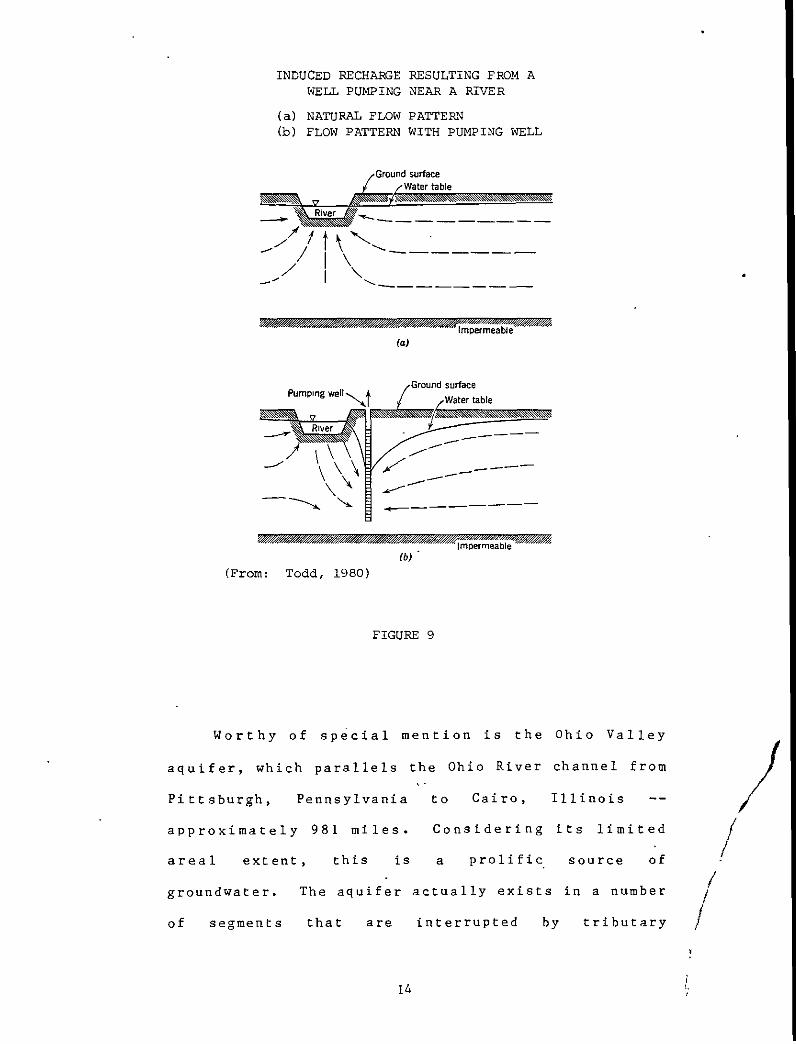
INDUCED RECHARGE WELL PUMPING
(a) NATURAL FLOW (b) FLOW PATTERN
RESULTING FROM A NEAR A RIVER
PATTERN WITH PUMPING WELL
Ground surface Water table
River
yt /
ssssasaimpermeaDle j'ssa
(a)
Pumping well Ground surface
Water table
raasasj—sa Impermeable
(6)
(From: Todd, 1980)
FIGURE 9
Worthy of special mention is the Ohio Valley
aquifer, which parallels the Ohio River channel from
Pittsburgh, Pennsylvania to Cairo, Illinois
approximately 981 miles. Considering its limited
areal extent, this is a prolific source of
groundwater. The aquifer actually exists in a number
of segments that are interrupted by tributary
14
The other
unconsolidated sediments
comprised of
is the sands and gravels in
major aquifer
valleys, and in some locations being displaced some
distance from the present river course. In addition,
the size has also been influenced by the high level
navigation dams which have altered the storage of the
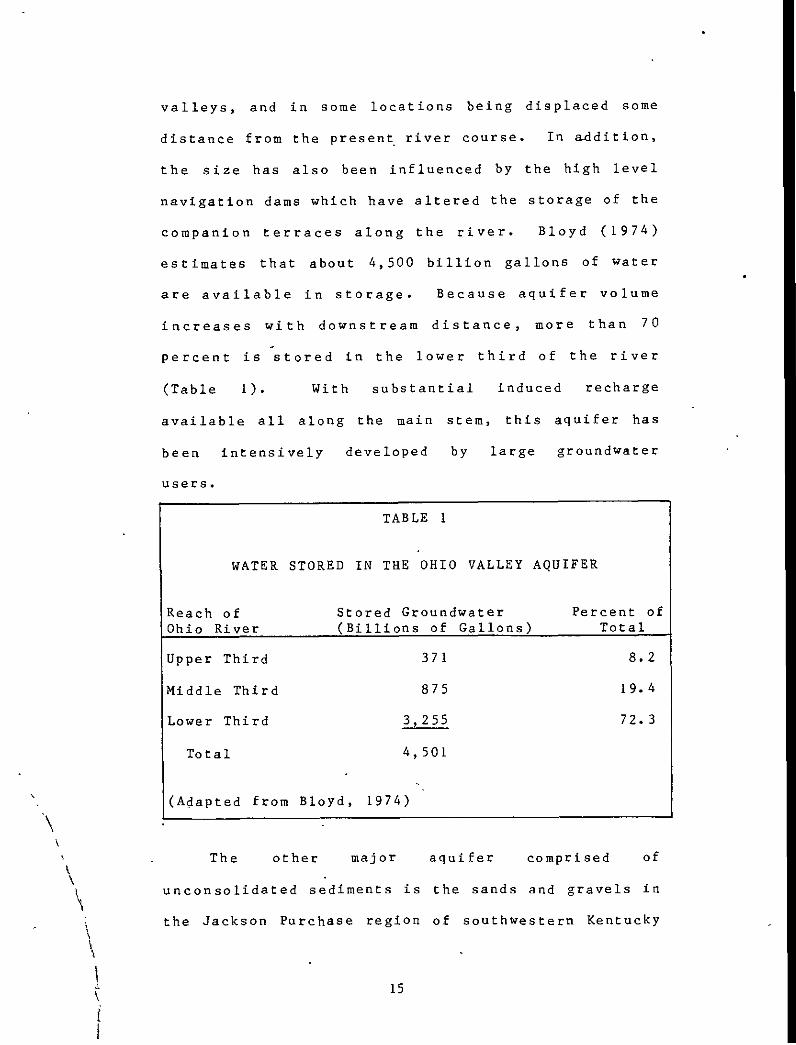
companion terraces along the river. Bloyd (1974)
estimates that about 4,500 billion gallons of water
are available in storage. Because aquifer volume
increases with downstream distance, more than 70
percent is stored in the lower third of the river
(Table 1). With substantial induced recharge
available all along the main stem, this aquifer has
been intensively developed by large groundwater
users.
TABLE 1
WATER STORED IN THE OHIO VALLEY AQUIFER
Reach of Ohio River
Stored Groundwater (Billions of Gallons)
Percent of Total
Upper Third 371 8.2
Middle Third 875 19.4
Lower Third 3,255 72.3
Total 4,501
(Adapted from Bloyd, 1974)
the Jackson Purchase region of southwestern Kentucky
15
and extreme southern Illinois. This is a thick
coastal plain deposit yielding large amounts of water
close to the bedrock contact where very coarse
grained sediments intermingle with the rubble of
weathered bedrock (Davis, Lambert, and Hansen, 1973).
The remaining aquifers of regional significance
are in extensive consolidated sediments (i.e.,
sandstones, conglomerates, limestones, and
dolomites). These rocks were all formed in ancient
seas. Someancient seawater is believed to have been
retained with these sediments during induration, and
is known as connate water or brine. Some brine is
very rich in trace elements and minerals and
relatively close to the surface. These
characteristics attracted early chemical industries
to several sires in the Ohio River Valley (e.g.,
Charleston, WV; Barberton, OH; New Martinsville, WV;
and others). Although some flushing has occurred,
connate water exists in these rocks below the zone of
active groundwater circulation (about 300-500 feet
below the surface in most areas). To maintain a good
water supply, it is imperative that wells only tap
the zone of active circulation, and are not
o v e r pumped. Otherwise, connate brines will migrate
upward to the well bottom.
16
Although elastic sedimentary rocks (e.g.,
sandstone and conglomerates) are composed of
fragments of preexisting rock, their primary porosity
is not particularly high because plugging or
tightness is caused more often from clays and fines.
Of a secondary nature is the cementing agent, usually
calcium carbonate or ferric hydroxide which coats the
grains and fills in much of the pore space in near
surface rocks. For a elastic sedimentary rock to be
a principal aquifer, it must have considerable
secbndàry porosity. This can occur through faulting
and jointing, but more extensive development is
usually a result of stress relief and weathering
(Wyrick and Borchers, 1981). where many of these
secondary openings can be intersected, yields will be
substantially higher.
The carbonates (limestone and dolomite) differ
from the coarse elastics in that they were formed in
warm seas by chemical precipitation of calcium
carbonate and magnesium carbonate or from the
deposition of calcareous plants and animals.
Carbonates are typically very dense and, in some
cases, very thick. They are, however, quite soluble
in acidic water. After forming cracks and crevices
as a result of various stress or release factors,
these openings and the inherent zones of weakness
17
- - ..
?
- . -.------ -'
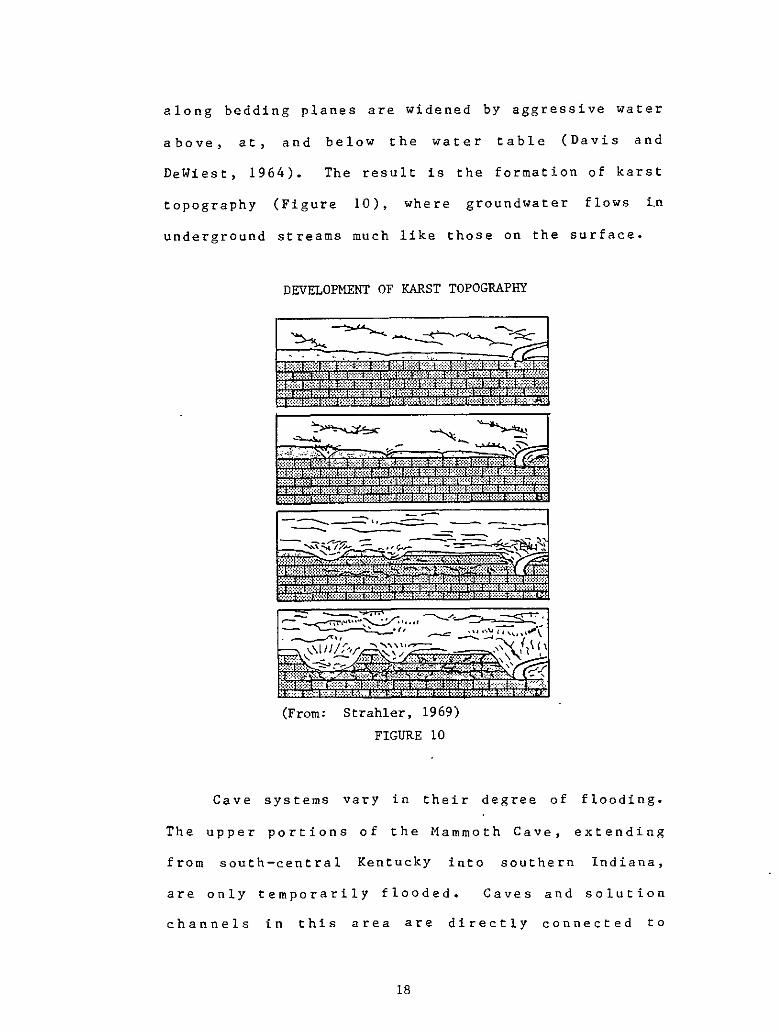
along bedding planes are widened by aggressive water
above, at, and below the water table (Davis and
DeWiest, 1964). The result is the formation of karst
topography (Figure 10), where groundwater flows i.n
underground streams much like those on the surface.
DEVELOPMENT OF KARST TOPOGRAPHY
(From: Strahler, 1969)
FIGURE 10
Cave systems vary in their degree of flooding.
The upper portions of the Mammoth Cave, extending
from south—central Kentucky into southern Indiana,
are only temporarily flooded. Caves and solution
channels in this area are directly connected to
18
surface flow through numerous sink holes dotting the
landscape. Water quickly drains to the groundwater
base level (the Green River around Mammoth Cave) and
the caves and smaller openings dry up -- offering no
water to wells. In west—central Ohio and
east—central Indiana, caves and solution openings are
permanently saturated. This cave terrane was formed
at a time of much lower drainage elevation or base
level (Teays drainage) prior to glacial activity.
The effect of the glaciers was to smooth out the
topography and raise the base level by cutting off
ridges and filling valleys with eroded material.
Consequently, the water table rose to feed perennial
streams and saturate what was once a dry cave system
(Norris and Fidler, 1973). The cave is now a high
yield aquifer.
19

GROUNDWATER AVAILABILITY
In developing groundwater resources, it is
important to define aquifer characteristics and
determine aquifer yield. This requires, among other
information, a thorough knowledge of:
1. The position and thickness of the aquifer
and confining beds;
2. The transmissivity (i.e., hydraulic
conductivity x saturated thickness) and
storage coefficient (i.e., the volume of
water that is released from or taken into
storage per unit surface area of aquifer per
unit change in head normal to that surface);
3. The hydraulic characteristics of the
confining beds;
4. The position and nature of aquifer
boundaries; and
5. The location and amounts of withdrawal from
existing wells, and the water budget of the
basin.
Except for the last element, this information is
best acquired by test drilling and conducting a pump
20
I N
LIMITS OF CONE OF DEPRESSION
t -- ,,' -
DRAWDOWN CONE OF
\ DEPRESSION CONFINING BED
CONFINING BED
t
Heath, 1983) (From:
LAND SURFACE-._.
CONFINING BED
LAND SURFACE-_..
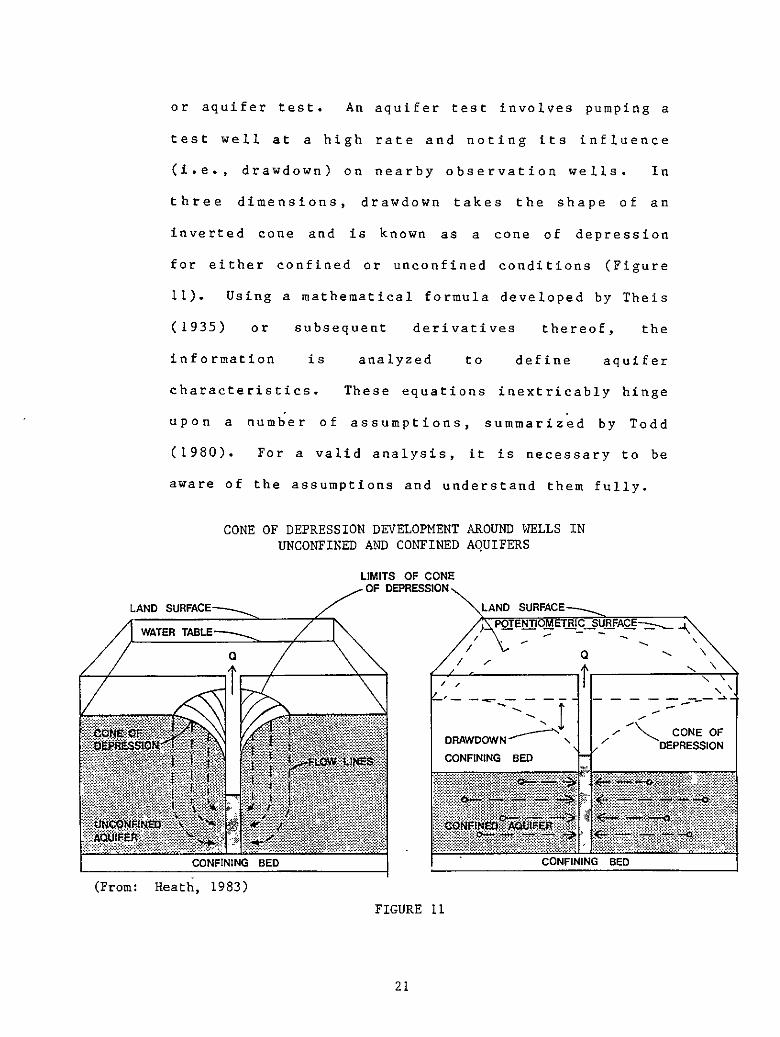
or aquifer test. An aquifer test involves pumping a
test well at a high rate and noting its influence
(i.e., drawdown) on nearby observation wells. In
three dimensions, drawdown takes the shape of an
inverted cone and is known as a cone of depression
for either confined or unconfined conditions (Figure
11). Using a mathematical formula developed by Theis
(1935) or subsequent derivatives thereof, the
information is analyzed to
define aquifer
characteristics. These equations inextricably hinge
upon a number of assumptions, summarized by Todd
(1980). For a valid analysis, it is necessary to be
aware of the assumptions and understand them fully.
CONE OF DEPRESSION DEVELOPMENT AROUND WELLS IN UNCONFINED AND CONFINED AQUIFERS
FIGURE 11
21
This type of detailed investigation is very
expensive because of drilling costs. As a result,
test drilling and an aquifer test are only used on a
local basis by large groundwater users (e.g.,
industries and municipalities) who must be able to
document the resource in order to secure their
investment and, in many cases, comply with
regulations. Test drilling and an aquifer test are
also now widely *used in groundwater contamination
studies and aquifer restoration projects, where it is
imperative to precisely
define aquifer
characteristics for design purposes.
For regional reconnaissance surveys, the
hydrologist must depend upon more indirect methods
such as water budgets or flow duration analysis to
estimate groundwater resources. The United States
Geological Survey (USGS), in cooperation with other
agencies, maintains a network of stream gauging
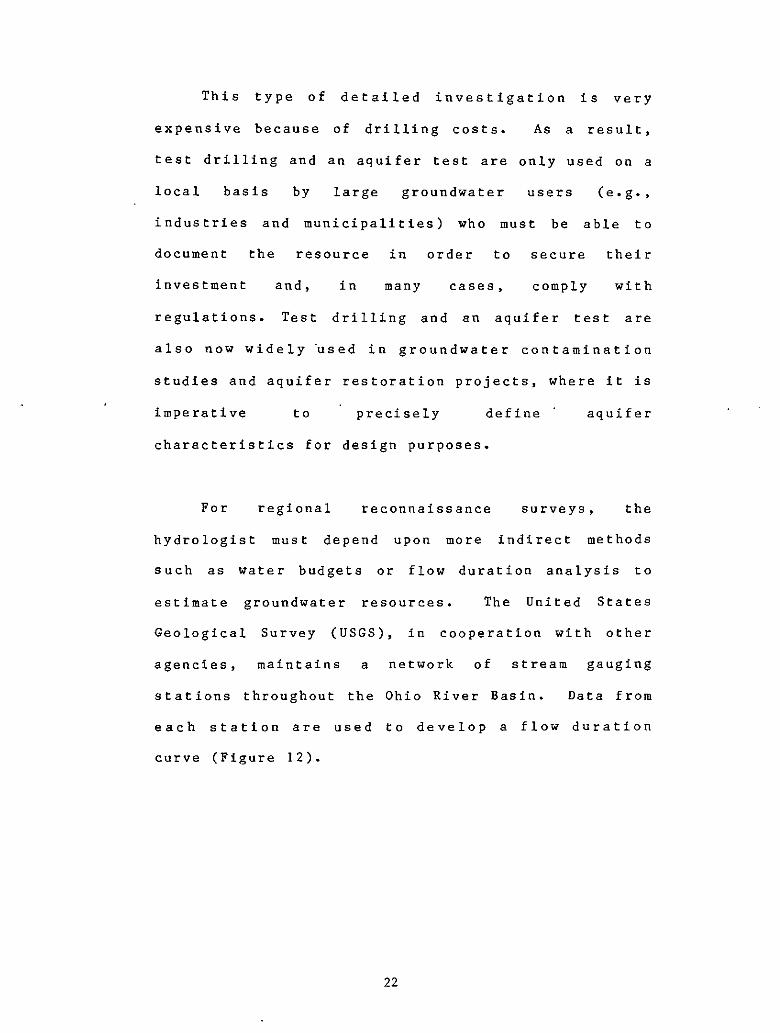
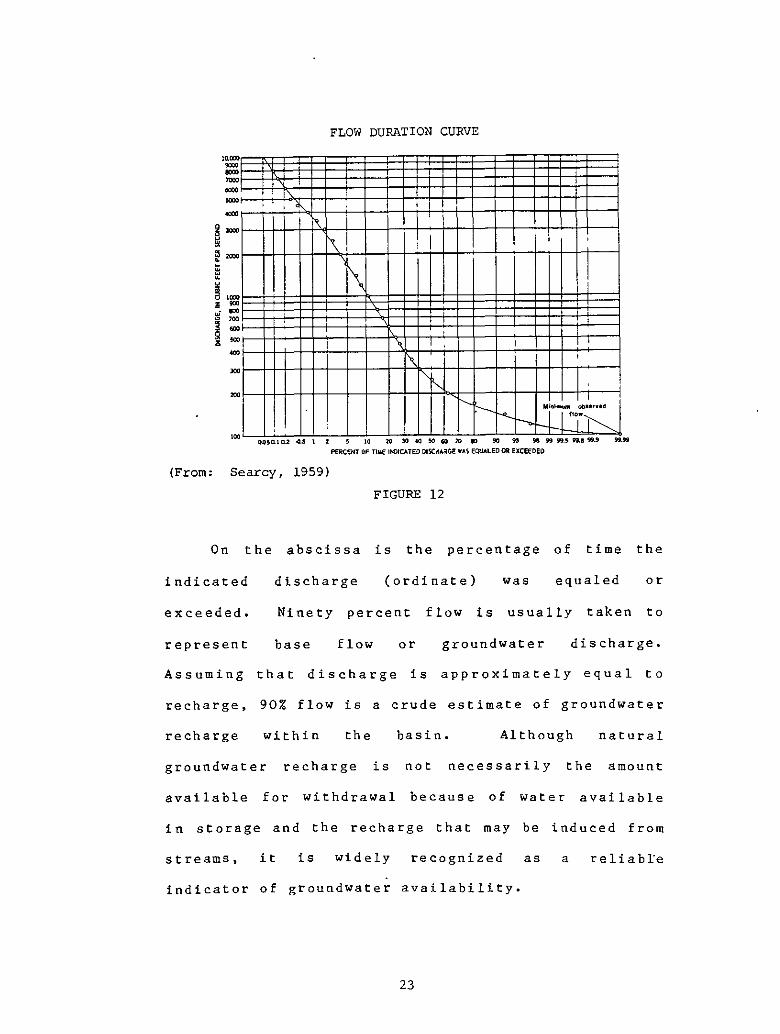
stations throughout the Ohio River Basin. Data from
each station are used to develop a flow duration
curve (Figure 12).
22
FLOW DURATION CURVE
MOOD 1000 SODS I
4000
WOOD
3000
SOD 310 700
tool
400
200
M&a.Hm a
0.14lD14S I 2
110
10 3040504010 to 9S9Ag9.,Itsfl'
Otto
P€RCEHT OF TIME POICATED DISCHARGE WAS EQUALED CR EXCEEDED
(From: Searcy, 1959)
FIGURE 12
On the abscissa is the percentage of time the
indicated discharge (ordinate) was equaled or
exceeded. Ninety percent flow is usually taken to
represent base flow or groundwater discharge.
Assuming that discharge is approximately equal to
recharge, 90% flow is a crude estimate of groundwater
recharge within the basin. Although natural
groundwater recharge is not necessarily the amount
available for withdrawal because of water available
in storage and the recharge that may be induced from
streams, it is widely recognized as a reliabLe
indicator of groundwater availability.
Ge, P
H C
UB
IC FE
ET
PE
R S
EC
OIW
23
A flow duration analysis using 1960 data
published in Deutsch et al. (1969) was performed for
each of the major subbasins in the Ohio River Basin
(Table 2). The furthest downstream gauging station
was used for unregulated subbasins. For regulated
streams, an average of all unaffected upstream and
tributary stations was used. This methodology was
problematic for the main stem of the Ohio River,
because data from unregulated tributaries completely
neglect significant contributions from the Ohio
Valley Aquifer. To conipensate for this deficiency,
it is assumed that 200,000 GPD recharges each square
mile of the Ohio Valley Aquifer (Bloyd, 1974). The
contribution of other glacial aquifers paralleling
controlled streams are similarly neglected but are
not considered to be significant in determining
groundwater availability in their respective
subbasins.
As shown in Table 2, subbasins dominated by
unconsolidated aquifers have prolific groundwater
resources. High base flow is a tribute to their
exceptional ability to store and transmit water.
Most subbasins dominated by bedrock aquifers do not
store or transmit water as well. They are,
nonetheless, regionally important because they extend
into rural areas where groundwater is the primary,
24
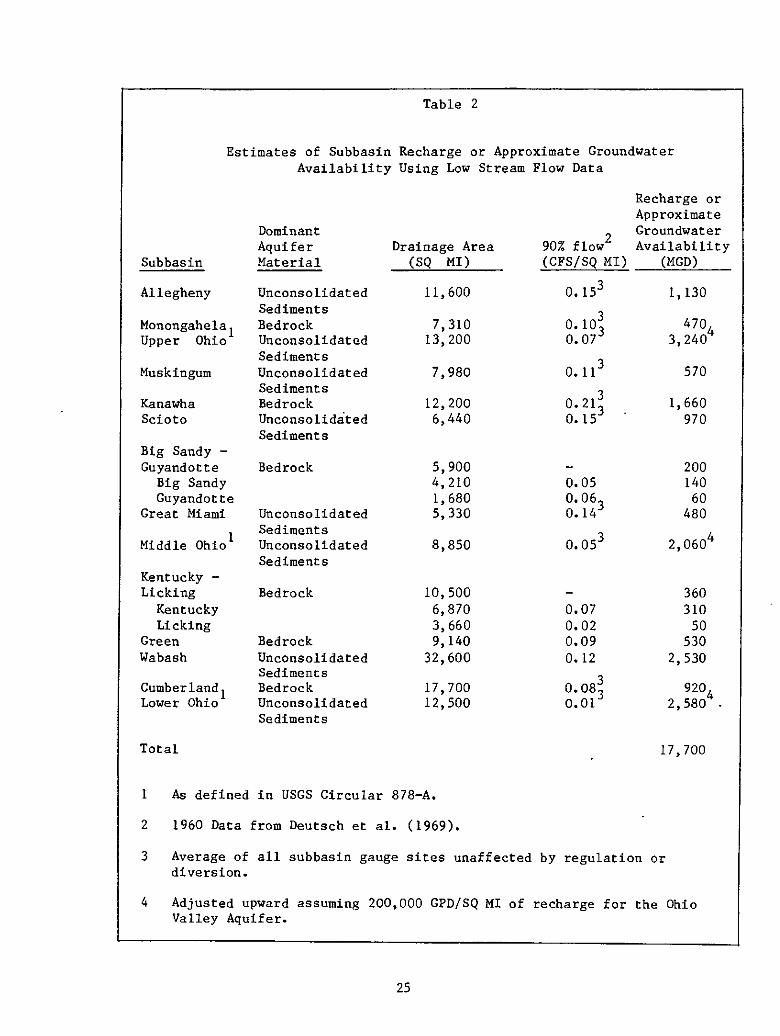
Table 2
Estimates of Subbasin Recharge or Approximate Groundwater Availability Using Low Stream Flow Data
Recharge or Approximate
Dominant Aquifer Drainage Area 2 90% flow
Groundwater Availability
Subbasin Material (SQ MI) (CFS/SQ MI) (MGD)
Allegheny Unconsolidated 11,600 0.15 1,130 Sediments
Monongahela1 Bedrock 7,310 0. 10 4704 Upper Ohio Unconsolidated 13,200 0.07 3,240
Sediments Muskingum Unconsolidated 7,980 0.11 3 570
Sediments Kanawha Bedrock 12,200 0.21 1,660 Scioto Unconsolidated 6,440 0.15 970
Sediments Big Sandy - Guyandotte Bedrock 5,900 -. 200
Big Sandy 4,210 0.05 140 Guyandot te 1,680 0.06, 60
Great Miami Unconsolidated 5,330 0.14 480 Sediments
Middle Ohio' Unconsolidated 8,850 0.05 2,060 Sediments
Kentucky - Licking Bedrock 10,500 360
Kentucky 6,870 0.07 310 Licking 3,660 0.02 50
Green Bedrock 9,140 0.09 530 Wabash Unconsolidated 32,600 0.12 2,530
Sediments Cumberland1 Bedrock 17,700 0.08 9204 Lower Ohio Unconsolidated 12,500 0.01 2,580 -
Sediments
Total 17,700
I As defined in USGS Circular 878—A.
2 1960 Data from Deutsch et al. (1969).
3 Average of all subbasin gauge sites unaffected by regulation or diversion.
4 Adjusted upward assuming 200,000 GPD/SQ MI of recharge for the Ohio Valley Aquifer.
25
and sometimes only, source of water. For the Ohio
Valley, there is about 17,700 million gallons per day
(MGD) of available groundwater.
A better approach to estimate groundwater
recharge is to construct a water budget for each
major subbasin. Over the long term, precipitation
( P ) is approximately equal to runoff (a) plus
evapotranspiration (EVT) plus groundwater recharge
(GB.): P = R + EVT + GR. Water budget analysis is
usually limited to small subbasiri studies because of
the difficulty in precisely defining
evapotranspiration over large areas. The National
Weather Service Ohio River Forecast Center estimates
evapotranspiration from conceptual watershed models
for about 400 subbasin stations in the Ohio River
Basin. More than 50% of the stations are
uncalibrated, but there is sufficient data to
construct water budgets for the Allegheny,
Monongahela, Kanawha, Big Sandy—Guyandotte, and
Scioto Subbasins. Until more stations are
calibrated, flow duration analysis remains the most
consistent means of estimating groundwater recharge
for the entire Ohio River Basin. /
It is useful to compare groundwater withdrawal
with estimates of groundwater availability by major
26
subbasins (Table 3). In 1980, 2500 MGD were
withdrawn in the Ohio River Valley. There is a
striking variation in subbasin groundwater
withdrawal. In those subbasins dominated by
unconsolidated sediments (e.g., the Wabash and Great
Miami Subbasins) there is tremendous usage of
groundwater. In fact, the Wabash Subbasin alone
accounts for more than 20% of total groundwater
withdrawal in the Valley. On the other hand, most of
the subbasins dominated by bedrock aquifers show very
little demand for groundwater. Although other
factors such as groundwater quality, surface water
availability, and the degree of regional development
are involved, the difference appears to be due to the
availability of potable groundwater and the ease with
which it can be developed to meet large needs.
Table 3 also shows that industry is the largest
user of groundwater in the Ohio River Valley, and is
of primary importance (i.e., constitutes more than
50% of total withdrawal) in the Monongahela, Upper
Ohio, Kanawha, Big Sandy-Guyandotte, Scioto and Lower
Ohio Subbasins. Public supplies account for about
30% of basin-wide withdrawal, and are of primary
importance in the Great Miami and Green Subbasins.
- Rural use is of primary importance in the
27
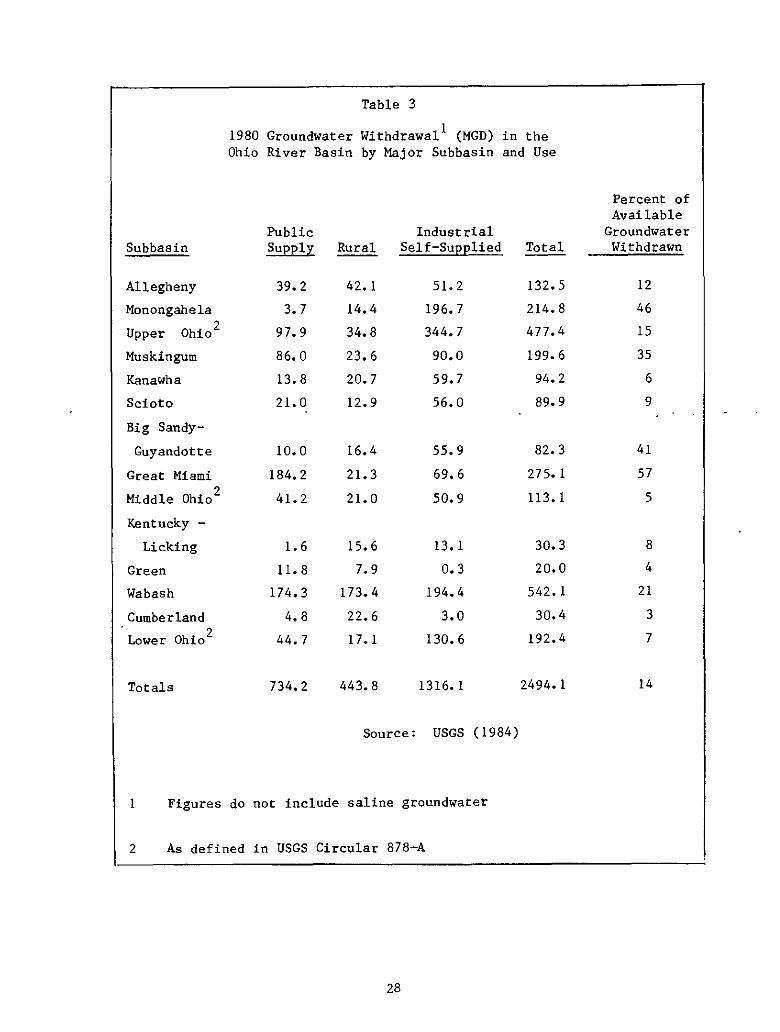
Table 3
Subbasin
1980 Groundwater Withdrawal' (MGD) in the Ohio River Basin by Major Subbasin and Use
Public Industrial Supply Rural Self-Supplied Total
Percent of Available
Groundwater Withdrawn
Allegheny 39.2 42.1 51.2 132.5 12
Monongahela 3.7 14.4 196.7 214.8 46
Upper Ohio 97.9 34.8 344.7 477.4 15
Muskingum 86.0 23.6 90.0 199.6 35
Kanawha 13.8 20.7 59.7 94.2 6
Scioto 21.0 12.9 56.0 89.9 9
Big Sandy-
Guyandotte 10.0 16.4 55.9 82.3 41
Great Miami 184.2 21.3 69.6 275.1 57
Middle Ohio 41.2 21.0 50.9 113.1 5
Kentucky -
Licking 1.6 15.6 13.1 30.3 8
Green 11.8 7.9 0.3 20.0 4
Wabash 174.3 173.4 194.4 542.1 21
Cumberland 4.8 22.6 3.0 30.4 3
Lower Ohio 44.7 17.1 130.6 192.4 7
Totals 734.2 443.8 1316.1 2494.1 14
Source: USGS (1984)
1 Figures do not include saline groundwater
2 As defined in USGS Circular 878-A
28
Kentucky Licking and Cumberland Subbasins, but is the
least important use basin-wide.
In no case does present subbasin demand exceed
60% of estimated availability. Regionally, this
seems to suggest that groundwater resources are not
yet being used to their fullest extent. In fact,
groundwater withdrawal is only about 14% of that
available basin-wide. Actual subbasin percentages
are, in many cases, substantially lower because of
the ability to induce recharge from surface streams.
Moreover, as long as sufficient streamflow is
maintained in areas amenable to induced recharge, the
groundwater resource is virtually unlimited (Spieker,
1968).
From time to time, temporary problems of local
overdraft occur. When withdrawal exceeds recharge
over long periods of time, groundwater is being
mined. The net effect, although this may occur very
gradually, is the continual lowering of groundwater
levels which is now being experienced in the
west-central and southwestern United States. As
groundwater levels become more seriously depressed,
other problems may arise. These include, any
combination of the following:
29
1. increased pumping casts;
2. interruption of water supplies;
3. land subsidence;
4. deteriorating water quality; and
5. legal disputes.
Groundwater disputes can have complex legal
ramifications given the generally undefined nature of
groundwater rights in the Compact District. The
Signatory States adhere to riparian water rights,
exaept for Kentucky and Virginia who have adopted
some supplemental appropriative rights (Edison
Electric Institute, 1984). For example, while
continuing to adhere generally to riparian rights
policy, Virginia has legislated administrative
requirements for groundwater withdrawal permits for
large industrial and commericial users in stipulated
critical areas. For settling groundwater disputes in
the absence of permits, the courts rely upon the
American "Rule of Reasonable Use." This rule limits
the landowner's withdrawal to amounts necessary for
some useful or beneficial purpose in connection with
the overlying land. Indiscriminate use is not
permitted, and the common rights of landowners
6verlying the groundwater reservoir are recognized
and protected against injury by those who would waste
water. There is no accepted definition of reasonable
30
groundwater use, leaving the determinations of
reasonableness to be made on a case-by-case basis
(Tank, 1983).
31
GROUNDWATER QUALITY
Groundwater quality has not received much
attention until very recently, when much evidence
(mostly anecdotal) began to suggest the possibility
of a regional contamination problem. Industrial
waste dumps, especially those designated for clean—up
under the Comprehensive Environmental Response
Contamination and Liability Act (CERCLA) or
"Superfund," seem to receive the largest amount of
publicity. Groundwater pollution emanates from the
inappropriate use and disposal of chemicals and waste
products of all kinds. Thus, contamination occurs in
all types of cultural landscapes.
Defining "natural" groundwater quality continues
to be the major concern of groundwater
investigations. Chemical analyses tend to focus on
primary constituents (i.e., chemical species
generally occurring in concentrations exceeding 5
mg/l), a few secondary constituents (i.e., chemical
species generally occurring in concentrations
exceeding 0.1 mg/l), and a few physical properties in
the absence of a specific contamination complaint.
The chemistry of routinely measured constituents and
32
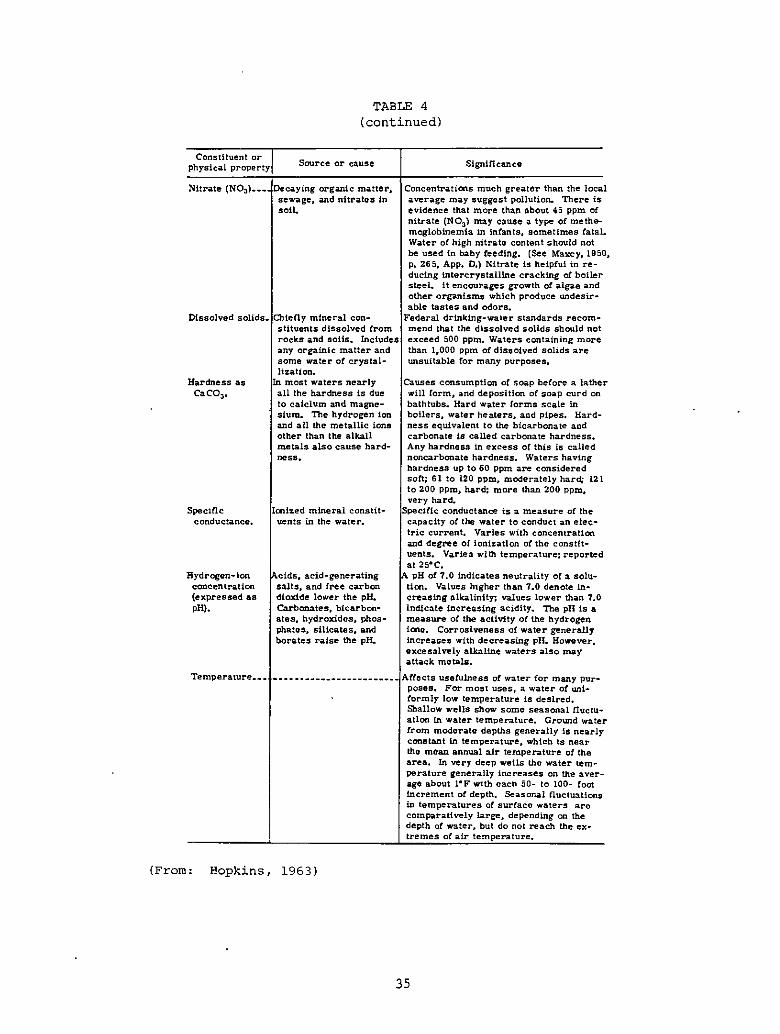
physical properties (Rem, 1970) and their sources or
causes and significance (Table 4) are well
understood. Unless one of these parameters is
affected, a pollution problem may go undetected by
routine sampling. For example, synthetic organic
compounds are a common groundwater contaminant
(Dyksen and Hess, 1982) that cannot be detected with
the usual suite of measurements. The cost of
collection and analysis of water is substantial
enough to limit the number of parameters routinely
monitored. As a reult, several indicator parameters
have been developed.
33
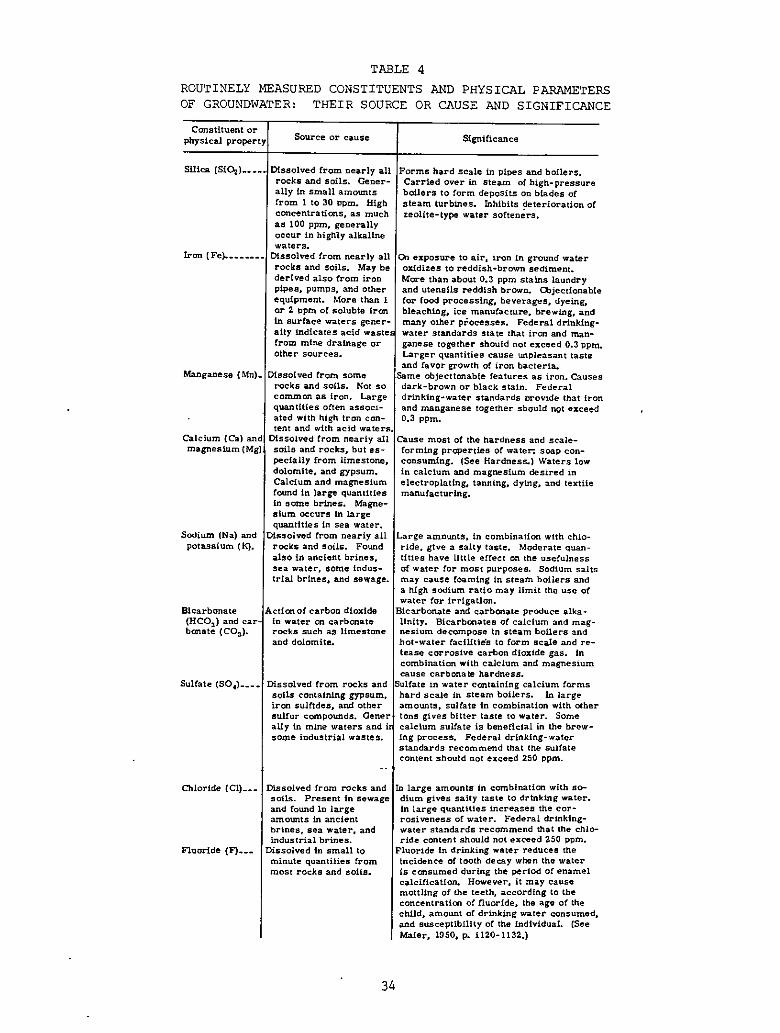
TABLE 4
ROUTINELY MEASURED CONSTITUENTS AND PHYSICAT PARAMETERS OF GROUNDWATER: THEIR SOURCE OR CAUSE AND SIGNIFICANCE
Constituent or physical property Source or cause Significance
Silica (SiO2).....Dissolved from nearly all rocks and soils. Gener-ally In small amounts from I to 30 ppm. High concentrations, as much as 100 ppm, generally occur In highly alkaline waters.
It. (Fe). Dissolved from nearly all rocks and soils. May be derived also from iron pipes, pumps, and other equipment. More than I or 2 ppm of soluble iron in surface waters gener-ally indicates acid wastes from mine drainage or other sources.
Forms hard scale in pipes and boilers. Carried over in steam of high-pressure boilers to form deposits on blades of steam turbines. Inhibits deterioration of zeolite-type water softeners.
Qi exposure to air, iron in ground water oxidizes to reddish-brown sediment. More than about 0.3 ppm stains laundry and utensils reddish brown. Objectionable for food processing, beverages, dyeing, bleaching, ice manufacture, brewing, and many other p'ocesses. Federal drinking. water standards state that iron and man-ganese together should not exceed 0.3 ppm. Larger quantities cause unpleasant taste and favor growth of iron bacteria.
Same objectionable features as iron. Causes dark-brown or black stain. Federal drinking-water standards provide that iron and manganese together should not exceed 0.3 ppm.
Cause most of the hardness and scale-forming properties of water, soap con-consuming. (See Hardness.) Waters low in calcium and magnesium desired in electroplating, tanning, dying, and textile manufacturing.
Large amounts, In combination with chlo-ride, give a salty taste. Moderate quan-tities have little effect on the usefulness of water for most purposes. Sodium salts may cause foaming in steam boilers and a high sodium ratio may limit the use of water for irrigation.
Bicarbonate and carbonate produce alka-linity. Bicarbonates of calcium and mag-nesium decompose in steam boilers and hot-water facilities to form scale and re-lease corrosive carbon dioxide gas. in combination with calcium and magnesium cause carbonate hardness.
Sulfate in water containing calcium forms hard scale in steam boilers. In large amounts, sulfate in combination with other ions gives bitter taste to water. Some calcium sulfate is beneficial in the brew-ing process. Federal drinking-water standards recommend that the sulfate content should not exceed 250 ppm.
Dissolved from some rocks and soils. Not so common as Iron. Large quantities often associ-ated with high iron con-tent and with acid waters.
Dissolved from nearly all soils and rocks, but es-pecially from limestone, dolomIte, and gypsum. Calcium and magnesium found in large quantities in some brines. Magne-sium occurs in large quantities in sea water.
Dissolved from nearly all rooks and soils. Found also in ancient brines, sea water, some indus-trial brines, and sewage.
Action of carbon dioxide in water on carbonate rocks such as limestone and dolomite.
Dissolved from rocks and soils containing gypsum. iron sulfides, and other sulfur compounds. Gener ally in mine waters and it some industrial wastes.
Manganese (Mn),
Calcium (Ca) and magnesium (Mg)
Sodium (Na) and potassium (K).
Bicarbonate (NCO,) and car-bonate (CD,).
Sulfate (504)......
Chloride (Cl)-.- Dissolved from rocks and soils. Present in sewage and found in large amounts in ancient brines, sea water, and industrial brines.
Fluoride (9__.. Dissolved in small to minute quantities from most rocks and soils.
In large amounts in combination with so-dium gives salty taste to drinking water. In large quantities increases the cor-rosiveness of water. Federal drinking-water standards recommend that the chlo-ride content should not exceed 250 ppm. Fluoride in drinking water reduces the Incidence of tooth decay when the water is consumed during the period of enamel calcification. However, it may cause mottling of the teeth, according to the concentration of fluoride, the age of the child, amount of drinking water consumed, and susceptibility of the individual. (See Maier, 1950, p. 1120-1132.)
34
Dissolved solids. Chiefly mineral con-stituents dissolved from rocks and soils. Includes any orgainic matter and some water of crystal-lization.
Hardness as In most waters nearly CaCO3 all the hardness is due
to calcium and magne-sium. The hydrogen ion and all the metallic ions other than the alkali metals also cause hard-ness.
Significance
Concentrations much greater than the local average may suggest pollution. There is evidence that more than about 45 ppm of nitrate (NO3) may cause a type of methe-moglobinemla in infants, sometimes fatal Water of high nitrate content should not be used in baby feeding. (See Marcy, 1950, p. 265, App. D.) Nitrate is helpful in re-ducing intercryetalline cracking of boiler steel. It encourages growth of algae and other organisms which produce undesir-able tastes and odors.
Federal drinking-water standards recom-mend that the dissolved solids should not exceed 500 ppm. Waters containing more than 1,000 ppm of dissolved solids are unsuitable for many purposes.
Causes consumption of soap before a lather will form, and deposition of soap curd on bathtubs. Hard water forms scale in boilers, water heaters, and pipes. Hard-ness equivalent to the bicarbonate and carbonate Is called carbonate hardness. Any hardness in excess of this is called noncarbonate hardness. Waters having hardness up to 60 ppm are considered soft; 61 to 120 ppm, moderately hard; 121 to 200 ppm, hard: more than 200 ppm, very hard.
Specific conductance is a measure of the capacity of the water to conduct an elec-tric current. Varies with concentration and degree of ionization of the constit-uents. Varies with temperature: reported at 25C,
A PH of 7.0 indicates neutrality of a solu-tion. Values higher than 7.0 denote in-creasing alkalinity; values lower than 7.0 indicate increasing acidity. The pH is a measure of the activity of the hydrogen tons. Corrosiveness of water generally increases with decreasing pit However, excessively alkaline waters also may attack metals.
Affects usefulness of water for many pur-poses. For most uses, a water of uni-formly low temperature is desired. Shallow wells show some seasonal fluctu-ation in water temperature. Ground water from moderate depths generally is nearly constant in temperature, which is near the mean annual air temperature of the area. In very deep wells the water tem-perature generally increases on the aver-age about l'F with each 50- to 100- foot increment of depth. Seasonal fluctuations in temperatures of surface waters are comparatively large, depending on the depth of water, but do not reach the ex-tremes of air temperature.
Constituent or physical property
Nitrate (NO3).._
Source or cause
Decaying organic matter, sewage, and nitrates in soil
Specific mixed mineral constit- conductance. uents in the water.
Hydrogen-ion Lcids, acid-generating concentration salts, and free carbon (expressed as
dioxide lower the pH. PH). Carbonates, bicarbon-
ates. hydroxides, phos-phates, silicates, and borates raise the pH.
Temperature
TABLE 4 (continued)
(From: Hopkins, 1963)
35
One of the indicators of organic contamination
now being used is total organic carbon (TOC). Under
normal conditions, groundwater is relatively free of
organic carbon. Therefore, elevated TOG levels would
be indicative of organic contamination. The
technology for measuring TOG has been available for
some time, but there has always been a problem with
losing volatile organic carbon (VOC). Barcelona -
(1984)
arcelona-
(1984) has developed a modified TOG procedure that
traps VOC, permitting more complete characterization
of groundwaeer organic carbon content.
TOC has the potential to be a good indicator
parameter for organic groundwater contamination,
avoiding costly gas chromatography (CC) and mass
spectrometer (MS) analyses. The Miami Conservancy
District, in cooperation with the USGS, has conducted
a TOG reconnaissance survey of the Great Miami
Aquifer (Evans, 1977). The results successfully
defined several potential contamination areas,
demonstrating the value of TOC as a screening device.
Base line or typical groundwater quality should
be established before considering the possibility of
contamination. This is best done on a local scale,
but the regional scale of this study requires some
generalization. Groundwater quality information was
36
abstracted from the literature and organized by major
subbasin and principal aquifer. Due to a lack of
data, not every principal aquifer in every subbasin
is represented in the analysis. Some of the
principal aquifers may transcend topographic divides,
permitting groundwater to flow from one subbasin to
another. Consequently, groundwater quality for one
subbasin principal aquifer may not be completely
independent of the same aquifer in adjacent
subbasins. The groundwater quality data predate 1970
and are limited to routinely measured parameters.
All available data were included in the analysis,
except where the procedures or the results appeared
questionable or where there was obvious contamination
from human sources.
Base line data can be statistically established
in several ways. Since natural variability is
sometimes extreme, the USGS commonly presumes that
median values approximate typical groundwater
quality. For convenience, we have chosen to report
arithmetic mean values (Table 5). The difference
between the arithmetic mean and median is not
expected to be great for most parameters.
37
GROUNDWATER CONTAMINATION
Based on the limited number of parameters in
Table 5, Table 6 indicates there are problems with
high iron, manganese, and hardness. Groundwater from
most subbasin principal aquifers exceeds U.S. Public
Health Service (US PUS) standards (US P118, 1962) for
iron and manganese and the USGS "very hard"
classification. These problems have been reported
before (Deutsch, Dove, Jordan, and Wallace, 1969).
While believed to be the result of natural
geochemical processes, these problems may not be
completely divorced from human impact. There is
evidence (e.g., the closing of Westview Water
Authority Wells on Neville Island because of organic
chemical contamination from a near-by waste disposal
lagoon (Westview Water Authority, 1975), the closing
of Zanesville City Wells along the Muskingum River
because of organic chemical contamination from a
waste disposal pit on the other side of the river
(Ohio EPA, 1984), the Chem-Dyne hazardous waste
clean-up along the Great Miami River, and others) to
suggest that there are many localized contamination
problems. Although believed to be of limited areal
extent, these incidents, if not properly redressed,
have the capacity to contaminate large aquifers of
prime importance to the Ohio Valley.
38
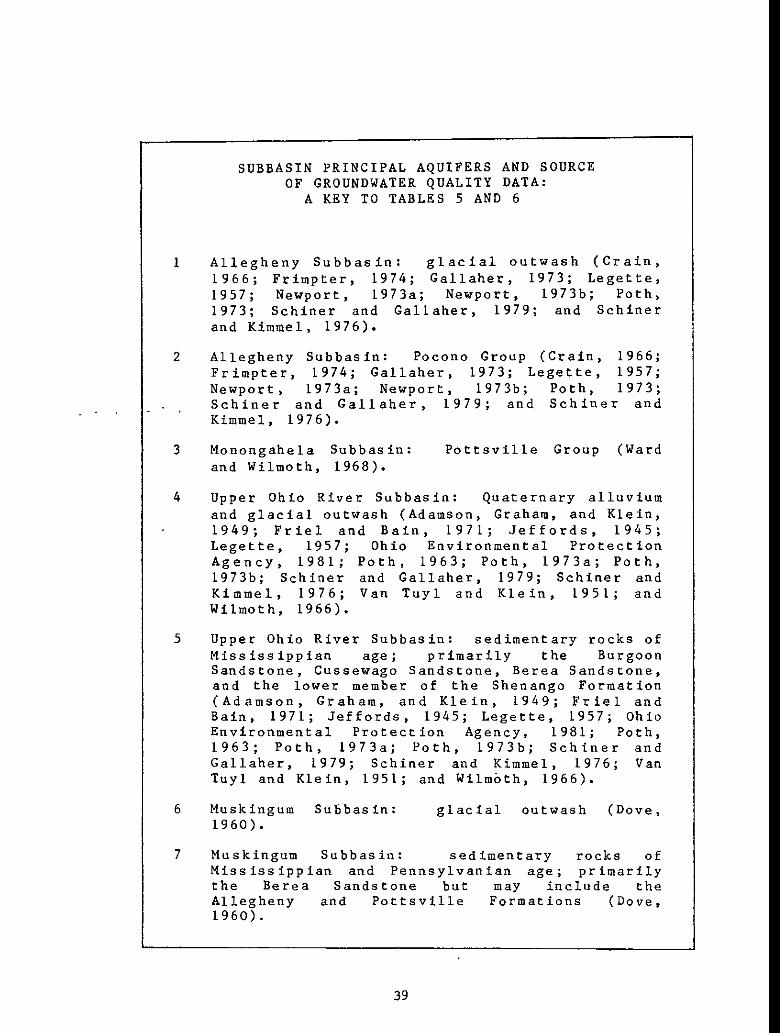
SUBBASIN PRINCIPAL AQUIFERS AND SOURCE OF GROUNDWATER QUALITY DATA:
A KEY TO TABLES 5 AND 6
Allegheny Subbasin: glacial outwash (Cram, 1966; Friinpter, 1974; Gallaher, 1973; Legette, 1957; Newport, 1973a, Newport, 1973b, Poth, 1973; Schiner and Gallaher, 1979; and Schiner and Kimmel, 1976).
2 Allegheny Subbasin: Pocono Group (Cram, 1966; Frimpter, 1974; Gallaher, 1973; Legette, 1957; Newport, 1973a; Newport, 1973b; Poth, 1973; Schiner and Gallaher, 1979; and Schiner and Kimmel, 1976).
3 Monongahela Subbasin: Pottsville Group (Ward and Wilmoth, 1968).
4 Upper Ohio River Subbasin: Quaternary alluvium and glacial outwash (Adamson, Graham, and Klein, 1949; Friel and Bain, 1971; Jeffords, 1945; Legette, 1957; Ohio Environmental Protection Agency, 1981; Poth, 1963; Poth, 1973a; Poth, 1973b; Schiner and Gallaher, 1979; Schiner and Kimmel, 1976; Van Tuyl and Klein, 1951; and Wilmoth, 1966).
5 Upper Ohio River Subbasin: sedimentary rocks of Mississippian age; primarily the Burgoon Sandstone, Cussewago Sandstone, Berea Sandstone, and the lower member of the Shenango Formation (Adamson, Graham, and Klein, 1949; Friel and Bain, 1971; Jeffords, 1945; Legette, 1957; Ohio Environmental Protection Agency, 1981; Poth, 1963; Poth, 1973a; Poth, 1973b; Schiner and Gallaher, 1979; Schiner and Kimmel, 1976; Van Tuyl and Klein, 1951; and Wilmbth, 1966).
6 Muskingum Subbasin: glacial outwash (Dove, 1960).
7 Muskingum Subbasin: sedimentary rocks of Mississippian and Pennsylvanian age; primarily the Berea Sandstone but may include the Allegheny and Pottsville Formations (Dove, 1960).
39
cause problems for years depending on the solubility
of the material. (See Case Studies, page 52.)
Sanitary wastes from sewage disposal systems
(i.e., septic tanks, sanitary sewers, and wastes
applied to the land surface as a soil conditioner)
can be a source of pollutants (both chemical and
biological) in areas either unsuitable for disposal
or within the recharge zone of a nearby well.
Various household and industrial grade chemicals are
commonly released into disposal systems not designed
for their treatment and eventually find their way
either directly into groundwater or into surface
streams where they may subsequently contaminate
groundwater through induced recharge (Norris, 1967
and Spieker, 1968).
Urban runoff, charged with road wastes (e.g.,
road salts), seepage from uncontained raw material
stockpiles (e.g., salt, coal), and minor chemical
spills (e.g., gasoline), is a source of contamination
where urban activities are situated on a sensitive
recharge area. The problem is accentuated where
wells are of poor construction (poorly sealed wells
allow surface runoff to directly flow into the
subsurface) or where contaminated runoff is
artifically recharged to an aquifer.
46
Agricultural activities can introduce
contaminants over wide areas, where fertilizers and
pesticides are applied in excess of recommended
application rates. With the advent of chemigation
(i.e., the application of agricultural chemicals via
irrigation water), groundwater beneath irrigated land
is particularly susceptible to contamination.
Feedlot runoff, charged with nitrates and other
pollutants, can also be a serious problem for shallow
near—surface aquifers and where wells are of poor
construction.
Mining (including oil and gas drilling) and
other excavation works can create pollution problems
for groundwater. Mining frequently takes place in or
through an aquifer or a bed hydraulically connected
to an aquifer. Aside from disrupting groundwater
flow, mining can introduce contaminants into
groundwater by making previously isolated elements
available for chemical alteration or solution in the
presence of water (e.g., acid mine drainage).
Furthermore, abandoned mines (especially gravel pits)
and wells can and often do serve as inappropriate
waste receptacles.
47
GROUNDWATER CLEANUP
Locally contaminated groundwater is not an
irreparable situation. There is a rapidly developing
technology for containing localized contamination and
restoring affected aquifers to acceptable drinking
water standards. Different conditions require
different techniques, but all cleanup operations have
three basic objectives -- containment, treatment, and
monitoring.
Containment involves sealing the affected
surface area to prevent further migration of
contaminants into groundwater, and stabilization of
the contaminant plume. Construction of physical
barriers (e.g., grout curtains, sheet pilings, slurry
cut-off walls, etc.) tied to a shallow (less than
about 100 feet) impermeable stratum can stop plume
movement. For deeper situations, it is necessary to
use hydrodynamic control (Figure 13). By operating
strategically placed production and recharge wells,
the water table is leveled out, stopping plume
movement. Containment is a very expensive temporary
option. It must be followed by further remedial
efforts to alleviate the contamination problem.
48
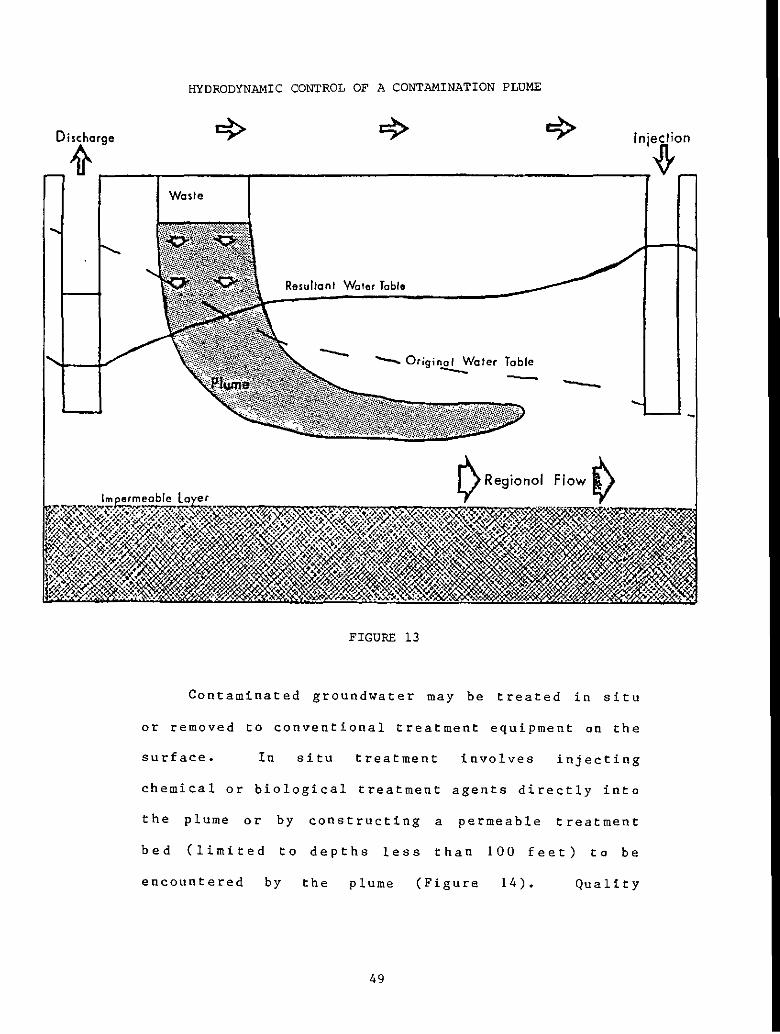
HYDRODYNAMIC CONTROL OF A CONTAMINATION PLUME
FIGURE 13
Contaminated groundwater may be treated in situ
or removed to conventional treatment equipment on the
surface. In situ treatment involves injecting
chemical or biological treatment agents directly into
the plume or by constructing a permeable treatment
bed (limited to depths less than 100 feet) to be
encountered by the plume (Figure 14). Quality
49
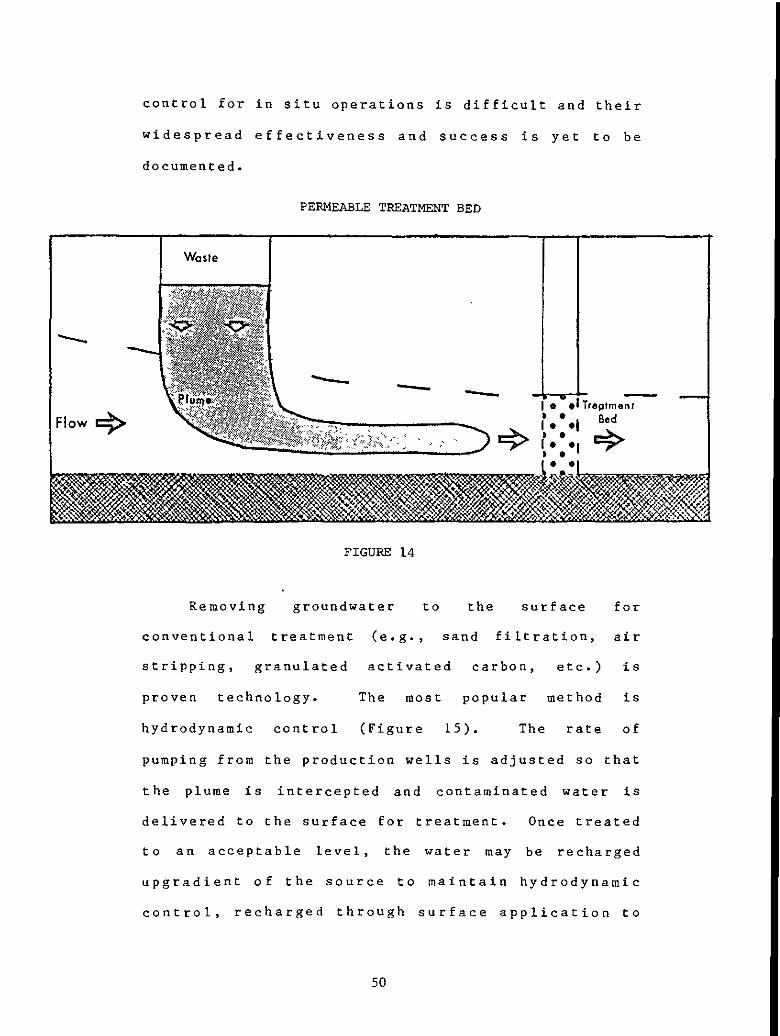
control for in situ operations is difficult and their
widespread effectiveness and success is yet to be
documented.
PERMEABLE TREATMENT BED
FIGURE 14
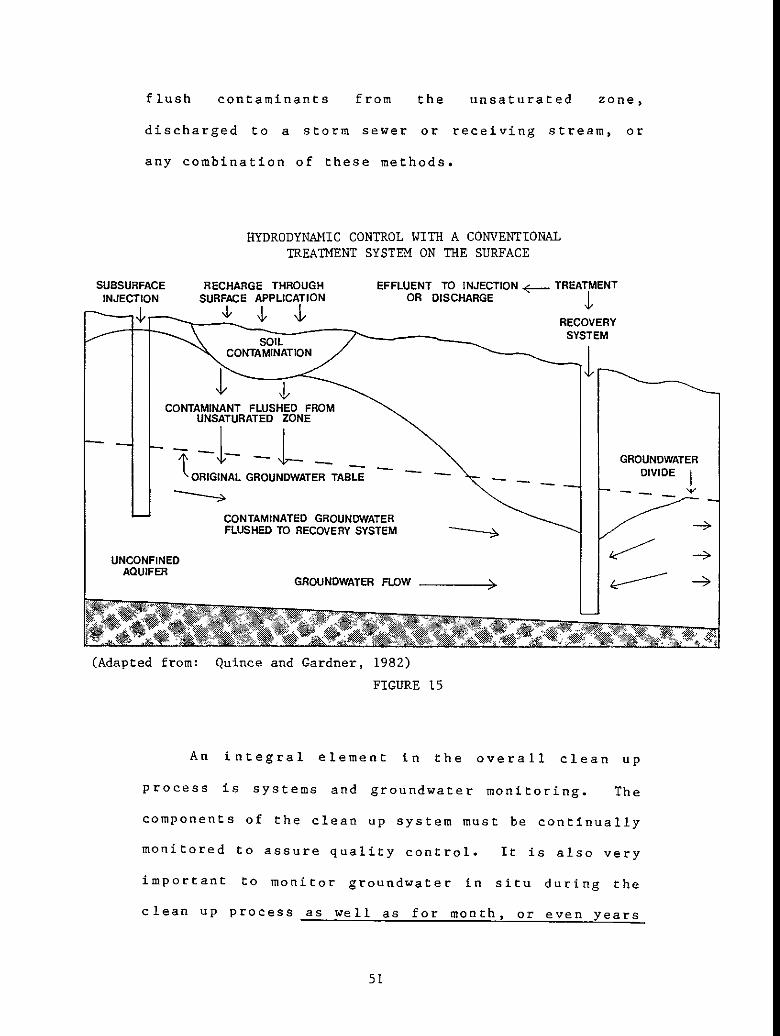
Removing groundwater to the surface for
conventional treatment (e.g., sand filtration, air
stripping, granulated activated carbon, etc.) is
proven technology. The most popular method is
hydrodynamic control (Figure 15). The rate of
pumping from the production wells is adjusted so that
the plume is intercepted and contaminated water is
delivered to the surface for treatment. Once treated
to an acceptable level, the water may be recharged
upgradient of the source to maintain hydrodynamic
control, recharged through surface application to
50
SUBSURFACE RECHARGE THROUGH EFFLUENT TO INJECTION ,_.. TREATMENT INJECTION SURFACE APPLICATION
SOIL CONTAMINATION
I
OR DISCHARGE 'I, RECOVERY
SYSTEM
CONTAMINANT FLUSHED FROM UNSATURATED ZONE
"ORIGINAL GROUNDWATER TABLE
CONTAMINATED GROUNDWATER FLUSHED TO RECOVERY SYSTEM
UNCONFINED AQUIFER
GROUNDWATER FLOW
(Adapted from: Quince and Gardner, 1982)
FIGURE 15
GROUNDWATER DIVIDEj
flush contaminants from the unsaturated zone,
discharged to a storm sewer or receiving stream, or
any combination of these methods.
HYDRODYNAMIC CONTROL WITH A CONVENTIONAL TREATMENT SYSTEM ON THE SURFACE
An integral element in the overall clean up
process is systems and groundwater monitoring. The
components of the clean up system must be continually
monitored to assure quality control. It is also very
important to monitor groundwater in situ during the
clean up process as well as for month, or even years
51
after, to assess project effectiveness and detect any
potential complications.
Case Histories
The contamination of groundwater and need for
monitoring is illustrated by an incident that
occurred from a railroad accident in February, 1977,
near Guilford, Indiana. Some 34,000 gallons of
acrylonitrile (AN) was spilled onto the land surface
from a railroad tank car and a large portion entered
the groundwater. Monitoring by the Indiana State
Board of Health revealed that concentrations as high
as 6,600 ppm were present in the fourteen observation
and four production wells drilled to monitor and
reduce the level of AN in the groundwater. The water
from the production wells was treated before
discharge to the stream from February to December,
1977, at which time the level of AN was reduced to
<0.05 mg/l. The relative ease that the AN entered
the groundwater and the length of time needed (and
associated cost) to reduce the concentration to
acceptable levels illustrates the need to provide
safeguards against contamination of the underground
stata from the land surface and the importance of
monitoring.
52
Contamination of a groundwater aquifer which
serves as a source for a public water supply is
illustrated in another case history. The West View
Waterworks, located on two islands in the Ohio River
downstream from Pittsburgh, Pennsylvania, used some
19 production wells as a source of water. In 1975,
an oily odor was detected in eight of the wells, and
studies were initiated to determine the source of the
organic contamination. Wells serving two industries
in same vicinity were also found to contain the same
type of organic contamination. A series of
observation wells were drilled to monitor the
movement of the groundwater in the vicinity of the
production wells. Organic (GC/MS) analysis by the
waterworks and the Commonwealth of Pennsylvania
suggested that the source of the contamination was a
liquid waste lagoon in the vicinity of the wells
since many of the organic compounds were common to
both the groundwater and the lagoon. Residual
contamination continued to move in the aquifer long
after corrective action was taken to control the
source. It is projected that years will be required
to purge the groundwater system of the organics now
present. Continued pumping of some production wells
became necessary as a preventative measure to contain
contamination in the affected area.
53
and
CONCLUSIONS
The following conclusions are based on
information compiled during this survey.
the data
1. Many misconceptions
groundwater continue
about the nature
to exist.
of
2. Based on potential yield, most of the
groundwater resources are situated north of
the Ohio River and along its channel.
3. The Ohio Valley Aquifer, paralleling the
Ohio River from Pittsburgh, Pennsylvania to
Cairo, Illinois, is one of the most
important principal aquifers in the Ohio
River Basin. An estimated 4500 billion
gallons of water are in storage, and more
than 30% of total groundwater withdrawal in
the Ohio River Basin is from this aquifer.
4. Much geologic, hydraulic, and other physical
information on aquifers is available but is
somewhat difficult to assemble.
54
5. Stream flow duration analysis indicates the
availability of approximately 17,700 MCD
groundwater in the Ohio River Valley. It
should be noted that groundwater use may
offset stream flow, particularly in the
stream valleys. As groundwater pumpage p
increases, base stream flow may be reduced,
especially if the groundwater use is highly
consumptive.
6. Groundwater is currently underutilized in
the district. In 1980, 2500 MGD of
groundwater were withdrawn in the Ohio River
Basin, representing about 14% of available
groundwater and about 7% of all freshwater
withdrawn (excluding hydroelectric power).
7. Generally, groundwater rights are not well
defined. The Signatory States adhere to
riparian water rights, with Kentucky and
Virginia (limited to large users in
stipulated critical areas) having adopted
supplementary appropriative rights requiring
groundwater withdrawal permits.
55
8. Primary drinking water standards continue to
be the major concern of groundwater
monitoring efforts. Little data concerning
trace organics and trace metals exist in the
literature and data systems (e.g., STORET).
9. Average groundwater quality information
indicates that iron, manganese, and hardness
exceed US PHS drinking water standards in
many of the subbasin principal aquifers.
10. Many instances of local groundwater
contamination have been identified from the
literature, particularly in connection with
the hazardous waste control programs.
Although believed to be of limited areal
extent, many have the potential to
contaminate large aquifers, if not properly
redressed.
11. The extent of groundwater pollution
(particularly incidents involving organic
chemicals) in the principal aquifers is not
known.
56

BIBLIOGRAPHY
ILLINOIS
Csallany, S. (1966). Yields of Wells in Pennsylvanian and Mississippian Rocks in Illinois (Illinois State Water Survey Report of Investigation 55: Urbana, Illinois).
Foster, J. W. (1953). "Significance of Pleistocene Depostis in the Groundwater Resources of Illinois" Economic Geology 48(7): 568-573.
Gibb, J. P. (1970). Groundwater Availability in Ford County, Illinois (Illinois State Water Survey Circular 97: Urbana, Illinois).
Gibb, J. P. and Cartwright, K. (1982). Retention of Zinc, Cadmium, Copper, and Lead by Geologic Materials (Illinois State Water Survey, Illinois State Geological Survey Cooperative Groundwater Report 9: Champaign, Illinois).
Gibb, J. P. and Sanderson, E. W. (1969). Cost of Municipal and Industrial Wells in Illinois, 1964 - 1966 (Illinois State Water Survey: Urbana, Illinois).
Horberg, L. (1945). "A Major Buried Valley in East—Central Illinois and its Regional Relationships." Journal of Geology 53(5): 349 - 359.
Kempton, J. P.; Morse, W. J.; and Visocky, A. P. (1982). Hydrogeologic Evaluation of Sand and Gravel Aquifers for Municipal Groundwater Supplies in East—Central Illinois (Illinois State Water Survey, Illinois State Geological Survey, Cooperative Groundwater Report 8: Urbana, Illinois).
Kirk, J. R.; Jarboe, J.; Sanderson, B. W.; Sastnan, R. I.; and Sinclair, R. A. (1979). Water Withdrawals in Illinois, 1978 (Illinois State Water Survey Circular 140: Urbana, Illinois).
57
J. R.; Jarboe, J.; Sanderson, B. W.; Sasman, R. T.; and Lonnquist, C. (1982). Water Withdrawals in Illinois, 1980 (Illinois State Water Survey Circular 152: Urbana, Illinois).
O'Hearn, M. and Gibb, J. P. (1980). Groundwater Discharge to Illinois Streams (Illinois State Water Survey Contract Report 246: Champaign, Illinois).
Poole, V. L. and Sanderson, B. W. (1981). Groundwater Resources in the Saline Valley Conservancy District, Saline and Gallatin Counties, Illinois (Illinois State Water Survey Contract Report 262: Urbana, Illinois).
Pryor, W. A. (1956). Groundwater Geology in Southern Illinois. Illinois State Geological Survey, Circular 212.
.Selkregg, L. F.; Pryor, Wayne A.; and Kempton, J. P. (1957). Groundwater Geology in South-Central Illinois. Illinois State Geological Survey Circular 225.
Siebel, E. P. Groundwater Contamination in Illinois. (Illinois State Water Survey: Champaign, Illinois).
Walker, W. H. and Walton, W. C. (1961). Ground-Water Development in Three Areas of Central Illinois (Illinois State Water Survey Report of Investigation 41: Urbana, Illinois).
Woller, D. H. (1973). Public Groundwater Supplies in Alexander County (Illinois State Water Survey Bulletin 60-2: Urbana, Illinois).
Woller, D. M. (1974). Public Groundwater Supplies in Crawford County (Illinois State Water Survey Bulletin 60-7: Urbana, Illinois).
Woller, D. N. (1974). Public Groundwater Supplies in Edgar County (Illinois State Water Survey Bulletin 60-9: Urbana, Illinois).
Woller, D. H. (1974). Public Groundwater Supplies in Ford County (Illinois State Water Survey Bulletin 60-8: Urbana, Illinois).
Woller, D. M. (1974). Public Groundwater Supplies in Hardin County (Illinois State Water Survey Bulletin 60-10: Urbana, Illinois).
Kirk,
58
Woller, D. N. (1975). Public Groundwater Supplies in Massac County (Illinois State Water Survey Bulletin 60-14: Urbana, Illinois).
Woller, D. N. (1975). Public Groundwater Supplies in Champaign County (Illinois State Water Survey Bulletin 60-15: Urbana, Illinois).
Woller, D. N. and Sanderson, B. W. (1978). Public Groundwater Supplies in Edwards County (Illinois State Water Survey Bulletin 60-21: Urbana, Illinois).
Woller, D. N. and Sanderson, S. W. (1978). Public Groundwater Supplies in Pulaski County (Illinois State Water Survey Bulletin 60-24: Urbana, Illinois).
INDIANA
Bruns, T. M. and Uhl, J. E. (1976). Water Resources of Shelby County, Indiana (Indiana Department of Natural Resources, Division of Water: Indianapolis). Map.
Cable, L. W. and Robison, T. M. (1973). Hydrogeology of the Principal Aquifers in Sullivan and Green Counties, Indiana (Indiana Department of Natural Resources, Division of Water Bulletin No. 35: Indianapolis).
Cable, L. W. and Robison, T. N. (1974). Ground-Water Resources of Montgomery County, Indiana (Indiana Department of Natural Resources, Division of Water Bulletin No. 36: Indianapolis).
Cable, L. W.; Watkins, F. A.; and Robison, T. M. (1971). Hydrogeology of the Principal Aquifers in Vigo and Clay Counties, Indiana (Indiana Department of Natural Resources, Division of Water Bulletin No. 34: Indianapolis).
Cable, L. W. and Wolf, R. J. (1977). Ground-Water Resources of Vanderburgh County, Indiana (Indiana Department of Natural Resources, Division of Water Bulletin No. 38: Indianapolis).
Fidlar, N. N. (1943). 'The Pre-glacial Teays Valley in Indiana", Journal of Geology 51(6): 411 - 418.
59
Governor's Water Resource Study Commission (1980). The Indiana Water Resource (Indiana Department of Natural Resources: Indianapolis).
Gray, H. H. and Powell, R. L. (1965). Geomorphology and Groundwater Hydrology of the Mitchell Plain and Crawford Upland in Southern Indiana (Indiana Department of Natural Resources, Geological Survey Field Conference Guidebook 11: Bloomington, Indiana).
Heckard, J. M. ( ---- ). Water Resources of Morgan County, Indiana (Indiana Department of
Conservation, Division of Water:
Indianapolis). Map.
Heckard, J. M. (1968). Water Resources of Grant County, Indiana (Indiana Department of Natural Resources, Division of Water: Indianapolis). Map.
Herring, W. C. (1971). Water Resources of Hamilton County, Indiana (IndHiana Department of Natural Resources, Division of Water: Indianapolis). Map.
Herring, W. C. (1974). Water Resources of Marion County, Indiana (Indiana Department of Natural Resources, Division of Water: Indianapolis). Map.
Herring, W. C. (1976). Technical Atlas of the Ground-Water Resources of Marion County, Indiana (Indiana Department of Natural Resources, Division of Water: Indianapolis).
Indiana Department of Natural Resources (1982). The 1980 Survey of Domestic Self-Supplied and Livestock Water Uses in Indiana (Indianapolis).
Indiana Department of Natural Resouces (1983). The 1980 Survey of Public Water Supply Utilities in Indiana (Indianapolis).
Indiana State Board of Health (1977). Memorandum re Control and Recovery of Acrylonitrile from the Groundwater near Guilford, Indiana.
McGuinness, G. L. (1943). Ground Water Resources of the Indianapolis Area, Marion County, Indiana (Indiana Department of Conservation, Division of Geology: Indianapolis).
60
Rosenshein, J. S. and Hunn, J. D. (1964). Ground-Water Resources of Northwestern Indiana Preliminary Report: Fulton County (Indiana Department of Conservation, Division of Water Resources, Bulletin No. 20: Indianapolis).
Rosenshein, J. S. and Hunn, 3. D. (1964). Ground-Water Resources of Northwestern Indiana Preliminary Report: Starke County (Indiana Department of Conservation, Division of Water Resources Bulletin No. 22: Indianapolis).
Robison, Tully H. (1977). Ground-Water Resources of Posey County, Indiana (Indiana Department of Natural Resources, Division of Water Bulletin No. 39: Indianapolis).
Southward, R. J. (1965). Ground-Water Levels in Indiana 1955 - 1962 (Indiana Department of Conservation, Division of Water Resources Bulletin No. 30: Indianapolis).
Steen, W. J. (1968). Water Resources of Hendricks County, Indiana (Indiana Department of Natural Resources, Division of Water: Indianapolis). Map.
Steen, W. J. (1968). Water Resources of Tipton County, Indiana (Indiana Department of Natural Resources, Division of Water: Indianapolis). Map.
Steen, W. J. (1970). Water Resources of Madison County, Indiana (Indiana Department of Natural Resources, Division of Water: Indianapolis). Map.
Steen, W. J.; Brums, T. H.; and Perry, A. 0. (1977). Water Resources of Boone County, Indiana (Indiana Department of Natural Resources, Division of Water: Indianapolis). Map.
Uhl, J. B. (1966). Water Resources of Johnson County, Indiana (Indiana Department of Natural Resources, Division of Water: Indianapolis). Map.
Uhl, J. E. (1973). Water Resources of Henry County, Indiana (Indiana Department of Natural Resources, Division of Water: Indianapolis). Map.
61
Uhl , J. B. (1975). Water Resources of Hancock County, Indiana (Indiana Department of Natural Resources, Division of Water: Indianapolis). Map.
Watkins, F. A. and Jordan, D. C. (1961). Ground-Water Resources of West-Central Indiana Preliminary Report: Greene County (Indiana Department of Conservation, Division of Water Resources Bulletin No. 11: Indianapolis).
Watkins, F. A. and Jordan, D. G. (1962). Ground-Water Resources of West-Central Indiana Preliminary Report: Clay County (Indiana Department of Conservation, Division of Water Resources Bulletin No. 16: Indianapolis).
Watkins, F. A. and Jordan, U. G. (1962). Ground-Water Resources of West-Central Indiana Preliminary Report: Sullivan County (Indiana Department of Conservation, Division of Water Resources Bulletin No. 14: Indianapolis).
Watkins, P. A. and Jordan, D. C. - (1963). Ground-Water Resources of West-Central Indiana Preliminary Report: Owen County (Indiana Department of Conservation, Division of Water Resources, Bulletin No. 18: Indianapolis).
Watkins, F. A. and Jordan, D. C. (1963). Ground-Water Resources of West-Central Indiana Preliminary Report: Vigo County (Indiana Department of Conservation, Division of Water Resources, Bulletin No. 17: Indianapolis).
Watkins, F. A. and Jordan, D. C. (1964). Ground-Water Resources of West-Central Indiana Preliminary Report: Parke County (Indiana Department of Conservation, Division of Water Resources Bulletin No. 23: Indianapolis).
Watkins, F. A. and Jordan, D. C. (1964). Ground-Water Resources of West-Central Indiana Preliminary Report: Putnam County (Indiana Department of Conservation, Division of Water Resources Bulletin No. 21: Indianapolis).
Watkins, F. A. and Jordan, D. G. (1965). Ground-Water Resources of West-Central Indiana Preliminary Report: Fountain County (Indiana Department of Natural Resources, Division of Water Bulletin No. 28: Indianapolis).
62
Watkins, F. A. and Jordan, D. G. (1965). Ground-Water Resources of West-Central Indiana Preliminary Report: Montgomery County (Indiana Department of Natural Resources, Division of Water, Bulletin No. 27: Indianapolis).
Watkins, F. A. and Jordan, B. G. (1965). Ground-Water Resources of West-Central Indiana Preliminary Report: Vermillion County (Indiana Department of Natural Resources, Division of Water, Bulletin No. 29: Indianapolis).
KENTUCKY
Baker, J. A. (1955). Geology and Ground-Water Resources of the Paintsville Area Kentucky. USGS Water-Supply Paper 1257.
Bell, B. A.; Kellogg, H. W.; and Kulp, W. K. (1963). Progress Report on the Ground-Water Resources of the Louisville Area Kentucky, 1949-55. USGS Water-Supply Paper 1579.
Brown, R. F. and Lambert, T. W. (1962). Availability of Ground Water in Allen, Barren, Edmonson, Green, Hart, Logan, Metcalfe, Monroe, Simpson, and Warren Counties, Kentucky. USGS Hydrologic Investigations Atlas HA-32.
Brown, H. F. and Lambert, T. W. (1963). Availability of Ground Water in Breckinridge, Grayson, Hardin, Larue, and Meade Counties, Kentucky. USGS Hydrologic Investigations Atlas HA-33.
Brown, H. F. and Lambert, T. W. (1963). Reconnaissance of Ground-Water Resources in the Mississippian Plateau Region Kentucky. USGS Water-Supply Paper 1603.
Davis, R. W.; Lambert, T. W.; and Hansen, A. J. (1973). subsurface Geology and Ground-Water Resources of the Jackson Purchase Region, Kentucky. USGS Water-Supply Paper 1987.
Deraul, R. W. and Maxwell, B. W. (1962). Availability of Ground Water in Daviess and Hancock Counties, Kentucky. USGS Hydrologic Investigations Atlas HA-27.
Deraul, R. W. and Maxwell, B. W. (1962). Availability of Ground Water in McLean and
63
Muhlenberg Counties, Kentucky. USGS
Hydrologic Investigations Atlas HA-29.
Hall, F. R. and Palmquist, W. N. (1960). Availability of Ground Water in Bath, Fleming, and Montgomery Counties, Kentucky. USGS Hydrologic Investigations Atlas HA-18.
Hall, F. R. and Palmquist, W. N. (1960).
Availability of Ground Water in Clark, Estill, Madison, and Powell Counties, Kentucky. USGS Hydrologic Investigations Atlas HA-19.
Hall, F. R. and Palmquist, W. N. (1960). Availability of Ground Water in Marion, Nelson, and Washington Counties, Kentucky. USGS Hydrologic Investigations Atlas HA-21.
Hall, F. R. and Palmquist, W. N. (1960). Availability of Ground Water in Carroll, Gallatin, Henry, Owen, and Trimble Counties, Kentucky. USGS Hydrologic Investigations Atlas HA-23.
Hall, F. R. and Palmquist, W. N. (1960). Availability of Ground Water in Anderson, Franklin, Shelby, Spencer, and Woodford Counties, Kentucky. USGS Hydrologic Investigations Atlas HA-24.
Harvey, E. J. (1956). Geology and Ground-Water Resources of the Henderson Area, Kentucky. USGS Water Supply Paper 1356.
Hopkins, H T. (1970). Occurrence of Fresh Water in the Lee Formation in Parts of Elliott, Johnson, Lawrence, Magoffin, and Morgan Counties, Eastern Coal Field Region, Kentucky. USGS Water Supply Paper 1867.
Hopkins, William B. (1963). Geology and Ground-Water Resources of the Scottsville Area, Kentucky. USGS Water Supply Paper 1528.
Kilburn, C.; Price, W. E.; and Muir, D. S. (1962). Availability of Ground Water in Bell, Clay, Jackson, Knox, Laurel, Leslie, McCreary, Owsley, Rockcastle, and Whitley Counties, Kentucky. USGS Hydrologic Investigations Atlas HA-38.
Lambert, T. W. and Brown, R. F. (1963). Availability of Ground Water in Caldwell, Christian, Crittenden, Livingston, Lyon, Todd, and Trigg
64
Counties, Kentucky. USGS Hydrologic Investigations Atlas HA-34.
Lambert, T. W. and Brown, R. F. (1963). Availability of Ground Water in Adair, Casey, Clinton, Cumberland, Pulaski, Russell, Taylor, and Wayne Counties, Kentucky. USGS Hydrologic Investigations Atlas HA-35.
Maxwell, B. W. and Deraul, R. W. (1962). Availability of Ground Water in Butler and Ohio Counties, Kentucky. USGS Hydrologic Investigations Atlas HA-26.
Maxwell, B. W. and Deraul, R. W. (1962). Availability of Ground Water in Union and Henderson Counties, Kentucky. USGS Hydrologic Investigations Atlas HA-28.
Maxwell, B. W. and Deraul, R. W. (1962). Availability of Ground Water in Hopkins and Webster Counties, Kentucky. USGS Hydrologic Investigations Atlas HA-30.
Maxwell, B. W. and Deraul, R. W. (1962). Reconnaissance of Ground-Water Resources in the Western Coal Field Region, Kentucky. USGS Water Supply Paper 1599.
Mull, D. S. (1965). Ground-Water Resources of the Jenkins-Whitesburg Area Kentucky. USGS Water Supply Paper 1809-A.
Palmquist, W. N. and Hall, F. R. (1960). Availability of Ground Water in Boone, Campbell, Grant, Kenton, and Pendleton Counties, Kentucky. USGS Hydrologic Investigations Atlas HA-is.
Palmquist, W. N. and Hall, F. R. (1960). Availability of Ground Water in Bracken, Harrison, Mason, Nicholas, and Robertson Counties, Kentucky. USGS Hydrologic Investigations Atlas HA-16.
Palmquist, W. N. and Hall, F. R. (1960). Availability of Ground Water in Lewis and Rowan Counties, Kentucky. USGS Hydrologic Investigations Atlas HA-17.
Palmquist, W. N. and Hall, F. R. (1960). Availability of Ground Water in Boyle, Garrard, Lincoln and Mercer Counties,
65
Kentucky. USGS Hydrologic Investigations Atlas HA-20.
Palmquist, W. N. and Hall, F. R. (1960). Availability of Ground Water in Bullitt, Jefferson, and Oldham Counties, Kentucky. USGS Hydrologic Investigations Atlas HA-22.
Palniquist, W. N. and Hall, F. R. (1960). Availability of Ground Water in Bourbon, Fayette, Jessamine, and Scott Counties, Kentucky. USGS Hydrologic Investigations Atlas HA-25.
Palmquist, W. N., Jr. and Hall, F. R. (1961). Reconnaissance of Ground-Water Resources in the Blue Grass Region, Kentucky. USGS Water Supply Paper 1533.
Pree, H. L.; Walker, W. H.; and MacCrary, L. M. (1957). Geology and Ground-Water Resources of the Paducah Area, Kentucky. USGS Water Supply Paper 1417.
Price, W. E. (1956). Geology and Ground-Water Resources of the Prestonburg Quadrangle, Kentucky. USGS Water Supply Paper 1359.
Price, W. E.; Kilburn, C.; and Mull, D. S. (1962). Availability of Ground Water in Breathitt, Floyd, Harlan, Knott, Letcher, Martin, Magoffin, Perry, and Pike Counties, Kentucky. USGS Hydrologic Investigations Atlas HA-36.
Price, W. E.; Kilburn, C.; and Mull, D. S. (1962). Availability of Ground Water in Boyd, Carter, Elliott, Greenup, Johnson, Lawrence, Lee, Menifee, Morgan, and Wolfe Counties, Kentucky. USGS Hydrologic Investigations Atlas HA-37.
Price, W. B.; Mull, D. S.; and Kilburn, C. (1962). Reconnaissance of Ground-Water Resources in the Eastern Coal Field Region, Kentucky. USGS Water Supply Paper 1607.
Rorabaugh, M. I. (1956). Ground Water in Northeastern Louisville, Kentucky. USGS Water Supply Paper 1360-B.
Walker, B. H. (1956). Ground-Water Resources of the Hopkinsville Quadrangle, Kentucky. USGS Water-Supply Paper 1328.
66
Walker, E. H. (1957). The Deep Channel and Alluvial Deposits of the Ohio Valley in Kentucky. USGS Water Supply Paper 1411.
NEW YORK
Cram, L. J. (1966). Ground-Water Resources of the Jamestown Area, New York (State of New York Conservation Department, Water Resources Commission Bulletin No. 58: Albany, New York).
Frimpter, H. H. (1974). Ground-Water Resources, Allegheny River Basin and Part of the Lake Erie Basin, New York (State of New York Department of Environmental Conservation, Basin Planning Report ARB-2: Albany, New York).
Heath, R. C. (1964). Ground Water in New York (State of New York Conservation Department, Water Resources Commission, Bulletin GW-51: Albany, New York).
La Sala, A. H. (1968). Ground-Water Resources of the Erie-Niagara Basin, New York (State of New York Conservation Department, Water Resources Commission, Basin Planning Report ENB-3: Albany, New York).
OHIO
Callahan, C. C. (1979). Principles of Water Rights Law in Ohio (Ohio Department of Natural Resources, Division of Water: Columbus, Ohio).
Corbett, R. G. and Manner, B. M (1984). Fluoride in the Ground Water of Northeastern Ohio. Groundwater 22(1): 13 - 17.
Cummins, J. W. (1959). Buried River Valleys in Ohio (Ohio Department of Natural Resources, Division of Water, Report No. 10, Ohio Water Plan Inventory: Columbus, Ohio).
Cummins, J. W. (1960). Underground Water Resources Maps, Ohio Division of Water, T-1 through T-4.
Dove, G. D. (1960). Water Resources of Licking County, Ohio (Ohio Department of Natural
67
Resources, Division of Water, Bulletin 36: Columbus, Ohio).
Dove, C. B. (1961). A Hydrologic Study of the Valley - Fill Deposits in the Venice Area, Ohio (Ohio Department of Natural Resources, Division of Water, Technical Report No. 4: Columbus, Ohio).
Engelke, M. J. ; Roth, B. K.; and others (1981). Hydrology of Area 7, Eastern Coal Province, Ohio. USGS Water Resources Investigations Open File Report 81-815.
Evans, K. F. (1977). Water Quality of the Glacial-Outwash Aquifer in the Great Miami River Basin, Ohio. USGS Water Resources Investigation Open File Report 77-76.
Fidler, R. E. (1970). Potential Development and Recharge of Ground Water in Mill Creek Valley, Butler and Hamilton Counties, Ohio, Based on Analog Model Analysis. USGS Water Supply Paper 1893.
Ground Water for Planning in Southwest Ohio, Ohio Department of Natural Resources, Division of Water, Report Number 23, Ohio Water Plan Inventory 1972, Prepared by Dames and Moore, Cincinnati, Ohio.
Helgesen, J. 0. and Razem, A. C. (1981). Ground-Water Hydrology of Strip-Mine Areas in Eastern Ohio (Conditions During Mining of Two Watersheds in Coshocton and Muskingum Counties). USGS Water Resources Investigations Open File Report 81-913.
Johnson, D. P. and Metzker, K. D. (1981). Low-Flow Characteristics of Ohio Streams. USGS Open File Report 81-1195.
Klaer, F. H. and Thompson, D. G. (1948). Ground-Water Resources of the Cincinnati Area, Butler and Hamilton Counties, Ohio. USGS Water Supply Paper 999.
Norris, S. E. (1959). The Water Resources of Madison County, Ohio (Ohio Department of Natural Resources, Division of Water, Bulletin 33: Columbus, Ohio).
Norris, S. E. (1967). Effects of Ground-Water Quality and Induced Infiltration of Wastes
68
Disposed into the Hocking River at Lancaster, Ohio. Groundwater 5(3): 15-19.
Norris, S. E. and Spicker, A. H. (1966). Ground-Water Resources of the Dayton Area, Ohio. USGS Water-Supply Paper 1808.
Norris, S. B. and Eagon, H. B., Jr. (1971). Recharge Characteristics of a Water-Course Aquifer System at Springfield, Ohio. Ground Water 9(1): 30 - 41.
Norris, S. B. and Fidler, R. B. (1969). Hydrogeology of the Scioto River Valley Near Piketon, South-Central Ohio. USGS Water-Supply Paper 1872.
Norris, S. B. and Fidler, R. B. (1973). Availability of Water from Limestone and Dolomite Aquifers in Southwest Ohio and the Relation of Water Quality to the Regional Flow System. USGS Water Resources Investigations 17-73.
Ohio Department of Natural Resources, Division of Water (1965). Ground Water for Industry in the Scioto River Valley. (Ohio Department of Natural Resources, Division of Water, Buried Valley Investigation No. 1: Columbus, Ohio).
Ohio Environmental Protection Agency (1981). Ground Water Quality of the Middle Section of the Ohio River Valley. (Ohio Environmental Protection Agency, Division of Ground Water: Columbus, Ohio).
Ohio Environmental Protection Agency (1984). Personal Communication to ORSANCO staff re Contamination of Municipal Wells Along the Muskingum River at Zanesville, Ohio.
Pfaff, C. L.; Helsel, D. R.; Johnson, D. P.; and Angelo, C. C. (1981). Assessment of Water Quality in Streams Draining Coal-Producing Areas in Ohio. USGS Water-Resources Investigations Open-File Report 81-409.
Prée, H. L., Jr. (1960). Underground Water Resources Maps, Ohio Division of Water, L-1 through L-3.
Free, H. L., Jr. (1962). Underground Water Resources Maps, Ohio Division of Water, P-i through P-4, P-7, P-12, and N-2 through N-S.
69
Ran, J. L. (1969). Hydrogeology of the Berea and Cussewago Sandstones in Northeastern Ohio. USGS Hydrologic Investigations Atlas HA-341.
Schmidt, J. J. (1954). The Water Resources of Ross County, Ohio (Ohio Department of Natural Resources, Division of Water, Information Circular No. 4: Columbus, Ohio).
Schmidt, J. J. (1958). The Ground-Water Resources of Franklin County, Ohio (Ohio Department of Natural Resources, Division of Water, Bulletin 30: Columbus, Ohio).
Schmidt, J. J. (1959). Underground Water Resources Maps, Ohio Division of Water, 3, R-1 and R-2, S-i through S-4.
Schmidt, J. J. (1960). Underground Water Resources Maps, Ohio Division of Water, H-i through M-6.
Schmidt, J. J. (1961). Underground Water Resources Maps, Ohio Division of Water, M-7 through M-12.
Schmidt, J. J. (1962). Underground Water Resources Maps, Ohio Division of Water, M-13 through M-17, P-5, P-8, P-il, P-13, and P-14.
Sedam, A. C. and Stein, R. B. (1970). Saline Ground-Water Resources of Ohio. USGS Hydrologic Investigations Atlas HA-366.
Smith, R. C. and Schmidt, J. J. (1953). The Water Resources of Pike County, Ohio (Ohio Department of Natural Resources, Division of Water, Information Circular No. 1: Columbus, Ohio).
Spieker, A. M. (1968). Ground-Water Hydrology and Geology of the Lower Great Miami River Valley Ohio. USGS Professional Paper 605-A.
Spieker, A. M. (1968). Effect of Increased Pumping of Ground Water in the Fairfield-New Baltimore Area, Ohio - A Prediction by Analog - Model Study. USGS Professional paper 605-C.
Spieker, A. H. (1968). Future Development of the Ground-Water Resource in the Lower Great Miami River Valley, Ohio - Problems and Alternative Solutions. USGS Professional Paper 605-D.
70
Ver Steeg, Karl (1936). "The Buried Topography of Western Ohio." Journal of Geology 44(8): 918 - 939.
Walker, A. C. (1958). Underground Water Resources Maps, Ohio Division of Water, 0-3 through 0-4.
Walker, A. C. (1959). Underground Water Resources Maps, Ohio Division of Water, P-6.
Walker, A. C. (1960). Underground Water Resources Maps, Ohio Division of Water, H-i through H-li, K-i through K-6.
Walker, A. C. (1961). Underground Water Resources Maps, Ohio Division of Water, 0, 11-8, 11-10, and 11-ha.
Walker, A. C. (1962). Underground Water Resources Maps, Ohio Division of Water, P-9, P-b, P15, and P-i8.
Walker, A. C. and Schmidt, J. J. (1953). The Water Resources of Scioto County, Ohio (Ohio Department of Natural Resources, Division of Water, Information Circular No. 2: Columbus, Ohio).
Walker, A. C.; Schmidt, J. J.; Stein, R. B.; Prée, H.
L.; and Bailey, N. G. (1965). Ground Water for Industry in the Scioto River Valley (Ohio Department of Natural Resources, Division of Water, Buried Valley Investigation No. I: Columbus, Ohio).
Walton, W. C. and Scudder, C. D. (1960). Ground-Water Resources of the Valley-Train Deposits in the Fairborn Area, Ohio. (Ohio Department of Natural Resources, Division of Water, Technical Report No. 3: Columbus, Ohio).
Watkins, J. S. and Spieker, A. M. (1971). "Seismic Refraction Survey of Pleistocene Drainage Channels in the Lower Great Miami River Valley, Ohio. USGS Professional Paper 605-B.
Weiss, E. J. and Razem, A. C. (1980). A Model for Flow Through a Glacial Outwash Aquifer in Southeast Franklin County, Ohio. USGS Water Resources Investigations 80-56.
71
PENNSYLVANIA
Adamson, J. H., Jr.; Graham, J. B.; and Klein, N. H. (1949). Ground-Water Resources of the Valley-Fill Deposits of Allegheny County, Pennsylvania. (Pennsylvania Geological Survey Bulletin W8: Harrisburg, Pennsylvania).
Carswell, L. D. and Bennett, G. D. (1963). Geology and Hydrology of the Neshannock Quadrangle, Mercer and Lawrence Counties, Pennsylvania (Pennsylvania Department of Environmental Resources, Bureau of Topographic and Geologic Survey Ground Water Report W15: Harrisburg, Pennsylvania).
Gallaher, J. T. (1973). Summary Ground-Water Resources of Allegheny County, Pennsylvania (Pennsylvania Department of Environmental Resources, Bureau of Topographic and Geologic Survey Water Resources Report 35: Harrisburg, Pennsylvania).
Legette, R. M. (1957). Ground Water in Northwestern Pennsylvania (Pennsylvania Department of Environmental Resources, Bureau of Topographic and Geologic Survey Bulletin w3: Harrisburg, Pennsylvania).
Newport, T. G. (1973). Summary Ground-Water Resources of Clarion County, Pennsylvania (Pennsylvania Department of Environmental Resources, Bureau of Topographic and Geological Survey Water Resources Report 32: Harrisburg, Pennsylvania).
Newport, T. G. (1973). Summary Ground-Water Resources of Washington County, Pennsylvania (Pennsylvania Department of Environmental Resources, Bureau of Topographic and Geologic Survey Water Resources Report 38: Harrisburg, Pennsylvania).
Newport, T. G. (1973). Summary Ground-Water Resources of Westmoreland County, Pennsylvania (Pennsylvania Department of Environmental Resources, Bureau of Topographic and Geologic Survey Water Resources Report 37: Harrisburg, Pennsylvania).
Poth, Charles W. (1963). Geology and Hydrology of the Mercer Quadrangle, Mercer, Lawrence, and Butler Counties, Pennsylvania (Pennsylvania
72
Department of Environmental Resources Bureau of Topographic and Geologic Survey Water Resources Report 36: Harrisburg, Pennsylvania).
Poth, C. W. (1973). Summary Ground-Water Resources of Armstrong County, Pennsylvania (Pennsylvania Department of Environmental Resources, Bureau of Topographic and Geologic Survey Water Resources Report 34: Harrisburg, Pennsylvania).
Poth, C. W. (1973). Summary Ground-Water Resource of Beaver County, Pennsylvania (Pennsylvania Department of Environmental Resources, Bureau of Topographic and Geologic Survey Water Resource Report 39: Harrisburg, Pennsylvania).
Poth, Charles W. (1973). Summary Ground-Water Resources of Butler County, Pennsylvania (Pennsylvania Department of Environmental Resources, Bureau of Topographic and Geologic Survey Water Resource Report 36: Harrisburg, Pennsylvania).
Schiner, G. R. and Gallaher, J. T. (1979). Geology and Groundwater Resources of Western Crawford County, Pennsylvania (Pennsylvania Department of Environmental Resources, Bureau of Topographic and Geologic Survey Water Resource Report 46: Harrisburg, Pennsylvania).
Schiner, G. R. and Kimmel, C. E. (1976). Geology and Ground-Water Resources of Northern Mercer County, Pennsylvania (Pennsylvania Department of Environmental Resources, Bureau of Topographic and Geologic Survey Water Resources Report 33: Harrisburg, Pennsylvania).
Van Toyl, D. W. and Klein, N. H. (1951). Ground-Water Resources of Beaver County Pennsylvania (Pennsylvania Geological Survey Fourth Series Bulletin W9: Harrisburg,
Pennsylvania).
West View Water Authority (1975). Unpublished report re Contamination of West View Water Authority Wells Located on Neville Island, Pennsylvania.
73
VIRGINIA
Dovel, Michael R. (1983). Wise-Dickenson County Groundwater, Present Conditions and Prospects. (Virginia State Water Control Board Planning Bulletin 333).
Epps, Susan R. (1978). Buchanan County Groundwater, Present Conditions and Prospects. (Virginia State Water Control Board Planning Bulletin 311).
Giles, A. H. (1981). Ground Water Problems, Virginia Portion, Ohio River Basin. In: Proceedings and Recommendations of the Workshop on Ground Water Problems in the Ohio River Basin, Cincinnati, April 28-29, 1981. (Purdue University, Water Resources Research Center, West Lafayette, In.).
Rogers, Stanley M. and Powell, John B. (1983). Quality of Ground Water in Souther Buchanan County, Virginia. (USGS Water Resources Investigation 82-4002).
Thompson and Litton, Inc. (1977). Ground Water Study, VasantBig Prater Creek Area, Buchanan County, Virginia. (Prepared for Island Creek Coal Company, Oakwood, VA).
Virginia Division of Water Resources (1971). Tennessee and Big Sandy River Basins, Comprehensive Water Resources Plan, Volumes I and III. (Planning Bulletins 231-P and 233-F).
Virginia State Water Control Board (1973). Groundwater in Virginia: Quality and Withdrawals. (Virginia State Water Control Board Basic Data Bulletin 38).
WEST VIRGINIA
Bain, C. L. and Friel, B. A. (1972). Water Resources of the Little Kanawha River Basin, West Virginia (West Virginia Geological and Economic Survey River Basin Bulletin 2: Morgantown, West Virginia).
Chisholm, J. L. and Frye, P. M. (1976). Records of Wells, Springs, Chemical Analyses of Water, Biological Analyses of Water, and Standard
74
Streamfiow Data Summaries from the Upper New River Basin in West Virginia (West Virginia Geological and Economic Survey Basic Data Report No. 4: Morgantown, West Virginia).
Clark, W. E.; Chisholm, J. L.; and Frye, P. H. (1976). Water Resources of the Upper New River Basin, West Virginia (West Virginia Geological and Economic Survey River Basin Bulletin 4: Morgantown, West Virginia).
Doll, W. L.; Wilmoth, B. M.; and Whetstone, C. W. (1960). Water Resources of Kanawha County, West Virginia (West Virginia Geological and Economic Survey Bulletin 20: Morgantown, West Virginia).
Eh Ike, T. A.; Bader, J. S.; Poente, C.; and Runner, G. S. (1982). Hydrology of Area 12, Eastern Coal Province, West Virginia. USGS Water Resources Investigations Open-File Report 81-902.
- Ehlke, T. A.; Runner, G. S.; and Downs, S. C. (1982). Hydrology of Area 9, Eastern Coal Province, West Virginia. USGS Water-Resources Investigations Open-File Report 81-803.
Fridley, R. H. (1950). The Geomorphic History of the New-Kanawha River System (West Virginia Geological and Economic Survey Report of Investigation No. 7: Morgantown, West Virginia).
Friel, E. A. and Bain, G. L. (1971). Records of Wells, Springs, and Test Borings, Chemical Analyses of Water, Sediment Analyses, Standard Streamf low Data Summaries and Selected Driller's Logs from the Little Kanawha River Basin in West Virginia (West Virginia Geological and Economic Survey Basic Data Report Number 2: Morgantown, West Virginia).
Jeffords, R. H. (1945). Ground-Water Conditions Along the Ohio Valley at Parkersburg, West Virginia (West Virginia Geological and Economic Survey Bulletin 10: Morgantown, West Virginia).
Jones, W. K. (1973). Hydrology of Limestone Karst in Greenbrier County, West Virginia (West Virginia Geological and Economic Survey Bulletin 36: Morgantown, West Virginia).
75

Robison, T. H. (1964). Occurrence and Availability of Ground Water in Ohio County, West Virginia (West Virginia Geological and Economic Survey Bulletin 27: Morgantown, West Virginia).
Ward, P. B. and Wilmoth, B. H. (1965). Ground—Water Hydrology of the Monongahela River Basin in West Virginia (West Virginia Geological and Economic Survey River Basin Bulletin 1: Morgantown, West Virginia).
Ward, P. E. and Wilmoth, B. M. (1968). Records of Wells, Springs, and Test Borings, Chemical Analyses of Ground Water, and Selected Driller's Logs from the Monongahela River Basin in West Virginia, 1968 (West Virginia Geological and Economic Survey Basic Data Report Number 1: Morgantown, West Virginia).
Wilmoth, B. M. (1966). Ground Water in Mason and Putnam Counties West Virginia. (West Virginia Geological and Economic Survey Bulletin 32: Morgantown, West Virginia).
Wyrick, G. G. and Borchers, J. W. (1981). Hydrologic Effects of Stress—Relief Fracturing in an Appalachian Valley. USGS Water Supply Paper 2177.
GENERAL
American Society for Testing and Materials (1982). 1982 Annual Book of ASTM Standards: Part 31: Water.
Bain, G. L. and Friel, E. A. (1972) Water Resources of the Little Kanawha River Basin, West Virginia (West Virginia Geological and Economic Survey River Basin Bulletin 2: Morgantown, West Virginia).
Baldwin, H. L. and McGuinness, C. L. (1963). A Primer on Groundwater. U.S. Geological Survey special publication.
Barcelona, H. J. (1984). TOC Determination in Ground Water. Ground Water 22(1): 18 - 24.
Bentall, Ray (1963). Methods of Collecting and Interpreting Ground—Water Data. USGS Water—Supply Paper 1544—H.
76
Bloyd, R. M. (1974). Summary Appraisals of the Nation's Ground-Water Resources: Ohio Region. U.S. Geological Survey Professional Paper 813-E.
Buchanan, T. J. and Gilbert, B. K. (1982). U.S. Geological Survey's Water Data Program: New Approaches in the 1980's in Proceedings of the International Symposium on Hydrometerology edited by A. Ivan Johnson and Robert A. Clark (American Water Resources Association: Bethesda, Maryland) pp. 3-7.
Chase, B. B.; Moore, J. B.; and Rickert, D. A. (1983). Water Resources Division in the 1908's: A Summary of Activities and Programs of the USGS's Water Resources Division. USGS Circular 893.
Davis, S. N. and DeWiest, R. J. M. (1966). Hydrogeology. (John Wiley and Sons: New York).
Davis, R. W.; Lamber, T. W.; and Hansen, A. J. (1973).- Subsurface Geology and Ground-Water Resources of the Jackson Purchase Region, Kentucky. USGS Water-Supply Paper 1987.
Deutsch, Morris; Dove, George D; Jordan, Paul R.; and Wallace, Joe C. (1969). Ohio River Basin Comprehensive Survey Appendix B: Ground Water (U.S. Army Engineer Division, Ohio River: Cincinnati, Ohio).
Dunne, T. and Leopold, L. B. (1978). Water in Environmental Planning (W. H. Freeman and Company: San Francisco).
Durfor, C. N. and Becker, B. (1964). Public Water Supplies of the 100 Largest Cities in the United States, 1962. U.S. Geological Survey Water-Supply Paper 1812.
Dyksen, J. E. and Hess, A. F. (1982). Alternatives for Controlling Organics in Ground-Water Supplies. Journal of American Water Works Association, August, pp. 394-403.
Edison Electric Institute (1984). Water and Energy: An Unprecendented Challenge in Resource Management.
Embleton, C. and King, C. A. M. (1969). Glacial and Periglacial Geomorphology (Edward Arnold Publishers: London).
77
Evans, K. F. (1977). Water Quality of the Glacial - Outwash Aquifer in the Great Miami River Basin, Ohio. USGS Water Resources Investigation Open File Report 77-76.
Feth, J. H. (1964). Hidden Recharge. Ground Water 2(4): 14 - 17.
Frederick, K. D. (1984). Current Water Issues. Journal of Soil and Water Conservation 39(2): 86 - 91.
Freeze, R. A. and Cherry, J. A. (1979). Groundwater. (Prentice-Hall, Inc.: Englewood Cliffs, New Jersey).
Geraghty, J. J. (1984). Techniques for Protecting Groundwater Quality. Journal of American Water Works Association 76(5): 34 - 38.
Gibb, J. P. and Barcelona, N. J. (1984). Sampling for Organic Contaminants in Groundwater. Journal of American Water Works Association 76(5): 48 - 52.
Gidley, H. K. (1952). Installation and Performance of Radial Collector Wells in Ohio River Gravels. Journal of American Water Works Association 44: 1117 - 1126.
Hanson, H. C. (1972). The Accuracy of Groundwater Contour Maps, Water Resources Research 8(1): 201 - 204.
Heath, R. C. (1982). Classification of Ground-Water Systems of the United States. Ground Water 20(4): 393 - 401.
Heath, R. C. (1983). Basic Ground-Water Hydrology. USGS Water-Supply Paper 2220.
Rem, J. D. (1970). Study and Interpretation of the Chemical Characteristics of Natural Water. USGS Water-Supply Paper 1473.
Rollyday, E. F. and Seaber, P. R. (1968). Estimating the Cost of Ground-Water Withdrawal for River Basin Planning. Ground Water 6(4): 15 - 24.
Hopkins, William B. (1963). Geology and Ground-Water Resources of the Scottsville Area Kentucky. USGS Water Supply Paper 1528.
78
Hughes, J. L.; Eccles, L. A.; and Malcolm, R. L. (1974). Dissolved Organic Carbon (DOC): an Index of Organic Contamination in Ground Water near Barstow, California. Ground Water 12(5): 283 - 290.
Langbein, W. B. and Iseri, K. T. (1960). Manual of Hydrology: Part 1. General Surface-Water Techniques, General Introduction and Hydrologic Definitions. USGS Water-Supply Paper 1541-A.
Lobeck, A. K. (1939). Geomorphology. (McGraw-Hill Book Company: New York).
Mann, W. B.; Moore, J. E.; and Chase, B. B. (1982). A National Water-Use Information Program. USGS Open-File Report 82-862.
McKinnon, R. J. and Dyksen, J. E. (1984). Removing Organics from Groundwater Through Aeration Plus GAC. Journal of American Water Works Association 76(5): 42 - 48.
McWilliams, Lindsey (1984). Groundwater Pollution in Wisconsin: A Bumper Crop Yields Growing Problems. Environment 26(4): 25 - 33.
Mercer, M. W. and Morgan, C. 0. (1981). Storage and Retrieval of Ground-Water Data at the USGS. Ground Water 19(5): 543 - 551.
National Research Council Geophysics Study Committee (1984). Groundwater Contamination (National Academy Press: Washington, D.C.).
Norris, S. B. (1967). Effects of Ground-Water Quality and Induced Infiltration of Wastes Disposed into the Hocking River at Lancaster, Ohio. Groundwater 5(3): 15-19.
Norris, S. E. and Fidler, R. B. (1973). Availability of Water from Limestone and Dolomite Aquifers in Southwest Ohio and the Relation of Water Quality to the Regional Flow System. USGS Water-Resources Investigations 17-73.
Ohio River Basin Commission (1975). Monongahela River Basin Comprehensive Coordinated Joint Plan (Ohio River Basin Commission: Cincinnati, Ohio).
Ohio River Basin Commission (1976). Muskingum River Basin Comprehensive Coordinated Joint Plan
79
(Ohio River Basin Commission: Cincinnati, Ohio).
Ohio River Basin Commission (1977). Great Miami River Basin Comprehensive Coordinated Joint Plan (Ohio River Basin Commission: Cincinnati, Ohio).
Ohio River Basin Commission (1977). Kanawha River Basin Comprehensive Coordinated Joint Plan (Ohio River Basin Commission: Cincinnati, Ohio).
Ohio River Basin Commission (1977). Scioto River Basin Comprehensive Coordinated Joint Plan (Ohio River Basin Commission: Cincinnati, Ohio).
Ohio River Basin Commission (1977). Wabash River Basin Comprehensive Coordinated Joint Plan (Ohio River Basin Commission: Cincinnati, Ohio).
Ohio River Basin Commission (1978). Lower Ohio Main Stem Comprehensive Coordinated Joint Plan (Ohio River Basin Commission: Cincinnati, Ohio).
Ohio River Basin Commission (1978). Middle Ohio Main Stem Comprehensive Coordinated Joint Plan (Ohio River Basin Commission: Cincinnati, Ohio).
Ohio River Basin Commission (1978). Upper Ohio Main Stem Comprehensive Coordinated Joint Plan (Ohio River Basin Commission: Cincinnati, Ohio).
Ohio River Basin Commission (1980). Allegheny River Basin Regional Water and Land Resources Plan and Environmental Impact Statement (Ohio River Basin Commission: Cincinnati, Ohio).
Ohio River Basin Commission (1980). Big Sandy/Guyandotte River Basin Regional Water and Land Resources Plan and Environmental Impact Statement (Ohio River Basin Commission: Cincinnati, Ohio).
Ohio River Basin Commission (1980). Kentucky/Licking River Basins Regional Water and Land Resources Plan and Draft Environmental Impact Statement (Ohio River Basin Commission: Cincinnati, Ohio).
80
Ohio River Basin Commission (1981). Cumberland River Basin Regional Water and Land Resources Plan and Environmental Impact Statements (Ohio River Basin Commission: Cincinnati, Ohio).
Ohio River Basin Commission (1981). Green River Basin Regional Water and Land Resources Plan and Environmental Impact Statement (Ohio River Basin Commission: Cincinnati, Ohio).
Ohio River Basin Commission (1981). Kanawha River Basin Regional Water and Land Resources Plan and Environmental Impact Assessment (Ohio River Basin Commission: Cincinnati, Ohio).
ORSANCO (1973). Underground Injection of Wastewaters in the Ohio Valley Region. (ORSANCO: Cincinnati, Ohio).
Pettyjohn, W. A. and Randich, P. C. (1966). Geohydrologic Use of Lithofacies Maps in Glaciated Areas. Water Resources Research 2(4): 679 - 689.
Price, W. E. and Baker, C. H. (1974). Catalog of Aquifer Names and Geologic Unit Codes Used by the Water Resources Division (USGS, Water Resources Division: Reston, Virginia).
Quince, J. R. and Gardner, G. L. (1982). Recovery and Treatment of Contaminated Ground Water: Part I. Groundwater Monitoring Review, Fall, 1982, pp. 1 - 5.
Rogers, Peter (1983). The Future of Water. The Atlantic Monthly 252(1): 80 - 92.
Rushton, K. R. and Ward, C. (1979). The Estimation of Groundwater Recharge. Journal of Hydrology 41(3/4): 345-361.
Schmidt, J. J. (1959). Underground Water Resources Maps, Ohio Division of Water, J, R-1 and R-2, S-i through 5-4.
Searcy, J. K. (1959). Flow Duration Curves: Manual of Hydrology: Part 2. Low Flow Techniques. USGS Water Supply Paper 1542-A.
Selig, E. J. (1984). Legal Means of Protecting Aquifers. Journal of American Water Works Association 76(5): 38-42.
81
Spieker, A. M. (1968). Future Development of the Ground-Water Resource in the Lower Great Miami River Valley, Ohio - Problems and Alternative Solutions. USGS Professional Paper 605-D.
Strahler, A. N. (1969). Physical Geography. (John Wiley and Sons, Inc.: New York).
Tank, R. W. (1983). Legal Aspects of Geology (Plenum Press: New York).
Theis, C. V. (1935). The Relation Between the Lowering of the Piezometric Surface and the Rate and Duration of Discharge of a Well Using Groundwater Storage. Trans. Am. Geophysical Union, V. 16, pp. 519 - 524.
Thornbury, W. D. (1964). Principles of Geomorphology (John Wiley & Sons. New York).
Todd, D.K. (1980). Groundwater Hydrology (John Wiley & Song: New York).
U.S. Army Corps of Engineers (1966). Hydrology of the Ohio River Basin. Appendix C. Ohio River Basin Comprehensive Survey (U.S. Army Engineer Division, Ohio River Division: Cincinnati, Ohio).
U.S. Department of Commerce, Environmental Science Services Administration (1968). Climatic Atlas of the United States.
U.S. Department of Health, Education, and Welfare (1962). Public Health Service Drinking Water Standards: U.S. Public Health Service Publication No. 956.
U.S. Environmental Protection Agency (1983). Surface Impoundment Assessment National Report.
U.S. Geological Survey (1973). Recommended Methods for Water-Data Aquisition.
U.S. Geological Survey (1982). A USGS Data Standard. Codes for Identification of Hydrologic Units in the United States and the Caribbean Outlying Areas. USGS Circular 878-A.
U.S. Geological Survey (1984). National Water-Use Information Program. 1980 Water-Use Data for the Ohio River Basin.
82
Van der Leeden, Frits, ed. (1983). Geraghty & Miller's Groundwater Bibliography (Water Information Center; Syosset, New York).
Walker, W. H. (1974). Tube Wells, Open Wells, and Optimum Ground-Water Resource Development. Ground Water 12(1).
Walton, W. C. (1970). Groundwater Resource Evaluation (McGraw-Hill: New York).
Wayne, W. J. (1952). Pleistocene Evolution of the Ohio and Wabash Valleys. Journal of Hydrology 60(6): 575 - 585.
Westrick, J. J.; Mello, J. W.; and Thomas, R. F. (1984). Groundwater Supply Survey. Journal of American Water Works Association 76(5): 52 - 60.
Wyrick, G. G. and Borchers, J. W. (1980- Hydrologic Effects of Stress-Relief Fracturing in an Appalachian Valley. USGS Water Supply Paper 2177.
83


![Unsustainable use of groundwater resources in … use of groundwater resources in ... subsidence, groundwater overexploitation, Permanent Scatterers ... [1, 2] to detect, map and quantify](https://img.pdfslide.us/doc/110x75/5b2043c07f8b9afb1e8b5673/unsustainable-use-of-groundwater-resources-in-use-of-groundwater-resources-in-.jpg)