Embed Size (px)
Citation preview
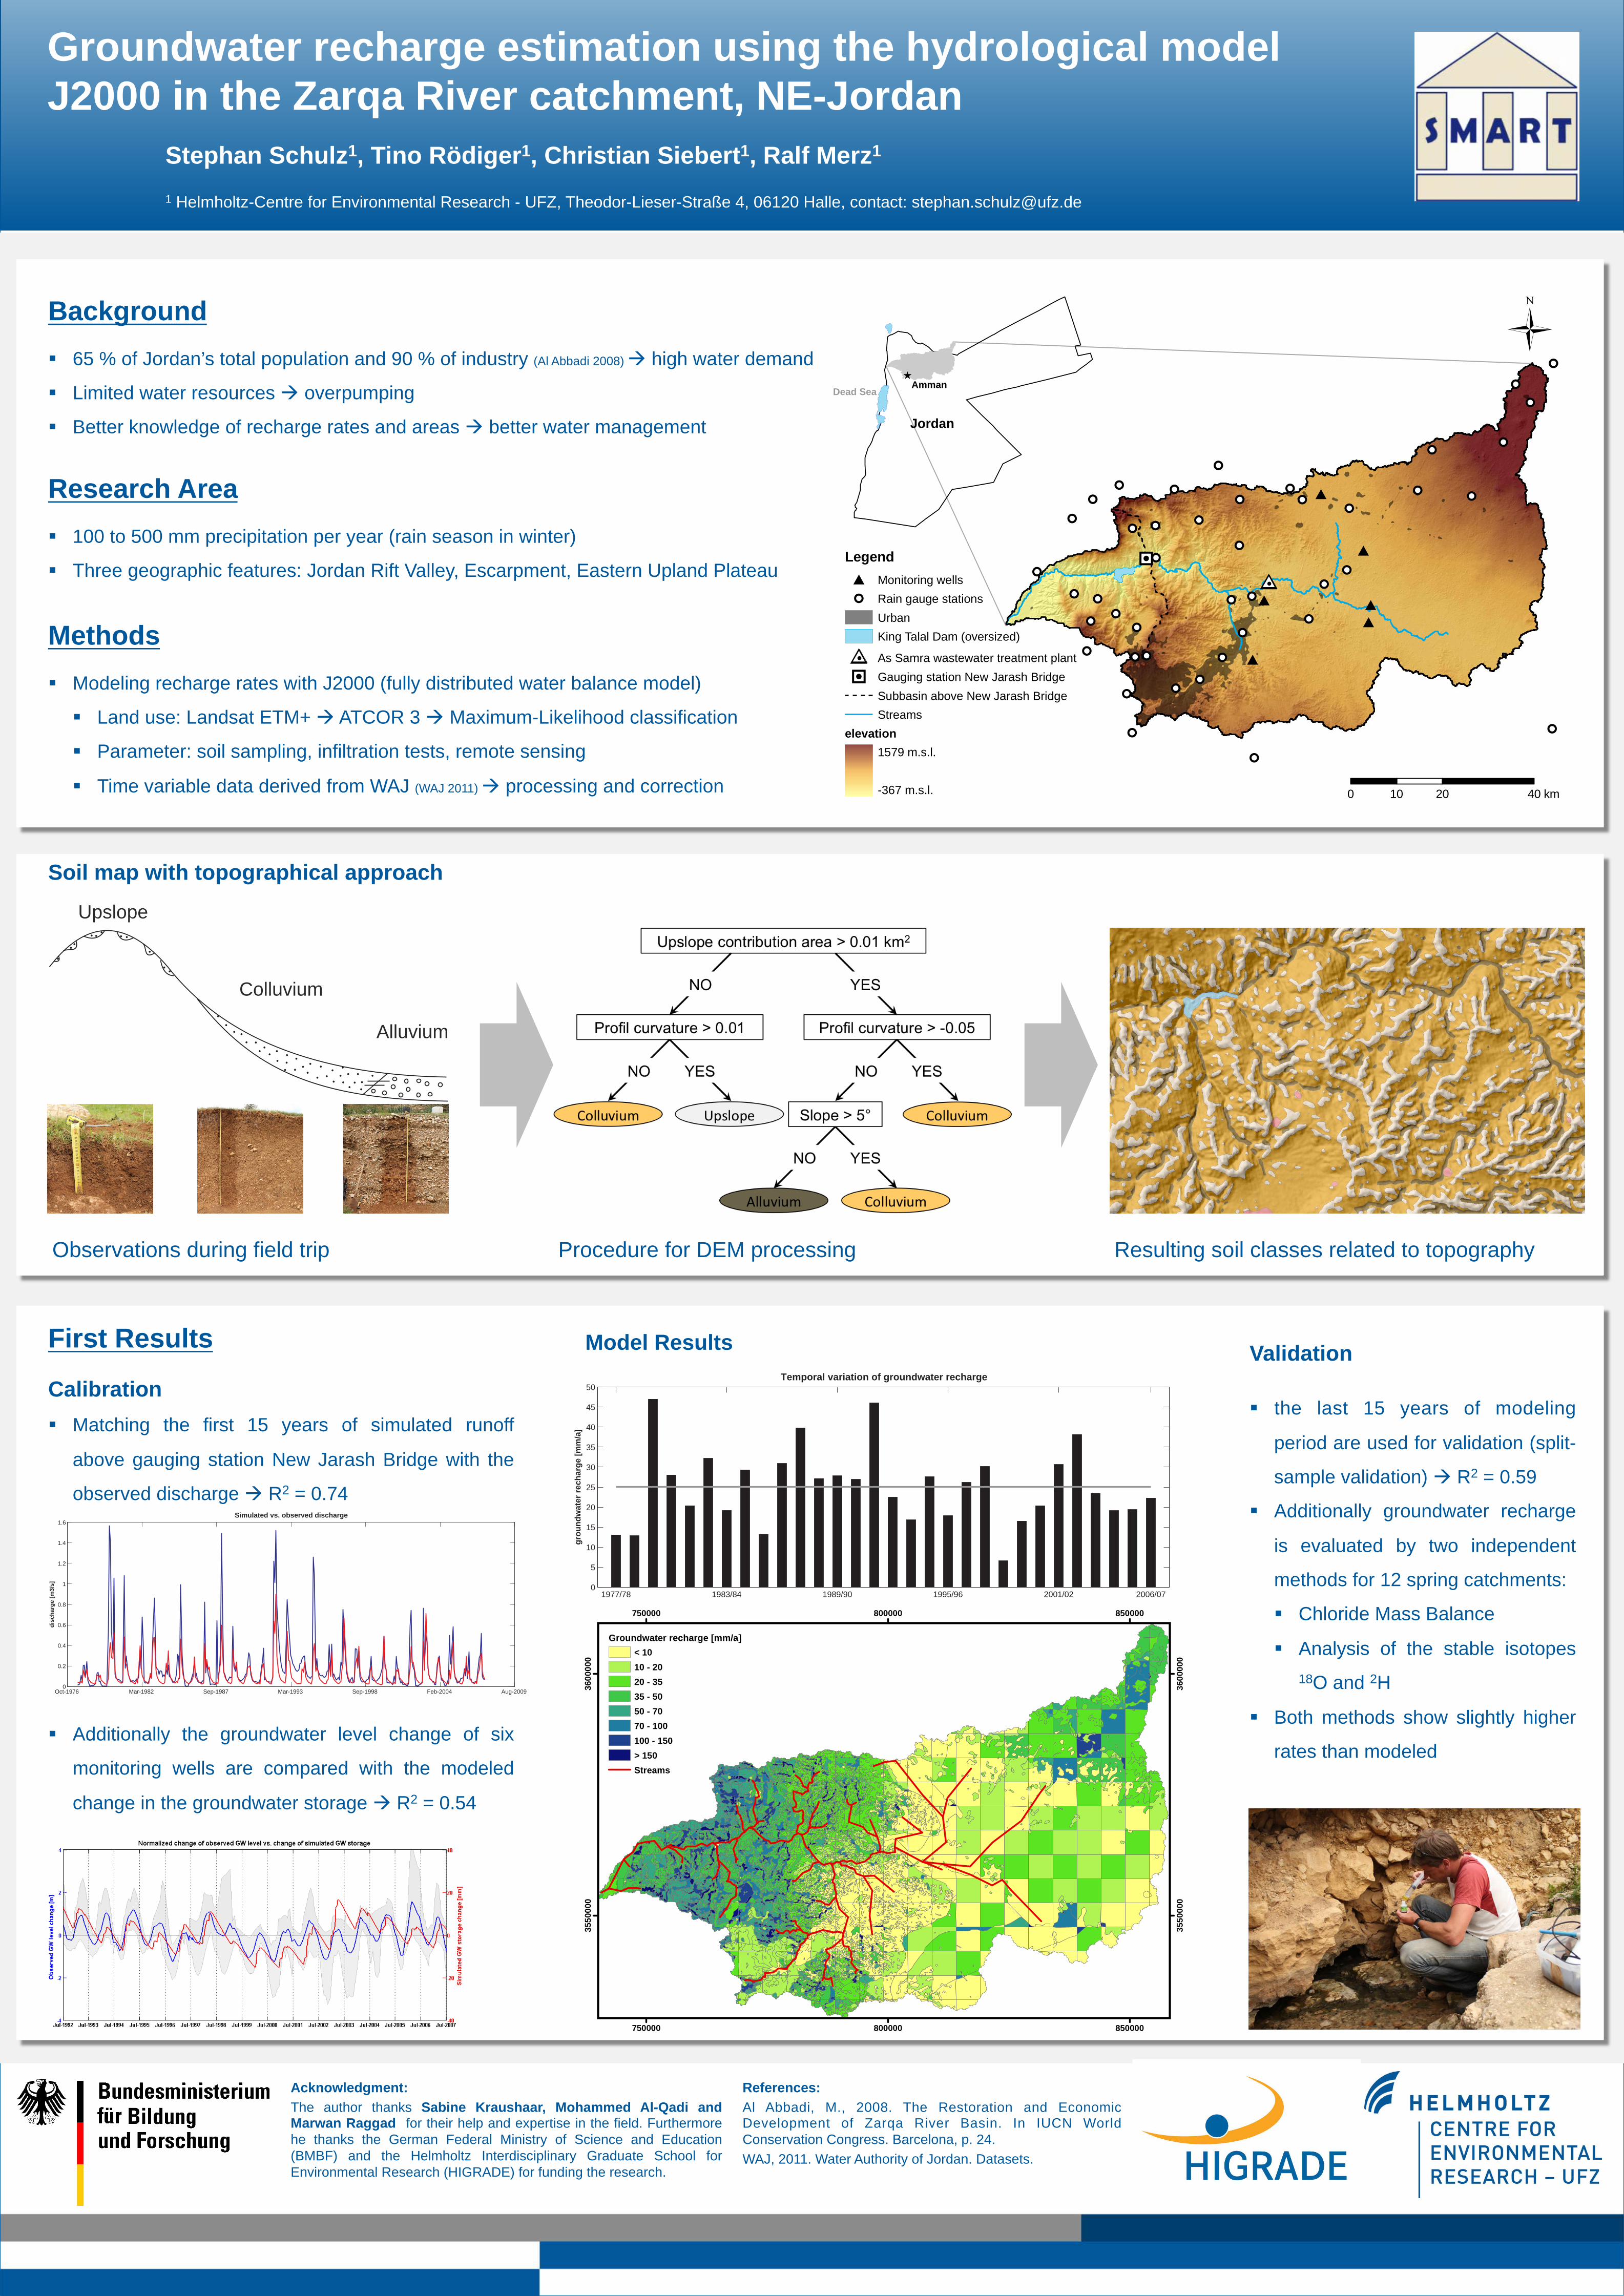
Background 65 % of Jordan’s total population and 90 % of industry (Al Abbadi 2008) high water demand
Limited water resources overpumping
Better knowledge of recharge rates and areas better water management
Acknowledgment: The author thanks Sabine Kraushaar, Mohammed Al-Qadi and Marwan Raggad for their help and expertise in the field. Furthermore he thanks the German Federal Ministry of Science and Education (BMBF) and the Helmholtz Interdisciplinary Graduate School for Environmental Research (HIGRADE) for funding the research.
Groundwater recharge estimation using the hydrological model J2000 in the Zarqa River catchment, NE-Jordan
Stephan Schulz1, Tino Rödiger1, Christian Siebert1, Ralf Merz1
1 Helmholtz-Centre for Environmental Research - UFZ, Theodor-Lieser-Straße 4, 06120 Halle, contact: [email protected]
!!
!!!!
!!
!!!!
!! !!
!!
!!!!
!!
!!
!!
!!
!!!! !!
!!!!
!!
!!
!!
!!
!!
!!
!!
!!
!!!!
!!
!!
!!
!!
!!
!!
!!
!!
!!!
##0
#
#
##
#
#
!!!!
!!
!!
!!
Ü
0 20 4010 km
Legend# Monitoring wells!! Rain gauge stations
UrbanKing Talal Dam (oversized)
##0 As Samra wastewater treatment plant
!!! Gauging station New Jarash BridgeSubbasin above New Jarash BridgeStreams
elevation1579 m.s.l.
-367 m.s.l.
[
Jordan
Dead SeaAmman
Methods
Modeling recharge rates with J2000 (fully distributed water balance model)
Land use: Landsat ETM+ ATCOR 3 Maximum-Likelihood classification
Parameter: soil sampling, infiltration tests, remote sensing
Time variable data derived from WAJ (WAJ 2011) processing and correction
First Results
Calibration Matching the first 15 years of simulated runoff
above gauging station New Jarash Bridge with the
observed discharge R2 = 0.74
Additionally the groundwater level change of six
monitoring wells are compared with the modeled
change in the groundwater storage R2 = 0.54
750000
750000
800000
800000
850000
850000
3550
000
3550
000
3600
000
3600
000
Groundwater recharge [mm/a]< 1010 - 2020 - 3535 - 5050 - 7070 - 100100 - 150> 150Streams
Observations during field trip Procedure for DEM processing Resulting soil classes related to topography
Upslope
Colluvium
Alluvium
Research Area 100 to 500 mm precipitation per year (rain season in winter)
Three geographic features: Jordan Rift Valley, Escarpment, Eastern Upland Plateau
Soil map with topographical approach
1977/78 1983/84 1989/90 1995/96 2001/02 2006/070
5
10
15
20
25
30
35
40
45
50Temporal variation of groundwater recharge
grou
ndw
ater
rech
arge
[mm
/a]
Oct-1976 Mar-1982 Sep-1987 Mar-1993 Sep-1998 Feb-2004 Aug-20090
0.2
0.4
0.6
0.8
1
1.2
1.4
1.6Simulated vs. observed discharge
disc
harg
e [m
3/s]
Model Results Validation
the last 15 years of modeling
period are used for validation (split-
sample validation) R2 = 0.59
Additionally groundwater recharge
is evaluated by two independent
methods for 12 spring catchments:
Chloride Mass Balance
Analysis of the stable isotopes 18O and 2H
Both methods show slightly higher
rates than modeled
References: Al Abbadi, M., 2008. The Restoration and Economic Development of Zarqa River Basin. In IUCN World Conservation Congress. Barcelona, p. 24. WAJ, 2011. Water Authority of Jordan. Datasets.