Embed Size (px)
Citation preview

International Journal of Environmental Science and Development, Vol. 7, No. 1, January 2016
1DOI: 10.7763/IJESD.2016.V7.732
Abstract—Groundwater is an important source of drinking
water in Egypt. Therefore, it is very important to assess the
quality of drinking water. The present study presents the
multivariate statistical analysis of groundwater quality of
western Nile Delta aquifer in order to investigate the factors
controlling the groundwater quality. Nineteen Physicochemical
parameters viz., Electrical conductivity (EC), Total dissolved
solids (TDS), Total Hardness (TH), pH, Calcium (Ca),
Magnesium (Mg), Sodium (Na), Potassium (K), Chloride (Cl),
Sulphate (SO4), Bicarbonate (HCO3), Carbonate (CO3), Iron
(Fe), Manganese (Mn), Zinc (Zn), Cupper (Cu), Nickel (Ni),
Nitrate (NO3) and Ammonium (NH4) are analyzed. From the
correlation matrix analysis of groundwater quality parameters,
strong correlation is observed among K, Ca and CL versus EC.
The same relations between Mg, Ca, CL versus TDS, as well as
weak and negative correlation are found among HCO3, Fe, Mn,
Zn, Cu, NH4, NO3 with EC, TDS. Factor analysis is applied on
the 19 parameters to investigate the origin of the water pollution
sources. Multivariate analysis showed the existence of up to four
significant factors which account for 77.0 % of the total variance
of hydrochemistry data. The first two factors can be initially
assigned to mineralization, mining and salinity due to saltwater
intrusion whereas the others originate as a result of industrial
wastes, domestic wastes and wastes from agriculture activities.
This work will provide policy makers and land use managers
with knowledge of precise groundwater quality problems
affecting the aquifer. It is recommended that concerned
authorities should take the necessary actions to control the
pollution sources of groundwater such as human activities,
agricultural activities, and other industrial units.
Index Terms—Groundwater quality, multivariate analysis,
nile delta aquifer, factor analysis.
I. INTRODUCTION
Groundwater is the main source for domestic, industrial
and agriculture uses in most of the new reclaimed areas in the
western Nile Delta region, which affect the groundwater
quality. The Fresh water in the western Nile Delta
concentrated in the central-eastern part, close to Rosetta
branch. The concentration of (Cl) and (SO4) ions acquires the
higher concentrations of the anions, where as the
concentration of (Na), (Ca) and (Mg) acquire the higher
concentrations of the cations, Sharaky et al. [1]. However, the
Nile Delta saturated zone lies beneath several land uses which
reflect variations in the aquifer characteristics within the delta
basin. The agricultural and industrial activities in the Nile
Delta region affect the groundwater quality, Ramily [2]. On
the other hand, Taha et al. [3] evaluated the water quality in
the new communities south east the Nile Delta. The water
resources include groundwater, surface water and drainage
water in the new communities located at the South Eastern
part of the Nile Delta, Egypt. The results showed that the
available water resources were classified into different
categories based on the content of major cations, anions and
total dissolved salts. Moreover, the microbial content of
drinking groundwater water in Kafr Al-Zayat region (Egypt)
was assessed by Masoud [4]. The conducted factor analysis
indicated that the microbial content is the most influential
factor raising the variability of groundwater quality in the
study area. Turbidity was strongly associated with is the most
of the quality parameters and resulting from urban and
agricultural runoff. The temporal and spatial variations of
groundwater quality of the Northern Nile Delta aquifer using
multivariate statistical techniques introduced by El Arabi et al.
[5]. They found that four factors were controlling the
groundwater quality within the study period of four years
(2007-2010). Two of the factors were initially assigned to
natural mineralization and saline whereas the others two were
related to pollution as a result of agriculture and industrial
activities. The ARCGIS was utilized to detect the spatial
variations of the four factors. The study recommended a
suitable environmental treatment for the industrial wastes.
Classification the groundwater quality or its type can offer
great advantages especially in regional groundwater
management and provides a short, quick processing,
interpretation for a lot of complete hydrochemical data sets
and concise presentation of the results. GIS spatial clustering
technique is used to the hydrochemical data in order to
identify over geographical space the different homogenous
groundwater quality and type classes present in an area north
the Nile Delta, [6]. Also, Mogren and Shehata [7] used GIS to
present the groundwater vulnerability mapping of the
Quaternary aquifer system in the North-Eastern part of Nile
Delta. GIS layers have been created to adopt the most
indicative criteria for investigating the groundwater
degradation trends from sea level rise and seawater intrusion.
Also, Subramani et al. [8] used the GIS to study the
groundwater quality for Coonoor Taluk in Nilgiri District
(India). The ground water quality analysis was carried out for
the samples were collected and the results are presented in a
GIS based water quality mapping. Moreover, Khan et al. [9]
applied descriptive statistical measure and a partial
correlation analysis to groundwater quality data set monitored
Groundwater Quality Investigation Using Multivariate
Analysis — Case Study: Western Nile Delta Aquifer, Egypt
Asaad M. Armanuos, Abdelazim Negm, and Oliver C. Saavedra Valeriano
Manuscript received December 11, 2014; revised May 4, 2015.
Asaad M. Armanuos and Abdelazim Negm are with Environmental
Engineering Department, School of Energy and Environmental Engineering,
Egypt-Japan University of Science and Technology, E-JUST, Alexandria,
Egypt (e-mail: [email protected], [email protected],
Oliver C. Saavedra Valeriano is with the Department of Civil
Engineering, Tokyo Institute of Technology (2-12-1 Oookayama, Meguro,
Tokyo 152-0033, Japan. He is also with E-JUST, Egypt (e-mail:

in pre-monsoon and post-monsoon for three years to
investigate seasonal variations of groundwater quality in India.
Also, in India, Shivasharanappa and Srinivas [10] studied the
seasonal variability of groundwater quality parameters in an
industrial area for pre-monsoon and post-monsoon seasons
for the years 2009, 2010 & 2011. Seventeen physicochemical
parameters were analyzed. Factor analysis was applied on the
data set to investigate the origin of the water pollution
sources.
II. STUDY AREA DISCRIPTION
Fig. 1. Map of the study area [1].
III. MATERIALS AND METHODS
A. Chemical Parameters
Sixteen hydro-chemical variables [1] including electrical
conductivity (EC), total dissolved solids (TDS), pH, calcium
(Ca), magnesium (Mg), chloride (Cl), nitrate (NO3), sulfate
(SO4), iron (Fe), sodium (Na), potassium (K), bicarbonate
(HCO3), manganese (Mn), zinc (Zn), cupper (Cu) and
ammonium (NH4) were selected as variables inputs for Factor
analysis.
B. Used Tools
The Statistical Packages for Social Sciences (SPSS) was
used to carry out the statistical analyses. Correlation Matrix is
as a first step in factor analysis is used to account for the
degree of mutually shared variability between individual pairs
of groundwater quality variables Perfect correlation
coefficient is ranging 0.99 to 1.00. Strong correlation
coefficient is ranging 0.80 to 0.98. Parameters showing
considered when r<0.5. The negative values show inverse
relationships between chemical parameters. The strong to
perfect correlation between the chemical parameters is an
indication of common source. Factor analysis exposes the
important factor responsible for variation in ground water
quality eventually leads to sources identification of ground
water pollution. Therefore, the factor analysis is applied to
extract the most significant factors and to reduce the
contribution of less significant variables to simplify even
more of the data structure coming from factor analysis. In the
present work, factor extraction was done by principal
components; whereas, Varimax rotation with Kaiser
Normalization was used for orthogonal rotation and results in
factors that are uncorrelated. The factor scores that are
computed for each observation which expresses the
importance of each factor at that observation site outlined the
importance of factor scores and their relations to potential of
the processes described by each factor. Also, the spatial
analysis module of ARCGIS 10.2 is used to plot the spatial
distribution for groundwater quality parameters. Moreover,
Inverse distance weighted (IDW) interpolation technique is
used for spatial modeling. The IDW is an algorithm used to
interpolate data spatially or estimate values between
measurements. Each value estimated in an IDW interpolation
is a weighted average of the surrounding sample points.
IV. RESULTS AND DISCUSSIONS
A. Spatial Variation of Groundwater Parameters
Using ARC VIEW 10.2 the spatial interpolation was done
on the basis of attribute values. Like TDS, Cl, Na, Ca, TH, pH,
EC, CO3, Fe, NH4, Ni and Mn. For each parameter the spatial
analysis was done and map was created as presented in Fig. 2
to Fig. 13.
Fig. 2. Spatial distribution of TDS.
Fig. 2 shows the spatial distribution of TDS in the study
area and it is ranging from 430 mg/l to 24407 mg/l with an
average of 2684.22 mg/L. It is clear from the figure that high
concentration of TDS is observed near the shore line of
Mediterranean Sea in the north as a result of interaction
between freshwater in the aquifer and saltwater from
International Journal of Environmental Science and Development, Vol. 7, No. 1, January 2016
2
The study area is located in western Nile Delta as shown in
Fig. 1. Samples were collected from 108 wells and analyzed
for physo-chemical parameters in RIGW 2007 by Sharaky et
al. [1].
correlation coefficients of r>0.5-0.8 are considered to be
moderate correlation. Weak correlation coefficient is

Fig. 3. Spatial distribution of Cl.
Fig. 3 shows the spatial distribution of Chloride in the study
area and it is fluctuating from 39 mg/l to 12173 mg/l with an
average of 1000.31 mg/L. High concentration of chloride is
observed as 12173 mg/l near the northern part i.e, near the
Mediterranean Sea, Sharaky et al. [1]. This may be due to
either saltwater intrusion or to pollution from industrial or
domestic wastes which finds its way to groundwater through
seepage or inflation. Concentration of chloride in the central
and eastern part decreases which is attributed to the expected
high groundwater recharge from Rosetta Branch and
irrigation canals.
Fig. 4. Spatial distribution of Na.
Fig. 4 showed the spatial distribution of Sodium in the
study area. It varies from 35 mg/l to 7774 mg/l with an
average of 733.54 mg/L. The major source of sodium content
in the ground water is due to presence of salts. High
concentration of Sodium (7774 mg/l) is observed in the
northern part near the Mediterranean Sea due to seawater and
freshwater interface and less recharge of freshwater from
irrigation canals and River Nile, Sharaky et al. [1]. On the
other hand, concentration of Sodium decreases gradually in
the central and eastern part due to recharging from irrigation
canals.
Fig. 5. Spatial distribution of Ca.
Fig. 5 presents the spatial distribution of Calcium in the
study area and it is fluctuating from 12 mg/l to 1300 mg/l with
an average of 97.84 mg/L, Sharaky et al. [1]. Calcium occurs
in water mainly due to the presence of limestone, gypsum, and
dolomite and gypsi ferrous minerals. Higher values of
calcium concentration are observed in northern part due to
saltwater intrusion and degradation of aquifer sediments. On
the other hand, concentration of calcium decreases in the
eastern part of the study area because seepage of freshwater
from irrigation canals and River Nile.
Fig. 6. Spatial distribution of TH.
Fig. 6 shows the spatial distribution of Total Hardness in
the study area. It ranges between 113 mg/l to 6739 mg/l with
International Journal of Environmental Science and Development, Vol. 7, No. 1, January 2016
3
Mediterranean Sea, Sharaky et al. [1]. On the other hand,
lower concentration is shown in eastern part which is
attributed to the effect of seepage from Rosetta branch and
irrigation canals. Moderate concentration is observed in
western part of the study area.

Fig. 7. Spatial distribution of pH.
Similarly, Fig. 7 shows the spatial distribution of pH in the
study area. The pH varies between 7.11 and 8.65 with an
average of 7.90. The pH parameter is one of the most
important operational water quality parameters. High values
of pH are observed only in eastern part while lower values are
observed in western and northern part of the study area.
Fig. 8. Spatial distribution of EC.
Fig. 8 indicates that the Electrical Conductivity (EC) in the
study area ranges between 0.43 and 37.5 μS/cm at 30°C with a
mean of 4.23 μS/cm. It can be seen from the figure that high
Fig. 9. Spatial distribution of HCO3.
Fig. 9 indicates that Carbonate (CO3) in the study area
ranges between 0.0 and 60.0 mg/L with a mean of 2.53 mg/L.
Carbonates are found in groundwater due to rock content, in
most sedimentary rocks, and even some igneous and
metamorphic rocks. Lower concentration of Carbonate is
observed in Northern and southern part while higher
concentration is observed in the all eastern and western part of
the study area.
Fig. 10. Spatial distribution of Fe.
Fig. 10 shows that the Iron (Fe) in the study area ranges
between 0.05 and 7.0 mg/L with a mean of 0.85 mg/L. The
iron occurs naturally in the aquifer but levels in groundwater
can be increased by dissolution of ferrous borehole and hand
pump components. Most of the study area exhibits low
concentration of iron except small areas in eastern and
western part that show high or moderate concentrations.
Fig. 11 shows that Ammonium (NH4) in the study area is
ranges between 0.01 and 0.5 mg/L with a mean of 0.035 mg/L.
Ammonia may be present in groundwater as a result of the
degradation of naturally occurring organic matter or
manmade sources. Also originate from nitrogen-fertilizer
International Journal of Environmental Science and Development, Vol. 7, No. 1, January 2016
4
an average of 612.84 mg/L. Hardness in water is caused
mainly due to the presence of carbonates and bicarbonates of
calcium and magnesium, sulphate, chloride and nitrate. Total
hardness in water is a content of calcium (Ca2+
) and
magnesium (Mg2+
) as equivalent of CaCO3. High
concentration of total hardness in Northern part is due to high
concentration of calcium and magnesium whereas lower
concentration in eastern part is due to the contribution of the
continuous recharge of freshwater.
concentration of EC is observed in Northern part near the
Mediterranean Sea with high values of dissolved salts. On the
other hand lower concentration concentrated in the all
southern and eastern part of the study area.

application, livestock operations, industrial processes,
sewage infiltration, and cement mortar pipe lining. Higher
values of Ammonium are concentrated in northern and
southern part whereas lowest values are presented in eastern
and western part of the study area.
Fig. 11. Spatial distribution of NH4.
Fig. 12. Spatial distribution of Ni.
Fig. 13. Spatial distribution of Mn.
Fig. 12 shows that Nickel (Ni) ranges between 0.03 and 3.1
mg/L with a mean of 0.33 mg/L. Nickel occurs naturally in
soils, groundwater, and surface water. Nickel (Ni) is often
used in electroplating, stainless steel and alloy products,
mining, and refining. Lower values of Nickel are concentrated
in central and north part whereas higher values are observed
in southern part of the study area.
Finally, Fig. 13 shows that Manganese (Mn) ranges
between 0.03 and 0.4 mg/L with a mean of 0.14 mg/L.
Manganese occurs naturally as a mineral from sediment and
rocks or from mining and industrial waste. Lower values of
Manganese are observed in eastern and northern part whereas
higher values are concentrated in southern part of the study
area.
B. Factor Analysis
The correlation matric as a first step of the factor analysis is
presented in Table I.
From Table I, perfect correlation is found between TDS
and EC, and with Na and EC. The correlation matrix shows
strong correlation between Mg, Ca, CL and EC. Similar
relations are found between Na, Mg, Ca, and CL with TDS
and among Na and K, Mg and Na, and with CL and Na as well.
Strong correlation is found between Ca and Mg, CL and Mg,
SO4 and Ca, and with CL and Ca. Moderate correlation is
observed between K and SO4 with EC, K and TDS, and with
SO4 and TDS. Similar correlation is found between Mg, CL
and K, and with Ca, SO4 and Na. and among SO4, HCO3 and
Mg, and with SO4 and C as well. On the other hand, Table I
shows negative and weak correlation between HCO3, Fe, Mn,
Zn, Cu, NH4 and NO3 with EC, TDS, pH, K, Na, Mg, Ca and
CL.
The examination of the Scree plot shown in Fig. 14
indicated that four factors were responsible for the variance of
19 parameters.
Fig. 14. The scree plot curve.
Table II presents the loading of each variable under each
one of the four factors. In factor analysis the first factor
usually represents the most important process or mix
processes controlling the hydrochemistry. It has the highest
eigenvalue and accounts for the high variance among the
factors. In this study, the first factor which accounts for about
47.2% of the variance has highest positive loadings for EC,
TDS, K, Ca, Mg, Na, CL and SO4.
International Journal of Environmental Science and Development, Vol. 7, No. 1, January 2016
5
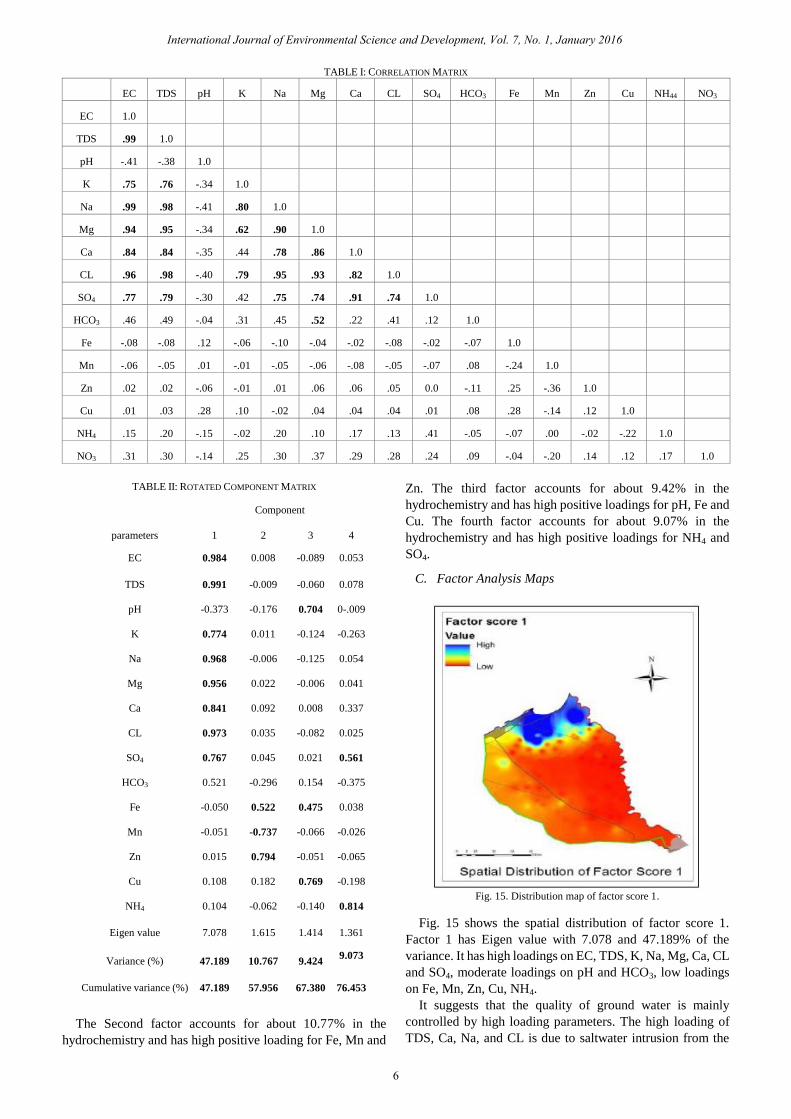
TABLE II: ROTATED COMPONENT MATRIX
Component
parameters 1 2 3 4
EC 0.984 0.008 -0.089 0.053
TDS 0.991 -0.009 -0.060 0.078
pH -0.373 -0.176 0.704 0-.009
K 0.774 0.011 -0.124 -0.263
Na 0.968 -0.006 -0.125 0.054
Mg 0.956 0.022 -0.006 0.041
Ca 0.841 0.092 0.008 0.337
CL 0.973 0.035 -0.082 0.025
SO4 0.767 0.045 0.021 0.561
HCO3 0.521 -0.296 0.154 -0.375
Fe -0.050 0.522 0.475 0.038
Mn -0.051 -0.737 -0.066 -0.026
Zn 0.015 0.794 -0.051 -0.065
Cu 0.108 0.182 0.769 -0.198
NH4 0.104 -0.062 -0.140 0.814
Eigen value 7.078 1.615 1.414 1.361
Variance (%) 47.189 10.767 9.424 9.073
Cumulative variance (%) 47.189 57.956 67.380 76.453
The Second factor accounts for about 10.77% in the
hydrochemistry and has high positive loading for Fe, Mn and
Zn. The third factor accounts for about 9.42% in the
hydrochemistry and has high positive loadings for pH, Fe and
Cu. The fourth factor accounts for about 9.07% in the
hydrochemistry and has high positive loadings for NH4 and
SO4.
C. Factor Analysis Maps
Fig. 15. Distribution map of factor score 1.
Fig. 15 shows the spatial distribution of factor score 1.
Factor 1 has Eigen value with 7.078 and 47.189% of the
variance. It has high loadings on EC, TDS, K, Na, Mg, Ca, CL
and SO4, moderate loadings on pH and HCO3, low loadings
on Fe, Mn, Zn, Cu, NH4.
It suggests that the quality of ground water is mainly
controlled by high loading parameters. The high loading of
TDS, Ca, Na, and CL is due to saltwater intrusion from the
International Journal of Environmental Science and Development, Vol. 7, No. 1, January 2016
6
TABLE I: CORRELATION MATRIX
EC TDS pH K Na Mg Ca CL SO4 HCO3 Fe Mn Zn Cu NH44 NO3
EC 1.0
TDS .99 1.0
pH -.41 -.38 1.0
K .75 .76 -.34 1.0
Na .99 .98 -.41 .80 1.0
Mg .94 .95 -.34 .62 .90 1.0
Ca .84 .84 -.35 .44 .78 .86 1.0
CL .96 .98 -.40 .79 .95 .93 .82 1.0
SO4 .77 .79 -.30 .42 .75 .74 .91 .74 1.0
HCO3
Hco3O3
.46 .49 -.04 .31 .45 .52 .22 .41 .12 1.0
Fe -.08 -.08 .12 -.06 -.10 -.04 -.02 -.08 -.02 -.07 1.0
Mn -.06 -.05 .01 -.01 -.05 -.06 -.08 -.05 -.07 .08 -.24 1.0
Zn .02 .02 -.06 -.01 .01 .06 .06 .05 0.0 -.11 .25 -.36 1.0
Cu .01 .03 .28 .10 -.02 .04 .04 .04 .01 .08 .28 -.14 .12 1.0
NH4 .15 .20 -.15 -.02 .20 .10 .17 .13 .41 -.05 -.07 .00 -.02 -.22 1.0
NO3 .31 .30 -.14 .25 .30 .37 .29 .28 .24 .09 -.04 -.20 .14 .12 .17 1.0

Mediterranean Sea. The high loading of SO4 is related to the
long-history of evaporation process, the high value of K
suggests pollution from application of potash fertilizers to
agricultural lands. It is shown from Fig. 15 that, the high
loading for factor number one is in the Northern part of the
study area near the Mediterranean Sea.
The moderate loading of pH represents solubility of
minerals. It is shown from Fig. 15 that, the moderate loading
for factor number one is in the Western and Southern part of
the study area. The combination of Fe, Mn, Zn and Cu
indicates weathering of country rocks. It is shown from Fig.
15 that, the low loading for factor number one is in the central
and Eastern part of the study area.
Fig. 16. Distribution map of factor score 2.
Fig. 17. Distribution map of factor score 3.
Fig. 16 shows the spatial distribution of factor score 2.
Factor 2 has eigen values of 1.62 and 10.77% of the variance.
It has high loadings on Fe, Mn and Zn, moderate loading on
pH, Cu, HCO3 and low loadings on EC, TDS, K, Na, Mg, Ca,
CL and SO4.
The high loading for Fe, Mn and Zn component and it is
responsible for salinity due to cation-exchange processes at
soil water interface and industrial wastes. Iron loading may be
due to dissolution of lithogenic materials. It is clear from the
figure that high value for factor 2 is concentrated in Northern
part from the study area.
Moderate loading is concentrated in the central, Eastern
and Southern part of the study area. On the other hand, low
loading is concentrated in Western North part of the study
area.
The high loading for Fe and Cu is due to salinity from
cation-exchange processes at soil water interface and
industrial wastes, Iron loading may be due to dissolution of
lithogenic materials. The moderate loading pH represents
solubility of minerals. It can be clear from the figure that high
value for factor 3 is concentrated in Eastern part from the
study area.
Moderate loading is concentrated in the Northern part of
the study area with a small area, whereas Low loading is
concentrated in the Northern part of the study area.
Fig. 18. Distribution map of factor score 4.
Fig. 18 shows the spatial distribution of factor score 4.
Factor 4 has Eigen value with 1.36 and 9.07% of the variance.
It has high loadings on SO4 and NH4, moderate loadings on K,
Ca and Cu and low loadings on EC, TDS, pH , Na, Mg , CL,
Fe, Mn and Zn .
International Journal of Environmental Science and Development, Vol. 7, No. 1, January 2016
7
The high Loading of SO4 is related to the long-history of
evaporation process while the high value of NH4 suggests
pollution from application of potash fertilizers to agricultural
lands. It can be clear from the Fig. 18 that the high loading for
factor 4 was concentrated in eastern, central and southern part
Fig. 17 shows the spatial distribution of factor score 3.
Factor 3 having Eigen value with 1.414 and 9.424% of the
variance, has high loadings on pH, Fe and Cu, low loadings on
EC, TDS, K, Na, Mg, Ca, CL, HCO3, Mn, Zn, NH4 and SO4.

from the study area.
The moderate loading is concentrated in the Northern part
of the study area with a small area. On the other hand the low
loading is concentrated in the Northern part of the study area.
V. CONCLUSIONS
The spatial distribution for groundwater quality parameters
is done using the spatial analyst module in ARCGIS 10.2
software. Inverse distance weighted (IDW) interpolation
technique is used for spatial modeling. The Statistical
Packages for Social Sciences (SPSS) is used to carry out the
statistical analysis. Both correlation and factor analysis are
conducted. Correlation among the investigated parameters
varied from perfect to weak. The factor analysis is applied to
identify the origin of the water pollution sources. The
multivariate analysis showed the existence of up to four
significant factors which account for 77.0 % of the total
variance of hydrochemistry data. The first factor which
accounts for about 47.2% of the total variance assigned to
salinity due to saltwater intrusion from the Mediterranean Sea.
The second factor accounts for 10.77% of the total variance
and it is responsible for salinity due to mineral from sediment
and rocks or from mining, industrial waste, and corroding
metal. The third factor accounts for 9.42% of the total
variance and it is responsible for salinity due to
cation-exchange processes at soil water interface, industrial
and domestic waste, solubility of minerals, and dissolution of
lithogenic materials. The four factor accounts for 9.07% of
the total variance and related to long-history of evaporation
process and pollution from application of fertilizers and
pesticides to agricultural lands.
VI. RECOMMENDATION
It is recommended that concerned authorities should take
the necessary actions to control the pollution sources of
groundwater such as human activities, agricultural activities,
and other industrial units. These actions may include
environmental treatment of the industrial and domestic wastes
as well as regularly environmental check for the industrial and
human activities is highly recommended. Also, most
contaminated areas such as those near of the shoreline of the
Mediterranean Sea should benefit as the first priority from any
monitoring programs, desalination and development projects.
Moreover, awareness of the concerned people should be
increased to maintain and preserve the groundwater quality.
ABBREVIATIONS
Electrical conductivity (EC), Total dissolved solids (TDS),
Total Hardness (TH), Calcium (Ca), Magnesium (Mg),
Sodium (Na), Potassium (K), Chloride (CL), Sulphate (SO4),
Bicarbonate (HCO3), Carbonate (CO3), Iron (Fe), Manganese
(Mn), Zinc (Zn), Cupper (Cu), Nickel (Ni), Nitrate (NO3) and
Ammonium (NH4).
ACKNOWLEDGMENTS
The first author would like to thank the Egyptian Ministry
of Higher Education (MoHE) for providing him the financial
support (PhD scholarship) for this research as well as the
Egypt Japan University of Science and Technology (E-JUST)
for offering the facility and tools needed to conduct this work.
This work was partially supported by JSPS "Core-to-Core
Program, B.Asia-Africa Science Platforms.
REFERENCES
[1] A. M. Sharaky, S. A. Atta, A. S. E. Hassanein, and K. M. A. Khallaf,
“Hydrogeochemistry of groundwater in the Western Nile Delta
aquifers, Egypt,” presented at 2007 ICGT Conf., Cairo University,
March 19-21, 2007.
[2] I. M. E. Ramily, “Hydrogeological and water quality characteristics of
the sturated zone beneath the various land uses in the Nile Delta region,
Egypt,” in Proc. Rabat Symposium S4, April-May 1997, IAHS Publ.
no. 243.
[3] A. A. Taha, A. S. E. Mahmoudi, and I. M. El-Hadda, “Evaluation of the
water quality in new communities South East the Nile Delta, Egypt,”
Emirates Journal for Engineering Research, vol. 8, no. 2, pp. 51-67,
2003.
[4] A. A. Masoud, “Spatio-temporal evaluation of the groundwater quality
in Kafr Al-Zayat district, Egypt,” Hydrol. Process, vol. 27, issue 20, pp.
2987–3002, Wiley Online Library, 2013.
[5] N. E. Arabi, Y. Idris, and A. Fekry, “Temporal and spatial change
detection of variations in the groundwater composition by multivariate
statistical techniques,” New York Science Journal, vol. 6, no. 11, 2013.
[6] Y. A. Idris, “A GIS-based spatial classification technique to identify
the groundwater quality and type classes,” Journal of American
Science, vol. 9, no. 12, 2013.
[8] T. Subramani, S. Krishnan, and P. K. Kumaresan, “Study of
groundwater quality with GIS application for Coonoor Taluk in Nilgiri
district,” International Journal of Modern Engineering Research, vol.
2, issue 3, pp. 586-592, ISSN: 2249-6645, May-June 2012.
[9] M. M. A. Khan, R. Umar, M. A. Baten, H. Lateh, and A. A. Kamil,
“Seasonal variations in groundwater quality: A statistical approach,”
International Journal of the Physical Sciences, vol. 7, no. 25, pp.
4026-4035, June 29, 2012.
[10] Shivasharanappa and P. Srinivas, “Studies on seasonal variation of
ground water quality using multivariate analysis for Bidar urban & ITS
industrial area (Kanataka-State, INDIA),” International Journal of
Research in Engineering and Technology, vol. 2, no. 13, pp. 252–261,
2013.
Asaad Mater Asaad Armanuos is an assistant
lecturer in Irrigation and Hydraulics Engineering
Department, Civil Engineering Department, Faculty of
Engineering, Tanta University, Egypt. He is a PhD
student at Environmental Engineering Department,
Egypt-Japan University of Science and Technology
(E-JUST), since Sep. 2014. His has a BSc in civil
engineering (2008) with very good degree with honor,
the MSc degree in groundwater contamination transport with title use of
double sheet piles to control the contaminant transport through the Soil
(2014). His research areas are wide to include groundwater, hydrology, water
resources, contaminant transport, groundwater modeling, hydrological
model, ARCGIS, groundwater quality, groundwater quantity and saltwater
intrusion.
Abdelazim Negm was born in Sharkia, Egypt. His
background is civil engineering because he was
graduated from Irrigation and Environmental
Engineering Dept. in 1985. Prof. Negm has got his
M.Sc. from Ain Shams University in 1990 in
hydrology of the Nile Basin. He got the PhD degree in
1990 in hydraulics.
Currently, he is a professor of water resources in
Egypt-Japan University for Science and Technology
(E-JUST) since Oct. 2012 and the chairman of the Environmental
Engineering Dept. at E-JUST since Feb. 17, 2013. He worked as a
demonstrator in Faculty of Engineering, Zagazig University in 1986 and
continued till he occupied the position of the vice dean for Academic and
International Journal of Environmental Science and Development, Vol. 7, No. 1, January 2016
8
[7] S. Mogren and M. Shehata, ―Groundwater vulnerability and risk
mapping of the quaternary aquifer system in the northeastern part of
the Nile Delta, Egypt,‖ International Research Journal of Geology
and Mining (IRJGM), vol. 2, no. 7, pp. 161-173, September 2012.

International Journal of Environmental Science and Development, Vol. 7, No. 1, January 2016
9
Student Affair. He was promoted as a professor of hydraulics. His research
areas are wide to include hydraulic, hydrology and water resources. He
published about 200 papers in national and international Journals and
conferences. He is listed in (a) Marquis Who is Who?, (b) IBC's 2000
Outstanding Intellectuals of the 21st Century , and (c) ABI directory for his
achievement in the field of Hydraulics and Water Resources. He participated
in more than 55 conferences. He has awarded the prizes of best papers three
times. He participates in the two EU funded international projects.
He has four years experience in teaching advanced hydrology, GIS, water
resources management lectures at graduate school. His major research
interests are in development of decision supporting tools for water resources
management including optimal dam operation, flood control.
He is a project coordinator of Integrated Water Resources and
Environmental Management for Asian and African Mega-delta under
Climate Change Effects.
Oliver C. Saavedra Valeriano is a PhD in civil
engineering (applied hydrology oriented). He is an
associate professor at Tokyo Institute of Technology
and an adjunct professor to E-JUST since January
2010 to present.
He received his MSc in groundwater in 2002,
Eberhard Karl University of Tübingen, Germany and
the BSc. in civil engineering in 1998, Bolivian
Private University, Bolivia.