Embed Size (px)
Citation preview
Groundwater Quality in Southland 1998.doc
Prepared by K D Hamill
September 1998
Southland Regional Council Publication No 96
Groundwater Quality
In Southland: A Regional Overview

Groundwater Quality in Southland: A Regional Overview i
Acknowledgments
The snap-shot survey and this report has depended on many people: Natalie Henderson did most of the fieldwork, data entry and face to face promotion
for the snap-shot survey; she has summarised anecdotal information on groundwater in Appendix 3;
Jens Rekker (AquaFirma) gave vital advice on the design of the survey and interpretation of results, he also provided a historical perspective on bore and well construction (Appendix 7);
Adrian Jones (AquaFirma) collected samples that filled geographic gaps in the survey;
Angela Aitchison played a leading role promoting the survey throughout Southland;
Southland Regional Council laboratory staff (Graeme McKenzie, Suzanne Oxley, Suman Allan) did all the laboratory analysis;
Southland Regional Council reception and typists helped field the numerous phone calls that resulted from Angela’s promotion campaign.
Ian Welsh and Deidre Francis provided valuable peer review and comments on the draft reports.
John Hadfield (Environment Waikato) provided useful comments on the final draft.

Groundwater Quality in Southland: A Regional Overview
ii
Table of Contents
Acknowledgments ................................................................................................................. i
Table of Contents ................................................................................................................. ii
Table of Figures .................................................................................................................. iv
Table of Tables .................................................................................................................... iv
Table of Maps ...................................................................................................................... iv
Executive Summary ............................................................................................................. 1
1.0 Introduction ............................................................................................................ 2
1.1 Contamination of Groundwater by Nitrates ................................................................ 2 1.2 Contamination of Groundwater by Faecal Coliform Bacteria ..................................... 2 1.3 Background to this Survey ........................................................................................... 2 1.4 Geology of Unconfined Aquifers in Southland ............................................................ 4
2.0 Methodology ........................................................................................................... 5
2.1 Locating Bores and Wells ............................................................................................ 5 2.2 Sampling ...................................................................................................................... 5 2.3 Seasonality ................................................................................................................... 6 2.4 Preparing the Data for Analysis ....................................................................................7
3.0 The Use of Groundwater in Southland .................................................................. 8
3.1 Introduction To Groundwater Use .............................................................................. 8 3.2 Uses of Groundwater ................................................................................................... 8
3.2.1 Groundwater used for drinking ....................................................................... 8 3.3 Extent of Groundwater Use ......................................................................................... 9
3.3.1 Estimated groundwater use in Southland ....................................................... 9 3.3.2 Other Sources of Water .................................................................................... 9
4.0 Groundwater Quality Results .............................................................................. 11
4.1 Summary Results ........................................................................................................ 11 4.1.1 General ............................................................................................................ 11 4.1.2 Nitrate ............................................................................................................. 11 4.1.3 Faecal Coliforms .............................................................................................. 11
4.2 Regional Variations in Groundwater Quality ............................................................. 14 4.2.1 Location of sites .............................................................................................. 14 4.2.2 Possible problem areas ................................................................................... 14

Groundwater Quality in Southland: A Regional Overview iii
4.2.3 Comparisons with other studies ..................................................................... 19 4.3 Localised Impacts on Groundwater ........................................................................... 22
4.3.1 Comparison between Wells and Bores .......................................................... 22 4.3.2 Well Head Protection: Excluding likely surface contamination ................... 23 4.3.3 Well Head protection extends below the ground .......................................... 23 4.3.4 Proximity of septic tank disposal areas affect nitrate levels .......................... 23 4.3.5 Depth to the water table ................................................................................. 24 4.3.6 Aquifer water quality vs localised impacts..................................................... 25
4.4 Land Use and Groundwater Quality .......................................................................... 26 4.4.1 Relating groundwater quality to land use ...................................................... 26 4.4.2 Land use differences were related to septic tank proximity .......................... 26 4.4.3 Groundwater nitrate reflects the cumulative effects of inputs ...................... 27
4.5 Relationships between Water Quality Parameters .................................................... 27 4.5.1 Nitrate was weakly related to total iron ......................................................... 27 4.5.2 High nitrate was associated with high conductivity ...................................... 28
5.0 Discussion: Groundwater Quality in Southland ................................................. 30
5.1 Nitrate ........................................................................................................................ 30 5.2 Faecal Coliforms ........................................................................................................ 30 5.3 Planning Issues ........................................................................................................... 31
6.0 Summary ............................................................................................................... 33
6.1 Groundwater Use and Awareness in Southland ........................................................ 33 6.2 Groundwater Quality In Southland ........................................................................... 33 6.3 Lessons for Future Investigations ............................................................................. 34
7.0 Recommendations................................................................................................ 35
7.1 Education and Promotion .......................................................................................... 35 7.2 Information ................................................................................................................ 35 7.3 Management .............................................................................................................. 35
References .......................................................................................................................... 36
Appendix 1 – Advertising Material Promoting the Groundwater Survey ................. 38 Appendix 2 – Field Sheet used with Samples Collection .......................................... 39 Appendix 3 – Anecdotal Information on Groundwater ............................................ 40 Appendix 4 – Code of Practice for Bore Head Protection .......................................... 41 Appendix 5 – Comparison of Nitrate Methods .......................................................... 41 Appendix 6 – Sampling for Seasonal Changes in Groundwater Nitrate ................... 42 Appendix 7 - Comments on the History of Bore and Well Construction in Southland by Jens Rekker (1998) ............................................................................................... 43 Appendix 8 – Raw Data from the Snap-Shot Survey ................................................ 44
Glossary and Abbreviations .............................................................................................. 50

Groundwater Quality in Southland: A Regional Overview
iv
Table of Figures
Fig. 3.1: Use of Groundwater in Southland ............................................................................... 8 Fig. 3.2: Groundwater Sampling ............................................................................................... 9 Fig. 4.1: Comparison of Mean Nitrate Concentration in Bores, Wells and Springs ............... 22 Fig. 4.2: Comparison of Mean Faecal Coliform Level in Bores, Wells and Springs ............... 22 Fig. 4.3: The Effect of Septic Tank Disposal Fields on Nitrate Levels .................................... 24 Fig. 4.4: Nitrate Concentrations under Different Land Use Types......................................... 26 Fig. 4.5: The Proportion of Bores and Wells within 50 m of a Septic Tank ........................... 27 Fig. 4.6: The Relationship of Groundwater Nitrate to Total Iron .......................................... 28 Fig. 4.7: The Relationship between Conductivity and Nitrate Concentration ....................... 28
Table of Tables
Table 1.1: Previous studies into groundwater quality in Southland ........................................ 3 Table 2.1: Methods Used for Sample Analysis ......................................................................... 6 Table 3.1: Proportion of those contacted that use groundwater ............................................ 10 Table 4.1: Groundwater Quality Results .................................................................................12 Table 4.2a: Distribution of Nitrate Results ..............................................................................12 Table 4.2b: Distribution of Faecal Coliform Results .............................................................. 14 Table 4.3: Comparison of Nitrate from Different Catchment Studies .................................. 19
Table of Maps
Map 1: Bores and Wells ......................................................................................................... 16 Map 2: Nitrate in Southland’s Groundwater .......................................................................... 17 Map 3: Faecal Coliforms in Southland’s Groundwater ......................................................... 18 Map 4: Nitrate in Southland’s Groundwater found in all Studies ........................................ 20 Map 5: Faecal Coliforms in Southland’s Groundwater found in all Studies ..........................21

Groundwater Quality in Southland: A Regional Overview 1
Executive Summary
During the summer of 1997/98, the Southland Regional Council undertook a survey of groundwater quality throughout Southland. The survey aimed to provide region-wide information on groundwater quality in unconfined aquifers, and to identify bores and wells that exceed the drinking water guidelines for nitrate and faecal coliforms. The survey estimated that shallow groundwater, where it is accessible, is used by over half of rural residents in Southland. Where it is utilised, groundwater is most commonly used as a source of drinking water for people and animals. Groundwater was sampled from 350 sites throughout Southland; two-thirds from bores (small diameter and usually cased) and one-third from wells (large diameter). Four percent of all the samples had nitrate concentrations above the New Zealand Drinking Water Standards (NZDWS) (which is 11.3 gm-3 NO3-N). However, after excluding sites within 50 metres of a septic tank disposal field (73 sites excluded) only three percent of samples exceeded the NZDWS and the median nitrate concentration was 2.8 gm-3 NO3-N. Wells were more likely than bores to exceed the nitrate guidelines. Faecal coliform contamination was prevalent. Forty percent of all samples had faecal coliform levels above the
NZDWS (i.e. one or more CFU per 100 ml). Faecal coliform contamination was much more common in wells compared to bores and was found in less than one-quarter of all the bores sampled but in three-quarters of the wells sampled. Bores and wells with obviously poor head protection (45 sites) had more faecal coliform contamination. Similarly, bores and wells located near (within 50 metres) a septic tank disposal field had higher nitrate concentrations than those further away. Groundwater sampled below lifestyle blocks had higher nitrate concentrations than other land uses; this was because lifestyle blocks more often had their bore or well located near (and contaminated by) a septic tank. No statistical correlation was found between high nitrate concentrations and intensive land use per se. Heterogeneous land use and differences in local soil conditions, aquifer flow rates and geology probably masked a statistical correlation resulting from this survey. The survey resulted in ten recommendations for improving the sustainable management of unconfined groundwater in Southland. These recommendations can be found in Section 7.

Groundwater Quality in Southland: A Regional Overview
2
1.0 Introduction
1.1 Contamination of Groundwater by Nitrates Groundwater is a very important resource for Southland, but it is a vulnerable resource. Groundwater can be over-exploited and it can be polluted. Of the many potential contaminants of groundwater, nitrates are one of the most widespread and problematic. Excessive nitrate can cause health problems in humans and animals. Infants younger than three months are most susceptible and can develop methemogloinemia (“blue baby syndrome”). Methemogloinemia develops when ingested nitrate is reduced to nitrite, which combines with haemoglobin in the blood and reduces its ability to carry oxygen. The World Health Organisation has set guidelines for drinking water that require the concentration of nitrate nitrogen (NO3-N) to be below 10 gm-3. The New Zealand Drinking Water Standards require nitrate nitrogen to be below 11.3 gm-3 (assuming that no nitrite is present in the water). Nitrate can enter groundwater from a variety of sources, including natural sources (e.g. geology), waste material (e.g. effluent spreading or septic tank disposal fields), fertiliser or mineralisation of soil nitrogen. Groundwater is more prone to nitrate contamination when large amounts of nitrogen are applied to the land in high concentrations, the water table is near the surface, water can percolate quickly through the soil, and there is little uptake of nitrogen by plants or denitrification by bacteria. Much of Southland’s groundwater resource is susceptible to nitrate contamination because it comes from unconfined aquifers in areas of intensive land use. These “shallow” aquifers are recharged by percolation through the soil
and are influenced by activities on the land above.
1.2 Contamination of Groundwater by Faecal Coliform Bacteria
Faecal coliform bacteria indicate a source of human or animal waste. Faecal coliform bacteria do not in themselves cause disease, but they are associated with pathogens that do cause disease; so the more faecal coliforms present in water the greater the chance that pathogens are also present. Bacteria and viruses survive longer in groundwater than in surface water, but they are readily removed (filtered and adsorbed) by the soil during transport (Pang et al, 1996). Consequently, groundwater usually contains no faecal bacteria unless there is a source of contamination nearby. It is common for faecal bacteria to directly enter bores and wells if they have poor head protection or are poorly sealed (grouting). Groundwater is more likely to have faecal contamination if it is very shallow and the soil has large pores or fractures. The absence of faecal coliforms does not mean the water is safe to drink. Viruses survive longer than indicator bacteria in groundwater and viruses have been found in well water in the absence of faecal indicator bacteria (Slade, 1985 in Sinton et al, 1996).
1.3 Background to this Survey During the summer of 1997/98, Southland Regional Council under took a “snap-shot” survey of groundwater quality in Southland. This survey was inspired by the discovery of high nitrate levels in the Oreti Plains area (Rekker, 1996) and was a step towards rectifying the paucity of

Groundwater Quality in Southland: A Regional Overview 3
information on groundwater quality in Southland. Other reports have been undertaken on groundwater in unconfined aquifers, but this is the first survey in Southland to take a regional perspective on groundwater quality. Table 1.1 describes previous studies into groundwater quality in Southland.
Data from other agencies (i.e. Southland District Council) and previous reports were used in Maps 4 and 5 to augment sampling from the current study. The results of the snap-shot survey are compared with other Southland studies in Section 4.4.
Table 1.1: Previous studies into groundwater quality in Southland
Reference Main Points Rekker (1998). Oteramika trial catchment groundwater studies. Studies into non-point source groundwater effects in Southland
Groundwater quality was modelled for the Edendale aquifer based on three years monitoring of groundwater and springs. Scenario testing showed that if the whole catchment converted to intensive dairy farming, then the groundwater nitrate would increase above the drinking water standard. Management methods were proposed for reducing nitrate leaching.
Rekker & Jones (1998). Central Southland Plains groundwater study; results from field surveys and assessment
35 sites sampled for anion-cation balance and depth. Water quality was typical of other intensively farmed areas in Southland.
Rekker & Greenwood (1996). Oreti Plains high groundwater nitrate zone investigation; hydrological, isotope, soil and modelling studies report
35 sites sampled for anion-cation balance and depth. Six samples exceeded the drinking water standards for nitrate. Half the samples had faecal contamination. Herbicide residue was found in two wells. Nitrogen isotope analysis showed that elevated nitrate came from animal waste. Oreti Plains groundwater is vulnerable to contamination due to the shallow water table and clay (Pukemutu) soils, which easily crack. Soil compaction, tillage and forage cropping makes Pukemutu soils even more prone to leaching nitrate. The study recommended: groundwater monitoring, regional survey of GW nitrate, develop BMPs to reduce nitrate leaching, compile a database on land use changes.
Rekker (1996b). Special report on the Oreti Plains high groundwater nitrate zone
Reports on the initial investigation into high nitrate levels identified in the Oreti Plains, February 1996.
Rekker (1996a). Waihopai River catchment groundwater study; investigations and review of the weathered gravel unconfined and lignite measure confined aquifers
12 sites in the unconfined, weathered gravel aquifer sampled for anions-cation balance and depth. Similar water quality to the Edendale aquifer. Water extraction is becoming more common from the confined aquifer. Monitoring of water level and water quality was recommended
Rekker (1995a). Edendale aquifer characterisation study
22 sites sampled for anion-cation balance and depth in the unconfined, shallow (5-11 m deep) aquifer. Groundwater flow was modelled. Water extraction was 12% of replenishment. The impacts of agriculture and dairy factory waste irrigation were identified. Groundwater was strongly influenced by percolating soil water. Long-term monitoring was recommended.
Rekker (1995b). Groundwater study of the peripheral urban Invercargill area
16 sites sampled for anions, cations, bacteria and depth. Groundwater was used by a fifth of houses. Nitrate levels were low. Iron was common. Some faecal contamination was found, and this increased with proximity to a septic tank discharge.

Groundwater Quality in Southland: A Regional Overview
4
Rekker (1994). Southland region groundwater resource scoping study
Previous information was reviewed. Faecal contamination and high iron are the main limits on groundwater quality in Southland. Nitrate is seldom high when iron is high because iron can reduce nitrate. Intensive pastoral land use could increase nitrate levels. Monitoring of the Edendale aquifer was recommended.
Works Consultancy (1993). Waiau River valley groundwater monitoring
Quarterly monitoring of water level at 20 sites.
1.4 Geology of Unconfined Aquifers in Southland
In Southland, unconfined aquifers are primarily contained within alluvial gravel deposits from the Quaternary period. These tend to overlay Tertiary rocks and Graywacke. In the Mataura catchment (including the Waimea Plains), quaternary gravel was deposited in terraces that become progressively younger as they cascade towards the flood plain. The older terraces have moderately strong weathering of clasts and an absence of macropores (1-5 mm) due to an infilling of pore space with clay. Near the floodplain (e.g. Oteramika catchment) the aquifers have a high hydraulic conductivity, and are contained within sandy cobbles dominated by quartz material (Rekker 1997a, Rekker 1998). In the Central Plains (between the Oreti River and Aparima River), Quaternary
gravel forms a thin veneer over thick Tertiary sediments. The gravel deposits differ from those in the Mataura valley by having less quartz, a smaller grain size, and being more “silt bound”. Aquifers in the Central Plains tend to be shallow and have a low hydraulic conductivity. However, some soils in the area are prone to cracking, which allows rapid transport of contaminants to the groundwater (Rekker & Jones, 1998). In some hill country areas (e.g. Mokoreta hill country), substantial groundwater movement is thought to occur through near surface basement rock (Rekker, 1997a). Substantial lignite deposits are situated below the Quaternary deposits in the lower Mataura catchment and parts of the Central Plains. Confined aquifers within these deposits can supply substantial quantities of groundwater (Rekker & Jones, 1998).

Groundwater Quality in Southland: A Regional Overview 5
2.0 Methodology
2.1 Locating Bores and Wells The snap-shot survey was undertaken in Southland to determine the concentration of nitrate in groundwater and the extent of microbial contamination of bores and wells (Rekker, 1997). Bores and wells1 had to be located before sampling. Most bores drilled in Southland do not require a consent, and information supplied voluntarily from drillers has only been supplied to Southland Regional Council since September 1997. Consequently, locating bores and wells and contacting landowners formed a significant part of the project. Three hundred and fifty samples were taken during the survey from sites spread throughout the region. Bores and wells were initially located by: identifying unconfined gravel
aquifers; identifying properties within the
aquifers using cadastral information on the GIS; and
phoning each landowner to see if they used groundwater and if a sample could be collected. This process enabled a random selection of wells (targeted to unconfined aquifers), but the process was slow because landowners (usually farmers) were difficult to contact during the spring and summer.
In January 1998, a new sampling approach was adopted. The Council started an intensive publicity campaign and ran a competition to encourage people to phone the Council if they had a bore or well that could be sampled (see Appendix 1). The response was immediate, with 400 people offering their bore or well to be
1 Bores and wells have been differentiated for this report according to their method of construction and diameter. Bores are drilled and have and narrow diameter (< 5 units), wells are dug and tend to have and wide diameter (over a metre). Bores tend to be better sealed from the ingress of surface water than wells.
tested. Time and staffing limitations meant that not all responses were followed up. The most efficient way to sample was to combine arranged meetings in an area with “cold turkey” door knocking. An effort was made to minimise possible bias caused by the time of sampling, by sampling different parts of the region each week rather than systematically working across the region. It is concerning that many of those spoken to were poorly aware of the source of their house water and the location of their bore/well in relation to potential sources of pollution.
2.2 Sampling Strict criteria was used to identify wells appropriate for sampling (see the field sheet in Appendix 2); in particular, samples were not collected from wells likely to have localised pollution. Some of the criteria (i.e. distance from a septic tank disposal field) were relaxed part way through in the survey because so few wells met all the criteria. Field information was collected at every site and was used during data analysis. Anecdotal information about groundwater was also noted during the survey; this is summarised in Appendix 3. Samples were collected as close to the bore or well as possible and never from tanks that were partially mixed with rainwater. Sample taps were always run until constant temperature and conductivity was achieved. Unfiltered samples were collected in acid cleaned bottles, rinsed with sample before collection and stored in a cold chillybin for transport back to the laboratory. The groundwater sampled was analysed for the parameters listed in Table 2.1, which also lists associated methods and detection limits. Nitrate was measured by

Groundwater Quality in Southland: A Regional Overview
6
UV spectrophotometer, which was calibrated against the cadmium reduction (wet chemical) method. The use of an ion selective nitrate meter to measure nitrate concentration was rejected early in the project because of its inaccuracy at low levels, its inability to compensate for temperature, and the time involved in calibration. The spectrophotometer method compared well with the cadmium reduction method when nitrate concentrations were above 0.2 gm-3 NO3-N. The means of the two methods differed by 0.08 gm-3, and the average absolute difference was 3.2 percent. Calibration data is shown in Appendix 5. Some samples were analysed for E. coli as well as faecal coliforms as a double check on the form of microbial contamination. The faecal coliform bacteria consisted almost entirely of E. coli bacteria (99% correlation2 from 32 duplicate samples). Water depth was unable to be measured in many cases because the bores were often sealed. In general, the better the head protection the more difficult it was to determine the water depth.
2.3 Seasonality To account for seasonal fluctuations, samples were collected on a monthly basis from seven bores distributed over the region. Peak nitrate concentrations were found in January (one site), February (two sites) and May (two sites). There was a large increase in nitrate concentrations between December and January with, on average, 39 percent more nitrate in January compared to December. This is probably due to a large rain event before sampling in early January. It is common for nitrate to pulse into the groundwater with heavy rain and concentrations in unconfined groundwater to be highest when the water table is highest (i.e. in spring or after heavy rain events (Rekker 1994)). The results of seasonal sampling are shown in Appendix 6. Six control wells were sampled monthly. Seasonal variations of nitrate ranged between 0.2 and 3.0 gm-3 NO3-N. Consequently, sites with nitrate concentrations close to the guidelines may exceed the guidelines in certain months.
Table 2.1: Methods Used for Sample Analysis
Parameter Measured Field/ Lab
Description of Method Detection Limit
Nitrate Lab UV spectrophotometer
0.2 gm-3 NO3-N
Field Nitrate meter (stopped in favour of UV method).
0.2 gm-3 NO3-N
Lab Cadmium reduction. Used for calibration 0.01 gm-3 NO3-N Faecal coliforms Lab Membrane filtration 1 CFU/100ml E. coli Lab Membrane filtration, M.U.G. test 1 CFU/100ml Total iron Lab Colorimetric kit. 0.05 gm-3 pH Field Orion model 260 pH meter 0.01 units Electrical conductivity Field Orion model 130 conductivity meter 0.01 µS/cm temperature Field Orion model 130 conductivity meter 0.1 oC depth Field Electronic depth probe 0.005 m 2Pair-wise Spearman Rank Correlation as used.
Groundwater Quality in Southland: A Regional Overview 7
2.4 Preparing the Data for Analysis
The survey results were manipulated before the data was analysed. Firstly, when more than one method was used to measure nitrate, the result from the most accurate method was selected. Secondly, data below the detection limit, and was qualified as “less than”, was halved. For example, if no faecal coliforms are identified the laboratory result is returned as “less than 1”; this value was converted to 0.5 (TELAC).
Parametric methods of data analysis (e.g. t-test) assume that the data has a normal distribution. Therefore, the spread of data for each parameter was examined (with density histograms) to see if they had a normal distribution. Before statistical analysis, data sets with a non-normal distribution were transformed so that they became as close to “normal” as possible. For all parameters except temperature and pH, the statistical analysis was done on the data transformed by the natural logarithm.

Groundwater Quality in Southland: A Regional Overview
8
3.0 The Use of Groundwater in Southland
3.1 Introduction To Groundwater Use The extent to which groundwater is used in Southland and the nature of that use is not well known. Information that was gathered during the course of this investigation helped to bridge this knowledge gap and provided a useful indication of groundwater usage in Southland.
3.2 Uses of Groundwater 3.2.1 Groundwater used for drinking Almost 90 percent of the bores/wells sampled in the survey were used for domestic use or stock watering (see Fig. 3.1). Dairy sheds and irrigation (including house gardens) are also significant uses. Bores and wells used for domestic drinking water are often also used for stock watering.
The samples that exceeded the New Zealand Drinking Water Standards (NZDWS) nitrate guidelines (see Section 4.1) came from bores and wells mostly used for domestic and/or stock watering. Almost half (45%) of the bores and wells sampled were located on sheep farms. Many were also located on dairy farms, sheep/beef farms and lifestyle blocks (16%, 12% and 10% respectively). Two-thirds of the samples were taken from bores and one-third from wells. A few samples (3%) were taken from springs (see Fig. 3.2). Bores and wells both had the same pattern of water use and land use distribution; i.e. most were located on sheep farms and were used for domestic and stock water.
Fig. 3.1: Use of Groundwater in Southland 90 % of the bores and wells sampled were used for
domestic or stock water. n = 344
Domestic61%
other2%Dairy
shed4%
Irrigation5%
not used1%
Stock Water27 %

Groundwater Quality in Southland: A Regional Overview 9
The two-to-one distribution of bores to wells is probably representative of Southland as a whole. There was minimal bias as to whether bores or wells were excluded from sampling. Also, a similar distribution3 of bores to wells was apparent for people who responded to advertising but were unable to be visited. Jens Rekker has made some interesting comments about the history of well and bore construction and situations in which each are used. These comments can be found in Appendix 7.
Fig. 3.2: Groundwater Sampling
3.3 Extent of Groundwater Use
3.3.1 Estimated groundwater use in Southland Groundwater is used by over half of the rural residents in Southland.4 A record of responses was kept of all landowners that were phoned in the early part of the survey. This has been used to estimate the proportion of rural landowners that use groundwater. The telephone survey only contacted people in the catchments of the Waiau, Oreti, Mataura and Waihopai Rivers. The responses are summarised in Table 3.1. Significantly fewer people used groundwater in the Waiau catchment compared to the Mataura area. This could be related to the lower intensity of farming or the existence of a stock water scheme in the Waiau catchment. 3Of 124 responses that phoned Southland Regional Council but were not able to be visited, 73 % were bores and 27 % were wells. 4The survey had a slight bias because telephone interviews were focused on areas where the geology indicated unconfined aquifers may exist/ Because the survey concentrated with the most populated parts of Southland, the bias is considered to be insignificant.
The pattern of groundwater usage given in Table 3.1 is confirmed by an independent phone survey of stock drinking water (Belton et al, 1998). This survey contacted 82 farms in every region of New Zealand, and calculated the proportion of different water resources used to supply 20 percent or more stock water. The study found that 52 percent of Southland farms obtained stock water from either a bore, well or springs. Rain was used as a source of stock water by 20 percent of Southland farms (but rain was used by only 5 percent of farms in the rest of the country); and rivers and streams were used by over 40 percent of Southland farms. A number of farms used more than one source of water. 3.3.2 Other Sources of Water In this survey, rain was the most common source of water after groundwater; rain was the main water source for over a third of all respondents. When people
2/3 of the samples were taken from bores and 1/3 from wells.
Bores67%
Wells30%
Springs3%
Groundwater Quality in Southland: A Regional Overview
10
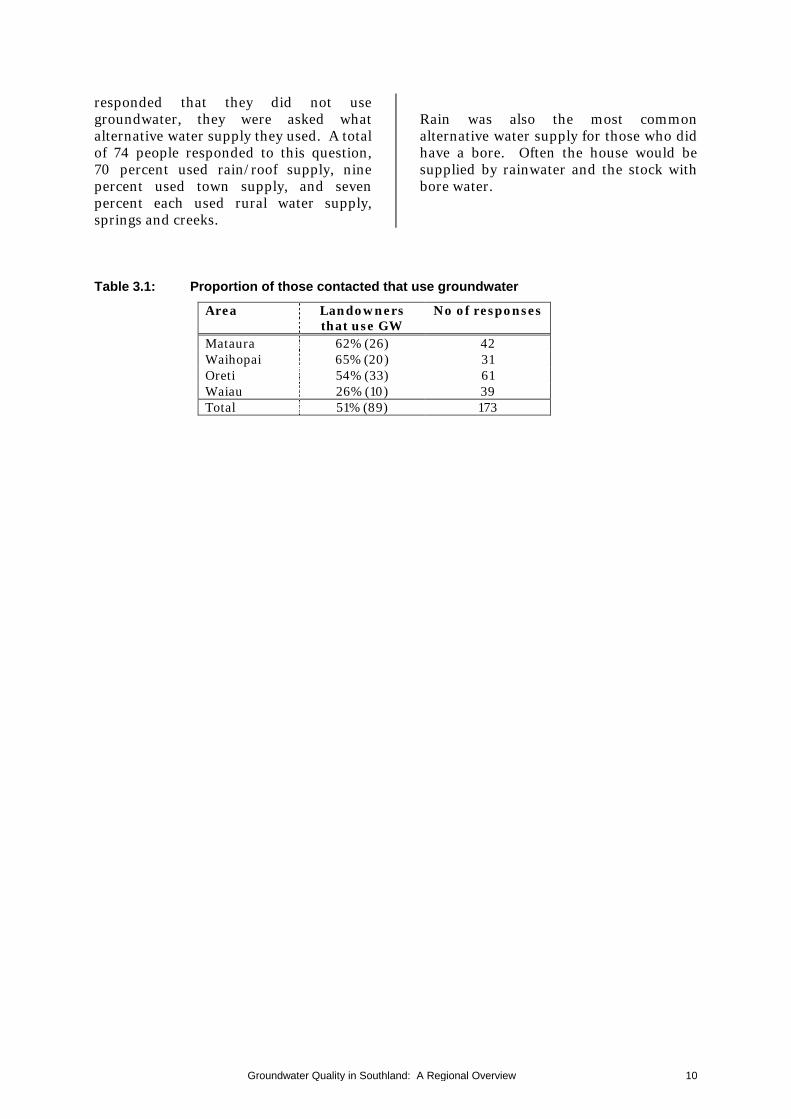
responded that they did not use groundwater, they were asked what alternative water supply they used. A total of 74 people responded to this question, 70 percent used rain/roof supply, nine percent used town supply, and seven percent each used rural water supply, springs and creeks.
Rain was also the most common alternative water supply for those who did have a bore. Often the house would be supplied by rainwater and the stock with bore water.
Table 3.1: Proportion of those contacted that use groundwater
Area Landowners that use GW
No of responses
Mataura 62% (26) 42 Waihopai 65% (20) 31 Oreti 54% (33) 61 Waiau 26% (10) 39 Total 51% (89) 173

Groundwater Quality in Southland: A Regional Overview 11
4.0 Groundwater Quality Results
4.1 Summary Results 4.1.1 General Most of the groundwater sampled had nitrate levels well (three to four times) below the drinking water standards, no faecal coliforms, was slightly acidic and low iron concentrations. Summary groundwater quality results are shown in Table 4.1. This table shows median values and minimum – maximum values in brackets. The raw data can be found in Appendix 8. Sites close to septic tank disposal fields and sites classified as having very poor wellhead protection were filtered out of some of the analysis. There was more nitrate in wells close to septic tanks, and there were more faecal coliforms in wells with poor head protection (see section 4.3).5 Furthermore, water quality significantly differed between bores and large diameter. Water from bores had less nitrate, fewer faecal coliforms, deeper water and more iron compared to wells and springs. 4.1.2 Nitrate The 350 sites surveyed had a median nitrate level of 3.2 gm-3 NO3-N (an average concentration of 4.1 gm-3 NO3-N) and only four percent of all samples exceeded the New Zealand Drinking Water Standard maximum allowable value (MAV) of 11.3 gm-3 NO3-N (see Table 4.2a). Fewer bores exceeded the nitrate guidelines compared to wells (three percent of bores compared to 10 percent of wells). 5Difference due to wellhead protection are not obvious in the results tables because only a few wells were excluded because of their very poor wellhead protection and likelihood of surface water contamination.
4.1.3 Faecal Coliforms No faecal coliforms were detected in 60 percent of all samples, but some samples (18 percent) had a large number (over 20 CFU/100 ml) of faecal coliforms (see Table 4.2b). Forty percent of all samples exceeded the New Zealand Drinking Water Standard maximum allowable value (MAV) of < 1 CFU/ 100ml. The average faecal coliform level was 29 CFU/100 ml, but this is skewed by the non-normal distribution of results. Large diameter wells were much more likely to have faecal coliform contamination compared to bores. Faecal coliforms were detected in less than one quarter of bores, but were found in three-quarters of the wells sampled.

Groundwater Quality in Southland: A Regional Overview
12
Table 4.1: Groundwater Quality Results
This table compares the median, minimum and maximum values of all bores, wells and springs sampled. The median is the middle value when all the data is put in rank order (by definition half the data is greater than the median and half the data is less than the median). Catchment
No. of
sites
NO3-N (gm-3)
FC (CFU/
100ml)
Water Depth
(m)
Temper-ature (oC)
pH Conductivity
(µS/cm)
Tot. Iron
(gm-3) Southland all data
350 3.2 (0.05-
24)
0.5 (0.5-
1000)
3.0 (0.0-45)
12.4 (9.1-20.3)
6.5 (5.3-8.6)
208 (37-1141)
0.05 (0.05-
58) Bores All data
235 3.1 (0.1-24)
0.5 (0.5-720)
3.6 (0-45)
12.4 (9.4-20.3)
6.4 (5.5-7.9)
204 (51-1141)
0.1 (0.05-
58) Wells All data
103 3.5 (0.05-
22)
4.5 (0.5-
1000)
2.5 (0.3-11)
12.4 (9.1-19.7)
6.5 (5.3-8.6)
220 (37-1097)
0.05 (0.05-
17) Springs All data
10 5 (1.9-14)
5.5 (0.5-
1000)
_ 12.3 (10–16)
6.7 (6-7.4)
194.4 (144-291)
0.08 (0.05-0.4)
Excluding Samples With Likely Contamination by Surface Water Southland 305 3.4
(0.05-24)
0.5 (0.5-380)
3.0 (0-35)
12.4 (9.1-20.3)
6.5 (5.3-8.5)
207 (37-1141)
0.05 (0.05-
41) Bores 213 3.1
(0.1-24) 0.5
(0.5-200) 3.6
(0-35) 12.4 (9.4-20.3)
6.4 (5.5-7.9)
197.5 (51-1141)
0.1 (0.05-
41) Wells 84 4
(0.05-19)
4 (0.5-380)
2.6 (0.4-11)
12.4 (9.1-19.7)
6.5 (5.3-8.6)
223 (37-1097)
0.05 (0.05-
17) Springs 6 5.1
(3.1-14) 5.5
(1-14) _ 12.5
(10.4-16) 6.4
(6-7.1) 192.5
(160-291) 0.07
(0.05-0.4)
Excluding Samples Less Than 50 metres From A Septic Tank Disposal Field Southland 277 3.0
(0.05-24)
0.5 (0.5-
1000)
3.0 (0.3-45)
12.5 (9.1-20.3)
6.5 (5.3-8.5)
211 (37.3-1141)
0.05 (0.05-
41) Bores 181 2.8
(0.1-24) 0.5
(0.5-720) 3.6
(1.2-45) 12.5 (9.4-20.3)
6.4 (5.5-7.8)
209 (51-1141)
0.1 (0.05-
41) Table 4.2a: Distribution of Nitrate Results
NO3-N ≥ 11 gm-3
NO3-N 5 - 11 gm-3
NO3-N < 5 gm-3
No. of nitrate
samples All Samples 4% (16) 29% (101) 67% (233) 350 Bores 3% (6) 31% (73) 66% (156) 235 Wells 10% (9) 22% (23) 68% (70) 103 Springs 10% (1) 50% (5) 40% (4) 10 All samples excluding surface contamination
5% (14) 30% (91) 65% (199) 305
Bores excluding surface contamination
3% (6) 32% (69) 65% (138) 213
Bores over 50m from a septic tank field
2.8% (5) 26% (48) 71% (128) 181

Groundwater Quality in Southland: A Regional Overview 13

Groundwater Quality in Southland: A Regional Overview
14
Table 4.2b: Distribution of Faecal Coliform Results Faecal Coliform
> 20 CFU/100 ml Faecal Coliform 1 - 20 CFU/100 ml
Faecal Coliform < 1 CFU/100 ml
No. of F.C. samples
All Samples 18% (51) 23% (66) 60% (173) 290 Bores 11% (21) 13% (25) 76% (149) 195 Wells 36% (29) 40% (33) 24% (20) 82 Springs 10% (1) 80% (8) 10% (1) 10 All samples excluding surface contamination
20% (52) 21% (55) 59% (156) 263
Bores excluding surface contamination
10% (18) 11% (19) 79% (139) 176
Bores over 50m from a septic tank field
12% (18) 14% (20) 74% (109) 147
4.2 Regional Variations in Groundwater Quality
4.2.1 Location of sites The location of bores and wells sampled, and measured nitrate and faecal coliform levels are shown in Maps 1, 2 and 3 respectively. Samples suspected of being affected by localised contamination are not shown in Maps 2 and 3. The proximity to septic tank disposal areas affects nitrate levels (see Section 4.3.4) so Map 2 excludes samples within 50 metres of a septic tank discharge. Poor wellhead protection was associated with faecal coliform contamination (see Section 4.3.2), so bores and wells classified with poor head protection were excluded from Map 3. No attempt has been made to differentiate between different aquifers in the region. The sites were too widely spread to differentiate aquifers. Furthermore, samples with nitrate concentrations that exceeded the drinking water standards were widely distributed and usually not clustered, i.e. the nearest sample, to sites with nitrate-N above 10 gm-3, was on average 1.6 km away. These neighbouring samples had an average nitrate concentration of 4.3 gm-3. In contrast, the next closest site
with nitrate over 10 gm-3 was on average 5.8 km away. 4.2.2 Possible problem areas Only six sites6 the survey had nitrate levels above the drinking water standards that could not be explained by suspected local contamination. These are possibly indicative of high nitrate levels in the aquifer. The sites are located in Lochiel, Wallacetown, Waianiwa, Mataura Island, and the eastern side of Waikaka. All these sites were distant from septic tank disposal areas and had good wellhead protection. Three sites were close to other sites exhibiting moderately high nitrate concentrations; the other three sites had no other samples taken nearby. There is some evidence (from previous private samples) to suggest that nitrate in the groundwater site at Wallacetown has risen since 1989. 6Id’s, 8020402, 8011301, 8020405, 8011402, 8050301, and 7102901.

Groundwater Quality in Southland: A Regional Overview 15

Groundwater Quality in Southland: A Regional Overview
16
Map 1: Bores and Wells

Groundwater Quality in Southland: A Regional Overview 17
Map 2: Nitrate in Southland’s Groundwater

Groundwater Quality in Southland: A Regional Overview
18
Map 3: Faecal Coliforms in Southland’s Groundwater

Groundwater Quality in Southland: A Regional Overview 19
4.2.3 Comparisons with other studies Six previous studies have assessed groundwater quality in various areas of Southland. These were in the Oteramika catchment (near Edendale) (Rekker, 1995; Rekker 1998); the Waihopai catchment (Rekker, 1996); peri-urban Invercargill (Rekker, 1995); the Oreti Plains (Rekker and Greenwood, 1996); and the Central Southland Plains (Rekker & Jones, 1998). Nitrate and faecal coliform data from these studies are plotted, together with data from the current study, in Maps 4 and 5. The average nitrate concentrations determined from previous study areas are compared in Table 4.3. Higher than average nitrate concentrations are found
in intensively farmed catchments such as Waihopai, Oteramika and Oreti Plains.
The very high nitrate concentrations in the Oreti Plains has been attributed to a combination of intensive land use occurring on soils that easily crack (Pukemutu soils), allowing contaminants to directly enter the shallow water table.7 While the land use in the Oteramika catchment is more intensive than in the Oreti catchment, the soils (Edendale) are not prone to by-pass flow. The impact of intensive agriculture in the Oteramika catchment is also diluted by low nitrate water from the head of the catchment. These natural characteristics of the Oteramika catchment mitigate the effects of the intensive land use (Rekker, 1998).
Table 4.3: Comparison of Nitrate from Different Catchment Studies
Even in a single aquifer (e.g. Oreti Plains) there is a wide range of nitrate values. Often the water has less nitrate in the headwaters, where the land use is less intense.
Catchment Number of samples
Mean Nitrate-N (Min-Max) gm-3
Source
Southland 350 4.1 (0.05-24)
Average of all data from current survey
Oteramika 7 sites 10 samples
6.2 (4.4-10.2)
Rekker, 1998. All sites located on the lower end of the aquifer.
Waihopai 13 5.0 (0.7-8.8)
Rekker, 1996a
Oreti Plains 36 6.2 (0.07-18)
Rekker & Greenwood, 1996
Central Southland Plains 30 4.8 (<0.01-29)
Rekker & Jones, 1998
Peri-urban Invercargill 16 1.9 (0.04-12.1)
Rekker, 1995
7The extent of by-pass flow on the Pukemutu soils was clearly demonstrated by Rekker & Greenwood (1996). They found extremely high nitrogen isotope values that are indicative of animal waste. 8This average excludes an extreme value of 79 gm-3 NO3-N, which resulted from direct contamination of the well with effluent. If this value is included the mean is 8.2 gm-3 NO3-N. After the wellhead was protected the nitrate level in this well dropped below 30 gm-3 NO3-N. 9Six samples had high iron. When these samples were excluded the average was still <4 gm-3 NO3-N.

Groundwater Quality in Southland: A Regional Overview
20
Map 4: Nitrate in Southland’s Groundwater found in all Studies

Groundwater Quality in Southland: A Regional Overview 21
Map 5: Faecal Coliforms in Southland’s Groundwater found in all Studies

Groundwater Quality in Southland: A Regional Overview
22
4.3 Localised Impacts on Groundwater
4.3.1 Comparison between Wells and Bores There is a considerable difference in the water quality between bores, wide diameter wells and springs (see Tables 4.2a and 4.2b). Faecal contamination is much more prevalent in wide diameter wells than in bores, and iron is higher in bores10. Although many more wells exceeded the guidelines for nitrate contamination, the difference between the means was not statistically significant11 (see Fig. 4.1). Fig. 4.1: Comparison of Mean Nitrate Concentration in Bores, Wells and Springs
Faecal coliform contamination is much more common in wells than in bores (see Fig. 4.2). Bores had median and mean faecal coliform levels of < 1 CFU/100 ml and 11.8 CFU/100 ml respectively; compared to wide diameter wells that had median and mean faecal coliform levels of 4.5 CFU/100 ml and 61.2 CFU/100 ml respectively. The construction and nature of wide diameter wells means that they are generally shallower than bores and less well sealed (see Appendix 7). Poor wellhead protection allows surface water to directly enter wells and cracks in concrete casings allow lateral diffusion of near surface water into wells.
Fig. 4.2: Comparison of Mean Faecal Coliform Level in Bores, Wells and Springs
The average nitrate concentration of bores and wells were similar, although more wells exceeded the guidelines. The graph excludes sites with likely surface contamination. Error bars correspond to the 95% confidence interval.
6.5
4.53.9
0
2
4
6
8
10
12
Bores Wells Springs
Faecal contamination was more common in wells compared to bores. The graph excludes sites with likely surface contamination. Error bars correspond to the 95% confidence interval.
6.5
48
7.5
0
10
20
30
40
50
60
70
80
Bores Wells Springs
10Separate t-tests of log FC and log iron both have a probability of less than 0.001. 11There was no significant difference between nitrate in bores and wells even after accounting for proximity to septic tanks and likely surface contamination.

Groundwater Quality in Southland: A Regional Overview 23
4.3.2 Well Head Protection: Excluding likely surface contamination Field information was collected during the survey about wellhead protection and likely surface contamination. This information was used to exclude samples from the analysis where contamination was suspected due to the ingress of surface water. The assessment of head protection only filtered out sites where surface water ingress was an obvious threat; very few wells were completely sealed or fully met the criteria in Appendix 4. Bores and wells classified as having no obvious surface contamination had less faecal coliforms12, but there was no significant difference in nitrate levels. Soil filters out faecal coliforms as they travel through an aquifer, and are therefore only elevated close to their source or if the filtering is bypassed, such as water entering directly through cracks in the well casing. In contrast, nitrate travels relatively freely with groundwater and distant sources can influence groundwater quality. Also, surface water that might ingress into a well often has low nitrate concentrations compared to groundwater. 4.3.3 Well Head protection extends below the ground Wells assessed as having “good” head protection were less likely to have faecal contamination. However, even with good head protection, contamination can occur by lateral diffusion through the soil. The assessment of head protection did not consider the effectiveness of sealing around the bore or well below ground level (e.g. grouting). 12A t-test comparing log faecal coliforms in samples with and without ‘likely’ surface contamination showed t=2.015, DF = 38.6, p = 0.05. ‘p’ is the probability of finding the difference in sample means if the populations’ means are equal. The
lower the probability the more likely that the difference is real. If p is < 0.05 there is a 95% chance that the difference is real. 4.3.4 Proximity of septic tank disposal areas affect nitrate levels Nitrate levels were significantly higher (p=<0.001) when bores or wells were close to septic tank disposal areas (within 50 metres) compared to those that were most distant (over 500 metres). Bores and wells between 50 and 500 metres had intermediate levels of nitrate contamination. The trend was the same for both bores and wells (see Fig 4.3). The extent of faecal contamination in bores or wells showed no significant relation with the proximity to septic tank disposal areas. This contrasts with a previous studies of Invercargill’s peri-urban area that found more faecal coliform contamination in samples taken within 20 metres of a septic tank disposal area (Rekker, 1995b). Bacterial tracing experiments have demonstrated that bacteria are filtered out as they travel through gravel aquifers (Sinton et al, 1996). The current study also suggests that faecal bacteria are filtered as they travel though the aquifer, compared to nitrate which is almost unaffected. Faecal contamination indicates a close source in likely, or that surface water may be entering the well directly. In contrast, elevated nitrate may be dispersed in the groundwater over a long distance. This results of this survey do not imply a set distance after which septic tanks do not affect a water supply well. However, it does show that septic tanks within 50 metres of a well probably elevate the nitrate concentrations. The actual influence of a septic tank at any particular site needs to account for the direction of groundwater flow and whether a well was up-gradient or down-gradient of the septic tank. 13Proximity to septic tanks was compared using ANOVA with a post hoc Bonferroni adjustment. P

Groundwater Quality in Southland: A Regional Overview
24
was < 0.001 when comparing nitrate in samples over 500m from a septic tank disposal area with samples within 50 m. P = 0.03 when comparing
nitrate in samples greater than 500 metres with samples between 100 to 500 metres.
Fig. 4.3: The Effect of Septic Tank Disposal Fields on Nitrate Levels
4.3.5 Depth to the water table It was thought that a shallow water table might correspond with greater contamination by nitrate and faecal bacteria because there is less soil to act as a filter. However, no strong relationship with depth was apparent in this survey. The majority (three-quarters) of samples were taken from depths of less than 6 metres. It is likely that within this depth range soil type is more important than the height of the water table. Soil water is commonly more acidic near the soil surface due the leaching of carbonic acid from the root zone (Viv Smith, pers com, 1998). This survey found that nitrate was higher (greater than 1 gm-3) when pH was lower (below 6)14; suggesting that when groundwater was more strongly influenced by proximity to the soil surface, the nitrate concentration was greater than 1 gm-3.
14A correlation between nitrate and pH had a R2 of –0.39.
Bores and wells close to septic tanks have higher nitrate concentrations. Error bars correspond to the 95 % confidence interval.
2.7
4.4
4
5.1
0 1 2 3 4 5 6 7
<50 metres
50-100 metres
100-500 metres
> 500 metres
Nitrate-N (g/m3)

Groundwater Quality in Southland: A Regional Overview 25
4.3.6 Aquifer water quality vs localised impacts A conservative estimate of regional groundwater quality needs to account for the effects of localised contamination such as surface water intrusion elevating faecal coliform levels, and septic tanks elevating nitrate levels. Therefore a conservative estimate of aquifer water quality would be based on samples taken from bores, with little likelihood of surface contamination, which are over 50 metres from a septic tank disposal area. Using the above criteria, the median nitrate-N concentration in Southland is 2.8 gm-3 (average 3.7 gm-
3), and only 2.5 percent of samples are over the NZDW standard of 11.3 gm-3 NO3-N. The average faecal coliform level is 7.6 CFU/ 100 ml, and 79 percent of bores had no faecal coliforms detected.

Groundwater Quality in Southland: A Regional Overview
26
4.4 Land Use and Groundwater Quality
4.4.1 Relating groundwater quality to land use Land use and land management practices have the potential to strongly influence groundwater quality in unconfined aquifers. This survey identified the land uses of each property from which samples were taken. However, it did not account for surrounding land use that could also affect aquifer water quality. The comparison of land use that was analysed was restricted to sheep, dairy, sheep/beef, and lifestyle blocks. Too few samples (<30) were taken from properties with other land uses to make meaningful comparisons.
4.4.2 Land use differences were related to septic tank proximity Groundwater nitrate concentrations were highest below lifestyle blocks, followed by sheep-beef, sheep and dairy (see Fig. 4.4). Lifestyle blocks had significantly15 higher nitrate than dairy farms (p = 0.01) or sheep farms (p = 0.08). The differences were stronger16 when only bores are compared, but there was no significant difference when the analysis excluded samples within 50 metres of a septic tank disposal area. Bores and wells on lifestyle blocks were more likely to be located within 50 metres of a septic tank disposal area (see Fig. 4.5). Bores were more common than wells on lifestyle blocks compared to the other land uses (80% compared to 66%).
Fig. 4.4: Nitrate Concentrations under Different Land Use Types 15Based on an ANOVA with Tukey post hoc testing.
16P=0.01, 0.04, and 0.25 when comparing lifestyle blocks with dairy, sheep, and sheep-beef respectively.
Nitrate was higher in groundwater beneath lifestyle blocks because bores & wells from lifestyle blocks were more likely to be influenced by septic tanks.
Error bars correspond to the 95 % confidence interval.
0 1 2 3 4 5 6 7 8
lifestyle block
sheep
sheep-beef
dairy
Nitrate-N (g/m3)
all data
Over 50 metresfrom septic tank

Groundwater Quality in Southland: A Regional Overview 27
Fig. 4.5: The Proportion of Bores and Wells within 50 m of a Septic Tank
4.4.3 Groundwater nitrate reflects the cumulative effects of inputs Land use in most parts of Southland is relatively heterogeneous (e.g. sheep, sheep/beef and dairy farms are often in the same area); and the actions of one land manager can affect the groundwater quality for those down-gradient. Therefore, it is not surprising that this survey did not correlate land use with groundwater quality. Differences in soils, geology and aquifer flow rate (i.e. the potential attenuation capacity) would also influence (and reduce) correlate land use and groundwater quality in unconfined aquifers at a broad scale. Modelling of the Oteramika catchment (Rekker, 1998) has shown that different land use and management result in different contributions to groundwater nitrate. Irrigation of dairy effluent, forage cropping and seepage disposal of septic tanks have the largest per hectare contribution to groundwater nitrate. Intensive farming contributes more nitrates than low intensity farming, and dairy cattle more than sheep.
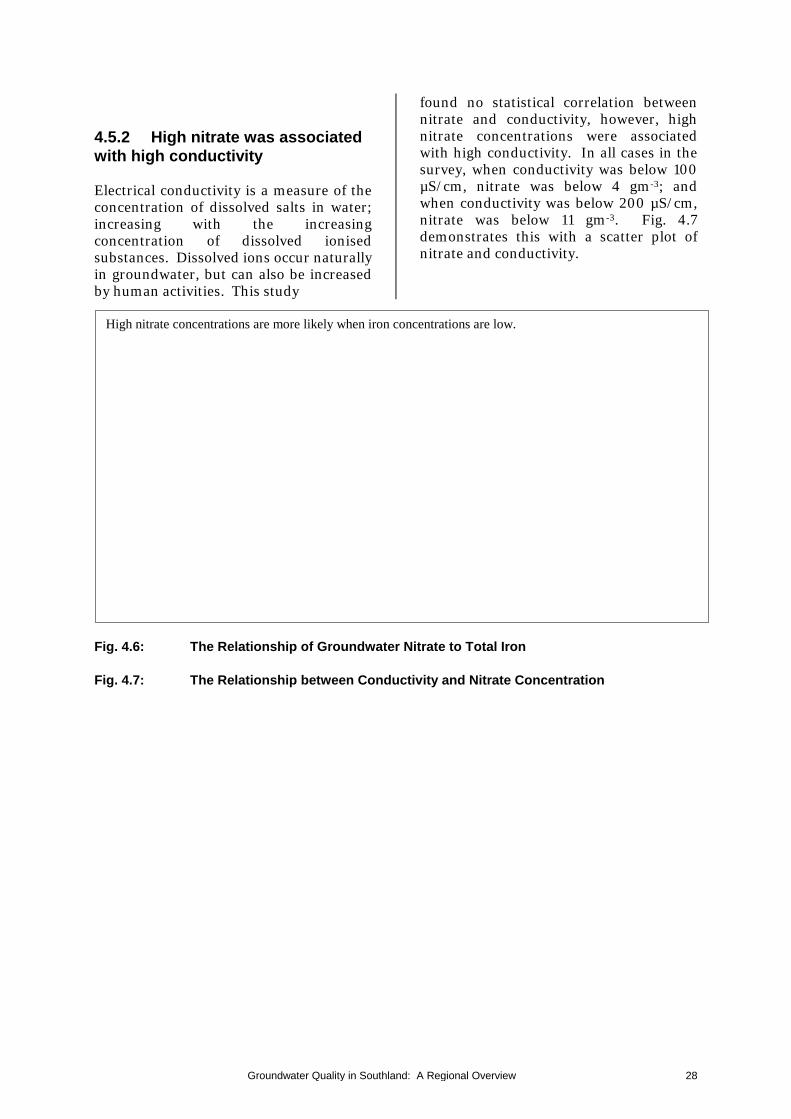
4.5 Relationships between Water Quality Parameters Correlations between measured parameters were assessed using a Pair-wise Spearman Rank correlation. The best correlations were found by using samples from bores over 50 metres away from septic tank disposal area and with “no surface contamination”. 4.5.1 Nitrate was weakly related to total iron Nitrate is more easily denitrified in the presence of iron due to the low redox state, so groundwater with high iron is often associated with low nitrate concentrations (Rekker and Jones, 1998). The survey data shows a weak inverse relationship between nitrate and total iron (R2 = -0.55). Others have found that in groundwater high concentrations of iron and nitrate tend to be mutually exclusive (John Hadfield, pers. comm. 1998). Fig. 4.6 illustrates how high nitrate concentrations become less likely as the concentration of iron in the groundwater increases.
Lifestyle blocks are more likely to have a bore or well located near a septic tank disposal area.
0% 5% 10% 15% 20% 25% 30% 35% 40% 45%
lifestyle block
sheep
sheep-beef
dairy
Percentage
Groundwater Quality in Southland: A Regional Overview
28
4.5.2 High nitrate was associated with high conductivity Electrical conductivity is a measure of the concentration of dissolved salts in water; increasing with the increasing concentration of dissolved ionised substances. Dissolved ions occur naturally in groundwater, but can also be increased by human activities. This study
found no statistical correlation between nitrate and conductivity, however, high nitrate concentrations were associated with high conductivity. In all cases in the survey, when conductivity was below 100 µS/cm, nitrate was below 4 gm-3; and when conductivity was below 200 µS/cm, nitrate was below 11 gm-3. Fig. 4.7 demonstrates this with a scatter plot of nitrate and conductivity.
Fig. 4.6: The Relationship of Groundwater Nitrate to Total Iron
Fig. 4.7: The Relationship between Conductivity and Nitrate Concentration
High nitrate concentrations are more likely when iron concentrations are low.
0
5
10
15
20
25
30
0.01 0.1 1 10 100Total Iron (g/m3)

Groundwater Quality in Southland: A Regional Overview 29
High nitrate is associated with high conductivity.
6 12 1824
NITRATE
500
1000
COND
UCTI
VITY
4
200
100

Groundwater Quality in Southland: A Regional Overview
30
5.0 Discussion: Groundwater Quality in Southland
5.1 Nitrate This snap-shot survey aimed to provide region-wide information on groundwater quality in unconfined aquifers, and to identify areas that exceed the drinking water guidelines for nitrate and faecal coliforms. Of the 350 sites surveyed, four percent exceeded the New Zealand Drinking Water Standard (NZDWS) of 11.3 gm-3 NO3-N and the median nitrate concentration was 3.2 gm-3 NO3-N. When sites with obvious localised contamination were excluded from the analysis fewer sites exceeded the NZDWS (3 percent) and the median nitrate concentration was lower (2.8 gm-3 NO3-N). Compared with the Waikato region, Southland appears to have fewer sites exceeding the NZDWS for nitrate. 9.3 percent of shallow groundwater sites with low iron monitored by Environment Waikato have nitrate concentration above the drinking water guidelines (Hadfield, per com, 1998). The sites with nitrate exceeding the standards were usually isolated rather than clustered. It is not known whether they represent localised contamination or more widespread contamination because this survey did not identify individual aquifers. This survey found no correlation between nitrate concentrations and overlying land use. However, it is clear from previous studies (e.g. Rekker, 1998, Thorrold et al, 1998) that intensive agriculture usually increases the input of nitrate to groundwater. A large number of factors influence groundwater nitrate apart from immediate land use (e.g. neighbouring land use, soil type, redox conditions), so a regional survey is not a very sensitive way to make comparison. In the Oreti Plains, soil characteristics are fundamental in promoting nitrate leaching
to the shallow water table. The Pukemutu soils of the Oreti Plains easily crack, permitting rapid infiltration to groundwater. In the Oteramika catchment, the soil retains a good structure despite the intensive land use. Furthermore, low nitrate groundwater from the Upper Oteramika catchment effectively dilutes the higher nitrate inputs occurring lower in the catchment. These two examples illustrate the spatial variability of groundwater vulnerability resulting from soil type and dilution. The study found that septic tank disposal fields significantly increased the nitrate concentrations in nearby bores. This septic tank influence was especially noticeable on lifestyle blocks, which often had their bores located close to septic tanks disposal fields. Although most people participating in this survey drank the water from their bore or well, they were often not aware (or concerned) that septic tank disposal fields can contaminate the groundwater in nearby bores. Unlike some studies, no direct association was found between nitrate and depth to the water table. However, higher nitrate was associated with low pH, and low pH is often associated with proximity to the root zone. Nitrate can be strongly stratified within an aquifer (Canter, 1997), and this phenomenon may account for the poor correlation between nitrate and depth to water table. The oxidised layer near the surface of the groundwater is typically higher in nitrate and low in dissolved iron. A similar relationship was observed in this survey, in that nitrate concentrations were generally low when iron concentrations were high.
5.2 Faecal Coliforms Faecal coliform contamination was prevalent in bores and wells sampled in

Groundwater Quality in Southland: A Regional Overview 31
this survey. Faecal coliforms were detected in 75 percent of the wells sampled and 25 percent of the bores sampled. Large diameter wells tend to have poorer head protection compared to small diameter wells (bores); they are generally shallow and are often not cased, which makes surface water intrusion more likely. Faecal coliforms are filtered out as they travel through the soil (Sinton et al, 1997). As a result, they are most likely found in wells/ bores when the faecal source is very close or they can enter the groundwater relatively directly through cracks in the soil, poor grouting, or dribbling into a well with surface water. One well sampled in the survey was located in a small gully and regularly filled with water after heavy rain; the faecal coliform counts in this well were very high. The location and design of this particular well has undoubtedly compromised the quality of the drinking water it supplied to the house. The movement of bacteria through the soil is both spatially and temporally variable. Sinton (1985) observed diurnal fluctuations in the microbial contamination of wells near septic tanks, and microbial contamination is thought to follow preferential paths (Viv Smith, pers comm.). Consequently, a single sample can not guarantee that a well is free of faecal contamination and this survey probably underestimates the extent of faecal contamination of wells in Southland. The large number of wells sampled with faecal coliform contamination is an obvious concern for public health. The USEPA has developed a strategy for assessing the vulnerability of public wells to microbial contamination (Jorgenson et al, 1998). When applied to the sites sampled in this survey most of the wells would have a high contaminant risk because they are located near potential sources; many of the aquifers would be classified as sensitive because they are shallow; and the standard of well construction would be variable. Wide diameter wells would generally have an ‘unacceptable’ standard of construction because they often have porous concrete
casings, no grouting and are seldom sealed. It would be wise to investigate the use of wellhead protection areas (WHPAs) around important water supplies in Southland. Canterbury Regional Council has delineated WHPAs based on an arbitrary fixed distance of 2 km radius up-gradient at 20 degrees to the well for the well depth less than 70 metres, and a radius of 200 metres for the well depth greater than 70 metres (in Pang et al, 1996). Around Rotorua Pang et al (1996) calculated a WHPA based on groundwater velocity and average die-off rates of microbes, they calculated protection areas between 57 metres and 1.6 kilometres to give 99.99 percent protection. Local investigations would be advisable before setting distances for WHPAs in Southland.
5.3 Planning Issues Southland Regional Council has made a commitment to maintaining good water quality in the Regional Policy Statement (RPS) (Objectives 5.1 and 5.2). However, to date only the Effluent Land Application Plan and the Solid Waste Management Plan contain specific policies and rules that ensure that the quality of groundwater is maintained and enhanced. The Solid Waste Management Plan restricts the disposal of solid waste or offal directly in any water body (including groundwater) (Rules 4.5.1, 4.5.5). Furthermore, disposal of solid waste and offal is restricted within 50 metres of any bore for potable supply (Rules 4.5.3, and 5.5.2). Offal holes are required to be located so that they do not pose a threat to groundwater (Policy 5.3.3). The Effluent Plan includes policies to: “Avoid where practicable, remedy or mitigate adverse effects on water quality, water ecosystems and water potability from effluent and sludge discharges onto or into land.” Policy 4.2.3 “Adopt a precautionary approach to the discharge of effluent and sludge onto or

Groundwater Quality in Southland: A Regional Overview
32
into land where there are uncertainties regarding adverse effects.” Policy 4.2.4 “Avoid where practicable, remedy or mitigate adverse effects to human and animal health arising from discharges of effluent and sludge onto or into land.” Policy 4.2.6 Rules in the Effluent Plan restrict the discharge of sludge, agricultural effluent and industrial trade effluent within 100 metres of any potable water abstraction point17. Similarly, new or replacement foul water systems are restricted if (among other things) the soakage field dosage pipes are within “50 metres of any potable water abstraction point” or “the infiltration surface is within 900 mm of the groundwater table at its seasonal high water level” (Rule 5.1.2). However, the distance to potable water abstraction points is not a criteria for permitting existing foul water drainage systems (Rule 5.1.1). This study has shown that a separation of 50 metres is a minimum distance if a well is to be protected from the disposal of foul water. In fact, there is some indication from this survey that restricting foul water disposal within 500 metres may be necessary to protect wells from contamination.
Discharges of sludge, effluent and foul water not only contaminate groundwater in their immediate vicinity, but can also affect ambient groundwater quality. Ambient nitrate concentrations in parts of the region are already close to the Maximum Allowable Value (MAV) and one third of the samples in the survey were over half the MAV. The Effluent Land Application Plan attempts to minimise ambient groundwater contaminants by setting maximum volumes of effluent that may be discharged per day. However, in areas where maintaining potable groundwater is most important the total loading of contaminants over the aquifer should be carefully examined. Over these aquifers, consideration should be given to setting Wellhead Protection Areas (WHPAs).
17The discharge of sludge within 100 metres of any potable water abstraction point is a non-complying activity (Rule 5.3.3), and the discharge of agricultural effluent or industrial effluent is a discretionary activity

Groundwater Quality in Southland: A Regional Overview 33
6.0 Summary
6.1 Groundwater Use and Awareness in Southland
Groundwater is the single most
important source of drinking water for rural Southland. Both this survey and an independent phone survey (Belton et al, 1998) found that over half of rural Southland use groundwater.
Southland’s groundwater is most commonly used as a source of drinking water for people and animals.
Despite the extensive use of groundwater, many people had little awareness about where their water supply came from and about the location of their well in relation to possible sources of pollution (e.g. septic tanks).
Bores were twice as common as wells in the survey. This ratio is probably representative of all of Southland.
6.2 Groundwater Quality In Southland
Unconfined groundwater in
Southland had a median groundwater nitrate concentration of 2.8 gm-3 NO3-N and an average of 3.7 gm-3 NO3-N, based on a conservative estimate that excluded sites with localised contamination.
Four percent of all samples, and only three percent of samples that were not exposed to localised contamination, exceeded the Maximum Allowable Value (MAV) for nitrate. Over 67 percent of all samples were under half the MAV.
However, long-term trends are not known.
Nitrate concentrations can vary seasonally by 2 to 3 gm-3. This means that sites with nitrate concentrations close to the guidelines may exceed the guidelines in certain months.
Faecal contamination was found in 40 percent of all the samples, but 21 percent of bore samples with good bore-head protection. This contamination suggests a potential threat to public health.
Groundwater from large diameter wells more often (10%) exceeded the nitrate MAV than from bores (3%), however, there was no significant difference in the average concentrations.
Faecal coliforms were detected in less than one quarter of bores, but were found in three-quarters of large diameter wells sampled. The average faecal coliform levels were higher in wells than in bores.
The greater proportion of wells with faecal contamination compared to bores was attributed to wells having less secure wellhead protection (e.g. less effective grouting). This allows faecal coliforms to enter the well directly through the ingress of surface water.
Bores and wells close to septic tank disposal areas (<50 m) had higher nitrate concentrations than bores or wells a long way from septic tanks (over 500 m).
The faecal coliform bacteria found in groundwater were predominantly E. coli bacteria.

Groundwater Quality in Southland: A Regional Overview
34
Lifestyle blocks had more higher nitrate concentrations than dairy or sheep farms, however, this was attributed to their septic tank disposal area was more often located close to their bore or well.
Groundwater quality management should consider the cumulative effects of land use and the local vulnerability of different soil types and hydrogeologic settings.
Further investigations should be undertaken around the sites identified with high nitrate concentrations to determine the cause and extent of the high nitrate occurrence
6.3 Lessons for Future Investigations
Using advertising to encourage
groundwater users to contact the Council was an effective way of locating bores and wells.
Contacting landowners by phone is very time consuming.
Depth is difficult to determine in bores that have good head protection i.e. are capped and sealed. This highlights the importance of obtaining information from drillers at the time a bore is drilled.
The spectrophotometer method is a cheap and relatively accurate way of measuring nitrate concentrations above 0.2 gm-3 NO3-N.

Groundwater Quality in Southland: A Regional Overview 35
7.0 Recommendations
In undertaking this region-wide survey of groundwater nitrate, the Southland Regional Council wanted to gain a better understanding of the groundwater resources in Southland. This understanding needs to be translated into action if we are to sustainably manage our groundwater resource. The following recommendations highlight action that should be taken as a result of this survey:
7.1 Education and Promotion 1. Increase the awareness of
groundwater issues in Southland and strongly promote the value and vulnerability of groundwater in Southland.
2. Encourage individuals to take
responsibility for their own groundwater management.
3. Promote Best Management
Practices to prevent contamination of wells and bores. The Council should actively promote compliance with the Codes of Practice for bore head construction.
4. Promote Best Management
Practices (BMPs) to prevent the contamination of aquifers. This may require continuing to
investigate ways to manage effluent disposal, stock and soil resources in ways that mitigate or (where possible) avoid the impact on groundwater.
5. Encourage agencies to work together
in implementing BMPs.
7.2 Information 6. Continue projects that identify
soils vulnerable to nitrate leaching.
7. Continue with implementing a
regional groundwater quality monitoring network.
8. Investigate areas where nitrate
concentrations exceeded the New Zealand Drinking Water Standard.
7.3 Management
9. Promote wellhead protection areas around important water supply bores and aquifers in Southland.
10. Investigate options for the Certification of Drillers.

Groundwater Quality in Southland: A Regional Overview
36
References
Belton D, Ryan T, Graeme I, Cameron C, and Dauganzich D (1998) A National Survey of Stock Drinking Water Prepared for the Ministry for the Environment. Draft report.
Canter, L W (1997) Nitrates in Groundwater Lewis Publishers, CRC Press, USA. 262 p.
Jorgenson D., Wireman M. & Olson D (1998). Assessing the vulnerability of public water supply wells to microbial contamination. EPA update, GWMR, Spring 1998.
Pang L., Close M. and Sinton L (1996). Protection zones of the major water supply springs in the Rotorua district. ESR Environmental, Report No. CSC96/7. 77p
Rekker J (1998) Oteramika Trial Catchment Groundwater Studies. Studies into Non-point Source Groundwater Effects in Southland. Prepared for Southland Regional Council by AquaFirma Limited. 77 p.
Rekker J. (1997a). Southland streamflow – baseflow separation; hydrological studies into the groundwater contribution to streams and rivers in Southland. Prepared for Southland Regional Council by AquaFirma Limited, June 1997. 48p.
Rekker, J. (1997). Southland region groundwater nitrate snap-shot survey: Terms of reference and protocols. Prepared for Southland Regional Council by AquaFirma Limited, July 1997. File RM 25/2
Rekker J (1996a) Waihopai River Catchment Groundwater Study; Investigations and Review of the Weathered Gravel Unconfined and Lignite Measure Confined Aquifers. Prepared for Southland Regional Council by AquaFirma Limited, June 1996. 7-2 p
Rekker J (1996b) Special Report on the
Oreti Plains High Groundwater Nitrate Zone. Prepared for Southland Regional Council by AquaFirma Limited, May 1996. 3 p.
Rekker J (1995a) Edendale Aquifer Characterisation Study. Prepared for Southland Regional Council by AquaFirma Limited, June 1995. 32 p
Rekker J (1995b) Groundwater Study of the Peripheral Urban Invercargill Area. Prepared for Southland Regional Council by AquaFirma Limited, November 1995. 20 p.
Rekker J (1994) Southland Region Groundwater Resource Scoping Study. Prepared for Southland Regional Council by AquaFirma Limited, 9-6 p.
Rekker J and Greenwood P (1996) Oreti Plains High Groundwater Nitrate Zone Investigation; Hydrological, Isotope, Soil and Modelling Studies Report. Prepared for Southland Regional Council by AquaFirma Limited, August 1996. 7-5 p.
Rekker J and Jones A (1998) Central Southland Plains Groundwater Study; Results from Field Surveys and Assessment. Prepared for Southland Regional Council by AquaFirma Limited, March 1998.
Sinton, LW. (1985). Microbial contamination of alluvial gravel aquifers by septic tank effluent. Water, Air, and Soil Pollution 28: 407-425
Sinton L W, Finlay R K, Pang L and Scott D M (1997). Transport of Bacteria and Bacteriophages in Irrigation Effluent into and through an Alluvial Gravel Aquifer. Water, Air, and Pollution 98: 17-42.
TELAC. Precision and limits of detection for analytical methods. TELAC technical guide No. 5.

Groundwater Quality in Southland: A Regional Overview 37
Thorrold B, Rodda H and Monaghan R (1998). Modelling Land Use and Water Quality in the Oteramika Catchment. Report on the Oteramika Trial Catchment project.
Works Consultancy (1993). Waiau River Valley Groundwater Monitoring

Groundwater Quality in Southland: A Regional Overview
38
Appendix 1 – Advertising Material Promoting the Groundwater Survey

Groundwater Quality in Southland: A Regional Overview 39
Appendix 2 – Field Sheet used with Samples Collection

Groundwater Quality in Southland: A Regional Overview
40
Appendix 3 – Anecdotal Information on Groundwater Collected by Natalie Henderson Waimea Plains Between Lumsden and Balfour there is a
rural water scheme and not many people have bores that are used in the area although they do have to provide water for their homes. The scheme is for the watering of stock and irrigation.
The groundwater in the Ardlussa area is
said by the locals to move up and down with the level of the Mataura River. This happens at bores that are more than 1 kilometre from the river.
There are natural springs also in the
Riversdale/Ardlussa area that comes from a place locally known as the terrace. Apparently, this water is used for domestic purposes and is of good quality.
The water table in the Riversdale area is
said to be very shallow. Locals talk of digging two feet under the topsoil and hitting water that seeps in and fills the hole. At one particular place visited, the farmer said there was 8 inches of soil, then a few inches of clay and then into the gravel aquifers.
Wyndham In the Wyndham area it is known locally
that lignite is found at very shallow depths. In some places, (particularly in Coal Pit Road) the lignite can be seen on top of the ground. Much of the groundwater in the area comes from above this lignite band. Some farmers drill through this band of lignite to get to the confined aquifers but generally, as the depth of the lignite band isn’t known in a lot of places, the unconfined aquifer is used. One bore was drilled to a depth of 115 m to get through to the confined aquifer.
Oreti In the Orion Road East area, there are
very few bores as the iron content of the water is very high and the water unpalatable. Many people either don’t have a bore or if they do, only use it for watering the garden. The majority of landowners use a rain water supply.
In Orion Road West, the Branxholme
pipe goes through the middle of the landowner’s property. This pipe is used to transport the Invercargill town supply. The rural landowners whose property this pipe goes through have access to a limited supply of water per year. After they’ve used their quota, it is then metered. Most people in this area use a rain water for both stock and domestic supply and when that runs out, they use the town supply as backup.
At Flora Road just South of Orion Road,
a lot more people have bores on their property. A few use it as drinking water but the high iron content makes the water relatively unpalatable.
Waiau On the east side of the Waiau River, very
few farmers have bores or wells. One farmer said that he used a domestic supply well for 15 years on his property approximately 1.5 km from the Waiau River. Soon after the weir was built at Mararoa (Manapouri Lake Control) his well dried up. The domestic supply now comes from a natural spring. There are reports on groundwater monitoring undertaken in the area. (See Waiau River Valley Groundwater Monitoring Reports March, July, September and December, 1993.

Groundwater Quality in Southland: A Regional Overview 41
Appendix 4 – Code of Practice for Bore Head Protection Copied from the building consent application supplement for private water supplies, Southland District Council. The supplement applies to proposed households intending to use water for human consumption, food preparation, utensil washing or oral hygiene, from a source other than a Southland District Council reticulated town water supply. The New Zealand Building Code states that houses must have a potable water supply for the uses listed above, and so the Southland District Council will only approve a private water supply system if it is satisfied that the supply will be potable.

Groundwater Quality in Southland: A Regional Overview
41
Appendix 5 – Comparison of Nitrate Methods Comparison of the Spectrophotometer Method and the Cadmium Reduction Method
Site id Sample ID NO3 spec gm-3
NO3 cad gm-3
difference % difference
8012702 98/214 8.2 8.10 -0.1 -1.2% 8012701 98/213 4.4 4.20 -0.2 -4.8% 7111805 97/2270 3.6 3.60 0.0 0.0% 7111801 97/2261 2.6 2.40 -0.2 8.3% 8012704 98/216 2.2 2.20 0.0 .0% 7111802 97/2262 2.0 2.10 0.1 .8% 7111803 97/2263 1.0 0.78 8012703 98/215 0.6 0.56 Average 3.1 2.99 -0.07 1.6%
The spectrophotometer method compared well the cadmium reduction method, the means of the two methods differed by 0.08 gm-3, and the average absolute difference was 3.2 percent.
In contrast, the nitrate meter gave measurements on average 11.5 percent lower than the spectrophotometer method.

Groundwater Quality in Southland: A Regional Overview 42
Appendix 6 – Sampling for Seasonal Changes in Groundwater Nitrate Seasonal Variations In Groundwater Nitrate During The Snap-Shot Survey (gm-
3 NO3-N)
Site id Catchment Dec-97 Jan-98 Feb-98 Mar-98 May-98
7112601 Mataura 3.1 4.2 5.1 4.8 3.5 7111201 Oreti 3.8 5.8 6.2 5.8 6.1 7110301 Upper Oreti 4.4 5.0 4.7 4.8 5.8 7111906 Upper Oreti 2.0 2.8 2.8 2.7 5.0 7111102 Waimatuku 1.0 1.2 1.2 1.2 1.1 7112703 Waimea Plains 2.2 3.4 2.9 3.0 3.0 Average 2.8 3.7 3.8 3.7 4.1
Percentage Difference Each Month In Groundwater Nitrate Nitrogen
Site id Catchment Dec-97 Jan-98 Feb-98 Mar-98 May-98
7112601 Mataura 0.0 35.5% 21.4% -5.9% -27.1% 7111201 Oreti 0.0 52.6% 6.9% -6.5% 5.2% 7110301 Upper Oreti 0.0 13.6% -6.0% 2.1% 20.8% 7111906 Upper Oreti 0.0 40.0% 0.0% -3.6% 85.2% 7111102 Waimatuku 0.0 20.0% 0.0% 0.0% -8.3% 7112703 Waimea Plains 0.0 54.5% -14.7% 3.4% 0.0% Average 0.0 36% 1.3% - 1.7% 12.6%
Peak nitrate concentrations were found in January (one site), February (two sites) and May (two sites). There was a large increase in nitrate concentrations between December and January with, on average, 39 percent more nitrate in January compared to December. This is could be due to a large rain event before sampling in early January. It is common for nitrate to pulse into the groundwater with heavy rain and concentrations in unconfined groundwater to be highest when the water table is highest (i.e. in spring or after heavy rain events).
Groundwater nitrate concentrations respond to nitrate inputs to the land, plant uptake, microbial processes and the amount of rain. It is common to find groundwater nitrate higher in the autumn. Another bore in the Oreti Plains was also monitored (id=7120806). This bore was excluded from the seasonal monitoring after large numbers of faecal coliforms were detected, which cast doubt on the effectiveness of the head protection. The results of monitoring this bore for December, January, February and March were 6.6, 8.6, 7.0 and 7.6 gm-3 respectively.

Groundwater Quality in Southland: A Regional Overview
43
Appendix 7 - Comments on the History of Bore and Well Construction in Southland by Jens Rekker (1998) There is no single determiner as to the choice of a bore or a well for drawing unconfined groundwater. All confined groundwater is drawn through bores. Wells always tap the shallowest lead of groundwater and do not commonly extend beyond. Earlier this century, the preferred means of obtaining groundwater used shallow wells. The probable maximum feasible depth for a well is 15 metres. In situations where the unconfined water table lay deeper than 7 to 8 metres a well was dug about 10 metres and a bore was sunk through the floor of the well. A centrifugal pump can not feasibly operate deeper than 7 to 8 metres while having the intake in the well and the scroll-case at the surface. Therefore, digging a well before sinking the bore allowed the bore to tap the deep water table and the centrifugal pump to be placed closer to the water table. Tube bores could be installed as a “Do it Yourself” (DIY) job with a fence post driver. Following the Second World War, mobile boring rigs became popular and an economic proposition for the typical sheep or dairy farm. A huge number of 2½ to 3 inch diameter mild steel cased bores with centrifugal pumps or rod pumps were installed in the 1950s to the 1970s. Many such bores still exist.
During the 1980s, earthwork contractors switched to hydraulic excavators (backhoes) and well digging, previously by hand, was mechanised. Bore drilling innovated in the 1980’s and 4-inch bores fitted with submersible pumps became the norm where the water table lay beyond 6 metres. Wells can now be constructed as a DIY job, or contractors can undertake the installation. The vast majority of drilling contractor jobs are for bores, while wells tend to be dug by farmers themselves. Wells are therefore cheaper and favoured for low yield house and sheep-farm stock water applications. The majority of dairy farm groundwater supplies from shallow, unconfined aquifers are from bores. Wells are likely to have more surface influences because amateurs often construct them and because the principal method of excavation involves removing and backfilling the material surrounding the well screen and casing. The back-fill contains soil and the material around the wellhead is fundamentally disturbed. By contrast, the steel casing of the bore is hammered down through the ground with soil and gravel pressed against its sides. The volume of disturbed material is very small. Bores also tend to be deeper and tap a discrete layer in the alluvium.

Groundwater Quality in Southland: A Regional Overview 44
Appendix 8 – Raw Data from the Snap-Shot Survey

Groundwater Quality in Southland: A Regional Overview
50
Glossary and Abbreviations
ANOVA Analysis of Variance. This is a statistical test that can compare the means of two or more populations. A post hoc test is done to determine which means differ from another. There are different procedures for doing a post hoc test; a Bonferroni pair-wise procedures is generally more sensitive when there are a small number of groups, and the Tukey method is often used when there are a large number of groups.
Aquifer A zone or stratum of geologic material which has appreciable quantities of groundwater in its saturated zone.
Bore Bores are holes drilled in the ground, usually to tap a source of groundwater or mineral. For this report bores are defined as being drilled and having narrow diameter, usually less than five inches.
Confined aquifer A confined aquifer is bounded both above and below the saturated zone by less permeable or impermeable material. Confined aquifer are fully saturated and pressurised.
EC Electrical conductivity is an indirect measure of the concentration of dissolved salts in water. Solutions of inorganic compounds are good conductors, but organic compounds that do not dissociate and are poor conductors. EC is measured in µS/cm (micro siemens per centimetre).
Error bars Error bars indicate the extent to which an average is uncertain. In this report they correspond to the 95% confidence interval, ie. there is a 95% chance that the real mean is located within the extent of the error bar.
FC Faecal coliform bacteria are an indicator of microbial contamination. Measured in Colony Forming Units (CFU) per 100ml.
gm-3 Grams per cubic metre. This is a unit of concentration.
Median The middle point of the data. Half the data is above the median and half is below the median.
MAV Maximum Allowable Value. This corresponds to the NZDWS, which are 11.3 gm-3 NO3-N and less than 1 faecal coliform per 100 ml.
Nitrite Nitrite is a reduced form of nitrate. Nitrate can cause methemoblobinemia when it is converted to nitrite in the stomach.
NO3-N Nitrate nitrogen. This is nitrogen in the form of nitrate. Ingesting excessive nitrate or nitrite can cause health problems in humans and animals. Babies are particularly susceptible and may develop methemoglobinemia (“blue baby syndrome”).
NZDWS New Zealand Drinking Water Standards.
p The p-value is the probability of finding a difference in sample means if the population’s means are equal.
Significant difference A statistically significant difference is inferred if a test’s p-value is less than a nominated significance level. In this report a 5 % significance level was chosen. This corresponds to a 95% confidence interval and means that there is a 95% chance that the difference between two means are real (i.e. do not occur by chance).
Unconfined aquifer An aquifer where the upper surface is not confined by a less permeable layer. Unconfined aquifers are open to percolation from the soil surface.
Well Wells are holes dug into the ground to tap and extract a source of

Groundwater Quality in Southland: A Regional Overview 51
Photographs by Natalie Henderson
Top left: An example of an adequately protected wellhead. The bore is sealed and concrete collar allows water to run away from the wellhead.
Top right: Wells located on slopes or in gullies are more likely to allow surface water run off to enter them. Faecal indicator bacteria were found in this well.
Bottom right: This bore head is covered and was sealed but stock have access around it. A fence around the site would better protect the groundwater quality.
Bottom left: Grass around this well head has been sprayed with herbicide, which could enter the groundwater.
groundwater. For this report wells are defined as being dug and having a wide
diameter.