Embed Size (px)
Citation preview
ORIGINAL ARTICLE
Groundwater quality and its suitability for drinkingand irrigational use in the Southern Tiruchirappalli district,Tamil Nadu, India
S. Selvakumar • K. Ramkumar • N. Chandrasekar •
N. S. Magesh • S. Kaliraj
Received: 31 May 2014 / Accepted: 16 November 2014 / Published online: 10 December 2014
� The Author(s) 2014. This article is published with open access at Springerlink.com
Abstract A total of 20 groundwater samples were col-
lected from both dug and bore wells of southern Tiruchi-
rappalli district and analyzed for various hydrogeochemical
parameters. The analyzed physicochemical parameters
such as pH, electrical conductivity, total dissolved solids,
calcium, magnesium, sodium, potassium, bicarbonate,
carbonate, sulfate, chloride, nitrate, and fluoride are used to
characterize the groundwater quality and its suitability for
drinking and irrigational uses. The results of the chemical
analysis indicates that the groundwater in the study area is
slightly alkaline and mainly contains Na?, Ca2?, and Mg2?
cations as well as HCO32-, Cl-, SO4
2-and NO3- anions.
The total dissolved solids mainly depend on the concen-
tration of major ions such as Ca, Mg, Na, K, HCO3, Cl, and
SO4. Based on TDS, 55 % of the samples are suitable for
drinking and rest of the samples are unsuitable for drinking.
The total hardness indicates that majority of the ground-
water samples are found within the permissible limit of
WHO. The dominant hydrochemical facies for
groundwater are Ca–Mg–Cl, Ca–HCO3, and Ca–Cl type.
The USSL graphical geochemical representation of
groundwater quality suggests that majority of the water
samples belongs to high medium salinity with low alkali
hazards. The Gibb’s plot indicates that the groundwater
chemistry of the study area is mainly controlled by evap-
oration and rock–water interaction. Spearman’s correlation
and factor analysis were used to distinguish the statistical
relation between different ions and contamination source in
the study area.
Keywords Groundwater hydrochemistry � Qualityassessment � Correlation analysis � Factor analysis � India
Introduction
Groundwater has become the most important source of
water used for domestic, industrial, and agricultural sectors
of many countries. In India, most of the population (85 %)
resides in rural areas and they depend mostly on ground-
water resources for their daily needs. In which, approxi-
mately 50–80 % of the irrigated land is under groundwater
consumption (Raju 1998). The rapid industrialization and
expansion of cities impose a high pressure on water
resources including groundwater which often results in
their depletion and contamination. The quality of ground-
water depends on various chemical constituents and their
concentration is mostly derived from the geological data of
the particular region. Generally, the quality of groundwater
depends on the composition of recharge water, the inter-
action between the water and the soil, the soil–gas inter-
action, the rock with which it comes into contact in the
unsaturated zone, the residence time, and reactions that
take place within the aquifer (Freeze and Cherry 1979;
S. Selvakumar (&) � N. Chandrasekar �N. S. Magesh � S. KalirajCentre for Geotechnology, Manonmaniam Sundaranar
University, Tirunelveli 627 012, India
e-mail: [email protected]
N. Chandrasekar
e-mail: [email protected]
N. S. Magesh
e-mail: [email protected]
S. Kaliraj
e-mail: [email protected]
K. Ramkumar
Department of Civil Engineering, Roever college of Engineering
and Technology, Perambalur 621 212, India
e-mail: [email protected]
123
Appl Water Sci (2017) 7:411–420
DOI 10.1007/s13201-014-0256-9

Hem 1989). Groundwater quality in a region is largely
determined by both natural processes (dissolution and
precipitation of minerals, groundwater velocity, quality of
recharge water, and interaction with other types of water
aquifer) and anthropogenic activities (Andrade et al. 2008).
The natural chemical quality of groundwater is generally
good, but elevated concentrations of a number of constit-
uents can cause problems for water use. The geochemistry
of groundwater data gives crucial evidence to the geologic
history of rocks and indications of groundwater recharge,
movement, and storage (Walton 1970).
The natural chemical quality of groundwater depends on
geological as well as geographical arrangement in the
region (Chandrasekar et al. 2013). Hydrochemical evalua-
tions of groundwater flow systems are generally based on
the availability of information on groundwater chemistry
(Shuxian 2013). The intensive use of natural resources and
production of wastes in modern society often cause a threat
to groundwater quality that have resulted in many incidents
of groundwater contamination. Such contamination can be
statistically interpreted and it is very useful due to its rel-
ative importance in evaluating the combination of large
chemical variable dataset. In the last decades, methods
such as hierarchical cluster analysis (HCA), discriminant
analysis (DA), correlation analysis, and principal compo-
nent analysis (PCA) have become accepted in identifying
variations and sources of groundwater pollution (Zhang
et al. 2012; Gordana et al. 2014). Principal component
analysis (PCA) and Spearman’s correlation matrix have
been frequently applied to analyze the pollution parameters
in groundwater (Selvakumar et al. 2014). The PCA analysis
is an effective tool in exploratory data analysis to probe
with the spatial controlling processes (Subba Rao. 2014). In
fact, industrial waste and other municipal solid waste have
emerged as one of the leading cause of pollution of surface
and groundwater. Human-induced activities can modify the
natural source of contaminants and also initiate pollution
load in the receiving water bodies (Whittemore et al. 1989).
The surface as well as groundwater quality induces envi-
ronmental degradation over long period of time because of
discharge of highly contaminated effluent accelerated by
overexploitation of existing water resources (Carneiro et al.
2010). During infiltration, recharged water interacts with
soils, weathered materials, and fractured rocks and carries
pollutants released from the land use activities; these pol-
lutants are dissolved depending upon their solubility in the
water, before reaching the groundwater body (Subba Rao
2014). The deterioration of groundwater quality affects its
usage for drinking, agriculture, and industrial activities
(Brindha and Elango 2012). About 80 % of the diseases in
the world and one-third of the deaths in the developing
countries are caused by the drinking of contaminated water
(WHO 2004).
In developing countries like India, around 80 % of all
diseases are directly related to poor drinking water quality
and polluted conditions (Olajire and Imeokparia 2001). The
principals governing the chemical characteristics of
groundwater were well documented in many parts of the
world. In order to understand the pollution trends and
impacts on aquifers, it is essential to have knowledge of the
natural baseline quality so that imposed environmental
change can be measured with an acceptable degree of
confidence (Edmunds et al. 2003).
Various researchers (Muthukumar et al. 2011; Jameel
et al. 2004) have characterized the geochemistry of
groundwater in Tiruchirapalli district. However, a detailed
geochemical and groundwater quality study on the Thir-
uverambur and Thuvakudi taluks has not been reported so
far. So it is essential to have an idea about the quality of the
existing water resource, which will aid in the rapacious
usage in future. Such study will highlight the nature of
groundwater with respect to natural and other anthropo-
genic effects.
The aim of the present study is to assess the hydro-
chemistry and groundwater quality for drinking and irri-
gation usage from Thiruverambur to Thuvakudi taluks
located in Trichirappalli District, Tamil Nadu, where the
groundwater is a prime source for drinking and irrigation
due to non-availability of surface water supply in time.
Study area
Tiruchirappalli is situated on the banks of the river Cauvery
and it is centrally located in Tamilnadu with an area of
11,098 km2. The area chosen for the present study (Thir-
uverambur and Thuvakudi taluks) is located in the southern
part of the Tiruchirappalli district with the geographic
coordinates of 10�750–10�780N and 78�770–78�830E. Thenortheastern part of the Tiruchirapalli district is occupied
by alluvium of the river Cauvery while the residual hills are
seen in the northeastern part of the city. The location map
of the study area map is presented in Fig. 1. The area
receives rainfall mostly from the northeast monsoon with
an average of about 880.52 mm (CGWB 2008). The major
soil types in the district are black cotton soils, red sandy to
loamy soils, and alluvial soils. A thin layer of red sandy
soils overlies the western and southern parts of the district.
The study area is geologically composed of granite gneis-
ses and charnockites of archean and precambrian age with
weathered nature of the terrain. Groundwater generally
occurs under phreatic conditions in the weathered mantle
and under semi-confined conditions in the fissure and
fracture zones at deeper levels. The depth of water level
during pre-monsoon and post-monsoon varied from 2 to
10 m and 1.5 to 15.5 m below ground level, respectively.
412 Appl Water Sci (2017) 7:411–420
123

The yield of the wells at the time of drilling and devel-
opment ranged from less than 1–20 lps. The transmissivity
(T) of the wells varied from 32 to 782 m2/day. Hydraulic
conductivity varied from 2 to 66 m/day and storativity of
the aquifer in the range of 1.6 9 10-4–9.6 9 10-4. The
thickness of weathered zone in the district ranges from 2 to
25 m. Most of the area is under cultivation, especially for
raising dry crops and limited paddy cultivation. The source
of irrigation and their distribution is very much limited due
to unavailability of water resources.
Materials and methods
A total of 20 groundwater samples have been collected
from dug and bore wells during March 2013 and analyzed
to understand the physicochemical variations of water
quality parameters using standard methods (APHA 1995).
Samples were collected in one liter capacity high density
polyethylene (HDPE) bottles. Prior to collection, the bot-
tles were thoroughly washed with dilute HNO3 acid, and
then with distilled water in the laboratory before sample
filling. Each bottle was rinsed to avoid any possible
contamination in bottling and every other precautionary
measure was taken. Each groundwater sample was ana-
lyzed for pH, electrical conductivity (EC), major cations
and anions. The pH, electrical conductivity (EC), and total
dissolved solids (TDS) were measured in situ using
HANNA portable water quality meter (HI-9828, USA).
The total hardness (TH) and calcium were estimated by
titrimetric method using EDTA and magnesium concen-
tration was estimated by the difference in the hardness and
calcium. Total alkalinity, bicarbonate, and chloride were
estimated by titrimetric methods. The concentrations of
sodium and potassium were estimated by flame photometer
(DEEP VISION, Model-381). The sulfate and nitrate ions
were analyzed by the UV-Visible Spectrophotometer.
Fluoride was estimated by using an ion-selective electrode
(ISE) with a pH/ISE meter. Statistical analysis such as
correlation matrix and factor analysis was performed using
the IBM SPSS Statistics. Major hydrochemical facies were
identified through Piper trilinear diagram (Piper 1944)
using Aquachem Scientific v4.0 software. US Salinity
diagram was carried out to recognize the various hydrog-
eochemical types in the groundwater and its suitability for
irrigation purposes.
Fig. 1 Location map of the study area
Appl Water Sci (2017) 7:411–420 413
123

Results and discussion
The descriptive statistics of the physicochemical parame-
ters of the analytical data and the permissible limits of
various organizations such as World Health Organization
(WHO), Indian Standard Institution (ISI), and Bureau of
Indian Standards (BIS) are presented in Table 1.
Suitability of groundwater
Drinking water
The pH in the study area ranges from 6.83 to 8.04 with an
average value of 7.41. This shows that the groundwater in
the study area is slightly alkaline in nature and found
within the maximum permissible limits of WHO standards.
The EC values range from 542 to 3,606 lS/cm with an
average value of 1,534 lS/cm. The TDS values vary
between 347 to 2,308 mg/l with an average value of
983 mg/l; for drinking purpose the maximum allowable
TDS guideline value prescribed by the WHO (2004) is
1,000 mg/l. The presence of TDS above this limit in
groundwater would cause undesirable taste, gastrointestinal
irritation. In the study area, nine samples (1, 5, 6, 7, 8, 9,
10, 12, 18) possess TDS value above the WHO guideline
value, which is not suitable for drinking purpose and other
eleven samples (2, 3, 4, 11, 13, 14, 15, 16, 17, 19, 20) are
suitable for drinking. The high TDS value marked at sta-
tion 12, located in the agricultural land, may be due to the
percolation of channel water containing fertilizers, solid,
and agricultural wastes. The large variation in TDS is
mainly attributed to anthropogenic activities and geo-
chemical processes prevailing in the region. The total
alkalinity value ranges from 222 to 594 mg/l with an
average value of 379 mg/l. According to Indian Standards
(BIS 10500: 1991) all the water samples are under per-
missible limit (600 mg/l). Higher value of alkalinity in the
study area is due to the concentration of leaching process
through surface water during rainy season.
The concentration of calcium ranges from 30 to 205 mg/
l with an average value of 87.3 mg/l and magnesium ranges
from 21 to 199 mg/l with an average value of 61.1 mg/l.
According to WHO (2004), almost all the water samples
are within the permissible limit. Based on the total hard-
ness all the water samples are found within the permissible
limit (500 mg/l), except sample 12 which exceeded the
permissible limit (665.1 mg/l) due to contamination of
large quantities of sewage, detergents, and solid wastes.
The sodium ion concentration varies from 12 to 221 mg/l
with an average value of 112.9 mg/l. The sodium values
exceed the desirable limit of WHO which is 200 mg/l. All
the groundwater samples except sample number 12 in the
study area are within the permissible limit and are suitable
for drinking. Sodium is found in association with high
concentration of chloride resulting in salinity. Sodium
concentrations are also influenced by the cation exchange
mechanism. The potassium concentration varies between 9
and 90 mg/l with an average value of 40.1 mg/l. High
concentration of potassium is due to the effect of fertilizers
and other industrial activities located near the site.
The bicarbonate values range from 93 to 298 mg/l with
an average value of 192.2 mg/l. The chloride concentration
ranges from 26 to 1,010 mg/l and with an average value of
222.8 mg/l. Chlorides are one of the major inorganic
anions present in natural water. Chloride may be accu-
mulated from agricultural activities, domestic sewage, and
chloride-rich minerals or rocks. High concentration of
chloride is considered to be the indicator of pollution by
Table 1 Drinking water standard specifications and statistical information of ionic concentrations
Parameters (mg/l) Minimum Maximum Mean WHO 2004 ISI 1983 BIS 1991
pH 6.83 8.04 7.41 6.5–8.5 6.5–9.2 6.5–8.5
EC (lS/cm) 542 3,606 1,535.9 1,500 – –
TDS (mg/l) 347 2,308 983.1 1,000 1,500 2,000
Ca (mg/l) 30 205 87.3 200 200 200
Mg (mg/l) 21 199 61.1 150 100 100
TH (mg/l) 84.8 665.1 234.5 500 600 600
Na (mg/l) 12 221 112.9 200 – 150
K (mg/l) 9 90 40.1 12 – –
HCO3 (mg/l) 93 298 192.2 500 – 400
Cl (mg/l) 26 1,010 222.8 600 1,000 1,000
SO4 (mg/l) 4 128 45.4 250 400 400
NO3 (mg/l) 1 26 10.9 45 45 45
F (mg/l) 0.2 0.9 0.65 1.5 1.5 1.5
WHO World Health Organization, ISI Indian Standard Institution, BIS Bureau Indian Standards
414 Appl Water Sci (2017) 7:411–420
123

high organic wastes of animal or industrial origin. The
chloride ion concentration in groundwater of the study area
exceeds the permissible limit of 600 mg/l in one location.
The concentration of sulfate and nitrate ranges from 4 to
128 mg/l with an average value of 45.4 mg/l, and 1 to
26 mg/l with a mean value of 10.9 mg/l, respectively.
These sulfate and nitrate concentration of the study area is
within the permissible limit in all the sample locations.
Fluoride is one of the main pollutants in groundwater,
which generally occurs as a natural constituent. Bedrock
containing fluoride minerals are generally responsible for
high concentration of this ion in groundwater. The con-
centration of fluoride in groundwater varies from 0.2 to
0.9 mg/l with an average value of 0.65 mg/l. The ground-
water samples in the study area are found within the per-
missible limit of WHO (1.5 mg/l).
Groundwater quality classification
Hydrochemical facies
The geochemical evolution of groundwater can be under-
stood by plotting the concentrations of major cations and
anions in the Piper (1944) trilinear diagram. Aquachem
Scientific software version 4.0 was used to construct this
diagram. The geochemical evolution/hydrochemistry of
groundwater in the study area was evaluated using the
concentrations of major cations (Ca2?, Mg2?, Na? and K?)
and anions (HCO3-, SO4
2-, and Cl-) in meq/l. This dia-
gram reveals similarities and differences among water
samples because those with similar qualities will tend to
plot together as groups (Todd 2001). The plot shows that
most of the groundwater samples (70 %) fall in the field of
mixed Ca–Mg–Cl type of water, 25 % of the samples fall in
Ca–HCO3 type, and remaining 5 % of the sample fall in
Ca–Cl facies (Fig. 2). In the anions triangle, 60 % of the
samples fall in chloride type, 25 % in bicarbonate type, and
15 % in no dominant type. It reveals that 60 % of the water
samples are salty in nature.
Mechanism controlling the groundwater chemistry
Gibbs (1970) established the mechanism controlling the
chemical composition of groundwater to find out a close
relationship between chemical composition of water and
aquifer lithological characteristics. In this diagram, three
distinct fields are recognized such as evaporation domi-
nance (rate of evaporation), rainfall dominance (chemistry
of the precipitated water), and rock–water interaction on
water chemistry. Gibbs plots were created from ratio I (for
anion) Cl/(Cl?HCO3) and ratio II (for cation) Na/(Na?Ca)
of the groundwater samples which are plotted separately
against the respective values of TDS. Figure 3 indicates that
most of the groundwater samples fall under evaporation
dominance zone and few samples are placed under rock
dominance zone. Evaporation process is not only a common
phenomenon in surface water but also in groundwater sys-
tem (Jankowski and Acworth 1997). The result reveals that
evaporation is the dominant process due to dry and arid
condition prevailing throughout the region. However, few
samples fall under the rock dominance zone indicating the
dissolution of silicate bearing rocks with groundwater.
Correlation analysis
‘Correlation coefficient is a generally used evaluation to
establish the relationship between two variables. Correlation
between major ions was carried out by using Spearman’s
correlation matrix. Table 2 shows the correlation coefficients
between the major ions in the study area. Based on the
spearman’s correlation, significant and high positive correla-
tion (r C 0.7) have been obtained for Ca2?, Mg2?, Na?, K?,
and Cl-, and SO42- with TDS. The strong significant corre-
lation ofMg2? ion with Cl- (r = 0.900) and Na?with NO3-
(r = 0.913) reflects that the groundwater in the area has been
contaminated due to application of excess amount of fertilizer,
over exploitation, and anthropogenic activities. The variation
of these relationships may indicate the complexity of the
hydrochemical components of groundwater where natural
water always contains dissolved and suspended substances of
mineral origin (Elkrail and Obied 2012). The major source of
Mg2? and Na? in the groundwater was ion exchange of
minerals between rocks and water. TheNO3- ion was strongly
correlated with Ca2? (r = 0.743), Cl- (r = 0.767), and K?
(r = 0.723), it indicates a possibility of contamination from
fertilizers, municipal wastewaters, septic systems, and
sometimes the cultivation of grasslands.
Principal component analysis (PCA)
Principal component analysis is a statistical method
designed to analyze the interrelationships within a set of
variables by reducing the complex information to an easily
interpretable form. In this paper, the PCA was carried out
using a set of data consisting of 20 groundwater samples to
identify and characterize the factors that affect the hydro-
chemical composition of the study area. The PCA results
comprising the loadings, eigen values, and percentages of
total variance are summarized in Table 3. The four factors
explain 92.05 % of the total variance in the dataset. The
parameters with loadings whose absolute value is more
than 0.65 are considered significant. Factor I, which
explained 61.88 % of the total variance, had strong positive
loadings on EC, Ca, Mg, Na, K, as well as Cl and NO3. The
high loadings for the major ions such as Ca2?, Mg2?, Na?,
and Cl- probably show the result of mineral-water
Appl Water Sci (2017) 7:411–420 415
123
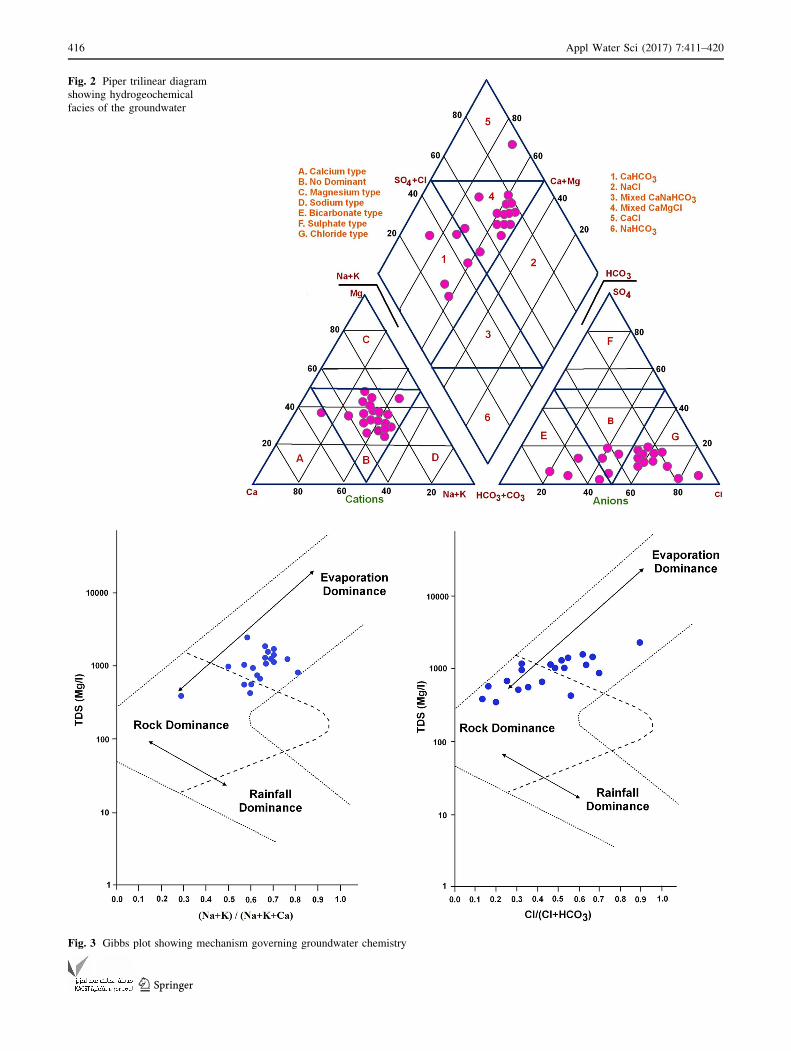
Fig. 2 Piper trilinear diagram
showing hydrogeochemical
facies of the groundwater
Fig. 3 Gibbs plot showing mechanism governing groundwater chemistry
416 Appl Water Sci (2017) 7:411–420
123

reactions influenced by anthropogenic activities. The next
Factor II, which explained 18.06 % of the total variance,
had strong positive loadings on HCO3, SO4, and F. The
high amount of SO42- ion was derived from large amount
of chemical fertilizers used in agriculture and industrial
effluent in the study area. Factors III and IV were repre-
sented with 7.79 and 4.32 % of total variance. The results
from Principal component analysis suggested that most of
the variations are explained by the set of natural soluble
salts and anthropogenic pollutants.
Evaluation of water quality for irrigation use
Five indices [sodium adsorption ratio (SAR), permeability
index (PI), sodium percentage (Na %), magnesium hazard,
and residual sodium carbonate (RSC)] were used to deter-
mine the suitability of groundwater for irrigation activities.
Sodium adsorption ratio
Table 4 shows the calculated values of sodium adsorption
ratio (SAR) in the study area. All samples fall under no
problem category according to the recommended water
classification for SAR (Bouwer 1978). The correlation
Table 2 Correlation matrix of physicochemical parameters of groundwater in the study area
pH TDS Ca2? Mg2? Na? K? HCO3- Cl- SO4
2- NO3- F-
pH 1
TDS -0.656 1
Ca2? -0.514 0.917 1
Mg2? -0.491 0.861 0.830 1
Na? -0.658 0.946 0.819 0.710 1
K? -0.555 0.723 0.507 0.455 0.786 1
HCO3- -0.049 0.148 0.070 -0.163 0.299 0.325 1
Cl- -0.635 0.934 0.866 0.900 0.814 0.549 -0.049 1
SO42- -0.162 0.429 0.319 0.068 0.560 0.485 0.653 0.175 1
NO3- -0.764 0.878 0.743 0.662 0.913 0.723 0.317 0.767 0.503 1
F- 0.403 -0.160 -0.091 -0.258 -0.112 0.073 0.305 -0.292 0.371 -0.143 1
Bold values indicate good correlation (r C 0.60)
Table 3 Factor analysis scores (Varimax rotation) of various physi-
cochemical parameters in the study area
Parameters Factor I Factor II Factor III Factor IV
pH -0.725 0.191 0.511 0.223
EC 0.991 -0.036 0.102 0.030
Ca2? 0.890 -0.107 0.301 0.168
Mg2? 0.826 -0.377 0.300 0.072
Na? 0.962 0.147 -0.044 0.001
K? 0.756 0.306 -0.134 -0.446
HCO3- 0.199 0.817 -0.263 0.327
Cl- 0.914 -0.294 0.144 0.074
SO42- 0.452 0.781 -0.015 0.149
NO3- 0.925 0.126 -0.191 -0.027
F- -0.176 0.692 0.571 -0.314
Eigen values 7.426 2.167 0.935 0.518
% of variance 61.882 18.057 7.793 4.319
Cumulative (%) 61.882 79.939 87.832 92.052
The values in bold are factor loadings above 0.65 taken after varimax
rotation was performed
Table 4 Irrigational quality parameters results in groundwater sam-
ples in the study area
Parameters Range Groundwater class
(irrigation uses)
Samples
(n = 20)
In
(no.)
In
(%)
SAR (Herman Bouwer
1978)
\6 No problem 20 100
6–9 Increasing
problem
– –
[9 Severe problem – –
Permeability index (PI)
(Doneen 1964)
\60 Suitable 2 10
[60 Unsuitable 18 90
Na % (Wilcox 1955) \20 Excellent – –
20–40 Good – –
40–60 Permissible 14 70
60–80 Doubtful 6 30
[80 Unsuitable –
Magnesium hazard
(Paliwal 1972)
\50 Suitable 8 40
[50 Unsuitable 12 60
Residual sodium carbonate
(after Richards 1954)
\1.25 Suitable 18 90
1.25–2.5 Marginal 2 10
[2.5 Not suitable – –
In (no.) indicates number of the samples fall in particular category
and In (%) indicates percentage of the samples out of 20, were fall in
the particular category
Appl Water Sci (2017) 7:411–420 417
123

between sodium adsorption ratio and electrical conductiv-
ity were plotted on the US salinity diagram (Wilcox 1955)
and it was found that 80 % of the samples fall in the field
of C3–S1 category (Fig. 4). It indicates that these water
samples are found in high salinity and low sodium content,
which can be used for irrigation in all soil types with low
risk of exchangeable sodium. Ten percent of the samples
fall in the field of C2–S1 indicating medium salinity and
low alkalinity content. This can be suitable for plants
having good salt tolerance and it also restricts suitability
for irrigation, especially in soils with restricted drainage.
Remaining 10 % of the samples fall under C4–S1 category,
which indicates very high salinity and low alkalinity con-
tent. So, these groundwater samples are suitable for plants
having good salt tolerance but unsuitable for irrigation in
soils with restricted drainage.
Permeability index
The permeability Index ranges from 47.7 to 75.8 % with an
average value of about 72.14 %. The soil permeability is
affected by long-term usage of water for irrigation and other
purposes. Based on the permeability index in the study area,
90 % of the samples were suitable for irrigation and 10 %
of the samples were unsuitable according to the Doneen
(1964) water suitability classification for irrigation purpose.
Sodium percentage
The suitability of the groundwater for irrigation depends on
the mineralization of water and its effect on plants and soil.
When the concentration of sodium is high in irrigation
water, Na? tends to be absorbed by clay particles dis-
placing Mg2? and Ca2? ions, thus reducing soil perme-
ability and finally results in soil with poor internal
drainage. The calculated values of sodium percentage of
the groundwater samples indicate that 70 % of the samples
fall in permissible limit except few samples falling under
doubtful category according to the Wilcox (1955) water
suitability classification for irrigation purpose.
Magnesium hazard (MH)
Paliwal (1972) introduced a ratio called index of magne-
sium hazard. Magnesium hazard is expressed as
Magnesium ratio ¼ ðMgÞðCaþMgÞ � 100:
The MH values in the study area ranged from 39.5 to
75.8 and 40 % of the samples were considered suitable for
irrigation (\50 %); meanwhile, 60 % of samples were
considered unsuitable for irrigation ([50 %), indicating
their adverse effect on crop yields.
Residual sodium carbonate (RSC)
Excess amount of magnesium and calcium ions tend to
precipitate as carbonate. The sodium concentration
increases and gets fixed in the soil thereby decreasing the
soil permeability. A high value of RSC in water leads to an
increase in the adsorption of sodium in soil (Eaton 1950).
The RSC values reveal that the groundwater samples in the
monitoring wells are considered suitable for marginal irr-
igational purpose (Table 4). According to the US
Fig. 4 Salinity and sodium
hazard of irrigation water in US
salinity diagram
418 Appl Water Sci (2017) 7:411–420
123

Department of Agriculture, water having [2.50 epm of
RSC values is not suitable for irrigation purposes. The
positive RSC values in 4 samples (20 %) indicates that
dissolved Ca2? and Mg2? ions were less than that of
CO32- and HCO3
- contents.
Conclusion
Based on the analysis of groundwater, it has been possible
to understand the geochemical quality of groundwater in
the study area and to evaluate its suitability for drinking
and irrigation purposes. The study inferred that the
groundwater in the study area is slightly alkaline in nat-
ure. Na, Ca, HCO3, and Cl are the dominant ions and
45 % of the study area exceeded the recommended limits
of TDS. Total hardness reveals that the water is generally
hard in nature. The concentrations of major ions in
groundwater are within the permissible limits of WHO.
The concentration of fluoride is within the permissible
limit and is suitable for drinking. The groundwater is
dominated by alkaline earths (Ca2? and Mg2?) with weak
(HCO3-) and strong acidic (SO4
2-) in nature. Based on
the Gibb’s diagram, evaporation dominance and rock–
water interaction dominance are the two main contributors
to change the water quality of the study area. The cor-
relation matrix and principal component analysis indicate
that the over exploitation of groundwater and anthropo-
genic inputs are high in the study area. USSL graphical
geochemical representation of groundwater quality sug-
gests that majority of the water samples belongs to high
and medium salinity with low alkali hazards. The calcu-
lated values of SAR, PI, Na %, and RSC indicate per-
missible use of groundwater for irrigation purposes.
Comparison of geochemical data shows that majority of
the groundwater samples are suitable for drinking and
irrigation purposes.
Open Access This article is distributed under the terms of the
Creative Commons Attribution License which permits any use, dis-
tribution, and reproduction in any medium, provided the original
author(s) and the source are credited.
References
Andrade E, Palacio HAQ, Souza IH, Leao RA, Guerreio MJ (2008)
Land use effects in groundwater composition of an alluvial
aquifer by multivariate techniques. Environ Res 106:170–177
APHA (1995) standard methods for the examination of water and
wastewater, 19th edn. APHA, Washington, DC
BIS (1991) Bureau of Indian Standards, IS:10500. Manak Bhawan,
New Delhi
Bouwer H (1978) Groundwater hydrology, International student
edition. McGraw-Hill Kogakusha, Ltd., Tokyo, pp 480
Brindha K, Elango L (2012) Groundwater quality zonation in a
shallow weathered rock aquifer using GIS. J Geo Spat inf
Sci:1–10
Carneiro PA, Umbuzeiro GA, Oliveira DP, Zanoni MV (2010)
Assessment of water contamination caused by a mutagenic
textile effluent/dyehouse effluent bearing disperse dyes. J Hazard
Mater 174(1–3):694–699
Central Ground Water Board (CGWB) (2008) District groundwater
brochure, Tiruchirappalli district, Tamil Nadu, Technical report
series, pp 5–7
Chandrasekar N, Selvakumar S, Srinivas Y, John Wilson JS, Simon
Peter T,Magesh NS (2013). Hydrogeochemical assessment of
groundwater quality along the coastal aquifers of southern Tamil
Nadu, India. Environ Earth Sci. doi:10.1007/s12665-013-2864-3
Doneen LD (1964) Notes on water quality in agriculture. In:
Published in water science and engineering. University of
California, Davis
Eaton FM (1950) Significance of carbonates in irrigation waters. Soil
Sci 39:123–134
Edmunds WM, Shand P, Hart P, Ward RS (2003) The natural
(baseline) quality of groundwater: a UK pilot study. Sci Total
Environ 310:25–35
Elkrail AB, Obied BA (2012) Hydrochemical characterization and
groundwater quality in Delta Tokar alluvial plain, Red Sea coast-
Sudan. Arab J Geosci. doi:10.1007/s 12517-012-0594-6
Freeze AR, Cherry JA (1979) Groundwater. Prentice-Hall, NJ
Gordana D, Dragana D, Sanja S (2014) Natural and anthropogenic
factors affecting the groundwater quality in Serbia. Sci Total
Environ:933–942
Hem JD (1989) Study and interpretation of chemical characteristics of
natural waters, 3rd edn. US geological survey water supply paper
2254
ISI (1983) Drinking water standard-substances or characteristic
affecting the acceptability of water for domestic use. ISI0500,
pp1-22
Jameel A, Padusha MSA, Zaheer Hussain A (2004) Studies on ground
water pollution of tannery effluent at Sempattu, Tiruchirappalli,
Tamilnadu. Intern Conf (JARJ) 1(2):7–9
Jankowski J, Acworth RI (1997) Impact of depris-flow deposits on
hydrogeochemical processes and the development of dry land
salinity in the Yass River catchment, New South Wales. Aust
Hydro geol J 5(4):71–88
Muthukumar S, Lakshmanan C, Sathya G, Krishnakumar P, Vivega-
nandam S (2011) Assessment of water quality in Trichy city,
Tamil Nadu, India. Int J Environ Sci 1(7)
Olajire AA, Imeokparia FE (2001) Water quality assessment of Osun
River: studies on inorganic nutrients. Environ Monit Assess
69(1):17–28
Paliwal KV (1972) Irrigation with saline water. In: Monogram no. 2
(new series). IARI, New Delhi, pp 198
Piper AM (1944) A graphic procedure in geochemical interpretation
of water analysis. Trans Am Geophys Union 25(6):914–928
Raju KCB (1998) Importance of recharging depleted aquifers: state of
the art of artificial recharge in India. J Geol Soc India 5:429–454
Richards LA (US Salinity laboratory) (1954) Diagnosis and improve-
ment of saline and alkaline soils. In: US Department of
Agriculture Hand Book. pp 60
Selvakumar S, Chandrasekar N, Srinivas Y, Simon peter T, Magesh
NS (2014) Evaluation of the groundwater quality along coastal
stretch between Vembar and Taruvaikulam, Tamil Nadu, India; a
statistical approach. J Coast Sci 1:22–26
Shuxian W (2013) Groundwater quality and its suitability for drinking
and agricultural use in the Yanqi Basin of Xinjiang Province,
Northwest China. Environ Monit Assess. doi:10.1007/s
10661-013-3113-7
Appl Water Sci (2017) 7:411–420 419
123
Subba Rao N (2014) Spatial control of groundwater contamination,
using principal component analysis. J Earth Syst Sci
123(4):715–728
USSL (1954) Diagnosis and improvement of salinity and alkaline
soil. In: USDA Hand Book No. 60. Washington
Walton WC (1970) Groundwater resources evaluation. McGraw Hill
Book Co, New York
Whittemore DO, Greggor KMM, Marotz GA (1989) Effects of
variations in recharge on groundwater quality. J Hydrol
106:131–145
WHO (2004) Guidelines for drinking water quality, 3rd edn. World
Health Organization, Geneva
Wilcox LV (1955) Classification and use of irrigation waters, USDA
Circular No. 969. pp 19
Zhang B, Song X, Zhang Y, Han D, Tang C, Yu Y (2012)
Hydrogeochemical characteristics and water quality assessment
of surface water and groundwater in Songnen plain, Northeast
china. Water Res 46(8):2737–2747
420 Appl Water Sci (2017) 7:411–420
123