Embed Size (px)
Citation preview
7 International Conference on Water Resources and Arid Environments (ICWRAE 7): 242-257th
4-6 December 2016, Riyadh, Saudi Arabia
Corresponding Author: Sultan Awad Sultan Araffa, National Research Institute of Astronomy and Geophysics (NRIAG, Egypt)
242
Groundwater Potentiality at El Egma Plateau, Central Sinai,Egypt Using Geoelectrical, Gravity and Magnetic Data
Sultan Awad Sultan Araffa, Hassan S. Sabet and Mahmoud S. Shehata1 2 3
National Research Institute of Astronomy and Geophysics (NRIAG, Egypt)1
Geology Dep. Faculty of Science, Al-Azhar University, Cairo, Egypt2
Ceramica Cleopatra Group Company, Suez, Egypt3
Abstract: In the present study different geophysical techniques such as Vertical Electrical Sounding, Gravityand Magnetic are used to delineate the deep aquifer in the South El-Egma area. The area under study is locatedin the central part of Sinai Peninsula, Egypt. In this area eighteen deep vertical electrical soundings have beencarried out, using current electrode spacing (AB) ranging from 10 m to 6000 m to reach the deep aquifer in thestudy area. The results of resistivity interpretation indicate that; the study area consists of five geoelectricunits. The fifth geoelectric unit represents the main groundwater aquifer in the study area (Nubian Sandstone).The depth of the upper surface of the Nubian sandstone aquifer was ranging from 718 m to 927 m, resistivityvaries between 26.5 Ohm.m and 477 Ohm.m and the thickness ranges from 191 m to 3330 m. Five hundred andtwenty-one gravity stations have been collected by using CG-3 Gravity-meter. The results of quantitativeinterpretation for gravity data revealed that, the area was dissected by different normal fault elements of trendsNE-SW and N-S. Four hundred and eighty-seven magnetic measurements were done to detect the basementdepth and then the thickness of sedimentary deposits. The results of magnetic method reflected that, the depthof basement was ranging from 1005 m to 4108 m. The present study aims to exploration the groundwater andassessment of the Nubian sandstone aquifer in Central Sinai, Egypt by using geoelectrical, gravity andmagnetic data, where the people who live in central Sinai suffer from scarcity of water for domestic andagricultural purpose
Key words: Groundwater Evaluation Geophysical Interpretation South El-Egma Plateau Central Sinai Egypt
INTRODUCTION aquifer) through the geophysical investigation and also
The interpretation of integrated geophysical data is the basement relief of the study area which located at thebecoming standard in applied geophysics, especially central part of Sinai, Egypt.geoelectrical, electromagnetic, magnetic, gravity and, morerecently, nuclear magnetic resonance methods that areLocation: The study area lies at the central part of Sinaicommonly used in groundwater exploration [1].The Peninsula at longitudes 33 10` and 34 10` E andgeoelectrical tools have been widely used to delineate between latitudes 29 30` and 30 00` N and occupies anthe shallow subsurface stratigraphy, groundwater area of 5308 Km² (Fig.1). The study area is located in thesources and their quality [2].The gravity and magnetic area between the Gulf of Suez and Gulf of Aqaba andmethods are also used in groundwater exploration for occupies low lands which can be used for differentdelineating the subsurface structural elements and their activities such as agricultural and industrial projects. trends, which are controlling the geometry of thegroundwater aquifers [3]. Geology of the Area: The general geology of the study
The main target of the present study is to evaluate area is presented based on the geologic map whichthe groundwater occurrences to estimate the parameters constructed by [4]. The most parts of the study area areof the deep groundwater aquifer (Nubian Sandstone covered by Holocene which composed of Wadi and
to map the geologic subsurface structures and to detect
7 International Conference on Water Resources and Arid Environments (ICWRAE 7): 242-257th
243
Fig.1: Location of the study area
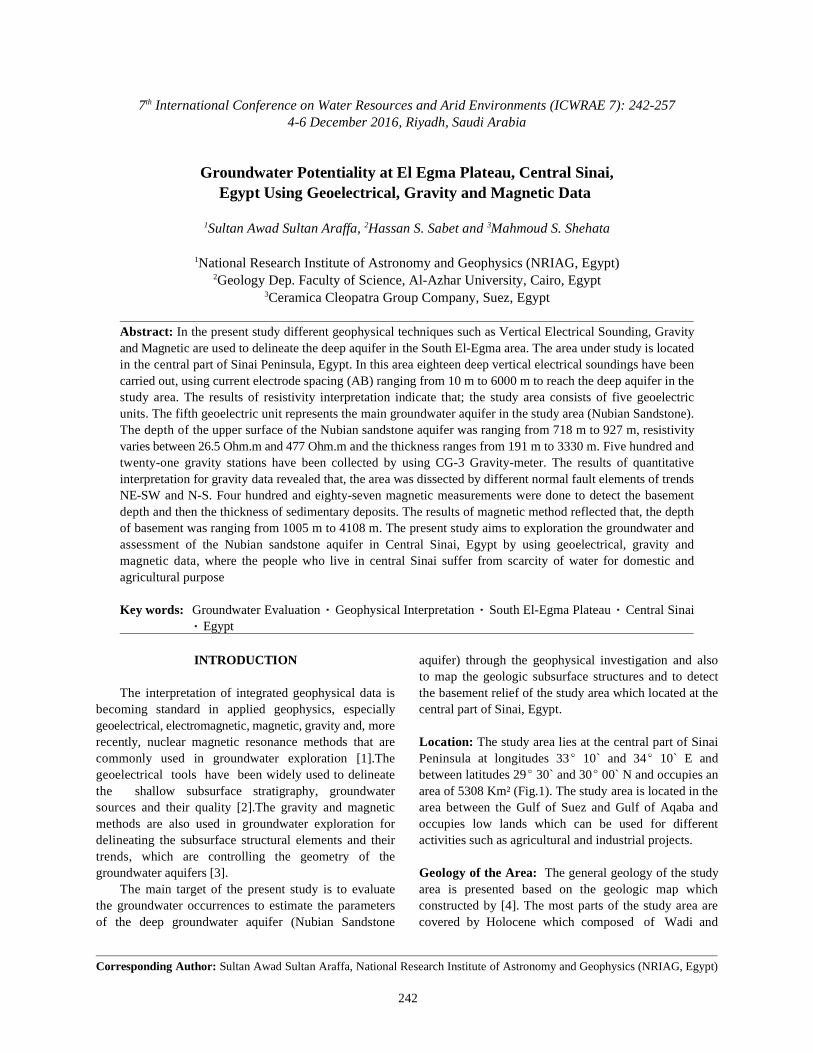
Table 1: Geological description of borehole Jica1
TDS 1,206 Latitude 2 942'31" S.W.L 312.8m(BGL) Elevation 520 longtude3339r 08" Depthlt254 m
Water Bearing Formation: Nubian Sandstone (Lower cretaceous).
Depth (in)
-----------------------------------------
From To Age Description
0 50 Paleocene Wadi Deposits
50 ISO Maastrichtian Limestone intercalated with clay
ISO 270 Campanian Claystone
270 585 Santonian-Coniacian Limestone intercalated with clay
585 450 Turonian Limestone
450 520 Chalky Limestone
520 585 Cenomanian Limestone intercalated with clay
585 640 Limestone
640 670 Limestone intercalated with clay
670 700 Limestone
700 770 Limestone intercalated with clay
770 810 Limestone
810 865 Limestone intercalated with clay
S65 1115 Lower Cretaceous Alternation of shale and Sandstone
ms 1260 Jurassic Sand and Shale

7 International Conference on Water Resources and Arid Environments (ICWRAE 7): 242-257th
244
Pleistocene deposits, of alluvium deposits. These from 10 m to 6000 m. The main target of this tool is todeposits overlay Paleocene deposits, including Esna detect the Nubian Sandstone aquifer in the study areaShale Formation which is composed of marly shale. Many (Fig.3). VES 9 was measured beside one borehole drilledstratigraphic units are ranging from the Upper Cretaceous in the study area (JICA1) for calibration the results ofto the Lower Eocene cover the eastern part of the area. interpretation of geoelectrical data with the lithologicalThe Lower Eocene deposits which are represented by units of the borehole (Fig.4). The electrical measurementsEgma Formation of chalky limestone are located at the were measured along the wadis (valleys) of directionseastern and central parts of study area. The Upper north-south (N–S) and northeast-southwest (NE–SW)Cretaceous is represented by Sudr Formation, which is through the study area. The authors applied twocomposed of chalk of Maastrichtian age which is located techniques of quantitative interpretation to determine theat the western part; Duwai Formation is composed of true resistivity and thickness values of the successivealternating of carbonates and clastic of Campanian age at strata of the subsurface section The first one is thethe western part of the study area; Matullah Formation is manual interpretation, which depending upon thecomposed of limestone of Coniacian–Santonian age; and matching of the plotted field curves, on using two layersWata Formation composed of dolomitic limestone of with the standard curves of the generalized CagniardConiacian–Turonian deposits. The subsurface graphs ([10] and [11]). The obtained results of the manualstratigraphy of the study area is represented from the Jica interpretation have been used as initial models for thewell No.1 [5], which lies at the coordinate ( Lat. 2942 31 analytical methods by the second technique. The secondand Long. 3339 08 ), with depth of 1254 m (Table 1). technique was made using the IPI2WIN program. TheThe stratigraphy of this borehole consists of Wadi quantitative interpretation has been applied to the data todeposits (Paleocene) which are composed of alluvial determine the thicknesses and true resistivity’s of thedeposits of thickness of 59 m. Sudr Formation (Upper stratigraphic units, beside of each VES station as, finalSenonian) is composed mainly of white chalk and chalky results (Fig.5).limestone of thickness 220 m. Matulla Formation of LowerSenonian is composed of white limestone intercalatedGravity Data and Analysis: Gravimetric field survey andwith shale and marl, of thickness about 115 m. Wata measurements are carried out by the CG-3 AutogravFormation (Turonian), composed of two parts, the upper (made by Scintrex, with reading resolution of 0.01 mGal).and middle parts consist of limestone with thickness 65 m. Five hundred and twenty-one gravity stations areThe lower part of Wata Formation consists of chalky collected at the available sites in the study area (Fig.6). Alllimestone, with a thickness of 70 m which composed of gravity measurements are corrected to different gravitylimestone with minor breaks of shale. Cenomanian corrections; such as, drift, tide, free-air, Bouguer, latitudedeposits are extended from 520 m to 861 m. Lower and topographic corrections using specialized GeosoftCretaceous deposits are represented by Malha Formation software [12]. The terrain correction was also carried outor Nubian Sandstone facies that is non – fossiliferous using a Hammer chart and topographic maps of scale 1:50thick section of fine to coarse grained sandstones 000 to determine the mean elevations of the differentintercalated with shale, limestone and marl units. The zones for the hammer chart. Bouguer anomaly map wasLower Cretaceous rocks are represented in the Jica well constructed from the corrected gravity data and used forNo.1 at depth of 865 m. This formation is the main deep qualitative and quantitative interpretation using [13] withgroundwater aquifer, especially in Sinai. a contour interval of 1 m Gal (Fig.7). The anomalies which
MATERIALS AND METHODS lateral density variation within the sedimentary rocks,
Electrical Resistivity Data: Electrical resistivity (Fig.7) shows that, the Bouguer anomaly field in the areatechniques are well-established and widely used to solve ranges between a maximum value (-16.4 m.Gal) at the SE,a variety of geotechnical, geological and environmental SW, NW and West of the study area and a minimum valueproblems ([6], [7], [8] and [9]). The electrical resistivity (-49.7 m.gal) at the northern, northeastern and southern ofdata used in this study include eighteen vertical electrical central part of the study area. The most significantsoundings (VES), were collected by using Schlumberger features in the Bouguer gravity anomaly map are the steepconfiguration of current electrode spacing (AB) ranging gradients occur between high to low gravity values.
observed in the Bouguer anomaly map are caused by
crust and sub-crust of the earth. The gravity anomaly map

7 International Conference on Water Resources and Arid Environments (ICWRAE 7): 242-257th
245
Fig. 2: Geologic map of the study area
Fig. 3: Location map of Geoelectric Measurements
Fig. 4: Correlation between Jica1Well and VES No.9

7 International Conference on Water Resources and Arid Environments (ICWRAE 7): 242-257th
246
Fig. 5: 1-D VES interpretation Using IPI2WIN Program

7 International Conference on Water Resources and Arid Environments (ICWRAE 7): 242-257th
247
Fig. 6: Location map for Gravity and Magnetic stations
Fig. 7: Gravity Anomaly Map
Gravity Separation: The authors used least squares The regional surface is represented by a polynomialtechnique for gravity separation, this technique is a surface (Oldham and Sutherland 1955; Grant, 1957; andmathematical method applied on the gravity anomaly map Van Voorhis and Davis, 1964), as known:to calculate the regional and residual maps. In the presentstudy the least squares technique has been applied to (3)separate the regional component (Z) from the Bougueranomaly ( g) (Abdelrahmanet al, 1985). The residual where:component (R) can be estimated as follow:
(1) (4)
where: p is the order of the two dimensional (2 D) polynomial.
(2) Z is the regional component.
a is Coefficients.n-s,s
x and y are the coordinates.

7 International Conference on Water Resources and Arid Environments (ICWRAE 7): 242-257th
248
Fig. 8: Residual Gravity Anomaly Maps, a: First order, Fig. 9: Regional Gravity Anomaly Maps, a: First order,b: Second order, c: Third order, d:Fourth order, b: Second order, c: Third order, d:Fourth order,e:Fifth order e:Fifth order

7 International Conference on Water Resources and Arid Environments (ICWRAE 7): 242-257th
249
In the present work, the calculations were carried magnetic measurements had been measured using twoout to select the best order of residual for gravityseparation. The best order was the fourth order. Theresidual component has been estimated by subtractingthe regional values (Z) from the Bouguer values (g). Theresults of the separation of regional and residual for thedifferent orders were mapped by (Oasis Montaj, 2007).The regional and residual components for the first to fifthorders are presented in Fig.8a-e and Fig.9a-e, respectively.A correlation factorr(x,y) had been calculated to selectthe best order of residual for gravity interpretation. Thecorrelation factor can be estimated for any two orders asfollows:
(5)
The results are given in Table (2). The fourth order(r ) is the best for gravity interpretation. 45
Table 2: Correlation Factors.Correlation Factors Value
r 0.834912
r 0.864623
r 0.8128334
r 0.999845
r 0.999856
Magnetic Data and Analysis: The magnetic survey andmeasurements were carried out using two Envimagmagnetometers (model Scintrex) made in Canada (1992) of1 nT sensitivity. The measurements were collected atsame sites of gravity measurements (Fig. 6) where the
magnetometers, the first one used for collecting data andthe other one used for base station recordings, to applythe diurnal variations correction, to record themeasurements automatically every one minute. Anothercorrection (IGRF) was applied to remove the normalgradient of the magnetic field on the study area. Thesecond instrument was used for the magnetic survey ofthe studied area. The calculation of the diurnal variationand IGRF were carried out by the [13]. The correctedmagnetic data had been presented as a total intensitymagnetic map, as shown in Fig 10. The total intensitymagnetic map was reduced to the magnetic pole (RTP) tosolve the dipole polarity and distortion of magneticanomalies where it is a more interpretable map. Thismathematical procedure was first described by [14], [15],[16] and [17]. The total intensity magnetic map after beingreduced to the pole (Fig11.) indicates that, in comparisonwith the original total intensity magnetic map, reflectedthe northward shift in the positions of the inheritedmagnetic anomalies due to the elimination of theinclination of the magnetic field at this area. Also, thenumber of anomalies becomes larger, with comparabledecrease of their aerial extension and the increase of theirvertical reliefs. Added, the magnetic gradients becomemore intensive and steeper, giving rise to more resolutionin both the encountered structural and lithologicinferences. By this way, the high and low magneticanomalies formerly described in the total intensitymagnetic map is well cleared in the total intensitymagnetic map reduced to the pole with the appearance ofsome anomalies and the others are hidden. These couldbe seen in the southern part of the area, in which some
Fig. 10: Total Intensity Magnetic Map

7 International Conference on Water Resources and Arid Environments (ICWRAE 7): 242-257th
250
Fig. 11: Total Intensity Magnetic Map Reduced to the Pole (RTP Map).
anomalies appeared at the north of the central part with first geoelectric unit is formed of chalky limestone ofshifting for some anomalies to the north and the thickness ranging from 81 m at VES No.14 to 208 m at VESamplitudes of them were steeper than the total intensity No.15 and its resistivity value ranged from 10 Ohm m atmagnetic map. Also, the appearance of some anomalies in VES No.3 to 169 Ohm m at VES No.15. The second unit,the central part of the area, as well as at the southern part corresponding to clays which were characterized by lowof the study area, some smaller positive and negative resistivity values ranging from 2.5 Ohm m at VES No.5 toanomalies which present in the total intensity magnetic 70.3 Ohm m at VES No.16 with a thickness of 35 m at VESmap, are concealed in the reduced magnetic pole map (and No.6 to 181 m at VES No.18. The third geoelectric unit, isalso some anomalies are disappeared from the RTP Map). associated with chalk and shaly limestone, showedBesides, the magnetic gradients in the total intensity relatively high resistivity values ranging from 14.9 Ohm mmagnetic map were shifted in their directions, most of at VES No.15 to 158 Ohm m at VES No.1 and the thicknessthem took the NNE-SSW and NNW-SSE trends. The of this unit was ranging from 279 m at VES No.8 to 451 mprincipal application of the magnetic data is to determine at VES No.7 and its resistivity values ranged from 14.9the depth to the top of the geologic sources that produce Ohm.m at VES No.15 to 158 Ohm m at VES No.1. Theobserved anomalies. The magnetic tool was applied in the fourth geoelectric unit was formed from limestonepresent study to determine the depth of basement rocks intercalated with clay. The thickness of this unit wasand then thickness of the sedimentary cover. 2D magnetic ranging from 118 m at VES No.3 to 265 m at VES No.6 andmodeling was applied using GM-sys program, (Oasis its resistivity values ranged from 2.3 Ohm m at VES No.15Montaj, 2007) and then constructing a basement relief to 77.6 Ohm m at VES No.6. The fifth unit wasmap from the results of 2D magnetic modeling. characterized by relatively moderate resistivity values
RESULTS AND DISCUSSIONS VES No.6 and correspond to sand and sandstone
The results of the 1D-VES inversion of VES unit contains the main (freshwater) groundwater aquiferinterpretation have been used for the construction of in the area. The values of true resistivity for the Nubianthree geoelectrical cross sections. The three geoelectric sandstone were relatively high; indicating the quality ofcross-sections were constructed along three profiles (A- water was good due to the salinity was low. The totalA`, B-B` and C-C`) oriented approximately NW–SE. The dissolved salts were 1206 ppm from the chemical analysiscross-sections are shown in Fig. 12 a, b and c, indicating of the borehole Jica1. The depth of the fifth unit (Nubianthat, the shallow subsurface lithologic sequence, in the Sandstone aquifer) was ranging from 718 m to 927 mstudy area, is represented by five geoelectric units. The (Fig13b).
ranging from 26.5 Ohm m at VES No.17 to 477 Ohm m at
(Fig13a). According to the borehole results (Jica1), this

7 International Conference on Water Resources and Arid Environments (ICWRAE 7): 242-257th
251
Fig. 12: Geoelectric Cross-Sections a, b and c long VES.1 to 18

7 International Conference on Water Resources and Arid Environments (ICWRAE 7): 242-257th
252
Fig.13: a: Isoresistivity, b: Depth map of the main aquifer (Nubian Sandstone)
Fig. 14: a:Fault elements from Fourth order residual gravity anomaly map, b: Rose Diagram represents the trends of thestructural elements which dissect the study area
a
b
c
7 International Conference on Water Resources and Arid Environments (ICWRAE 7): 242-257th
253
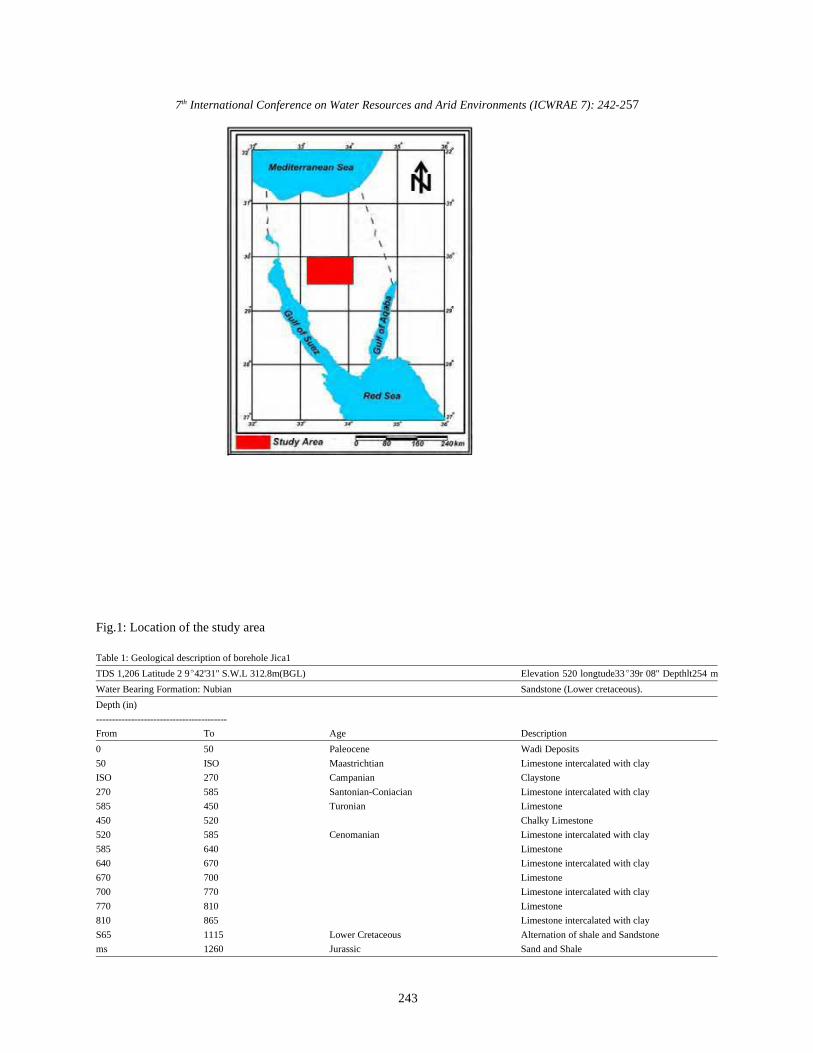
Fig.15: Euler deconvolution at a: SI=0, b: SI=1, c: SI=2

7 International Conference on Water Resources and Arid Environments (ICWRAE 7): 242-257th
254
Fig. 16: Magnetic Models Along Profiles from P1-P1`to P10-P10`

7 International Conference on Water Resources and Arid Environments (ICWRAE 7): 242-257th
255
The fourth order residual gravity anomaly map was The main target of the magnetic data is to determineused to detect the locations and trends of the faultelements dissecting the study area (Fig.14a), whichindicated that the study area was dissected by differentfault elements of different trends such as NE-SW andnearly N-S (Fig.14b).
The Euler deconvolution technique was applied ongravity anomaly map to determine the depth and trend ofthe structural elements dissecting the study area. TheEuler deconvolution process was applied for differentstructural indices to define the best solution of thestructural index where the best solution was representedby the solutions were coincidence and arranged in trends.The structural index (SI) is a measure of the fall-off rate ofthe field with distance from the source Oasis Montaj(2007). The following Table (3) showed an appropriatemodel for the structural index value. In the present study,the structural indices applied were 0, 1 and 2 (Fig15) toselect the best solution of the structural index, where theSI = 0 seems the best solution as in Fig (15a), where theSI=0 refers to sill, dyke, Ribbon and step structure in thestudy area. Also, the trends of faults at SI=0 were nearlysimilar to the fault elements, which were detected from theleast squares residual map.
Table 3: Structure Index (SI) at Gravity Field
SI Gravity field
0 Sill/Dyke/Rippon/Step
1 Cylinder/Pipe
2 sphere
3 N/A
the depth to the top of the basement surface, thatproduces the observed anomalies. The quantitativeinterpretation of the magnetic data map was carried outthrough 2-D magnetic modeling by using GM-SYSsoftware (Oasis Montag, 2007). In this work, ten profilestrending W–E were modeled (Fig.16). The magneticsusceptibility of the basement was assumed to beconstant with a value of 0.00535 CGS unit (0.0672 SI unit).This parameter was used in the modeling of the tenprofiles. The models in Fig (16) showed the variations inthe thickness of the sedimentary sequence and of thetopography of the top of the basement rocks. Theseresults were used to draw the map of the basementsurface depth. The depth of basement surface (Fig.17)indicated that, the basement depth ranged between 1005m and 4108m in the study area. The basement depthsfound in the middle and north of the study area were verydeep, which had values more than 2800 m, but to the east,south and west of the study area were of shallow depths,where the depth had values less than 1000 m. So thegeneral dip of basement in the study area (from shallow todeep) directs from the east, south and west towardnortheast.
The results of geoelectric data are conformed withthe results of borehole (Jica1) for the lithology anddepth of aquifer and the water quality where the TDS ofwater samples from boreholes was 1206 ppm which ismore or less fresh water where the aquifer reflectsrelatively high resistivity value ranging from 26.5-477Ohm.m. The fault elements which were delineated fromgravity interpretation are indicated on the geological mapof the study area.
Fig. 17: Basement Relief Map of the Study Area

7 International Conference on Water Resources and Arid Environments (ICWRAE 7): 242-257th
256
Fig. 18: Location of Geoelectric VES Stations with the Priority Zones to Detect the Best Places for Drilling Plan in theStudy Area
CONCLUSION 2. Kearey, P. and M. Brook, 2002. An Introduction to
From the results of the integrated geophysical Science, pp: 254.interpretation of the study area, we can conclude that the 3. Murty, B.V.S. and V.K. Raghavan, 2002.study area contains deep groundwater aquifer (Nubian The Gravity Method in Groundwater ExplorationSandstone aquifer) at depths ranging from718 m to 927 m in Crystalline Rocks: a Study in the Peninsularand thicknesses ranging from 191 m to 3330 m and the Granitic Region of Hyderabad, India”, Hydrogeologyresistivity values ranging from 26.5 Ohm m to 477 Ohm m. Journal, 10(2002), pp: 307-321.DOI.10.1007/s10040-The result of interpretation of the gravity data indicated 001-0184-2.that, the main structural elements are well correlated with 4. UNESCO, 2005: Geologic Map of Sinai, Egypt,the Gulf of Aquba (NW–SE) and the Nile Valley (N–S) Scale 1: 500,000, Project for the Capacity Building oftrends. From the 2-D magnetic modeling, the depth of the the Egyptian Geological survey and Miningbasement rocks was ranging from 1005 m to 4108 m in the Authority and the National Authority forstudy area. Remote Sensing and Space Science in Cooperation
Recommendation: According to the integrated Egypt.geophysical interpretation, we can give recommendation 5. Geological Description of the Borehole JICA 1about the best sets for drilling plan. The study area can be Well: (after JICA, 1992, EGSMA, 1996 and Ghobachi,divided into three zones, according to the less depth, 2010).greater thickness and high resistivity, for the groundwater 6. Ward, S.H., 1990. Geotechnical and Environmentalaquifer and the quality of water for the aquifer. According Geophysics Series Investigations in Geophysics, vol.to the results of the geophysical interpretation, the best 5. Society of Exploration Geophysics, Tulsa, USA.zone for drilling plan in the study area is the zone A Fig 7. Sultan, S.A., F.A. Santos and A. Helal, 2006. A study(18). of the Groundwater Seepage on Hibis Temple Using
REFERENCES surface geophysics Journal, pp: 347-354.
1. Goldman M. and F.M. Neubauer, 2004. Groundwater shallow subsurface geotechnical problems ofExploration Using Integrated Geophysical Mokattam area, Cairo, Egypt, Environmental EarthTechniques”, Surveys in Geophysics, 15(3): 331-361. Sciences Journal, 59: 1195-2207.
Geophysical Exploration, 4th edition. Blackwell
with UNDP and UNSECO., Geological Survey of
Geoelectrical Data, Kharaga, Egypt, Egypt, near
8. Araffa, S.A.S., 2010. Geophysical investigation for

7 International Conference on Water Resources and Arid Environments (ICWRAE 7): 242-257th
257
9. Araffa, S.A.S., H.M. El Shayeb, M.F. AbuHashesh 13. Oasis Montaj, 2007. Geosoft mapping and applicationand N.M. Hassan, 2015: Delineating subsurface system, Inc., Suit 500, Richmond St. West Toronto,structure and assessment of groundwater aquifer ON, Canada N5SIV6.using integrated geophysical interpretation at the 14. Baranov, V., 1957. A New Method for Interpretationcentral part of Sinai, Egypt, journal of Geoscience, of Aeromagnetic Maps: Pseudo- GravimetricFirst online, pp: 305-318.DoI: 10.1007/s12517-015- Anomalies, Geophysics, 22: 359-383.1824-5. 15. Baranov, V. and H. Naudy, 1964. Numerical
10. Koefoed, O., 1960: A generalized Cagniard graph for Calculation of the Formula of Reduction to theinterpretation of geoelectrical sounding data. Magnetic Pole, Geophysics, 29: 67-79.Geophysical prospecting, 8(3): 459-469. 16. Bhattacharyya, B.K., 1965. Two dimensional
11. Orellana, E. and H.M. Mooney, 1966. Master table harmonic analysis as a tool for magneticand curves for vertical electrical sounding data, interpretation; Geophysics, 30(5): 829-857.Geophysical Prospecting, 8(3): 459-469. 17. Baranov, V., 1975. Potential Fields and Their
12. Chuansheng, W., Jinrong and Z. Xiufen, 2008. Transformation in Applied Geophysics,AGenetic Algorithm Approach for Selecting Geoexploration Monographs, Series1-6. Berlin –Tikhonov Regularization Parameter, IEEE Congress Stuttgart: Gebrüder, Borntraeger.on Evolutionary Computation (CEC 2008).