Embed Size (px)
Citation preview
Groundwater natural background levels and threshold definition in the Colli Albani volcanic aquifers in Central Italy
A. Di Domenicantonio, M. Ruisi & P. Traversa
Autorità di Bacino del Fiume Tevere, 00185 Roma, Italia
SUMMARY The Colli Albani volcanic structure covers an area of about 1950 km2. At least two surface aquifers overlapping the geothermal basement can be distinguished. Four WBs were identified in the surface aquifers on the basis of groundwater watersheds and flow direction. Overexploitation is the main problem in this area and it varies from 44% in WB1 to 111% in WB4 (ratio of water abstraction rate to effective infiltration). Numerous impacts regarding the following receptors have been identified: groundwater itself, terrestrial ecosystems dependent on water, aquatic ecosystems and drinking water. WP3 methodologies were applied to two specific cases: saline intrusion and water abstraction for drinking water use. In the remaining cases further investigations to define NBL values and trend reversal thresholds are being carried out. 1. INTRODUCTION The Colli Albani volcanic structure is situated south of the city of Rome and it is delimited by the left side of the Tevere and Aniene rivers and by the Tyrrhenian sea. This territory has an important value from a landscape, historical and cultural point of view and has been widely exploited since the Roman times. It comprises important natural protected areas of local, national and European interest. It is constituted by an isolated relief with a characteristic truncated cone shape that surmounts the Roman countryside with an altitude between 0 and 970 m asl. The region’s morphology was shaped by stratovolcanic activity, characterized by long alternating explosive and effusive phases accompanied by diffuse eccentric activity, which culminated in a series of phreatomagmatic violent explosions that concluded the cycle of the entire complex. 2. CHARACTERISATION OF GROUNDWATER BODIES 2.1 Physical and hydrogeological description 2.1.1 Geographical boundaries The Colli Albani structure, including the hydraulically linked coastal strip, covers an area of about 1950 km2. The depth of the aquifer from the surface varies from a few meters in the periphery, where the aquifer is mainly unconfined, up to reaching peaks of 500 m in the central area of the volcanic structure, where the aquifer is prevalently confined (Capelli et al., 2005-2). The average depth is 75 meters. The depressions caused by phraetomagmatic explosions are occupied by lakes (Nemi lake, Albano lake), which are hydraulically linked to the aquifer. The origin of the outcrops is 60% volcanic. These rocks are characterized by high permeability in 85% of their extension. The less permeable sectors are situated in the areas around the lakes and in the eastern peripheral area near the Apennine ridge. The other outcrops are mainly characterized by medium-low permeability. Regarding the soil, the AWC (available water capacity) (Capelli et al., 2005-1) was assessed according to the definition of the FAO. The AWC varies from 20 to 250 mm with an average of 170 mm. These values are lower (up to 100 mm) in the area at the top of the volcanic structure and higher (from 150 to 250 mm) in the surrounding peripheral area. Near the coastal area the AWC fluctuates around the average value (150-200 mm), influenced especially by the different level of permeability of the outcrops. The Colli Albani structure’s water circulation develops in radial direction from the centre to the periphery following complex patterns and it is characterized by a strong interaction between groundwater and surface water circulation.
2
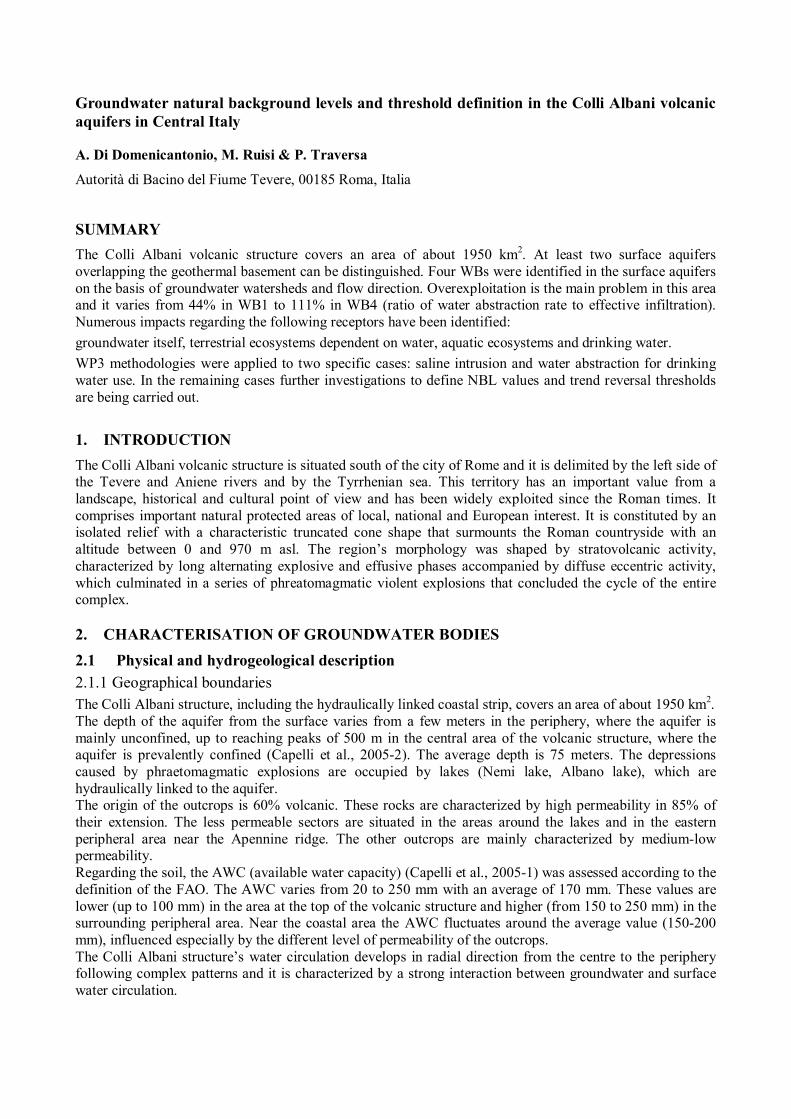
The geological setting originated an aquifer in the central area, sustained by low permeability volcanic rocks and a regional aquifer, sustained by marine pre-volcanic clay deposits and contained in the more ancient volcanic rocks. Water circulates also through the lakes from the superior to the basal aquifer complexes. The characteristic springs in this system are linear springs that feed the perennial surface water circulation at the bottom of the riverbed. The surface hydrographic network is subdivided into 26 river basins (Capelli et al. 2005-2)covering surface areas ranging from 4 km2 to 282 km2. Of all these river basins 17 are characterized by perennial circulation the whole year round. They are fed by a regional aquifer through linear springs at an altitude between 50 and 70 m above sea level. The Colli Albani rivers are comprised in the north in the Tevere river basin, in the west and south-west they discharge into the Tyrrhenian Sea and in the south–east in the Sacco river basin. The water circulation was subdivided into four water bodies (Autorità di Bacino del Fiume Tevere, 2003) delimited by potential levels, where it was possible to carry out water balance calculations (fig. 1).
Fig. 1 Map of the four groundwater bodies in the Colli Albani volcanic hydrostructure. 2.1.2 Climate Meteorological and climatic factors and their spatial distribution were derived from the monitoring network of the Italian National Hydrographic Service, which has been operational since 1920. For the description of general characteristics and variations we will refer to the period 1980-2000, whereas for the calculation of the hydrogeological balance we will consider the five years between 1997 and 2001. Precipitation prevails in autumn and winter and the average value during the year is about 750-800 mm. The trend during the twenty years taken in exam shows a considerable decrease in winter precipitation, which passed from 300 mm to less than 200 mm. During autumn the mean precipitation value is generally stable with a mean value of 320 mm. In spring the mean value is close to 200 mm per year. In summer there is a slight decrease and the values are slightly lower than 100 mm. Mean temperatures are about 23 degrees in summer, 17 in autumn, 8 in winter and 14 in spring, when there are maximum trend increases (about two degrees).
3
Least availability of water resources results from the combination of the two total precipitation values and the temperature increase in periods when evapotranspiration reaches maximum levels. 2.1.3 Water balance The main parameters of the hydrogeological balance are summarized in table 1 (Capelli et al., 2005-1). Table 1 - Annual average in mm of water balance components in the Colli Albani hydrostructure (average value of years 1997-2001). Hydrogeological system of the Colli Albani structure mm/year l/s Mm3/year % of P Precipitation* 731 45 925 1 448 100.0 Evapotranspiration 346 21 659 683 47.2 Runoff 138 8 610 272 18.7 Effective Infiltration 245 15 364 485 33.5 Base flow in the riverbed (from in situ measurements)
62 3 893 123 8.5
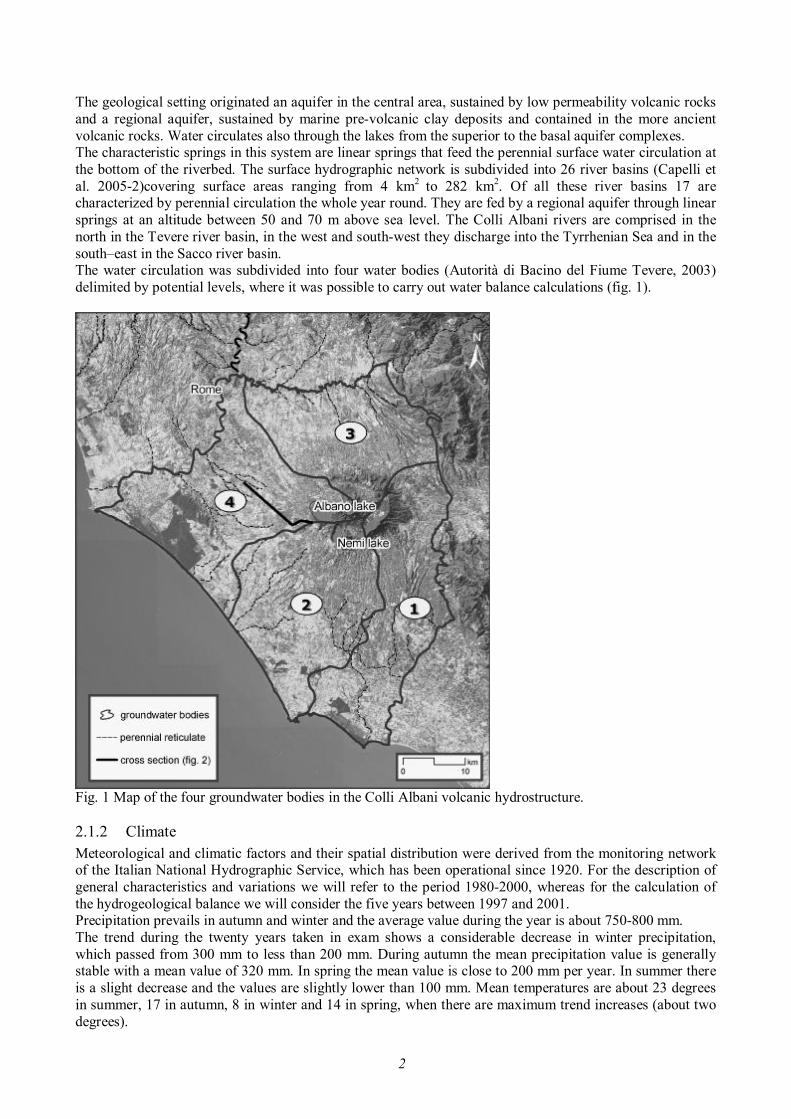
* Comprises 5.7 Mm3/year of precipitation in the lakes 2.1.4 Geology The Colli Albani district is one of the many volcanic structures which developed along the Lazio and Toscana regions’ continental platform in the north-eastern part of the Tyrrhenian river basin. The Colli Albani structure’s activity started less than 600 000 to 20 000 years ago. The outcrops are constituted by pyroclastic products, lava flows, scoriae and ash, sand and lapilli strata. The overall thickness of these formations varies from a few meters to over 1000 meters. The chemical and petrographic characteristics of the pyroclasts and lava are typical of a magmatic series rich in potassium, a very unique chemical composition (Capelli et al., 2005-1). There are 500 to 600 m thick marine clay deposits that sustain the water circulation. The substratum is constituted by carbonate series of the Apennine ridge, where deep water circulation takes place (Capelli et al., 2005-2). The hydrogeological cross-section in figure 2 describes these conditions in the north-western part of the Colli Albani area (see line traced in figure 1).
Fig. 2 Geological and hydrological cross-section (see line traced in fig.1). LEGEND: – 1: Products of the Albano activity a) Conduit breccia; 2): Products of the Faete activity; 3): Ignimbrites of the Tuscolano- Artemisio activity; 4): Lava; 5): Pre-volcanic bedrock; 6): Well; 7): Fault; 8): 1999 isopiezometric level; 9): 1972 isopiezometric level) (Modified after GIORDANO et al, 2000).
4
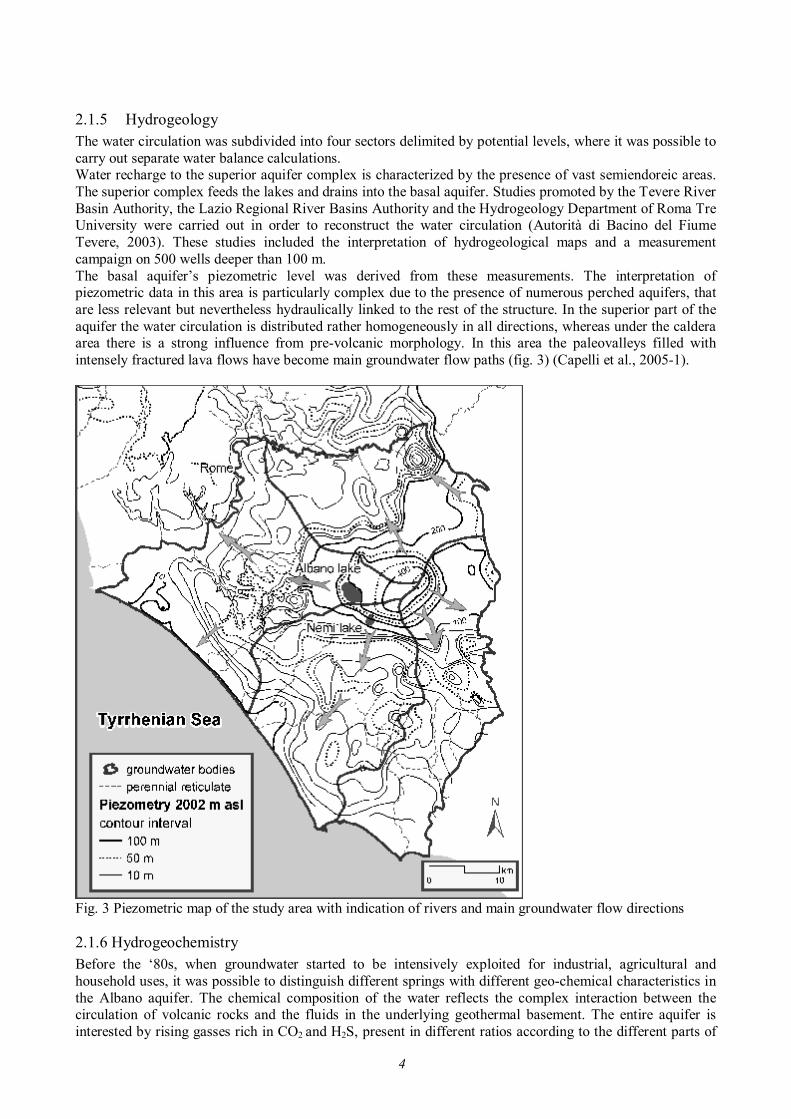
2.1.5 Hydrogeology The water circulation was subdivided into four sectors delimited by potential levels, where it was possible to carry out separate water balance calculations. Water recharge to the superior aquifer complex is characterized by the presence of vast semiendoreic areas. The superior complex feeds the lakes and drains into the basal aquifer. Studies promoted by the Tevere River Basin Authority, the Lazio Regional River Basins Authority and the Hydrogeology Department of Roma Tre University were carried out in order to reconstruct the water circulation (Autorità di Bacino del Fiume Tevere, 2003). These studies included the interpretation of hydrogeological maps and a measurement campaign on 500 wells deeper than 100 m. The basal aquifer’s piezometric level was derived from these measurements. The interpretation of piezometric data in this area is particularly complex due to the presence of numerous perched aquifers, that are less relevant but nevertheless hydraulically linked to the rest of the structure. In the superior part of the aquifer the water circulation is distributed rather homogeneously in all directions, whereas under the caldera area there is a strong influence from pre-volcanic morphology. In this area the paleovalleys filled with intensely fractured lava flows have become main groundwater flow paths (fig. 3) (Capelli et al., 2005-1).
Fig. 3 Piezometric map of the study area with indication of rivers and main groundwater flow directions 2.1.6 Hydrogeochemistry Before the ‘80s, when groundwater started to be intensively exploited for industrial, agricultural and household uses, it was possible to distinguish different springs with different geo-chemical characteristics in the Albano aquifer. The chemical composition of the water reflects the complex interaction between the circulation of volcanic rocks and the fluids in the underlying geothermal basement. The entire aquifer is interested by rising gasses rich in CO2 and H2S, present in different ratios according to the different parts of
5
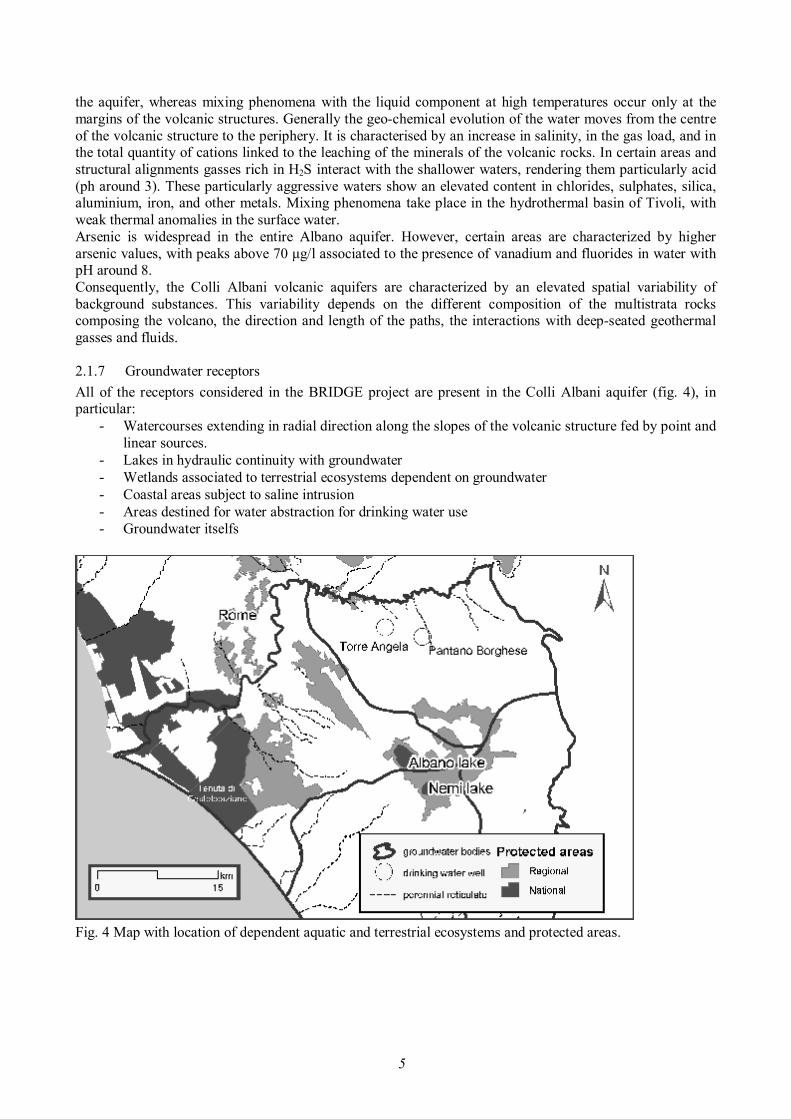
the aquifer, whereas mixing phenomena with the liquid component at high temperatures occur only at the margins of the volcanic structures. Generally the geo-chemical evolution of the water moves from the centre of the volcanic structure to the periphery. It is characterised by an increase in salinity, in the gas load, and in the total quantity of cations linked to the leaching of the minerals of the volcanic rocks. In certain areas and structural alignments gasses rich in H2S interact with the shallower waters, rendering them particularly acid (ph around 3). These particularly aggressive waters show an elevated content in chlorides, sulphates, silica, aluminium, iron, and other metals. Mixing phenomena take place in the hydrothermal basin of Tivoli, with weak thermal anomalies in the surface water. Arsenic is widespread in the entire Albano aquifer. However, certain areas are characterized by higher arsenic values, with peaks above 70 μg/l associated to the presence of vanadium and fluorides in water with pH around 8. Consequently, the Colli Albani volcanic aquifers are characterized by an elevated spatial variability of background substances. This variability depends on the different composition of the multistrata rocks composing the volcano, the direction and length of the paths, the interactions with deep-seated geothermal gasses and fluids. 2.1.7 Groundwater receptors All of the receptors considered in the BRIDGE project are present in the Colli Albani aquifer (fig. 4), in particular:
- Watercourses extending in radial direction along the slopes of the volcanic structure fed by point and linear sources.
- Lakes in hydraulic continuity with groundwater - Wetlands associated to terrestrial ecosystems dependent on groundwater - Coastal areas subject to saline intrusion - Areas destined for water abstraction for drinking water use - Groundwater itselfs
Fig. 4 Map with location of dependent aquatic and terrestrial ecosystems and protected areas.
6
2.2 Identification of pressures 2.2.1 Groundwater abstraction Groundwater abstraction is the main pressure on the Colli Albani aquifer. About 33 000 groundwater abstraction points authorized by permits or attending the issuance of a permit were registered. However, the existence of an equivalent number of not notified permits is presumable. About 20 000 wells are destined for household use, whereas about 10 000 wells are destined for productive uses (agriculture, industry, drinking water). The total volume of abstracted water referred to the entire hydrostructure, comprising all four water bodies, amounts to about 345 milioni m3/year equal to 74% of the natural recharge (mean yearly effective infiltration) (Table 2) (Capelli et al., 2005-1). The total volume of abstracted water is divided in:
- 106 million m3/year of drinking water estimated from data provided by drinking water agencies. - 91 million m3/year for agricultural use, estimated by means of a complex assessment procedure of
the water needs and water availability of the soil. The total water abstraction for irrigation amounts to 2900 l/s equal to 1600 m3 /year per hectare of irrigated surface area.
- 148 million m3/year for industrial use estimated by means of assessment procedures based on the type of productive activity and the number of workers. Water abstraction for industrial purposes amounts to 4696 l/sec.
Table 2 – Water needs for different uses in the Colli Albani hydrostructure
mm/year l/s Mm3/year % of P Base flow in the riverbed (from in situ measurements)
62 3 893 123 8.5
Abstraction for agricultural use 46 2 900 91 6.3 Abstraction for industrial use 75 4 696 148 10.2 Abstraction for drinking water 53 3 347 106 7.3 Total abstraction 174 10 943 345 23.8
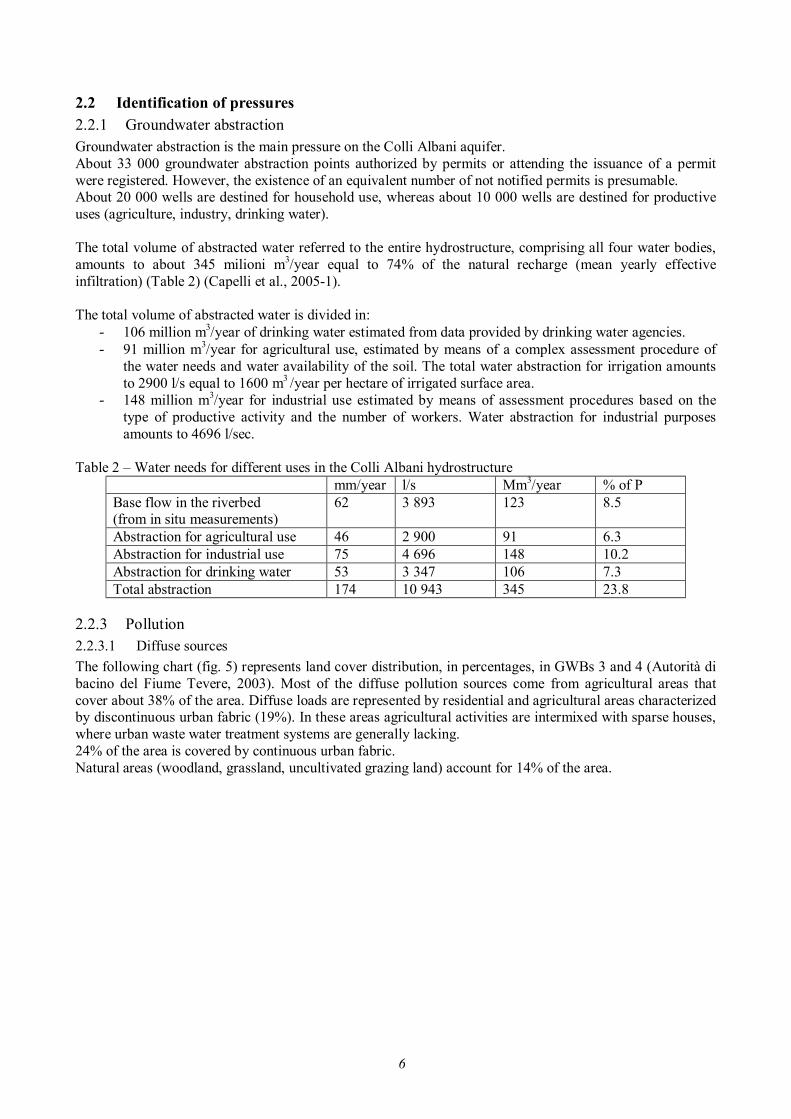
2.2.3 Pollution 2.2.3.1 Diffuse sources The following chart (fig. 5) represents land cover distribution, in percentages, in GWBs 3 and 4 (Autorità di bacino del Fiume Tevere, 2003). Most of the diffuse pollution sources come from agricultural areas that cover about 38% of the area. Diffuse loads are represented by residential and agricultural areas characterized by discontinuous urban fabric (19%). In these areas agricultural activities are intermixed with sparse houses, where urban waste water treatment systems are generally lacking. 24% of the area is covered by continuous urban fabric. Natural areas (woodland, grassland, uncultivated grazing land) account for 14% of the area.
7
Land cover
urban areas 24%
urban and agricultural
mixed areas 14% agricultural
areas 38%
industrial areas 4%
natural areas 19%
water bodies 1%
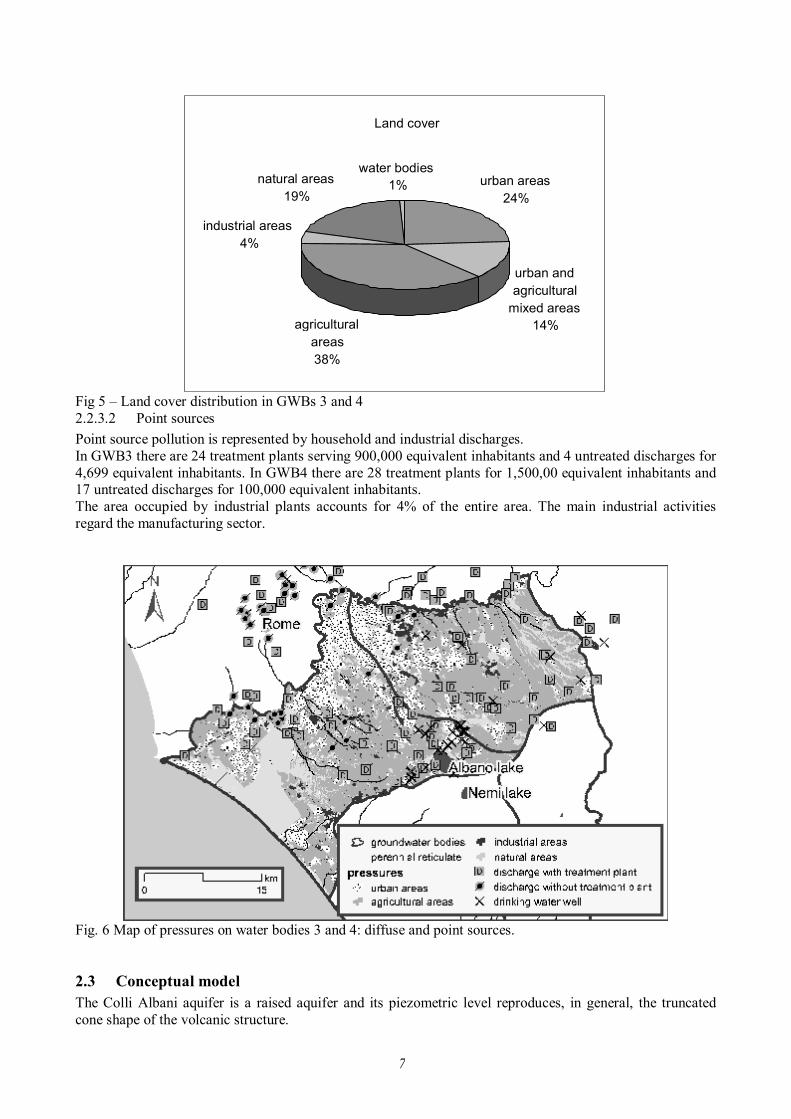
Fig 5 – Land cover distribution in GWBs 3 and 4 2.2.3.2 Point sources Point source pollution is represented by household and industrial discharges. In GWB3 there are 24 treatment plants serving 900,000 equivalent inhabitants and 4 untreated discharges for 4,699 equivalent inhabitants. In GWB4 there are 28 treatment plants for 1,500,00 equivalent inhabitants and 17 untreated discharges for 100,000 equivalent inhabitants. The area occupied by industrial plants accounts for 4% of the entire area. The main industrial activities regard the manufacturing sector.
Fig. 6 Map of pressures on water bodies 3 and 4: diffuse and point sources. 2.3 Conceptual model The Colli Albani aquifer is a raised aquifer and its piezometric level reproduces, in general, the truncated cone shape of the volcanic structure.
8
Intense abstraction not only generated cone-shaped depressions near the water abstraction points (local impacts), but also led to a general lowering of the piezometric level. Aquifer recharge mainly occurs in the top part of the volcanic structure within the caldera. Groundwater circulation develops in radial direction and the outflow feeds the watercourses that extend in radial direction on the slopes of the volcano. Piezometric level lowering and consequent decrease of the base flow reduced the water feeding the watercourses. The water level in the lakes hydraulically connected to the aquifer is subject to a decreasing trend. Also wetlands in the depressions on the slopes of the volcano tend to decrease in extension. Near the coast overpumping causes saline water intrusion from the sea and brackish water intrusion from the Tevere’s delta. 2.4 Existing natural background levels 2.4.1 National/regional method used for deriving natural background levels There are no existing methodologies to derive NBL values at a national or regional level. However, many studies on the characterization of the hydrochemical facies of the Colli Albani aquifers are available. 2.4.2 Monitoring networks (groundwater and surface water) Geochemical studies have been conducted in this study area since the ‘70s with different aims. Results from numerous monitoring campaigns carried out by companies and agencies for geothermal studies, drinking water abstraction, seismic studies and monitoring of protected areas are available. However, currently there is no unified database. Samples and analyses are not homogeneous due to the different sampling methodologies used and to the insufficient number and typology of analysed substances. A new integrated monitoring network for qualitative and quantitative aspects of surface and groundwater circulation is to be implemented in line with the Directive’s requirements and purposes. 2.5 Review of impacts 2.5.1 Effects of abstraction on groundwater quantity The quantitative status of groundwater resources was at the centre of the monitoring campaigns in the ‘70s. Starting from 1997 systematic monitoring of about 2000 wells allowed to reconstruct piezometric level variations due to growing aquifer exploitation in the course of 30 years. The comparison between the piezometric level in the ‘70s and in 2002 shows a substantial variation, especially in the intensely exploited areas. The main consequences are:
- lowering of the water table, - lowering of the level of the lakes (about 3 meters in the Albano lake in the last decade) - 60% reduction of the total base flow in the watercourses: the total discharge in the period 1978-1982
was equal to 4.7 m3/sec, the total discharge in the period 1997-1999 was equal to 2.5 m3/sec - saline intrusion in the coastal areas
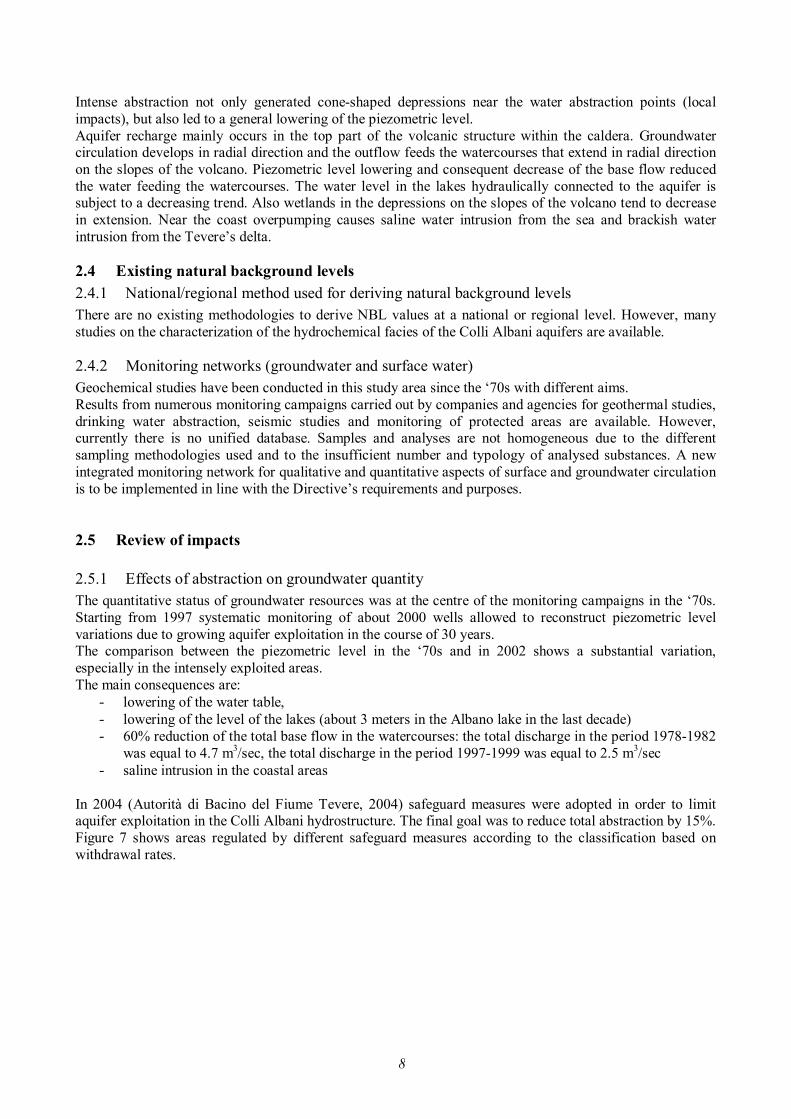
In 2004 (Autorità di Bacino del Fiume Tevere, 2004) safeguard measures were adopted in order to limit aquifer exploitation in the Colli Albani hydrostructure. The final goal was to reduce total abstraction by 15%. Figure 7 shows areas regulated by different safeguard measures according to the classification based on withdrawal rates.
9
Fig.7 - Identification of areas subject to high withdrawal rates and regulated by specific norms for the authorization of surface and groundwater resource use. 2.5.2 Effects of abstraction on groundwater quality The monitored pollutants and substances are fertilizers, plant protection products, biocides. Currently, monitoring data does not show significant values for anthropogenic hazardous substances. The background level of nitrates is generally high in the entire aquifer. In certain areas an upward trend in nitrates concentrations was detected, probably due to anthropogenic activities. It is still not clear whether groundwater abstraction produces the mobilization and diffusion of background substances (for example, As, Va, Fl) in areas of the aquifer where they are not naturally present. 2.5.3 Effects of abstraction on dependent ecosystems Many springs disappeared in the last decades due to the overexploitation of the volcanic aquifers, which also led to a reduction of the base flow in surface watercourses. The main impacts on terrestrial ecosystems dependent on water are variations in the extension of wetlands. Significant variations in macrobenthos associated to a decrease of the flow in the watercourses have not been identified until now, except for the stretches with presence of discharges. However, there has been a general reduction of fish and amphibians. As far as chemical pollution is concerned, it seems that the direct influence of groundwater composition on watercourses is minimum, whereas influence in the opposite direction appears significant. Aquifer lowering produces a reduction of the outflow in the watercourses. The dilution capacity of watercourses is substantially reduced and under certain conditions discharges completely replace base flow. Consequently, groundwater itself becomes the receptor in respect to watercourses, which represent the input. This complex mechanism of interaction that alternates phases in which the aquifer feeds the watercourses to phases in which watercourses feed the aquifer needs to be investigated further in depth as far as the influence on aquatic ecosystems and groundwater itself is concerned.
10
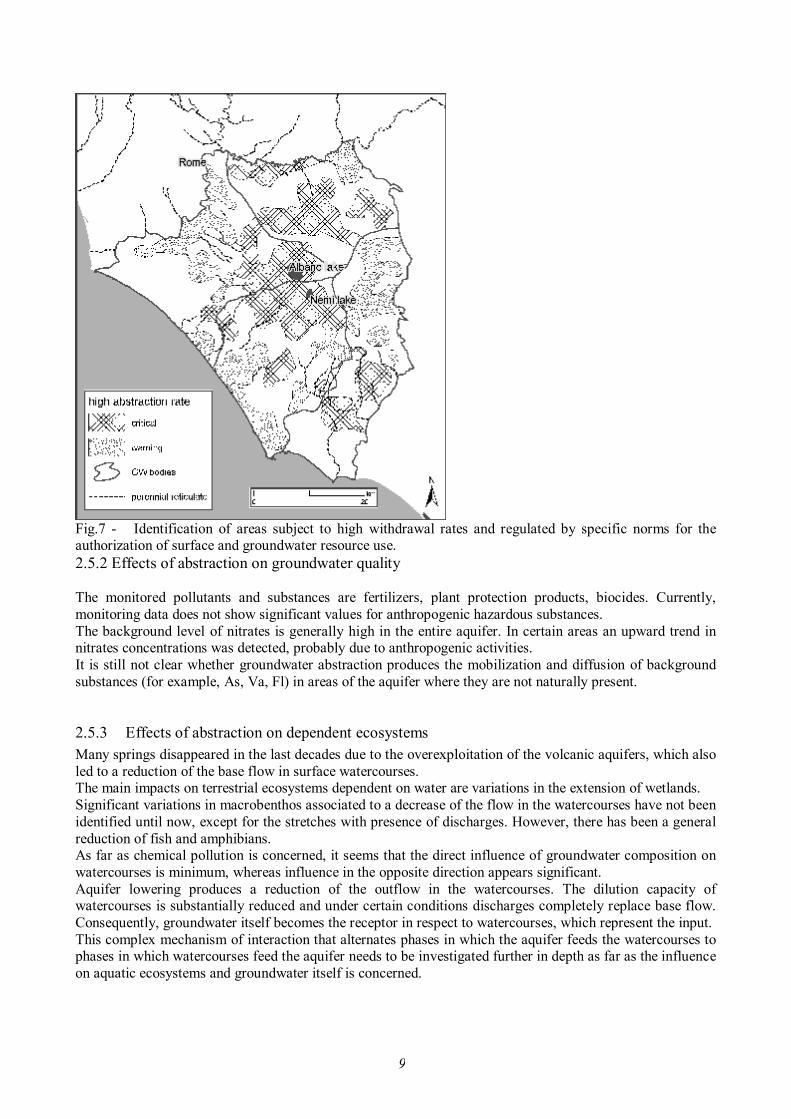
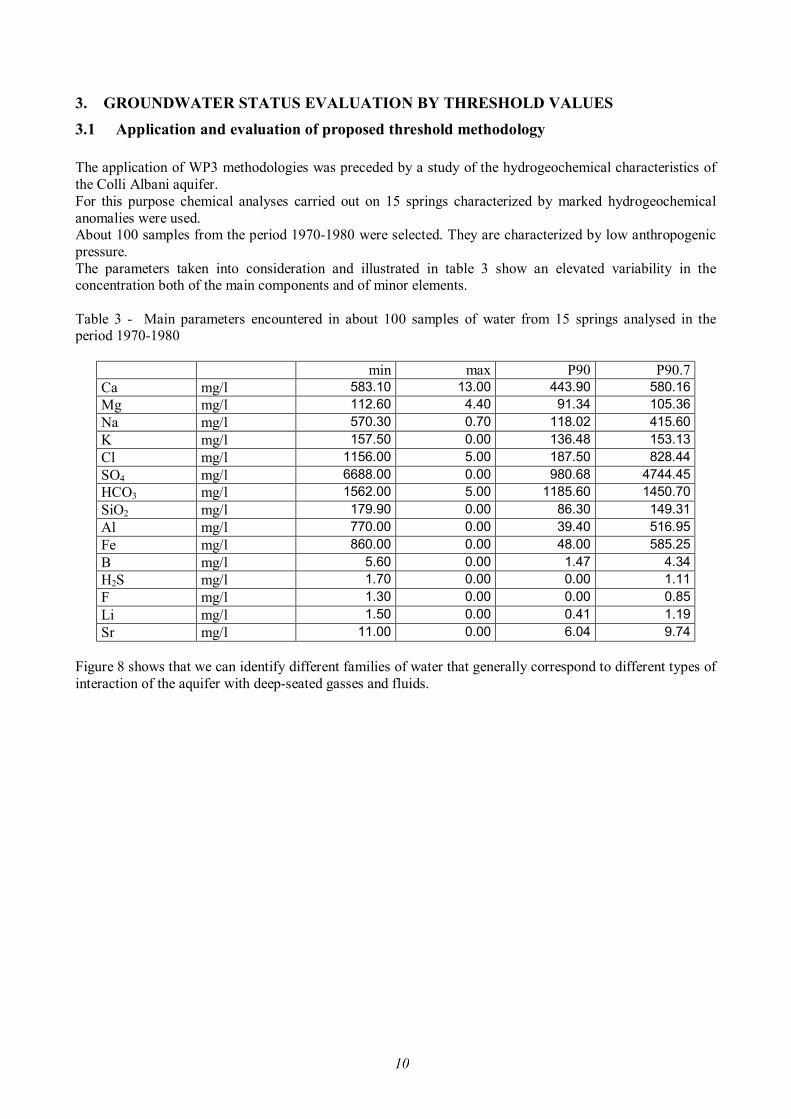
3. GROUNDWATER STATUS EVALUATION BY THRESHOLD VALUES 3.1 Application and evaluation of proposed threshold methodology The application of WP3 methodologies was preceded by a study of the hydrogeochemical characteristics of the Colli Albani aquifer. For this purpose chemical analyses carried out on 15 springs characterized by marked hydrogeochemical anomalies were used. About 100 samples from the period 1970-1980 were selected. They are characterized by low anthropogenic pressure. The parameters taken into consideration and illustrated in table 3 show an elevated variability in the concentration both of the main components and of minor elements. Table 3 - Main parameters encountered in about 100 samples of water from 15 springs analysed in the period 1970-1980
min max P90 P90.7 Ca mg/l 583.10 13.00 443.90 580.16 Mg mg/l 112.60 4.40 91.34 105.36 Na mg/l 570.30 0.70 118.02 415.60 K mg/l 157.50 0.00 136.48 153.13 Cl mg/l 1156.00 5.00 187.50 828.44 SO4 mg/l 6688.00 0.00 980.68 4744.45 HCO3 mg/l 1562.00 5.00 1185.60 1450.70 SiO2 mg/l 179.90 0.00 86.30 149.31 Al mg/l 770.00 0.00 39.40 516.95 Fe mg/l 860.00 0.00 48.00 585.25 B mg/l 5.60 0.00 1.47 4.34 H2S mg/l 1.70 0.00 0.00 1.11 F mg/l 1.30 0.00 0.00 0.85 Li mg/l 1.50 0.00 0.41 1.19 Sr mg/l 11.00 0.00 6.04 9.74
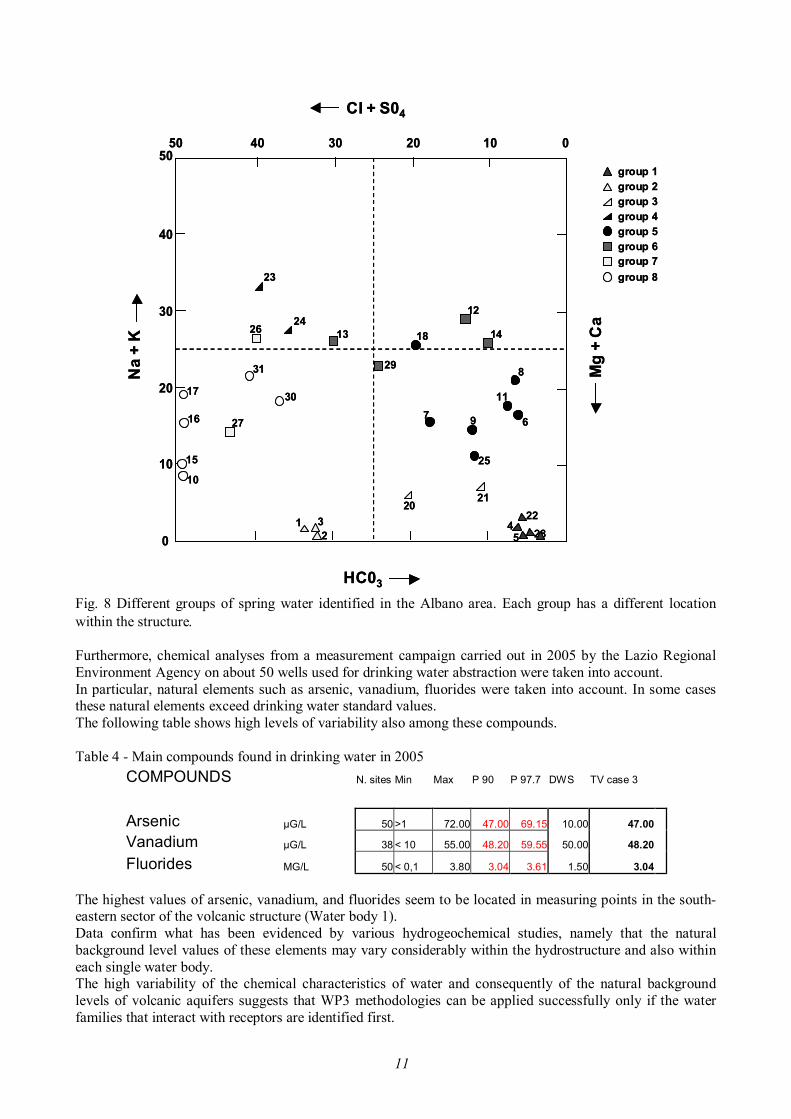
Figure 8 shows that we can identify different families of water that generally correspond to different types of interaction of the aquifer with deep-seated gasses and fluids.
11
45
2228
1 32
2120
23
2418
8
11
697
25
13
29
12
1426
31
3017
16
15
10
27
HC03
CI + S04
Na
+ K
Mg
+ C
a
0
10
20
30
40
5040 30 20 10 050
45
2228
1 32
2120
23
2418
8
11
697
25
13
29
12
1426
31
3017
16
15
10
27
HC03
CI + S04
Na
+ K
Mg
+ C
a
0
10
20
30
40
5040 30 20 10 050
group 1group 2group 3group 4group 5group 6group 7group 8
group 1group 2group 3group 4group 5group 6group 7group 8
Fig. 8 Different groups of spring water identified in the Albano area. Each group has a different location within the structure. Furthermore, chemical analyses from a measurement campaign carried out in 2005 by the Lazio Regional Environment Agency on about 50 wells used for drinking water abstraction were taken into account. In particular, natural elements such as arsenic, vanadium, fluorides were taken into account. In some cases these natural elements exceed drinking water standard values. The following table shows high levels of variability also among these compounds. Table 4 - Main compounds found in drinking water in 2005
COMPOUNDS N. sites Min Max P 90 P 97.7 DWS TV case 3
Arsenic μG/L 50 >1 72.00 47.00 69.15 10.00 47.00
Vanadium μG/L 38 < 10 55.00 48.20 59.55 50.00 48.20
Fluorides MG/L 50 < 0,1 3.80 3.04 3.61 1.50 3.04 The highest values of arsenic, vanadium, and fluorides seem to be located in measuring points in the south-eastern sector of the volcanic structure (Water body 1). Data confirm what has been evidenced by various hydrogeochemical studies, namely that the natural background level values of these elements may vary considerably within the hydrostructure and also within each single water body. The high variability of the chemical characteristics of water and consequently of the natural background levels of volcanic aquifers suggests that WP3 methodologies can be applied successfully only if the water families that interact with receptors are identified first.
12
The following steps were carried out in this case study: § mapping of the hydrochemical characteristics of water in the entire aquifer § mapping of the receptors § description of receptor-groundwater body interaction § selection of EQS values that can be associated to the receptors § identification of NBL values of groundwater that interact with the receptor § identification of significant parameters that may cause variations in the receptor § application of WP3 methodologies for threshold identification
This approach requires that for each receptor the type of interaction with groundwater, the EQS values to take into account and the natural background levels of local groundwater that interact with the receptor are known. Threshold values are calculated only for parameters that cause negative impacts on the receptor and show growing trends in respect to the natural background values. At present, there is not sufficient data to produce a detailed map of the chemical characteristics of the entire Colli Albani aquifer. Therefore, the identification of threshold values was carried out starting from each receptor in relation to available data. In particular, WP3 methodologies were applied to two specific areas: § a groundwater abstraction area destined for drinking water use (Salone-Acqua Vergine area)
§ saline intrusion near the protected area of Castelporziano
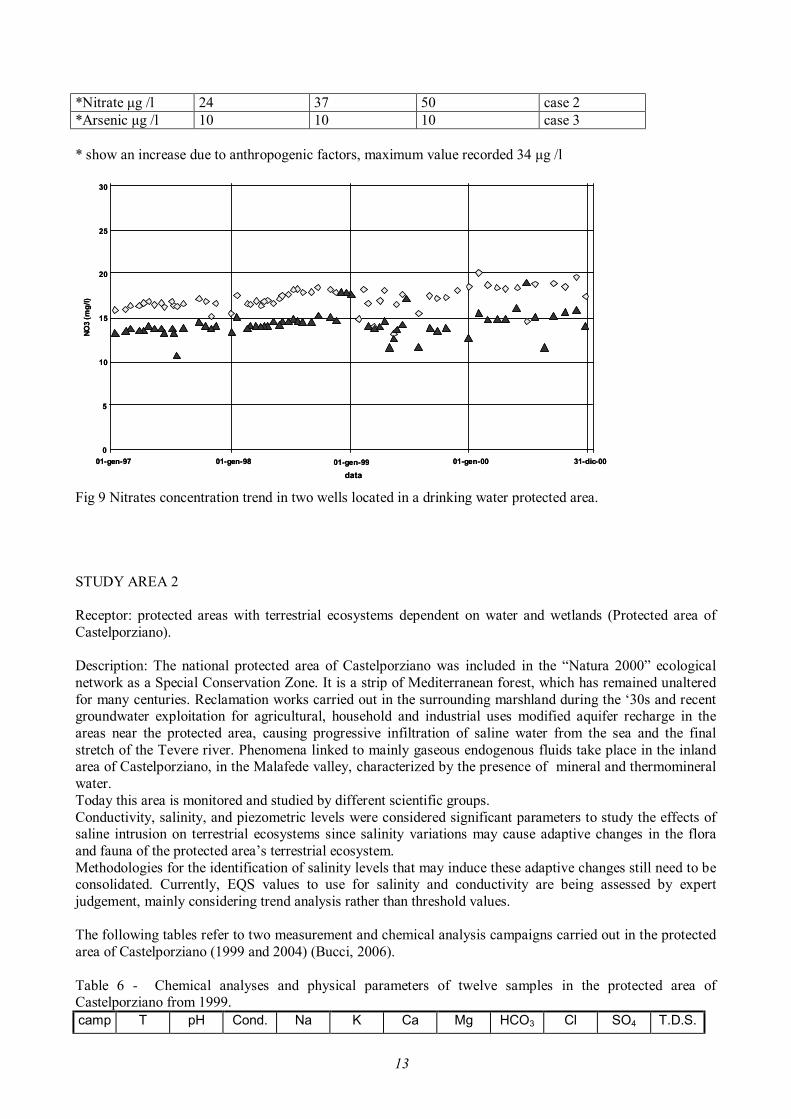
STUDY AREA 1 Receptor: protected areas for drinking water use (Salone- Acqua Vergine area) Description: The study area is a protected area for groundwater abstraction for drinking water use. There are four main abstraction points altogether which supply a total of 600 l/s. Monitoring activities are carried out mainly by water supply agencies and consist in about 2000 samples from 1992 to 2005. In 2001 a campaign was launched to analyse the hydrogeochemical composition of the water circulation feeding the springs and wells in water abstraction points for drinking water supply (Acea Ato2 spa, 2001). 18 regularly sampled monitoring points were identified. The considered EQS values are drinking water standards (DIR 98/83/EC). Time-series analysis of parameters such as Ca Mg, SO4, Na, Cl , Si, Fe, Va, Li, B, NH4+, As show fluctuations around a central value that remains constant. This can be ascribed to seasonal fluctuations or to analytical variability. The NO3 parameter was considered significant in respect to the impact on the receptor due to its significant upward trend, probably due to anthropogenic pressures (see fig. 9). The trend analysis from 1997 shows an increase in some wells of the nitrates value, that reaches 30 μg /l in this specific area, probably consequently to anthropogenic factors. NBL values of the chemical compounds were derived from 90th percentile calculations of analyses carried out on six monitoring points in 1997. Arsenic is another significant parameter in regard to the nature of the receptor. It fluctuates between 5 and 10 μg/l and does not show significant trends. The background levels derived from the statistical analysis of As and NO3 are represented in the following table. Table 5 – Nitrates and arsenic threshold values in the drinking water protected area of Salone-Acqua Vergine. Parameter NBL Bridge TV Drinking Water
Standards
13
*Nitrate μg /l 24 37 50 case 2 *Arsenic μg /l 10 10 10 case 3 * show an increase due to anthropogenic factors, maximum value recorded 34 μg /l
01-gen-97 01-gen-98 01-gen-99 01-gen-00 31-dic-00
data
0
5
10
15
20
25
30
NO3
(mg/
l)
01-gen-97 01-gen-98 01-gen-99 01-gen-00 31-dic-00
data
0
5
10
15
20
25
30
NO3
(mg/
l)
Fig 9 Nitrates concentration trend in two wells located in a drinking water protected area. STUDY AREA 2 Receptor: protected areas with terrestrial ecosystems dependent on water and wetlands (Protected area of Castelporziano). Description: The national protected area of Castelporziano was included in the “Natura 2000” ecological network as a Special Conservation Zone. It is a strip of Mediterranean forest, which has remained unaltered for many centuries. Reclamation works carried out in the surrounding marshland during the ‘30s and recent groundwater exploitation for agricultural, household and industrial uses modified aquifer recharge in the areas near the protected area, causing progressive infiltration of saline water from the sea and the final stretch of the Tevere river. Phenomena linked to mainly gaseous endogenous fluids take place in the inland area of Castelporziano, in the Malafede valley, characterized by the presence of mineral and thermomineral water. Today this area is monitored and studied by different scientific groups. Conductivity, salinity, and piezometric levels were considered significant parameters to study the effects of saline intrusion on terrestrial ecosystems since salinity variations may cause adaptive changes in the flora and fauna of the protected area’s terrestrial ecosystem. Methodologies for the identification of salinity levels that may induce these adaptive changes still need to be consolidated. Currently, EQS values to use for salinity and conductivity are being assessed by expert judgement, mainly considering trend analysis rather than threshold values. The following tables refer to two measurement and chemical analysis campaigns carried out in the protected area of Castelporziano (1999 and 2004) (Bucci, 2006). Table 6 - Chemical analyses and physical parameters of twelve samples in the protected area of Castelporziano from 1999. camp T pH Cond. Na K Ca Mg HCO3 Cl SO4 T.D.S.
14
°C mS/cm mg/l mg/l mg/l mg/l mg/l mg/l mg/l mg/l F2 18.0 6.7 1.95 144.0 14.8 194.0 54.5 888.0 204.0 40.7 1540.0 F3 17.7 6.6 0.87 87.0 9.2 39.0 24.8 403.0 85.1 0.2 648.0 E1 17.6 7.3 1.14 54.0 3.7 123.0 36.5 481.0 76.4 64.5 839.0 E2 16.6 7.2 0.79 40.0 5.4 92.0 12.3 422.0 45.1 29.2 646.0 E3 18.1 7 1.04 108.0 4.3 90.0 10.8 407.0 114.0 40.1 775.0 E4 15.9 6.9 0.99 40.0 4.4 113.0 25.0 505.0 66.7 34.0 788.0 E7 16.8 6.6 0.34 38.0 8.8 16.0 3.7 169.0 17.9 13.2 267.0 E8 17.2 6.1 1.26 67.0 5.6 135.0 31.0 533.0 146.0 37.0 955.0 E11 16.0 6.8 0.98 54.0 2.0 124.0 22.7 565.0 48.0 30.4 846.0 E26 15.5 6.6 1.44 76.0 6.6 149.0 35.0 537.0 186.4 33.6 1023.0 E27 17.2 7.7 1.05 75.0 32.4 69.0 39.3 470.0 86.0 54.0 825.0 C1 17.9 6.9 1.12 56.0 3.4 100.0 34.7 497.0 86.3 52.4 829.0 min 15.5 6.1 0.34 38.0 2.0 16.0 3.7 169.0 17.9 0.2 267.0 max 18.1 7.7 1.95 144.0 32.4 194.0 54.5 888.0 204.0 64.5 1540.0 med 17.0 6.9 1.08 69.9 8.4 103.7 27.5 489.8 96.8 35.8 831.8 P10 15.9 6.6 0.80 40.0 3.4 42.0 11.0 403.4 45.4 14.8 646.2 P50 17.2 6.9 1.05 61.5 5.5 106.5 28.0 489.0 85.6 35.5 827.0 P90 18.0 7.3 1.28 79.2 11.2 136.4 36.8 539.8 150.0 55.1 961.8 P97.7 18.1 7.6 1.40 101.4 27.5 146.1 38.7 559.2 178.0 62.3 1008.9 Table 7- Chemical analyses and physical parameters of twelve samples in the protected area of Castelporziano from 2004.
T pH Cond. Ca K Mg Na HCO3 Cl SO4 T.D.S. °C mS/cm mg/l mg/l mg/l mg/l mg/l mg/l mg/l mg/l
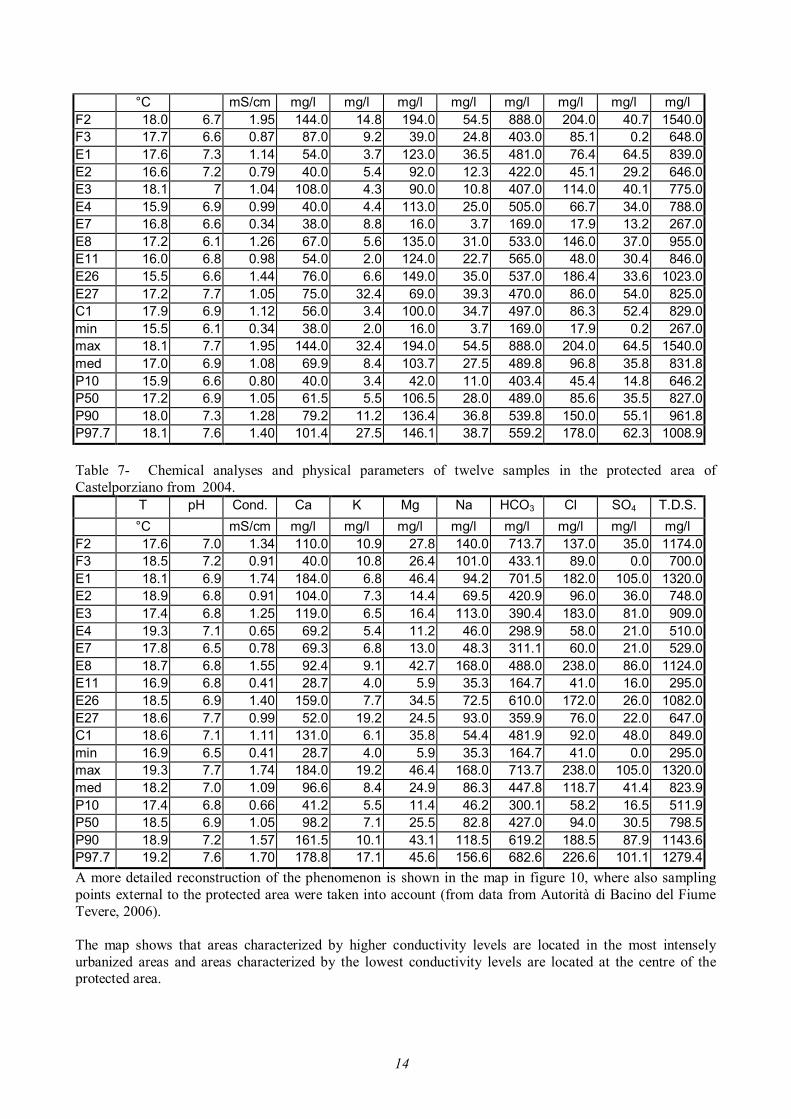
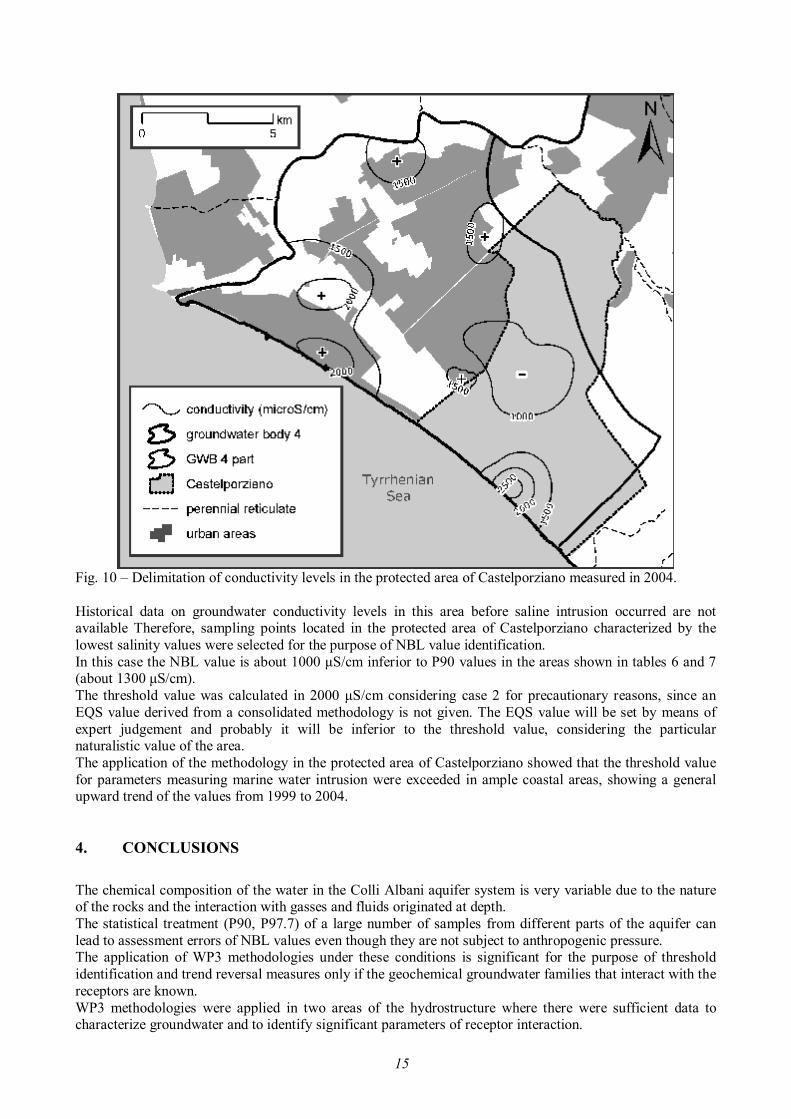
F2 17.6 7.0 1.34 110.0 10.9 27.8 140.0 713.7 137.0 35.0 1174.0 F3 18.5 7.2 0.91 40.0 10.8 26.4 101.0 433.1 89.0 0.0 700.0 E1 18.1 6.9 1.74 184.0 6.8 46.4 94.2 701.5 182.0 105.0 1320.0 E2 18.9 6.8 0.91 104.0 7.3 14.4 69.5 420.9 96.0 36.0 748.0 E3 17.4 6.8 1.25 119.0 6.5 16.4 113.0 390.4 183.0 81.0 909.0 E4 19.3 7.1 0.65 69.2 5.4 11.2 46.0 298.9 58.0 21.0 510.0 E7 17.8 6.5 0.78 69.3 6.8 13.0 48.3 311.1 60.0 21.0 529.0 E8 18.7 6.8 1.55 92.4 9.1 42.7 168.0 488.0 238.0 86.0 1124.0 E11 16.9 6.8 0.41 28.7 4.0 5.9 35.3 164.7 41.0 16.0 295.0 E26 18.5 6.9 1.40 159.0 7.7 34.5 72.5 610.0 172.0 26.0 1082.0 E27 18.6 7.7 0.99 52.0 19.2 24.5 93.0 359.9 76.0 22.0 647.0 C1 18.6 7.1 1.11 131.0 6.1 35.8 54.4 481.9 92.0 48.0 849.0 min 16.9 6.5 0.41 28.7 4.0 5.9 35.3 164.7 41.0 0.0 295.0 max 19.3 7.7 1.74 184.0 19.2 46.4 168.0 713.7 238.0 105.0 1320.0 med 18.2 7.0 1.09 96.6 8.4 24.9 86.3 447.8 118.7 41.4 823.9 P10 17.4 6.8 0.66 41.2 5.5 11.4 46.2 300.1 58.2 16.5 511.9 P50 18.5 6.9 1.05 98.2 7.1 25.5 82.8 427.0 94.0 30.5 798.5 P90 18.9 7.2 1.57 161.5 10.1 43.1 118.5 619.2 188.5 87.9 1143.6 P97.7 19.2 7.6 1.70 178.8 17.1 45.6 156.6 682.6 226.6 101.1 1279.4 A more detailed reconstruction of the phenomenon is shown in the map in figure 10, where also sampling points external to the protected area were taken into account (from data from Autorità di Bacino del Fiume Tevere, 2006). The map shows that areas characterized by higher conductivity levels are located in the most intensely urbanized areas and areas characterized by the lowest conductivity levels are located at the centre of the protected area.
15
Fig. 10 – Delimitation of conductivity levels in the protected area of Castelporziano measured in 2004. Historical data on groundwater conductivity levels in this area before saline intrusion occurred are not available Therefore, sampling points located in the protected area of Castelporziano characterized by the lowest salinity values were selected for the purpose of NBL value identification. In this case the NBL value is about 1000 μS/cm inferior to P90 values in the areas shown in tables 6 and 7 (about 1300 μS/cm). The threshold value was calculated in 2000 μS/cm considering case 2 for precautionary reasons, since an EQS value derived from a consolidated methodology is not given. The EQS value will be set by means of expert judgement and probably it will be inferior to the threshold value, considering the particular naturalistic value of the area. The application of the methodology in the protected area of Castelporziano showed that the threshold value for parameters measuring marine water intrusion were exceeded in ample coastal areas, showing a general upward trend of the values from 1999 to 2004. 4. CONCLUSIONS The chemical composition of the water in the Colli Albani aquifer system is very variable due to the nature of the rocks and the interaction with gasses and fluids originated at depth. The statistical treatment (P90, P97.7) of a large number of samples from different parts of the aquifer can lead to assessment errors of NBL values even though they are not subject to anthropogenic pressure. The application of WP3 methodologies under these conditions is significant for the purpose of threshold identification and trend reversal measures only if the geochemical groundwater families that interact with the receptors are known. WP3 methodologies were applied in two areas of the hydrostructure where there were sufficient data to characterize groundwater and to identify significant parameters of receptor interaction.
16
A general lowering of the piezometric level is visible due to intense water abstraction. Therefore, quantitative recovery is the first objective of the programme of measures to be adopted by the Management Plan of the Directive 2000/60/EC. The Colli Albani aquifer is currently subject to safeguard measures aimed at limiting abstraction permits in critical areas where there are concentrated withdrawals. references Acea Ato2 spa, 2001. Proposta di aree di salvaguardia. (Unpublished report), Roma. Autorità di Bacino del Fiume Tevere, Autorità dei Bacini Regionali del Lazio, Regione Lazio, 2003. Studi idrogeologici per la definizione degli strumenti necessari alla redazione dei piani stralcio relativi agli acquiferi vulcanici del territorio della Regione Lazio. (Unpublished report), Roma. Autorità di Bacino del Fiume Tevere, 2004. Misure di salvaguardia nel bacino del fiume Tevere tra Castel Giubileo e la foce. Gazzetta Ufficiale della repubblica Italiana, 89, 14. Autorità di Bacino del Fiume Tevere, 2006. Studi idrogeologici per la definizione degli strumenti necessari alla redazione del piano stralcio per l’uso compatibile delle risorse idriche sotterranee nell’ambito degli acquiferi del delta del Tevere. (Unpublished report), Roma. Bucci M., 2006. Stato delle risorse idriche, Il sistema ambientale della tenuta presidenziale di Castelporziano. Accademia Nazionale delle Scienze detta dei Quaranta, Scritti e documenti XXVII, 327-387 Capelli G, Mazza R., Gazzetti C., 2005. Strumenti e strategie per la tutela e l’uso compatibile della risorsa idrica del Lazio. Gli acquiferi vulcanici. Pitagora editrice, Bologna Capelli G, Mazza R., 2005. Water criticality in the Colli Albani (Rome, Italy). Giornale di Geologia, 1, 263-273 Giordano G., Mazza R., Cecili A., Capelli G., De Rita D. Bigi G. &, Rodani. S., 2000. Cities on volcanoes: groundwater resources and management in a highly populated volcanic region. A GIS in the Colli Albani region, Rome, Italy. Journal of the Nepal Geological Society, 22, 315-326, Kathmandu, Nepal.