Embed Size (px)
Citation preview
PNNL-13047
Groundwater Monitoring Plan for the 216-A-29 Ditch M. D. Sweeney September 1999 Prepared for the U.S. Department of Energy under Contract DE-AC06-76RLO 1830
DISCLAIMER This report was prepared as an account of work sponsored by an agency of the United States Government. Reference herein to any specific commercial product, process, or service by trade name, trademark, manufacturer, or otherwise does not necessarily constitute or imply its endorsement, recommendation, or favoring by the United States Government or any agency thereof, or Battelle Memorial Institute.
PACIFIC NORTHWEST NATIONAL LABORATORY operated by BATTELLE
for the UNITED STATES DEPARTMENT OF ENERGY
under Contract DE-AC06-76RL01830
Printed in the United States of America
Available to DOE and DOE contractors from the Office of Scientific and Technical Information, P.O. Box 62, Oak Ridge, TN 37831;
prices available from (615) 576-8401.
Available to the public from the National Technical Information Service, U.S. Department of Commerce, 5285 Port Royal Rd., Springfield, VA 22161
This document was printed on recycled paper.
PNNL-13047
Groundwater Monitoring Plan for the 216-A-29 Ditch M. D. Sweeney September 1999 Prepared for the U.S. Department of Energy under Contract DE-AC06-76RLO 1830 Pacific Northwest National Laboratory Richland, Washington 99352
iii
Summary This document presents a groundwater monitoring plan, under Resource Conservation and Recovery Act of 1976 (RCRA) regulatory requirements found in WAC 173-303-400, and by reference, require-ments in 40 CFR 265.93 (d)(6) for the 216-A-29 Ditch (A-29 Ditch) in the Hanford Site's 200 East Area. The objectives of this monitoring plan are to determine whether any hazardous constituents are detectable in the groundwater beneath the ditch. The groundwater monitoring network described in this plan includes 10 RCRA-compliant wells to monitor the aquifer in the immediate vicinity of the A-29 Ditch. Groundwater assessment activities have been conducted at the A-29 Ditch, the result of elevated specific conductivity and total organic halogens (TOX). A groundwater assessment report (Votava 1995) found that no hazardous constituents had impacted groundwater and the site returned to interim-status indicator-parameter/detection monitoring. This plan describes the process and quality objectives for conducting the indicator-parameter program. The site will be sampled semiannually for indicator parameters including pH, specific conductance, TOX, and total organic carbon. Site-specific parameters include tritium and ICP metals. These consti-tuents, as well as anions, alkalinity, and turbidity will be sampled annually. Groundwater elevations will be recorded semiannually.
v
Contents Summary ............................................................................................................................................ iii 1.0 Introduction ............................................................................................................................... 1.1 2.0 Description of the 216-A-29 Ditch ............................................................................................ 2.1 3.0 Hydrogeology ............................................................................................................................ 3.1 3.1 Physical Hydrogeology ..................................................................................................... 3.1 3.2 Summary of Groundwater Monitoring Results ................................................................. 3.1 4.0 Conceptual Model...................................................................................................................... 4.1 5.0 Groundwater Monitoring Program ............................................................................................ 5.1 5.1 Objectives.......................................................................................................................... 5.1 5.2 Sampling and Analysis Plan.............................................................................................. 5.1 5.2.1 Monitoring Well Network...................................................................................... 5.1 5.2.2 Constituent List and Sampling Frequency ............................................................. 5.5 5.2.3 Network Evaluation................................................................................................ 5.5 5.3 Sampling and Analysis Protocol ....................................................................................... 5.6 5.4 Quality Assurance and Quality Control ............................................................................ 5.7 6.0 Data Management, Evaluation, and Reporting.......................................................................... 6.1 6.1 Data Management ............................................................................................................. 6.1 6.2 Interpretation ..................................................................................................................... 6.1 6.3 Statistical Evaluation......................................................................................................... 6.2 6.4 Reporting........................................................................................................................... 6.3 7.0 Outline for Groundwater Assessment Monitoring Program...................................................... 7.1 8.0 References ................................................................................................................................. 8.1
vi
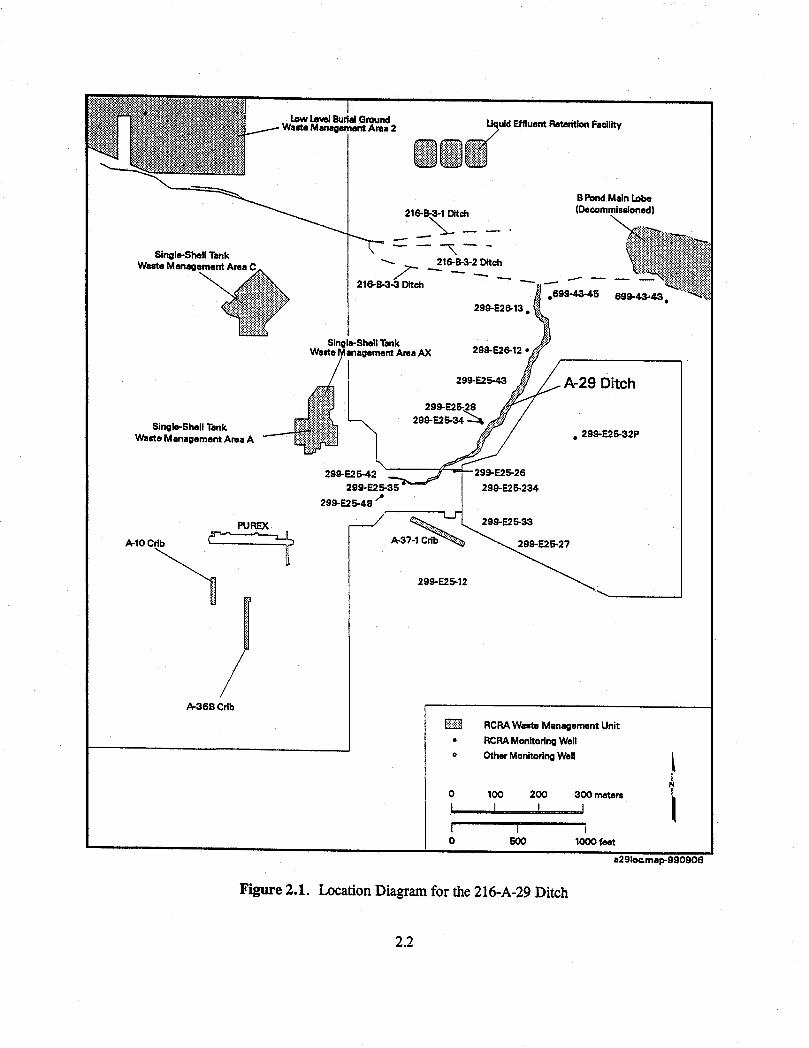
Figures 2.1 Location Diagram for the 216-A-29 Ditch ................................................................................ 2.2 3.1 Water Table Contours Near the 216-A-29 Ditch for June 1998................................................ 3.2 3.2 Hydrograph for Selected 216-A-29 Wells ................................................................................. 3.3 3.3 Groundwater Comparison for Well 299-E25-35 ....................................................................... 3.5 4.1 Conceptual Model of Effluent Infiltration Within a Ditch/Pond System .................................. 4.2 4.2 Cross Section Parallel to the 216-A-29 Ditch............................................................................ 4.3 5.1 MEMO Results for the 216-A-29 Ditch .................................................................................... 5.2 5.2 Schematic Diagram of a Typical RCRA Shallow Monitoring Well ......................................... 5.3
Tables 5.1 Locations, Depths, and Screened Intervals for Groundwater Monitoring Wells Around the 216-A-29 Ditch.................................................................................................................... 5.4 5.2 Constituent List for the A-29 Ditch ........................................................................................... 5.5 6.1 Critical Mean Values for the 216-A-29 Ditch ........................................................................... 6.3 6.2 Reports Required for Compliance with 40 CFR 265, Subpart F, for Groundwater Monitoring........................................................................................................... 6.4 7.1 Outline for Groundwater Quality Assessment Monitoring Plan ............................................... 7.1
1.1
1.0 Introduction This document presents a revision to the groundwater monitoring plan (Kasza and Goodwin 1991) for the 216-A-29 Ditch Facility (A-29 Ditch). The groundwater monitoring plan is based on requirements for interim-status facilities, as defined by the Resource Conservation and Recovery Act of 1976 (RCRA) and amended by the Hazardous and Solid Waste Amendments of 1984. These regulations are promulgated by the Washington Department of Ecology (Ecology) in Washington Administrative Code (WAC) 173-303-400 and by reference, 40 CFR 265, Subpart F. Groundwater monitoring began at the A-29 Ditch in November 1988. Under RCRA interim-status, the A-29 Ditch required a detection-level groundwater monitoring program because it received waste-water from the Plutonium Uranium Extraction (PUREX) Plant. In the past, this wastewater contained hazardous waste and materials. Discharges to the A-29 Ditch were discontinued on July 15, 1991. In 1990, specific conductance in downgradient well 299-E25-35 was reported above background (i.e., upgradient) levels. A groundwater quality assessment program was initiated at the site (Chou et al. 1990). The assessment program found no evidence that hazardous waste or hazardous waste constituents from the A-29 Ditch have entered the groundwater (Votava 1995). The groundwater monitoring program at the A-29 Ditch will revert to an indicator parameter monitoring program, as described in 40 CFR 265.93(d)(6). The purpose of this plan is to present an indicator evaluation groundwater monitoring program that will detect adverse impacts of the A-29 Ditch on the quality of the groundwater in the uppermost aquifer beneath the facility (40 CFR 265.93[d]). This plan describes the methods that will be used to determine whether any hazardous constituents are detectable in the groundwater beneath the ditch. Upgradient wells and downgradient wells will be monitored semiannually for indicator parameters and annually for the constituents described in Section 5.2.2. This document contains the same well and constituent lists as the assessment report appendix (Votava 1995), but includes additional detail about the sampling and analysis protocol, data management, and statistics. The A-29 Ditch is within the 200-PO-5 Source Operable Unit. The Environmental Restoration Contractor (ERC), Bechtel Hanford Incorporated (BHI), is responsible for submitting the closure plan to the U.S. Department of Energy (DOE). Once the plan is accepted by Ecology, BHI will proceed until the unit is designated closed. Final disposition of the A-29 Ditch will be outlined in the post-closure agreement negotiated between DOE and Ecology.
2.1
2.0 Description of the 216-A-29 Ditch The A-29 Ditch is an artificial earthen ditch approximately 1.8 m wide and 1,097 m long that was used from 1955 to 1991. The depth of the ditch varies from 0.6 to 0.9 m at the south end to approxi-mately 5 m at the north end. The point of discharge to the ditch was approximately 274 m west of the east perimeter fenceline of the 200 East Area. The ditch passed beneath the fence and ran northeast to the 216-B-3-3 Ditch, which discharged to the 216-B-3 Pond. All discharges to the ditch originated within the 200 East perimeter fence and came from the PUREX chemical sewer line (CSL). Flow from the CSL was continuous, with the volume discharged ranging from 950 to 4,164 L/min. The average flow was about 3,671 L/min. An unknown amount of effluent flowing in the ditch infiltrated the soil along the course of the ditch. The A-29 Ditch was put into service in November 1955. The A-29 Ditch initially discharged to the 216-B-3-1 Ditch (Figure 2.1). When the 216-B-3-1 Ditch was retired in 1964, the A-29 Ditch was shortened and discharged to the 216-B-3-2 Ditch. The 216-B-3-2 Ditch was retired in 1970. As a result, the A-29 Ditch was rerouted and discharged to the 216-B-3-3 Ditch until 1991 when discharges ceased. The A-29 Ditch received intermittent batches of potentially hazardous spilled chemical materials and/or off-specification process chemicals. Kasza and Goodwin (1991) provides a complete inventory of materials discharged to the A-29 Ditch. The most significant chemical discharges included periodic corrosive effluents that were discharged from the plant demineralizer regeneration system. The dis-charges of sodium hydroxide and sulfuric acid solutions from demineralizer operations occurred daily from 1955 until February 1986. The results of PUREX CSL effluent analyses for hazardous and radioactive components are given in Jungfleisch (1988). Additional analysis data is published in the Liquid Effluent Study Final Project Report (WHC 1990). Waste stream constituents for the A-29 Ditch include nitrate, tritium, and dissolved metals.
3.1
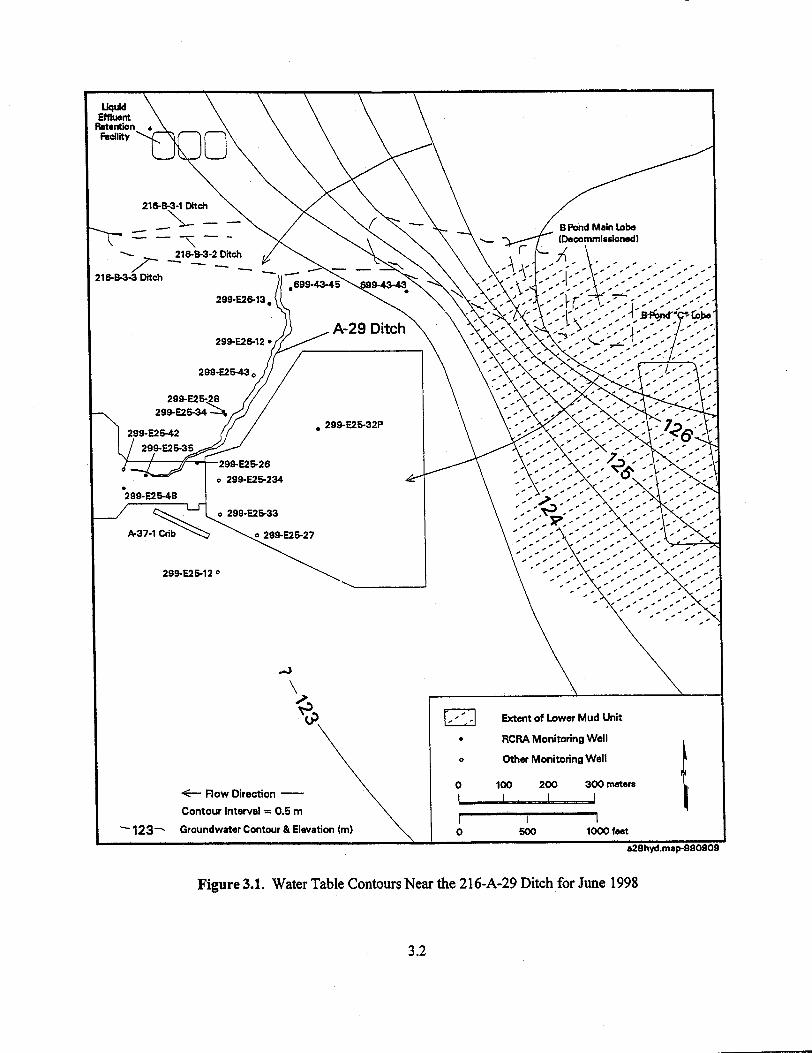
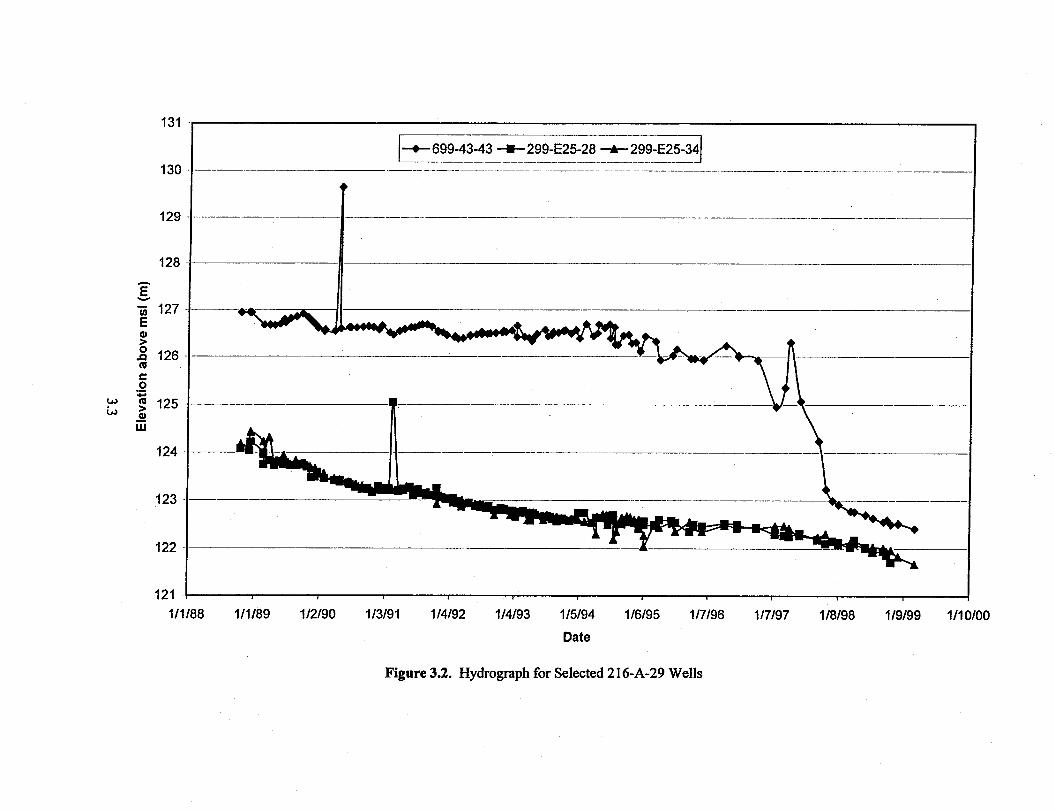
3.0 Hydrogeology The geology and hydrology of the A-29 Ditch are described in detail by Kasza and Goodwin (1991) and in compilation reports on the 200 East Area (e.g., Lindsey et al. 1992). The following summary is taken from those documents. 3.1 Physical Hydrogeology The uppermost aquifer beneath the A-29 Ditch is unconfined and occurs within the undifferentiated Hanford/Ringold formations. According to as-built diagrams, existing shallow wells in the A-29 Ditch monitoring network are completed within a silty sand to gravelly sand unit. The water-table elevation near and beneath the A-29 Ditch is approximately 122 m above mean sea level. Perched water conditions were observed during drilling near the northern end of the A-29 Ditch at well 699-43-45. Water was encountered from approximately 13 to 14 m below land surface. The confining layer appeared to be a thin silty sand lens at 15 m below ground surface. It is unknown whether perched water conditions continue to exist since termination of discharge to the A-29 Ditch and B Pond. On a local scale, groundwater moves radially outward from a groundwater high beneath B Pond, which lies directly northeast of A-29 Ditch. This groundwater mound is evident in the water table map, Figure 3.1. Within the A-29 Ditch area, the direction of groundwater flow is generally from northeast to southwest across the ditch at approximately 240oW. Figure 3.2 illustrates the water-level elevation in June 1998 from wells in the vicinity of the A-29 Ditch. The saturated thickness of the unconfined aquifer beneath the A-29 Ditch ranges from approximately 2 m in well 699-43-45 to approximately 24 m in well 299-E25-28. As in other RCRA project areas in the 200 East Area (Sweeney 1997), the A-29 Ditch has experi-enced a significant decline in water table elevation. This decline is attributed to a cessation in discharges to the 216-B-3 Pond System. Changes in flow direction, a result of the subsequent decline in water level, has also been observed near the A-29 Ditch. Projections of groundwater flow directions over a 200-year period indicate that the B Pond mound will have dissipated enough for the entire 200 Areas Plateau to revert to the pre-Hanford water table (Thorne and Wurstner 1998). A gradual shift of flow direction to the south is expected at the A-29 Ditch. Tritium plume data from a variety of sources (e.g., Johnson 1993) suggest that a southeasterly component may exist near the southeast corner of the 200 East Area. An estimate of the average linear groundwater velocity near the A-29 Ditch can be calculated, assuming horizontal flow and homogeneous aquifer, using Darcy’s Law. The calculated velocity ranges from approximately 0.03 to 0.09 m/d (Hartman 1999). 3.2 Summary of Groundwater Monitoring Results Groundwater beneath A-29 Ditch has been monitored by a RCRA-compliant monitoring network since November 1988. The original detection level monitoring network consisted of one upgradient well
3.4
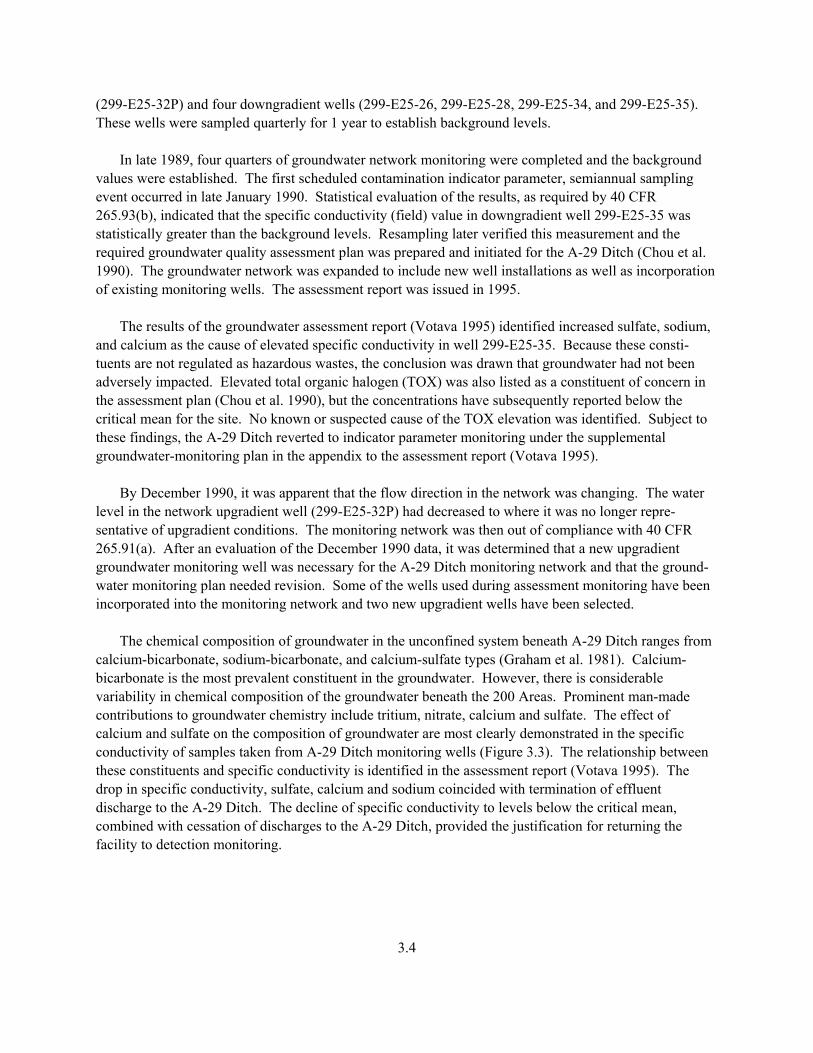
(299-E25-32P) and four downgradient wells (299-E25-26, 299-E25-28, 299-E25-34, and 299-E25-35). These wells were sampled quarterly for 1 year to establish background levels. In late 1989, four quarters of groundwater network monitoring were completed and the background values were established. The first scheduled contamination indicator parameter, semiannual sampling event occurred in late January 1990. Statistical evaluation of the results, as required by 40 CFR 265.93(b), indicated that the specific conductivity (field) value in downgradient well 299-E25-35 was statistically greater than the background levels. Resampling later verified this measurement and the required groundwater quality assessment plan was prepared and initiated for the A-29 Ditch (Chou et al. 1990). The groundwater network was expanded to include new well installations as well as incorporation of existing monitoring wells. The assessment report was issued in 1995. The results of the groundwater assessment report (Votava 1995) identified increased sulfate, sodium, and calcium as the cause of elevated specific conductivity in well 299-E25-35. Because these consti-tuents are not regulated as hazardous wastes, the conclusion was drawn that groundwater had not been adversely impacted. Elevated total organic halogen (TOX) was also listed as a constituent of concern in the assessment plan (Chou et al. 1990), but the concentrations have subsequently reported below the critical mean for the site. No known or suspected cause of the TOX elevation was identified. Subject to these findings, the A-29 Ditch reverted to indicator parameter monitoring under the supplemental groundwater-monitoring plan in the appendix to the assessment report (Votava 1995). By December 1990, it was apparent that the flow direction in the network was changing. The water level in the network upgradient well (299-E25-32P) had decreased to where it was no longer repre-sentative of upgradient conditions. The monitoring network was then out of compliance with 40 CFR 265.91(a). After an evaluation of the December 1990 data, it was determined that a new upgradient groundwater monitoring well was necessary for the A-29 Ditch monitoring network and that the ground-water monitoring plan needed revision. Some of the wells used during assessment monitoring have been incorporated into the monitoring network and two new upgradient wells have been selected. The chemical composition of groundwater in the unconfined system beneath A-29 Ditch ranges from calcium-bicarbonate, sodium-bicarbonate, and calcium-sulfate types (Graham et al. 1981). Calcium-bicarbonate is the most prevalent constituent in the groundwater. However, there is considerable variability in chemical composition of the groundwater beneath the 200 Areas. Prominent man-made contributions to groundwater chemistry include tritium, nitrate, calcium and sulfate. The effect of calcium and sulfate on the composition of groundwater are most clearly demonstrated in the specific conductivity of samples taken from A-29 Ditch monitoring wells (Figure 3.3). The relationship between these constituents and specific conductivity is identified in the assessment report (Votava 1995). The drop in specific conductivity, sulfate, calcium and sodium coincided with termination of effluent discharge to the A-29 Ditch. The decline of specific conductivity to levels below the critical mean, combined with cessation of discharges to the A-29 Ditch, provided the justification for returning the facility to detection monitoring.
4.1
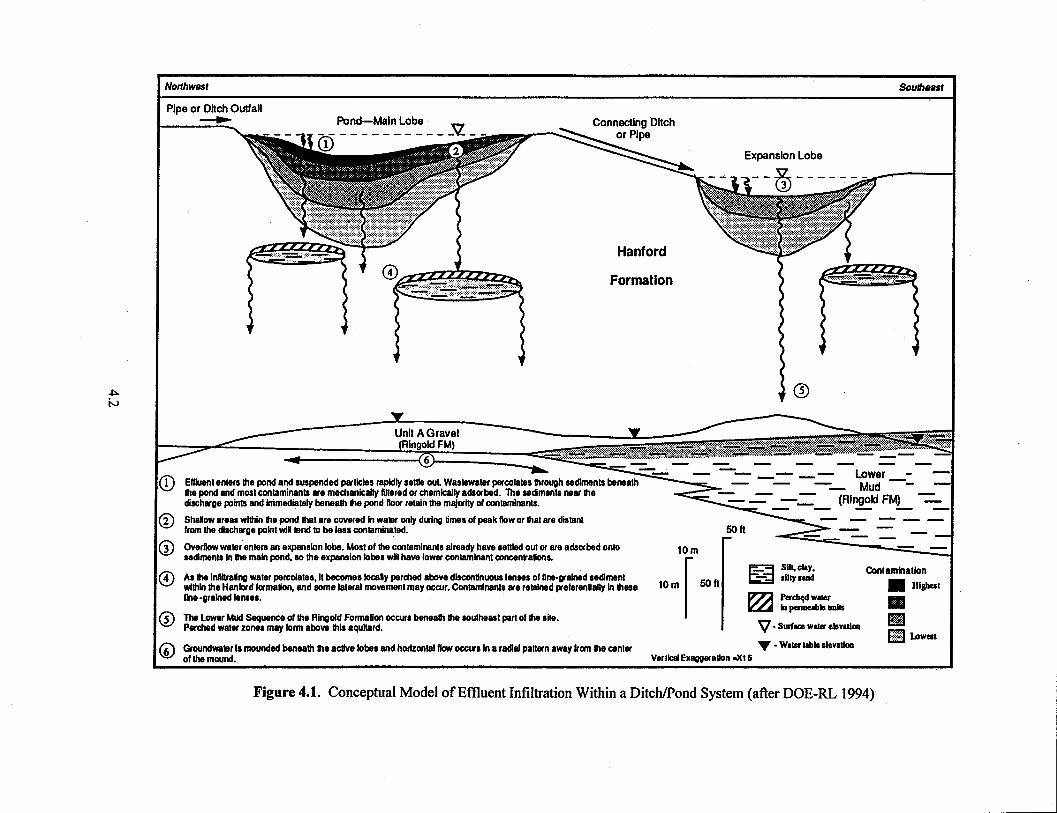
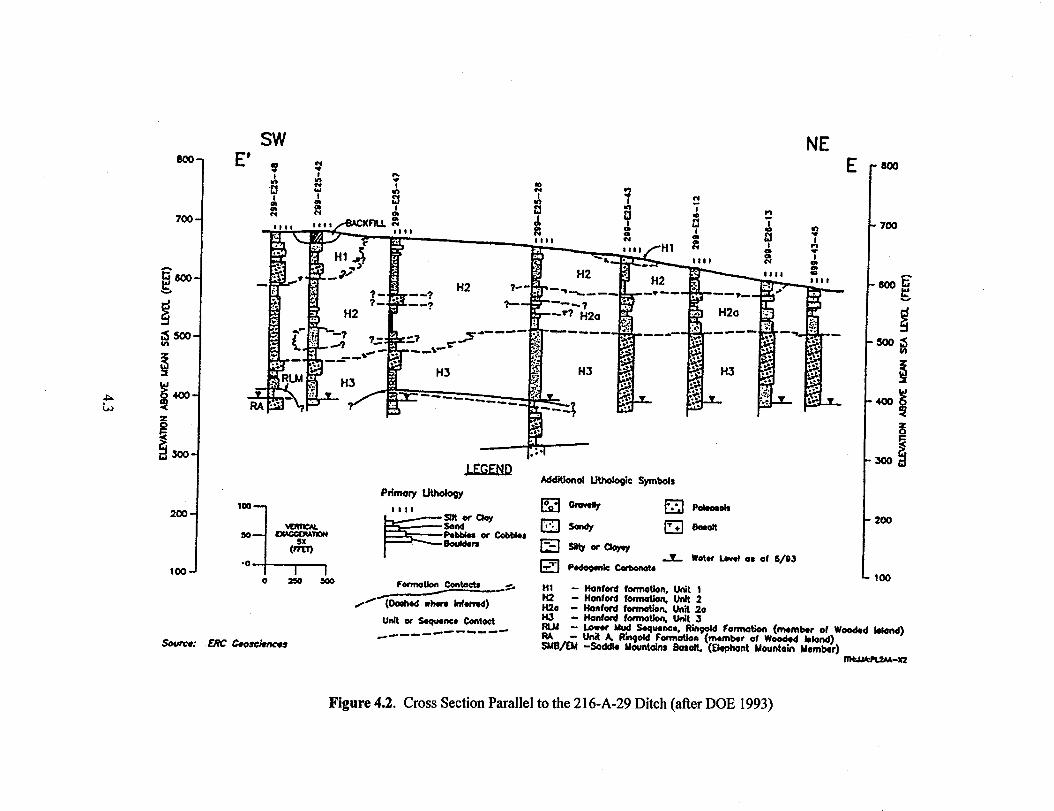
4.0 Conceptual Model The A-29 Ditch was one of several waste streams that discharged to the 216-B-3 Pond system. The open and unlined trench allowed liquid effluents to evaporate and percolate into vadose sediments along its entire length. Groundwater monitoring results, however, indicate that infiltration and eventual migra-tion of effluents to the unconfined aquifer has not been evenly distributed. The elevation of specific conductivity and other ions such as sulfate and calcium, as noted in Votava (1995), suggests that con-tamination may be confined to the head end (northwest end in Figure 4.1) of the ditch. The conceptual model used to describe contaminant transport at B Pond (DOE-RL 1994) is central to the discussion of an A-29 Ditch conceptual model. As shown in Figure 4.1, the highest infiltration occurs within the first few meters of the head end of the ditch. Contaminants are carried to groundwater at a higher rate near the head end as a result of the higher infiltration rate. The sediments that comprise the vadose in the A-29 Ditch area are of the highly permeable Hanford formation. Well logs from A-29 Ditch groundwater wells, and the cross section in Figure 4.2, show that the upper vadose is dominated by sandy- to silty-sandy gravels at the head end, with predominantly sandy units at the discharge end. This stratigraphic control of moisture migration in the vadose favors deposition of the majority of contami-nants near the outfall of the chemical sewer line. Although no vadose excavations have been conducted to verify this rationale, it is likely that less mobile contaminants are sorbed to the silt fractions of the sand and gravel units near the head end of the A-29 Ditch. It is also likely that the bulk of tritium, nitrate, and disassociated sulfate and calcium have reached groundwater beneath the head end of the A-29 Ditch. Once the contaminants reached groundwater, they followed the hydraulic gradient and moved away from the 200 East Area in south-southwest direction. Groundwater flow beneath the A-29 Ditch resides in an unconfined system within the Hanford formation. Near the head end of the ditch, some portion of the unconfined aquifer can be found within the upper units of the Ringold Formation. Hydraulic conductivity is assumed to be high based on very flat groundwater elevation contours for the southeast corner of the 200 East Area (see Figure 3.1). Flow rates range from 0.03 to 0.09 m/d. The groundwater flow direction has moved from approximately 240° in 1991 to approximately 235° at present. This redirection of flow direction is due to the decline of the B Pond mound. The potential for continued migration of residual contamination from the vadose to groundwater is lessened due to the cessation of liquid effluent discharge to the A-29 Ditch. Infiltration is the only potential force capable of moving a significant portion of remaining contaminants to groundwater. The current mean annual precipitation rate is 16 cm, with most of the annual accumulation occurring between November and February (Fayer and Walters 1995). Recharge in the A-29 Ditch area is estimated to be between 10 and 20 mm annually. The range of recharge rates depends on a variety of factors, but the coarse sediments beneath the head end of the facility may result in rates closer to 20 mm/yr. No recent infiltration abatement measures have been implemented at the A-29 Ditch. The risk of infiltration by snow melt and the potential for vertical migration of contaminants, however, is still considered low because of low precipitation.
5.1
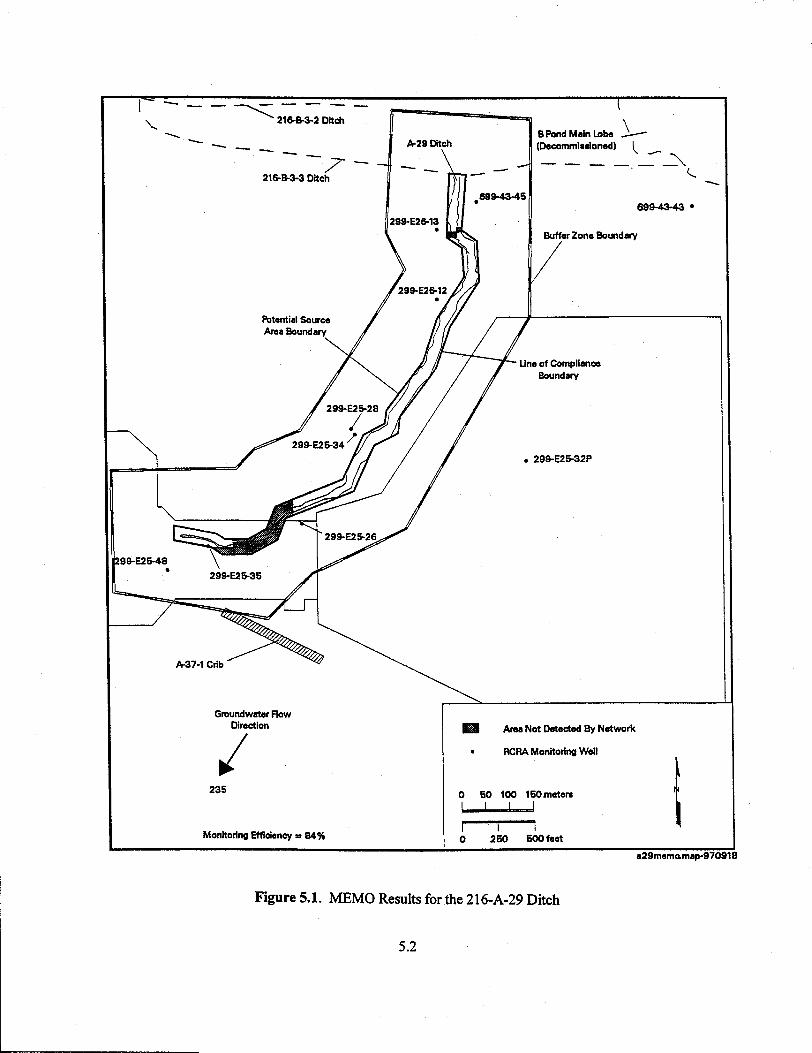
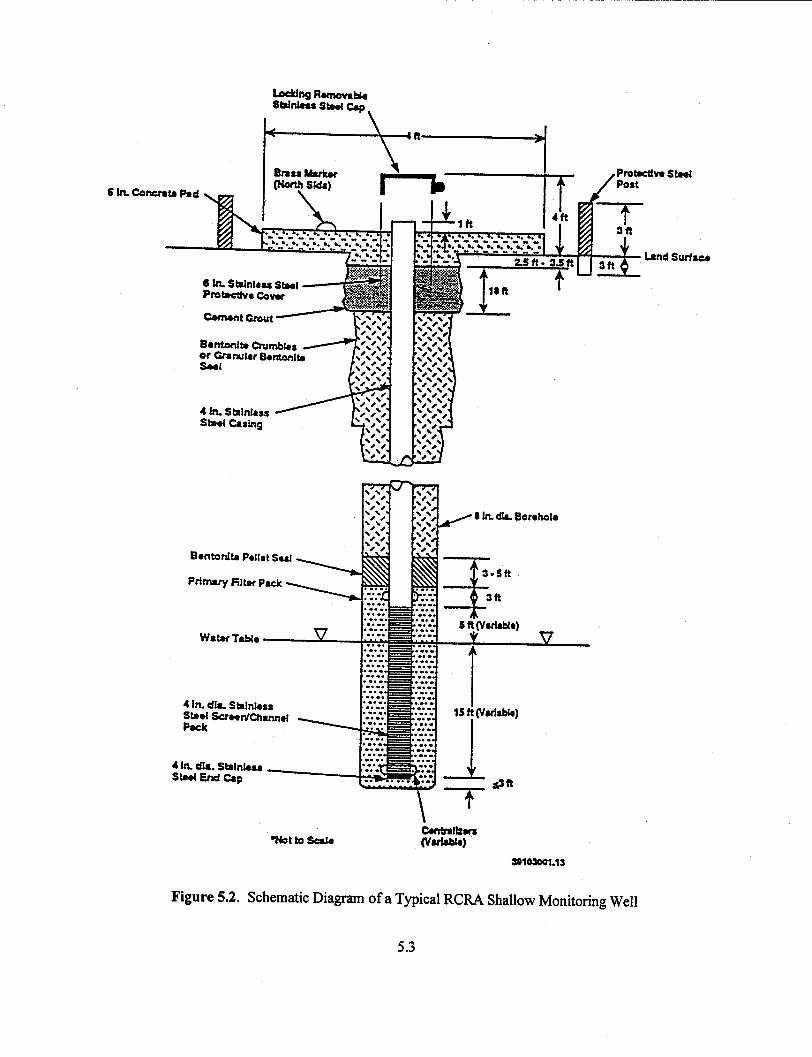
5.0 Groundwater Monitoring Program 5.1 Objectives The A-29 Ditch groundwater monitoring plan objective is to determine whether groundwater has been impacted by discharges to the facility. The construction details and lithologic information for the A-29 Ditch network wells are given in as-built diagrams in Appendix A. The coordinates, total depth, and screened intervals are summarized in Table 5.1. 5.2 Sampling and Analysis Plan This section defines the upgradient and downgradient monitoring wells for the detection network. Additional information is provided on the types of hydrogeologic data collected for the network, the sampling frequency, and groundwater constituents that will be analyzed. 5.2.1 Monitoring Well Network The indicator evaluation groundwater monitoring program consists of the A-29 groundwater moni-toring network as described in Table 5.1 and shown in Figure 5.1. The network viability has been tested using the MEMO (Wilson et al. 1992), based on current groundwater flow conditions. The MEMO was run using the recommended A-29 groundwater monitoring network wells and a general groundwater flow to the southwest. The monitoring efficiency is 84%. The ten groundwater monitoring wells that currently comprise the A-29 Ditch monitoring network are located around the site as shown in Figure 5.1 and listed in Table 5.1. Five of the downgradient moni-toring wells (299-E26-12, 299-E26-13, 299-E25-48, 299-E25-34, and 299-E25-35) have been constructed to meet RCRA standards (WAC 173-160) (Figure 5.2). Well 299-E25-32P was also constructed to RCRA standards but is configured to measure vertical hydraulic gradients. Wells 299-E25-26 and 299-E25-28 are constructed of carbon steel casing above the water table with stainless steel screens and casings below the water table. The wells were developed naturally with no filter pack. They are completed in highly permeable material that does not necessitate an artificial filter pack. The annular space in well 299-E25-26 was grouted from land surface to 46 m, and the remaining depth of the well is sealed by the 15.3-cm drive casing, which was left in place after drilling to the total depth and backpulling to expose the screen and stainless steel casing. In well 299-E25-28, the annular space was grouted from land surface to 66.5 m; the remainder of the well is sealed by the 15.3-cm drive casing, which was left in place after drilling to the total depth and backpulling to expose the screen and stainless steel casing. The integrity of these wells is maintained by the casings.
5.4
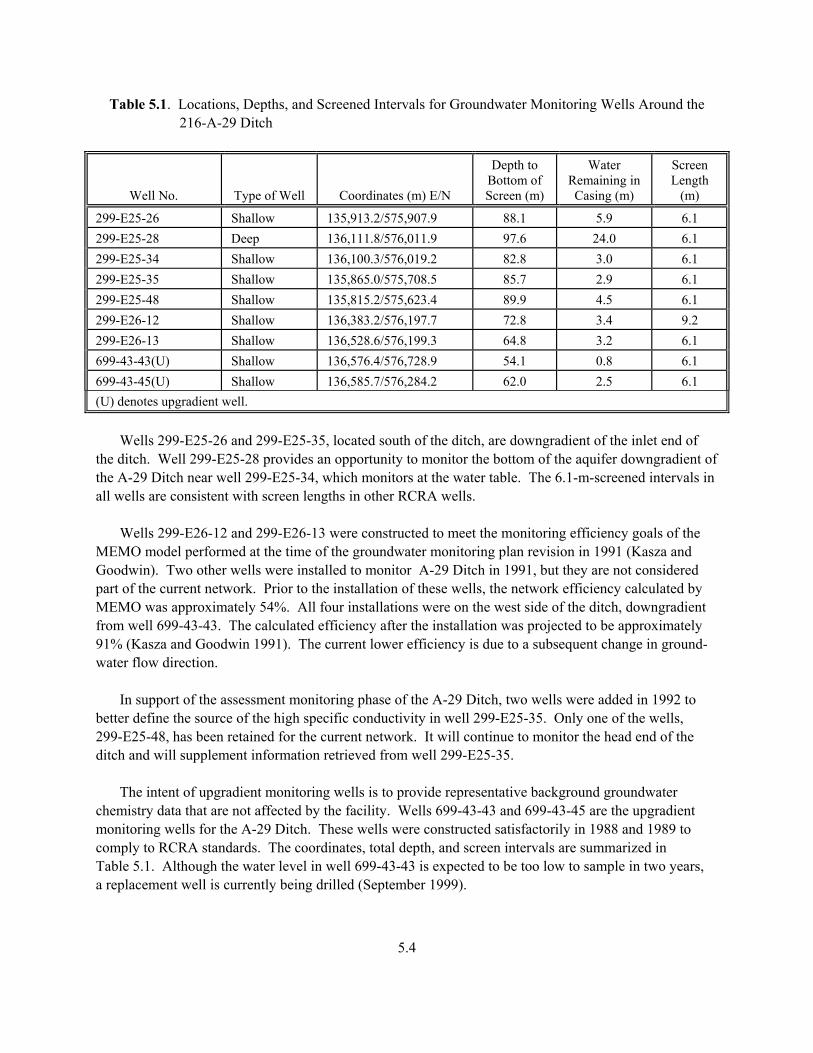
Table 5.1. Locations, Depths, and Screened Intervals for Groundwater Monitoring Wells Around the 216-A-29 Ditch
Well No. Type of Well Coordinates (m) E/N
Depth to Bottom of Screen (m)
Water Remaining in Casing (m)
Screen Length
(m)
299-E25-26 Shallow 135,913.2/575,907.9 88.1 5.9 6.1 299-E25-28 Deep 136,111.8/576,011.9 97.6 24.0 6.1 299-E25-34 Shallow 136,100.3/576,019.2 82.8 3.0 6.1 299-E25-35 Shallow 135,865.0/575,708.5 85.7 2.9 6.1 299-E25-48 Shallow 135,815.2/575,623.4 89.9 4.5 6.1 299-E26-12 Shallow 136,383.2/576,197.7 72.8 3.4 9.2 299-E26-13 Shallow 136,528.6/576,199.3 64.8 3.2 6.1 699-43-43(U) Shallow 136,576.4/576,728.9 54.1 0.8 6.1 699-43-45(U) Shallow 136,585.7/576,284.2 62.0 2.5 6.1 (U) denotes upgradient well. Wells 299-E25-26 and 299-E25-35, located south of the ditch, are downgradient of the inlet end of the ditch. Well 299-E25-28 provides an opportunity to monitor the bottom of the aquifer downgradient of the A-29 Ditch near well 299-E25-34, which monitors at the water table. The 6.1-m-screened intervals in all wells are consistent with screen lengths in other RCRA wells. Wells 299-E26-12 and 299-E26-13 were constructed to meet the monitoring efficiency goals of the MEMO model performed at the time of the groundwater monitoring plan revision in 1991 (Kasza and Goodwin). Two other wells were installed to monitor A-29 Ditch in 1991, but they are not considered part of the current network. Prior to the installation of these wells, the network efficiency calculated by MEMO was approximately 54%. All four installations were on the west side of the ditch, downgradient from well 699-43-43. The calculated efficiency after the installation was projected to be approximately 91% (Kasza and Goodwin 1991). The current lower efficiency is due to a subsequent change in ground-water flow direction. In support of the assessment monitoring phase of the A-29 Ditch, two wells were added in 1992 to better define the source of the high specific conductivity in well 299-E25-35. Only one of the wells, 299-E25-48, has been retained for the current network. It will continue to monitor the head end of the ditch and will supplement information retrieved from well 299-E25-35. The intent of upgradient monitoring wells is to provide representative background groundwater chemistry data that are not affected by the facility. Wells 699-43-43 and 699-43-45 are the upgradient monitoring wells for the A-29 Ditch. These wells were constructed satisfactorily in 1988 and 1989 to comply to RCRA standards. The coordinates, total depth, and screen intervals are summarized in Table 5.1. Although the water level in well 699-43-43 is expected to be too low to sample in two years, a replacement well is currently being drilled (September 1999).
5.5
Replacement wells for the current network may be constructed due to declining water levels, chang-ing flow directions, and programmatic considerations. These wells will be located according to the cur-rent understanding of hydrogeologic conditions under the facility, projected water level elevations and flow conditions, and in conjunction with on-going negotiations with Ecology. Declining water-table elevations throughout the 200 Areas has resulted in the removal of several groundwater-monitoring wells from RCRA networks due to insufficient water in the borehole for sampling. The 200 East Area is profoundly influenced by the decline of the 216-B-3 Pond groundwater mound. Predicting specific water-level elevations in RCRA network wells is difficult. It is certain, however, that at least one monitoring well is at risk of removal from the A-29 network for lack of ade-quate water to sample. A 1-year decline in water table elevation of 2 m was observed in well 699-43-43 (see Figure 3.1). The rapid drop in elevation was observed in other wells in the vicinity of 216-B-3 Pond. Several factors will determine the final location of replacement groundwater monitoring well(s), and the specific details will be outlined in a separate plan. The details include Lambert coordinates of the replacement well(s), drilling depth, well screen selection and placement, and sampling requirements. Changes to this groundwater monitoring plan necessitated by the replacement well(s) will be documented in an Interim Change Notice (ICN). 5.2.2 Constituent List and Sampling Frequency The groundwater in A-29 Ditch monitoring wells will be sampled and analyzed for the parameters listed in Table 5.2. In compliance with 40 CFR 265.92, the A-29 network wells will be monitored semiannually for TOX, TOC, pH, and specific conductance. The wells will be monitored annually for inductively coupled plasma (ICP) metals, phenols, and tritium. Alkalinity will be used to calculate groundwater charge balance. Anions will be included to detect potential nitrate contamination from surrounding facilities, as well as provide input for charge balance calculations. Water levels will be measured semiannually. 5.2.3 Network Evaluation The general groundwater-flow direction is from west to east across the Hanford Site; artificial recharge due to the 216-B-3 Pond System perturbed the general trend. The resulting groundwater mound creates flow direction in the vicinity of the A-29 Ditch that is currently opposite the general west-to-east flow directions. The inferred flow is to the southwest (approximately 235° azimuth) beneath the A-29
Table 5.2. Constituent List for the A-29 Ditch
Contamination Indicator Parameters Site-Specific Parameters
pH TOC Alkalinity ICP Metals (filtered) Specific Conductance TOX Anions Turbidity Phenols
5.6
Ditch. As the influence of the groundwater mound diminishes with distance, the general west-to-east flow prevails. As discharge volumes continue to decline in the future, the perturbation in groundwater-flow direction discussed above will subside. In addition, the water table continues to decline beneath the facility in response to changes in the groundwater mound beneath B Pond. Because groundwater elevations in the Central Plateau were not well documented before nuclear process operations at the Hanford Site, it is generally unknown at what elevation groundwater will stabil-ize. It is possible the Hanford formation eventually will yield only negligible quantities of groundwater for representative samples in several wells surrounding the A-29 Ditch. The groundwater-monitoring network, as it is currently configured, will have to be re-evaluated to ensure that it is still adequate to monitor the changing hydrogeologic conditions beneath the facility. Monitoring efficiency studies will also address a possible groundwater flow reversal that may precede the effective loss of water in the groundwater-monitoring network. Activities that will take place to obtain the necessary information to maintain compliance include
• semiannual groundwater elevation measurements from the A-29 Ditch network and from wells in the vicinity of the facility
• monitoring efficiency modeling for the current network based on current flow conditions, if flow
changes are observed • re-evaluation of the A-29 Ditch conceptual model and evaluation of geochemical trends • combining evaluation results to determine network efficiency and modification requirements for the
network. It would not be prudent, therefore, to recommend specific countermeasures to correct the monitoring network because it is fully functional at this time. Projections of whether the groundwater elevation beneath the A-29 Ditch will reach a level where the network cannot fulfill regulatory requirements are not exact. The effective life span of the network has exceeded earlier projections of water-level decline in A-29 Ditch monitoring network wells (Wurstner and Freshley 1994). 5.3 Sampling and Analysis Protocol Monitoring of the A-29 Ditch is part of the Hanford Groundwater Monitoring Project. Procedures for groundwater sampling, documentation, sample preservation, shipment, and chain-of-custody requirements are described in PNNL or subcontractor manuals (currently WMNW procedures manual ES-SSPM-001) and in the quality assurance plan (PNNL 1998). Samples generally are collected after three casing volumes of water have been purged from the well or after field parameters (pH, temperature, specific conductance, and turbidity) have stabilized. For routine groundwater samples, preservatives are added to the collection bottles before their use in the field. Samples to be analyzed for metals are usually filtered in the field so that results represent dissolved metals.
5.7
Procedures for field measurements are specified in the subcontractor’s or manufacturer’s manuals. Analytical methods are specified in contracts with laboratories, and most are standard methods from Test Methods for Evaluating Solid Wastes, Physical/Chemical Methods (EPA 1986a). Alternative procedures meet the guidelines of SW-846, Chapter 10. Analytical methods are described in Gillespie (1999). 5.4 Quality Assurance and Quality Control The groundwater monitoring project’s quality assurance/quality control (QA/QC) program is designed to assess and enhance the reliability and validity of groundwater data. The primary quantitative measures or parameters used to assess data quality are accuracy, precision, completeness, and the method detection limit. Qualitative measures include representativeness and comparability. Goals for data repre-sentativeness for groundwater monitoring projects are addressed qualitatively by the specification of well locations, well construction, sampling intervals, and sampling and analysis techniques in the groundwater monitoring plan for each RCRA facility. Comparability is the confidence with which one data set can be compared to another. The QA/QC parameters are evaluated through laboratory checks (e.g., matrix spikes, laboratory blanks), replicate sampling and analysis, analysis of blind standards and blanks, and interlaboratory comparisons. Acceptance criteria have been established for each of these parameters (PNNL 1998), based on guidance from the U.S. Environmental Protection Agency (OSWER-9950.1, EPA 1986a). When a parameter is outside the criteria, corrective actions are taken to prevent a future occurrence and affected data are flagged in the database. Flagging varies from complete rejection of the data as invalid to an indication of questionable accuracy.
6.1
6.0 Data Management, Evaluation, and Reporting This chapter describes how groundwater data are stored, retrieved, evaluated, and interpreted. Sta-tistical evaluation methods and reporting requirements are also described. 6.1 Data Management The contract laboratories report analytical results electronically. The results are loaded into the Hanford Environmental Information System (HEIS) database. Field-measured parameters are entered manually or through electronic transfer. Data from HEIS may be downloaded to smaller databases, such as the Geosciences Data Analysis Toolkit (GeoDAT) for data validation, reduction, and trend analysis. Paper data reports and field records are considered record copies and are stored at PNNL. The data undergo a validation/verification process according to a documented procedure, as described in the project QA/QC plan. QA/QC data are evaluated against the criteria listed in the project QA/QC plan and data flags are assigned when appropriate. In addition, data are screened by scientists familiar with the hydrogeology of the unit, compared to historical trends or spatial patterns, and flagged if they are not representative. Other checks on data may include comparison of general parameters to their specific counterparts (e.g., conductivity to ions; gross alpha to uranium), calculation of charge balances, and comparison of calculated vs. measured conductivity. If necessary, the lab may be asked to check calcu-lations or re-analyze the sample, or the well may be resampled. 6.2 Interpretation After data are validated and verified, the acceptable data are used to interpret groundwater conditions at the site. Interpretive techniques include
• Hydrographs−graph water levels versus time to determine decreases, increases, seasonal, or man-made fluctuations in groundwater levels.
• Water-table maps−use water-table elevations from multiple wells to construct contour maps to
estimate flow directions. Groundwater flow is assumed to be perpendicular to lines of equal potential.
• Trend plots−graph concentrations of chemical or radiological constituents versus time to determine
increases, decreases, and fluctuations. May be used in tandem with hydrographs and/or water-table maps to determine if concentrations relate to changes in water level or in groundwater flow directions.
6.2
• Plume maps−map distributions of chemical or radiological constituents areally in the aquifer to determine extent of contamination. Changes in plume distribution over time aid in determining movement of plumes and direction of flow.
• Contaminant ratios−can sometimes be used to distinguish between different sources of contamination.
6.3 Statistical Evaluation The goal of RCRA detection monitoring is to determine if the 216-A-29 Ditch has affected ground-water quality. This is determined based on the results of a statistical test. According to 40 CFR 265.92 (and by reference of WAC 173-303-400[3]) the owner/operator of an interim-status hazardous waste facility must establish initial background concentrations for the contamination indicator parameters: specific conductance, pH, total organic carbon (TOC), and total organic halogen (TOX). This has been done for the 216-A-29 Ditch by obtaining at least four replicate measurements for each parameter from each well quarterly for 1 year. Data from the upgradient well(s) are used to determine the initial background arithmetic mean and variance. Monitoring data collected after the first year are compared with the initial background data to deter-mine if there is an indication that contamination may have occurred. A t-test is required to make this determination (40 CFR 265.93[b]). A recommended method is the averaged replicate t-test method described in Appendix B of the RCRA Groundwater Monitoring Technical Enforcement Guidance Docu-ment (EPA 1986b). The averaged replicate t-test method for each contamination indicator parameter is calculated as:
( ) b bbi 1/n1*S/x - x t +=
where t = test statistic xi = average of replicates from the ith monitoring well xb = background average Sb = background standard deviation nb = number of background replicate averages. A test statistic larger than the Bonferroni critical value, tc, (i.e., t > tc) indicates a statistically significant probability of contamination. These Bonferroni critical values depend on the overall false-positive rate required for each sampling period (i.e., 1% for interim status), the total number of wells in the monitoring network, and the number of degrees of freedom (nb - 1) associated with the background standard deviation. Because of the nature of the test statistic in the above equation, results to be com-pared to background do not contribute to the estimate of the variance. The test can be reformulated, without prior knowledge of the results of the sample to be compared to background (i.e., x̄i), in such a way that a critical mean, CM, can be obtained: )1/n+ (1 * S * t+ x = CM bbcb (one-tailed)
6.3
)1/n (1 * S * t x CM bbcb +±= (two-tailed)
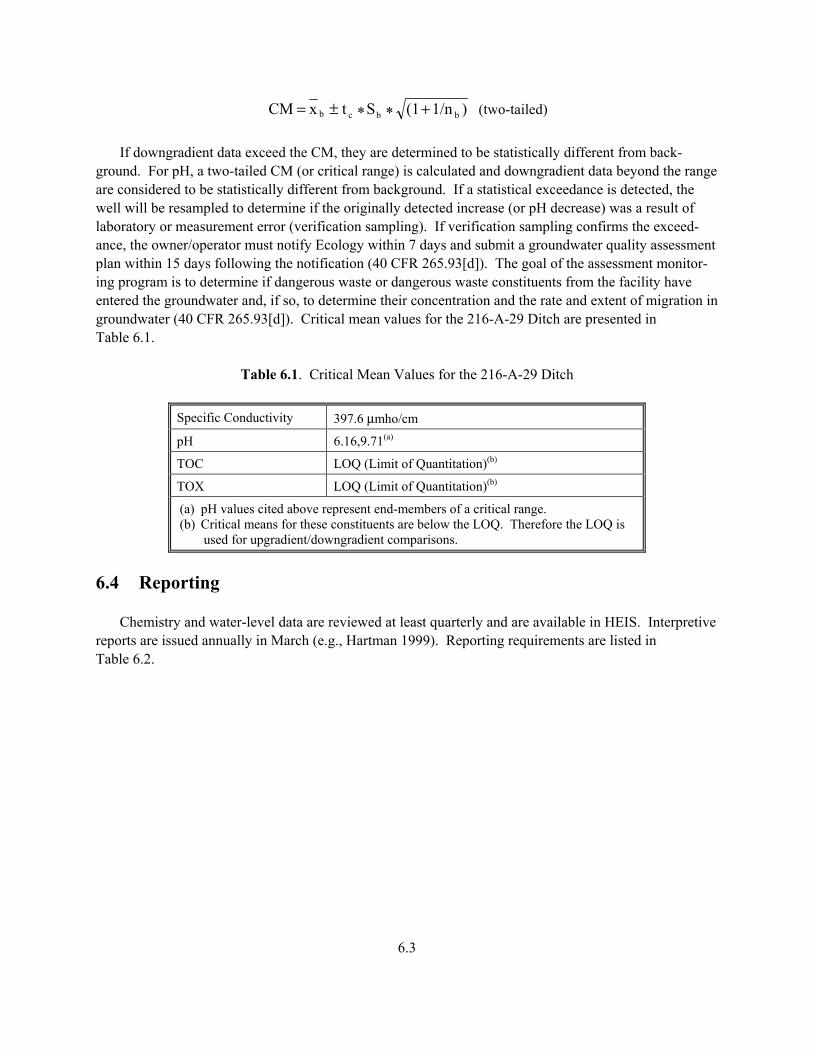
If downgradient data exceed the CM, they are determined to be statistically different from back-ground. For pH, a two-tailed CM (or critical range) is calculated and downgradient data beyond the range are considered to be statistically different from background. If a statistical exceedance is detected, the well will be resampled to determine if the originally detected increase (or pH decrease) was a result of laboratory or measurement error (verification sampling). If verification sampling confirms the exceed-ance, the owner/operator must notify Ecology within 7 days and submit a groundwater quality assessment plan within 15 days following the notification (40 CFR 265.93[d]). The goal of the assessment monitor-ing program is to determine if dangerous waste or dangerous waste constituents from the facility have entered the groundwater and, if so, to determine their concentration and the rate and extent of migration in groundwater (40 CFR 265.93[d]). Critical mean values for the 216-A-29 Ditch are presented in Table 6.1.
Table 6.1. Critical Mean Values for the 216-A-29 Ditch
Specific Conductivity 397.6 µmho/cm
pH 6.16,9.71(a)
TOC LOQ (Limit of Quantitation)(b)
TOX LOQ (Limit of Quantitation)(b)
(a) pH values cited above represent end-members of a critical range. (b) Critical means for these constituents are below the LOQ. Therefore the LOQ is
used for upgradient/downgradient comparisons.
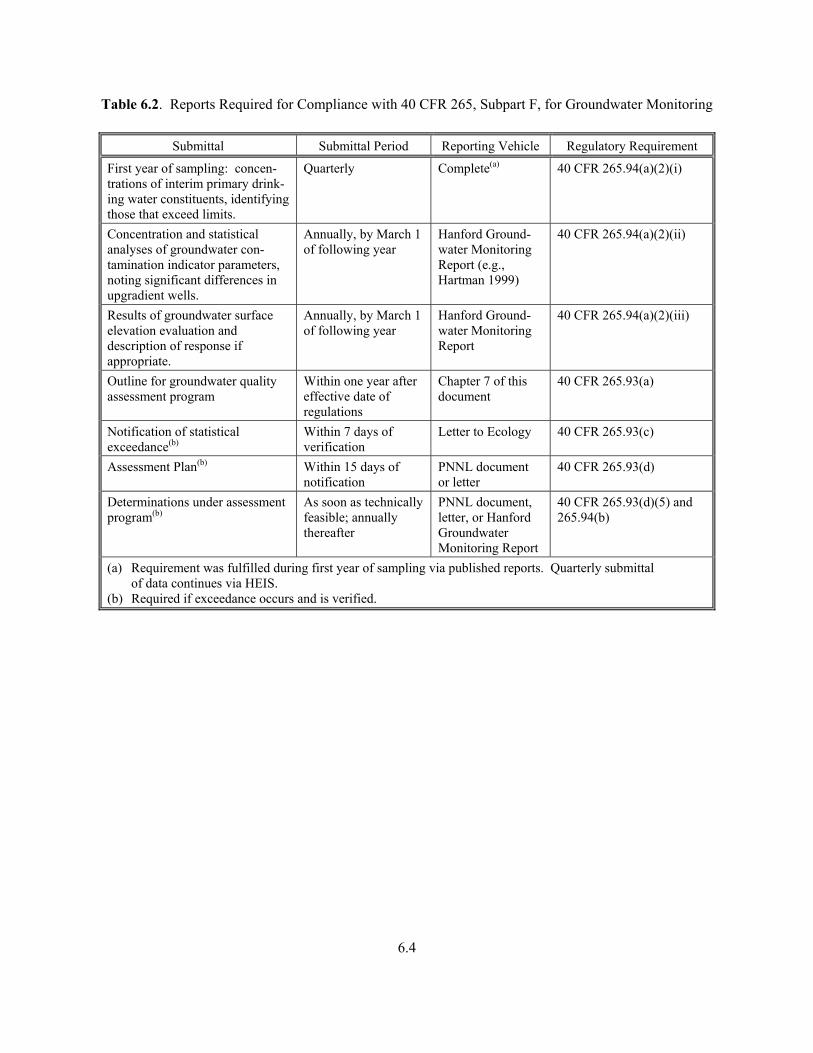
6.4 Reporting Chemistry and water-level data are reviewed at least quarterly and are available in HEIS. Interpretive reports are issued annually in March (e.g., Hartman 1999). Reporting requirements are listed in Table 6.2.
6.4
Table 6.2. Reports Required for Compliance with 40 CFR 265, Subpart F, for Groundwater Monitoring
Submittal Submittal Period Reporting Vehicle Regulatory Requirement
First year of sampling: concen-trations of interim primary drink-ing water constituents, identifying those that exceed limits.
Quarterly Complete(a) 40 CFR 265.94(a)(2)(i)
Concentration and statistical analyses of groundwater con-tamination indicator parameters, noting significant differences in upgradient wells.
Annually, by March 1 of following year
Hanford Ground-water Monitoring Report (e.g., Hartman 1999)
40 CFR 265.94(a)(2)(ii)
Results of groundwater surface elevation evaluation and description of response if appropriate.
Annually, by March 1 of following year
Hanford Ground-water Monitoring Report
40 CFR 265.94(a)(2)(iii)
Outline for groundwater quality assessment program
Within one year after effective date of regulations
Chapter 7 of this document
40 CFR 265.93(a)
Notification of statistical exceedance(b)
Within 7 days of verification
Letter to Ecology 40 CFR 265.93(c)
Assessment Plan(b) Within 15 days of notification
PNNL document or letter
40 CFR 265.93(d)
Determinations under assessment program(b)
As soon as technically feasible; annually thereafter
PNNL document, letter, or Hanford Groundwater Monitoring Report
40 CFR 265.93(d)(5) and 265.94(b)
(a) Requirement was fulfilled during first year of sampling via published reports. Quarterly submittal of data continues via HEIS. (b) Required if exceedance occurs and is verified.
7.1
7.0 Outline for Groundwater Assessment Monitoring Program This chapter presents a basic outline for an assessment-monitoring plan, as required by 40 CFR 265.93(a). The assessment program must be capable of determining whether dangerous waste or danger-ous waste constituents have entered the groundwater, their concentration, and the rate and extent of migration. If an indicator parameter at a downgradient well significantly exceeds the background value, an assessment plan will be prepared and submitted to Ecology (see Section 6.3). The plan will include the following:
• description of the approach to determine if dangerous waste or dangerous waste constituents from the facility have entered the groundwater or if the exceedance was caused by other sources (false positive rationale)
• description of the investigative approach to fully characterize rate and extent of contaminant
migration
• number, locations, and depths of wells in the monitoring network
• sampling and analytical methods used
• data evaluation procedures
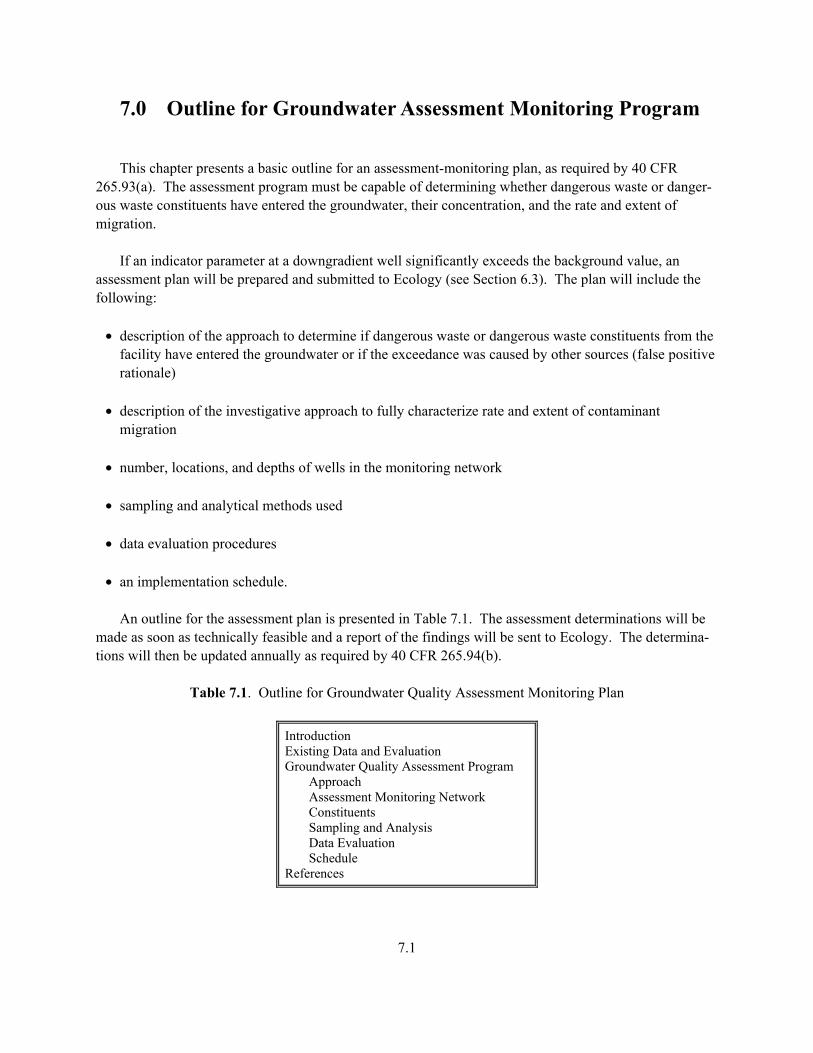
• an implementation schedule. An outline for the assessment plan is presented in Table 7.1. The assessment determinations will be made as soon as technically feasible and a report of the findings will be sent to Ecology. The determina-tions will then be updated annually as required by 40 CFR 265.94(b).
Table 7.1. Outline for Groundwater Quality Assessment Monitoring Plan
Introduction Existing Data and Evaluation Groundwater Quality Assessment Program Approach Assessment Monitoring Network Constituents Sampling and Analysis Data Evaluation Schedule References
8.1
8.0 References 40 CFR 265, Code of Federal Regulations, Title 40, Part 265. Interim Status Standards for Owners of Hazardous Waste Treatment, Storage, and Disposal Facilities. Chou, C. J., G. L. Kasza, and R. B. Mercer. 1990. Interim-Status Groundwater Quality Assessment Plan for the 216-A-29 Ditch. WHC-SD-EN-AP-031, Westinghouse Hanford Company, Richland, Washington. EPA. 1986a. Test Methods for Evaluating Solid Wastes: Physical/Chemical Methods, 3rd ed. Office of Solid Waste and Emergency Response, U.S. Environmental Protection Agency, Washington, D.C. EPA 1986b. RCRA Groundwater Monitoring Technical Enforcement Guidance Document. U.S. Environmental Protection Agency, Washington, D.C. Fayer, M. J., and T. B. Walters. 1995. Estimated Recharge Rates at the Hanford Site. PNL-10285, Pacific Northwest Laboratory, Richland, Washington. Gillespie, B. M. 1999. “Analytical Methods,” Appendix C of Hanford Site Groundwater Monitoring for Fiscal Year 1998. PNNL-12086, Pacific Northwest National Laboratory, Richland, Washington. Graham, M. J., M. D. Hall, S. R. Strait, and W. R. Brown. 1981. Hydrology of the Separations Areas. RHO-ST-42, Rockwell Hanford Operations, Richland, Washington. Hartman, M. J. (ed.) 1999. Hanford Site Groundwater Monitoring for Fiscal Year 1998. PNNL-12086, Pacific Northwest National Laboratory, Richland, Washington. Johnson, V. G. 1993. Westinghouse Hanford Company Operational Groundwater Status Report, 1990-1992. WHC-EP-0595, Westinghouse Hanford Company, Richland, Washington. Jungfleisch, F. 1988. Preliminary Evaluation of Hanford Liquid Discharges to Ground. WHC-EP-0052, Westinghouse Hanford Company, Richland, Washington. Kasza, G. L., and S. M. Goodwin. 1991. Groundwater Monitoring Plan for the 216-A-29 Ditch. WHC-SE-EN-AP-045, Rev. 0, Westinghouse Hanford Company, Richland, Washington. Lindsey, K. A., B. N. Bjornstad, J. W. Lindberg, and K. M. Hoffman. 1992. Geologic Setting of the 200 East Area: An Update. WHC-SD-EN-TI-012, Rev. 0, Westinghouse Hanford Company, Richland, Washington. Pacific Northwest National Laboratory (PNNL). 1998. The Hanford Ground-Water Monitoring Project Quality Assurance Project Plan. QA Plan ETD-012, Rev. 1, Pacific Northwest National Laboratory, Richland, Washington.
8.2
Resource Conservation and Recovery Act of 1976, as amended, Public Law 94-580, 90 Stat. 2795, 42 USC 6901 et seq. Sweeney, M. D. 1997. Liquid Effluent Retention Facility Final-Status Groundwater Monitoring Plan. PNNL-11620, Pacific Northwest National Laboratory, Richland, Washington. Thorne, P. D., and S. K. Wurstner. 1998. “Groundwater Modeling.” In M. J. Hartman (ed.), Hanford Site Groundwater Monitoring for Fiscal Year 1998. PNNL-12086, Pacific Northwest National Laboratory, Richland, Washington. U.S. DOE-RL. 1993. 200-BP-11 Operable Unit RFI/CMS and 216-B-3 Main Pond, 216-B-63 Trench, and 216-A-29 Ditch Work/Closure Plan. Vol. 1, DOE/RL-93-74 Draft B, U.S. Department of Energy, Richland Operations Office, Richland, Washington. U.S. DOE-RL. 1994. 200-BP-11 Operable Unit and 216-B-3 Main Pond Work/Closure Plan, Hanford Site, Richland, Washington. Vol. 1, DOE-RL-93-74 Draft A, U.S. Department of Energy, Richland Operations Office, Richland, Washington. U.S. Environmental Protection Agency (EPA). 1986. Test Methods for Evaluating Solid Wastes: Physical/Chemical Methods, 3rd ed. SW-846, Office of Solid Waste and Emergency Response, Washington, D.C. Votava, J. M. 1995. Results of Groundwater Quality Assessment Program at the 216-A-29 Ditch RCRA Facility. WHC-SD-EN-EV-032, Rev. 0, Westinghouse Hanford Company, Richland, Washington. WAC 173-160, Washington Administrative Code. Minimum Standards for Construction and Maintenance of Wells. Olympia, Washington. WAC 173-303-400, Washington Administrative Code. Interim Status Facility Standards. Olympia, Washington. Westinghouse Hanford Company (WHC). 1990. Liquid Effluent Study Final Project Report. WHC-EP-0367, Westinghouse Hanford Company, Richland, Washington. Wilson, C. R., C. M. Einberger, R. L. Jackson, and R. B. Mercer. 1992. “Design of Groundwater Monitoring Networks Using the Monitoring Efficiency Model (MEMO).” Groundwater (30)6:965-970.
PNNL-13047
Distr.1
Distribution No. of Copies OFFSITE Mr. Russell Jim, Manager Environmental Restoration/Waste Management Program Confederated Tribes and Bands of the Yakama Nation 2808 Main Street Union Gap, WA 98903 Ms. Lenora Seelatsee Wanapam Band Grant County P.U.D. 30 “C” Street, S.W. P.O. Box 878 Ephrata, WA 98823 Mr. Patrick Sobotta, Interim Director Environmental Restoration/Waste Management Program Nez Perce Tribe P.O. Box 365 Lapwai, ID 83540 Mr. J. R. Wilkinson, Manager Special Sciences and Resources Program Confederated Tribes of the Umatilla Indian Reservation P.O. Box 638 Pendleton, OR 97801
No. of Copies ONSITE 2 DOE Richland Operations Office M. J. Furman H0-12 B. L. Foley H0-12 3 Bectel Hanford, Inc. J. V. Borghese H0-21 B. H. Ford H0-21 R. J. Landon H0-02 3 State of Washington Department of Ecology J. Donnelly B5-18 Z. Jackson-Maine B5-18 S. Leja B5-18 13 Pacific Northwest National Laboratory C. J. Chou K6-81 M. J. Hartman K6-96 J. W. Lindberg K6-81 S. P. Luttrell K6-96 R. M. Smith K6-96 M. D. Sweeney K6-81 Information Release Office (7) K1-06
![Prediction of Groundwater Fluctuations Using Meshless ...nmce.kntu.ac.ir/article-1-216-en.pdfanalyze groundwater flow [5]. Mostly, the finite difference method and the finite element](https://img.pdfslide.us/doc/110x75/60ae0f5c9525d23ed35b5a68/prediction-of-groundwater-fluctuations-using-meshless-nmcekntuacirarticle-1-216-enpdf.jpg)