Embed Size (px)
Citation preview
Findikakis CH005.tex 7/3/2011 13: 35 Page 1
Chapter 5
Groundwater management practicesand emerging challenges: Lessonsfrom a case study in the KarnatakaState of South India
Sekhar M.,1,4 JaveedY.,1,4 Bandyopadhyay S.,2
Mangiarotti, S.3 and Mazzega, P.3,41Department of Civil Engineering, Indian Institute of Science, Bangalore, India2EOS, Indian Space Research Organisation, Bangalore, India3LMTG, Université deToulouse; UPS/CNRS/IRD; Toulouse, France4Indo-French Cell forWater Sciences, Indian Institute of Science – IRD, Bangalore, India
INTRODUCTION
In the last two decades significant changes have taken place in India in the use ofgroundwater for irrigation, and currently about 60% of irrigated agriculture dependson groundwater pumping (Shah et al., 2003). Irrigation wells are managed by indi-vidual farmers and their management and replacements are made under their owncontrol. Further, there is an increased reliance on groundwater irrigation due to frag-mentation of farm land holdings and increasing numbers of marginal/small farmers.This has resulted in systematic changes in land use practices especially in the uplandareas (recharge areas of river basins), which were not part of the green revolution dur-ing 1950–80. Depletion of water tables, contamination (by fluoride and nitrates) andover-extraction of groundwater have become critical issues in several regions of India.In addition, close to 90% of rural domestic water supply is from groundwater, and inmost regions there are very few treatment plants in place for water supply. In the samevein, significant proportions of the water demand in the cities and towns are met fromgroundwater supplies.
Several regions in India are experiencing rapid development and populationincrease, and the demand on groundwater for water supply has grown considerablyduring the last decade, and is expected continue to grow further. Also, during the pastfew years, India has experienced extreme weather events such as droughts1, floods, andcyclones more frequently. To examine the spatial trends in groundwater level variation,Panda et al. (2007) used Mann-Kendall non-parametric trend analysis of groundwaterlevels over the ten year period of 1994–2003 in the state of Orissa, to character-ize regions undergoing groundwater declines attributed to anthropogenic pressures inspite of recharge occurring after the post-monsoon season. They suggested the needto establish relationships between the groundwater dynamics of the areas having asimilar spatial pattern of significant trends, and the weather variables. Hence, there
1 The severe drought of 1987 spurred the Central Government to conceive its first NationalWater Policy.
Findikakis CH005.tex 7/3/2011 13: 35 Page 2
2 Groundwater management practices
Aquifer
Alluvium
Sandstone
Crystalline Rocks
Basalt
Limestone
Hilly area
40
Yield Potential(lps)
10–40
1–5
1–49
5–25
1
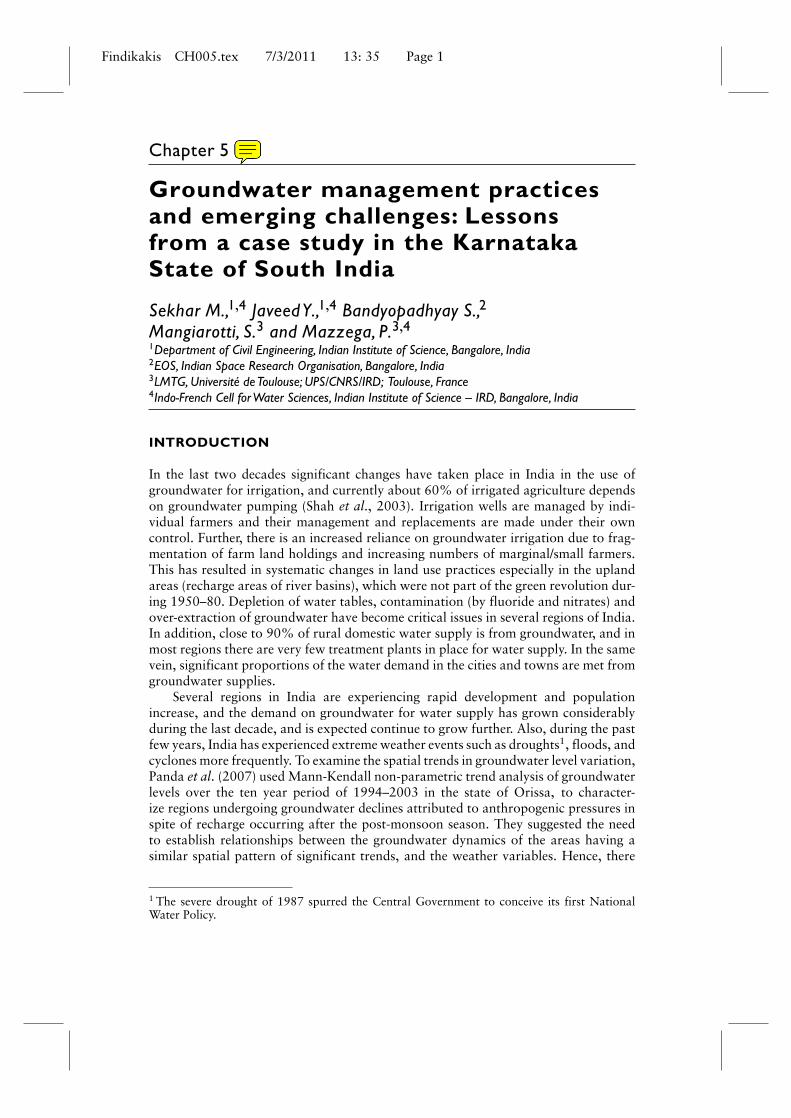
Figure 1 Major aquifer systems of India with well yield in liters/second (Source: Sharma & Sudhir Kumar,2008).
is clearly a need to examine the general trends of local climate variation and analyzethe relationship between these trends and groundwater level fluctuations. The impactof land use/land cover changes in certain settings is found to be much stronger thanthe climate variability and hence there is a need to characterize dominant patterns ofclimate and land use controls on the groundwater system for developing sustainablegroundwater resource programs (Scanlon, 2007).
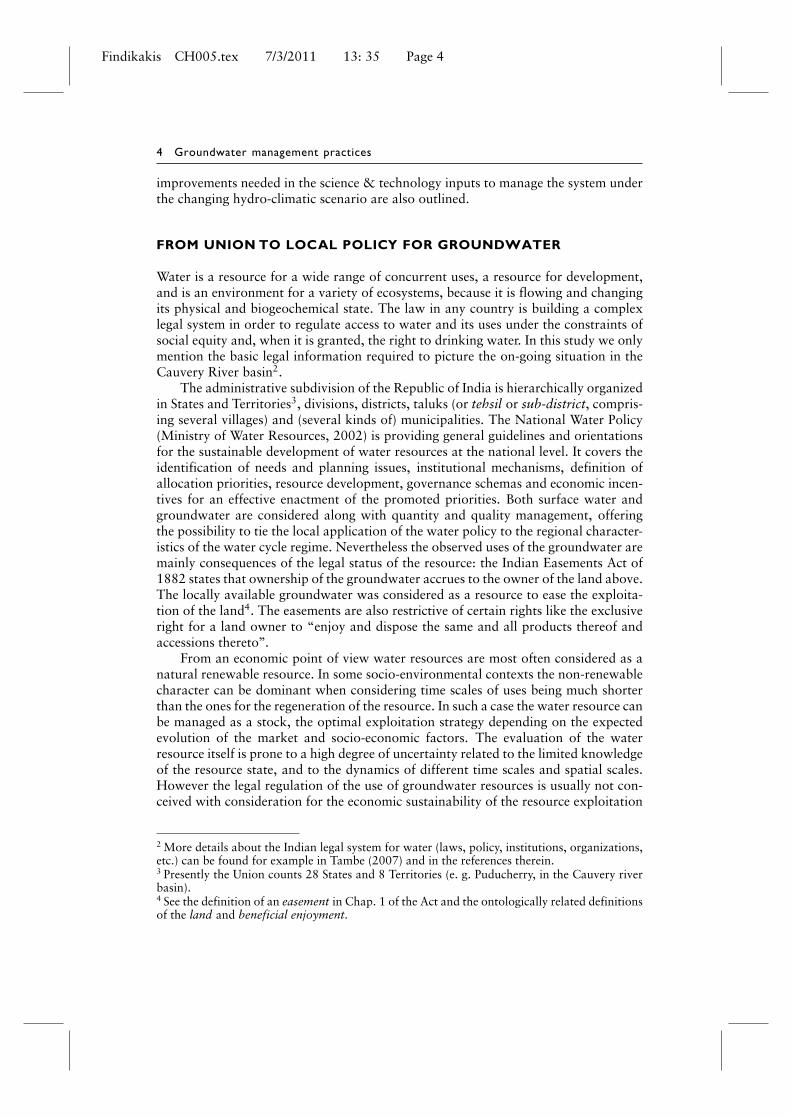
The geology of central and peninsular India is different and far more complex com-pared to that of the Indo-Gangetic basin, which consists of extensive alluvial aquifersthroughout. Figure 1, showing a map of major aquifers of India, suggests the domi-nance of basalt and crystalline rock formation in peninsular India. The water-bearing
Findikakis CH005.tex 7/3/2011 13: 35 Page 3
Lessons from a case study in the Karnataka State of South India 3
Area of North Ladakh not Draining in Indus
N
Indus78%
GangaWFR of Kach-Saur and Luni
WFR South of Tapi
51%
Sabarmati Mahi
Narmada
Godavari
Mahanadi
Subamarekha
Brahmani-Baitarani
Brahmaputhra-Meghna
EFR b Mahanadi and Godavari
EFR b Godavari and Krishna
EFR b Krishna and Pennar
EFR b Pennar and Cauvery
EFR South of Cauvery
Krishna
34%
7%
36%
9% 10%
3%
22%
20%
30%
37%23%
57%
�10%
�50%
10%–30%
30%–50%56%
33% Tapi
51%
Pennar
Cauvery
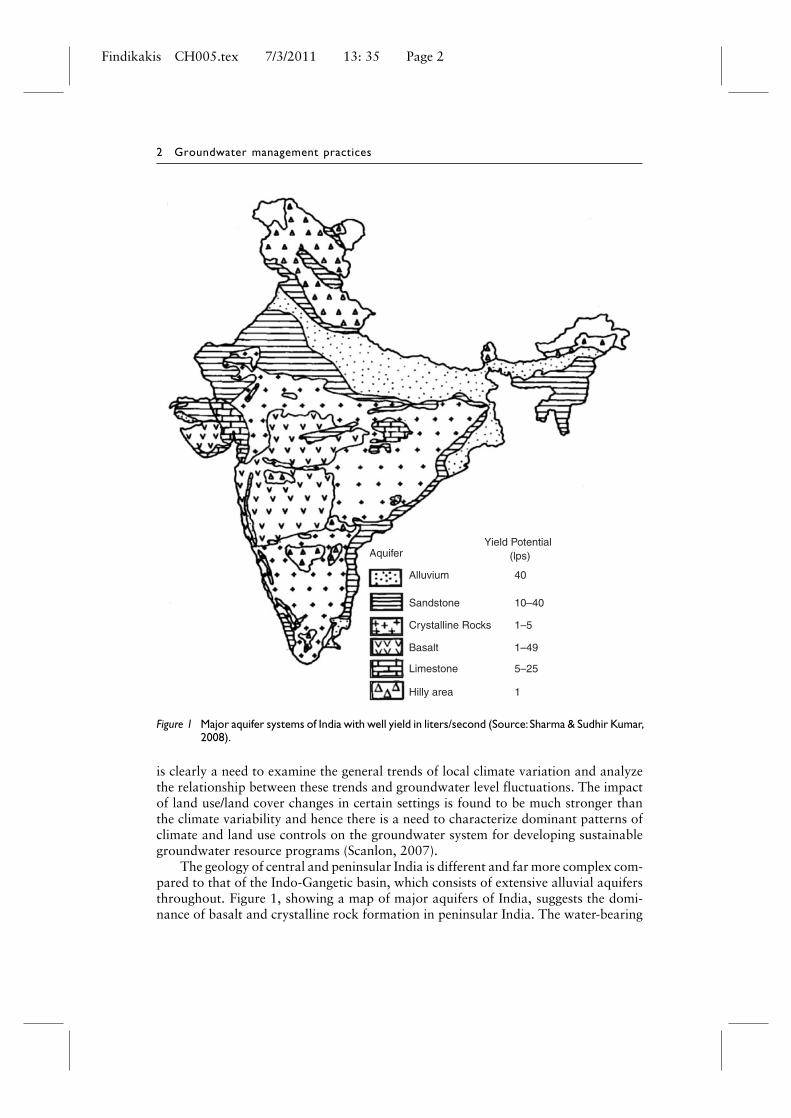
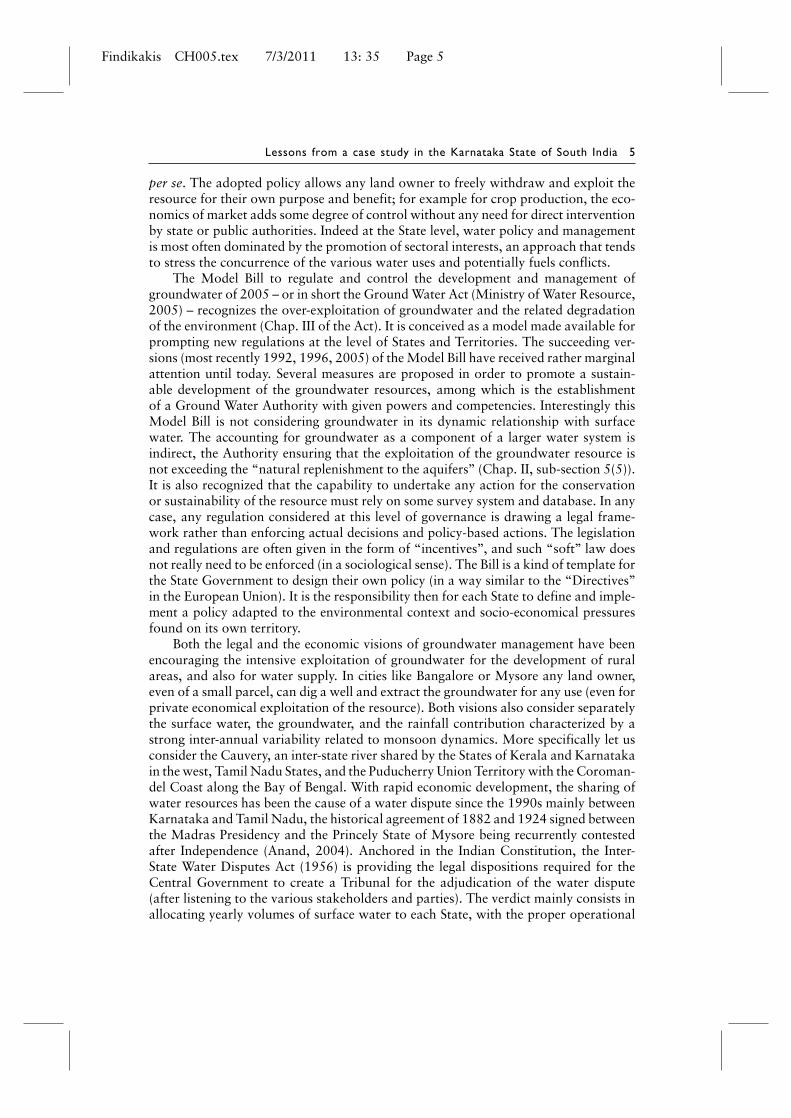
Figure 2 Proportion of groundwater potential developed in major river basins of India (Source: WorldBank, 2005).
and conveying properties of these aquifers vary greatly even over small distances, mak-ing scientific resource management critical and difficult at the same time (GoI, 1995).Overall, however, the yields (shown in liters/sec in Figure 1) of these aquifers are quitemodest and, in fact, much smaller than much of sub-Saharan Africa; yet, there is aheavy and growing dependence on groundwater irrigation even in these regions (Shah,2007). Figure 2 shows the groundwater potential developed in major river basins ofIndia (World Bank, 2005). The groundwater potential has been estimated using theGEC (1997) methodology. This shows the development taking place in parts of southIndia and especially in the Cauvery River basin, which is in the crystalline rock forma-tion. This presentation highlights the results of the studies in two districts in KarnatakaState and which are part of the Cauvery River basin, which has excessive shortageof water both in the surface and groundwater regimes due to the reasons describedabove. The presence of strong decadal variations in rainfall such as droughts, alongwith recent trends of spatio-temporal variations in the anthropogenic effects, providesdistinct groundwater signatures in the system at various scales, which are discussed.The current management practices and the baseline of the system are presented. The
Findikakis CH005.tex 7/3/2011 13: 35 Page 4
4 Groundwater management practices
improvements needed in the science & technology inputs to manage the system underthe changing hydro-climatic scenario are also outlined.
FROM UNION TO LOCAL POLICY FOR GROUNDWATER
Water is a resource for a wide range of concurrent uses, a resource for development,and is an environment for a variety of ecosystems, because it is flowing and changingits physical and biogeochemical state. The law in any country is building a complexlegal system in order to regulate access to water and its uses under the constraints ofsocial equity and, when it is granted, the right to drinking water. In this study we onlymention the basic legal information required to picture the on-going situation in theCauvery River basin2.
The administrative subdivision of the Republic of India is hierarchically organizedin States and Territories3, divisions, districts, taluks (or tehsil or sub-district, compris-ing several villages) and (several kinds of) municipalities. The National Water Policy(Ministry of Water Resources, 2002) is providing general guidelines and orientationsfor the sustainable development of water resources at the national level. It covers theidentification of needs and planning issues, institutional mechanisms, definition ofallocation priorities, resource development, governance schemas and economic incen-tives for an effective enactment of the promoted priorities. Both surface water andgroundwater are considered along with quantity and quality management, offeringthe possibility to tie the local application of the water policy to the regional character-istics of the water cycle regime. Nevertheless the observed uses of the groundwater aremainly consequences of the legal status of the resource: the Indian Easements Act of1882 states that ownership of the groundwater accrues to the owner of the land above.The locally available groundwater was considered as a resource to ease the exploita-tion of the land4. The easements are also restrictive of certain rights like the exclusiveright for a land owner to “enjoy and dispose the same and all products thereof andaccessions thereto’’.
From an economic point of view water resources are most often considered as anatural renewable resource. In some socio-environmental contexts the non-renewablecharacter can be dominant when considering time scales of uses being much shorterthan the ones for the regeneration of the resource. In such a case the water resource canbe managed as a stock, the optimal exploitation strategy depending on the expectedevolution of the market and socio-economic factors. The evaluation of the waterresource itself is prone to a high degree of uncertainty related to the limited knowledgeof the resource state, and to the dynamics of different time scales and spatial scales.However the legal regulation of the use of groundwater resources is usually not con-ceived with consideration for the economic sustainability of the resource exploitation
2 More details about the Indian legal system for water (laws, policy, institutions, organizations,etc.) can be found for example in Tambe (2007) and in the references therein.3 Presently the Union counts 28 States and 8 Territories (e. g. Puducherry, in the Cauvery riverbasin).4 See the definition of an easement in Chap. 1 of the Act and the ontologically related definitionsof the land and beneficial enjoyment.
Findikakis CH005.tex 7/3/2011 13: 35 Page 5
Lessons from a case study in the Karnataka State of South India 5
per se. The adopted policy allows any land owner to freely withdraw and exploit theresource for their own purpose and benefit; for example for crop production, the eco-nomics of market adds some degree of control without any need for direct interventionby state or public authorities. Indeed at the State level, water policy and managementis most often dominated by the promotion of sectoral interests, an approach that tendsto stress the concurrence of the various water uses and potentially fuels conflicts.
The Model Bill to regulate and control the development and management ofgroundwater of 2005 – or in short the Ground Water Act (Ministry of Water Resource,2005) – recognizes the over-exploitation of groundwater and the related degradationof the environment (Chap. III of the Act). It is conceived as a model made available forprompting new regulations at the level of States and Territories. The succeeding ver-sions (most recently 1992, 1996, 2005) of the Model Bill have received rather marginalattention until today. Several measures are proposed in order to promote a sustain-able development of the groundwater resources, among which is the establishmentof a Ground Water Authority with given powers and competencies. Interestingly thisModel Bill is not considering groundwater in its dynamic relationship with surfacewater. The accounting for groundwater as a component of a larger water system isindirect, the Authority ensuring that the exploitation of the groundwater resource isnot exceeding the “natural replenishment to the aquifers’’ (Chap. II, sub-section 5(5)).It is also recognized that the capability to undertake any action for the conservationor sustainability of the resource must rely on some survey system and database. In anycase, any regulation considered at this level of governance is drawing a legal frame-work rather than enforcing actual decisions and policy-based actions. The legislationand regulations are often given in the form of “incentives’’, and such “soft’’ law doesnot really need to be enforced (in a sociological sense). The Bill is a kind of template forthe State Government to design their own policy (in a way similar to the “Directives’’in the European Union). It is the responsibility then for each State to define and imple-ment a policy adapted to the environmental context and socio-economical pressuresfound on its own territory.
Both the legal and the economic visions of groundwater management have beenencouraging the intensive exploitation of groundwater for the development of ruralareas, and also for water supply. In cities like Bangalore or Mysore any land owner,even of a small parcel, can dig a well and extract the groundwater for any use (even forprivate economical exploitation of the resource). Both visions also consider separatelythe surface water, the groundwater, and the rainfall contribution characterized by astrong inter-annual variability related to monsoon dynamics. More specifically let usconsider the Cauvery, an inter-state river shared by the States of Kerala and Karnatakain the west, Tamil Nadu States, and the Puducherry Union Territory with the Coroman-del Coast along the Bay of Bengal. With rapid economic development, the sharing ofwater resources has been the cause of a water dispute since the 1990s mainly betweenKarnataka and Tamil Nadu, the historical agreement of 1882 and 1924 signed betweenthe Madras Presidency and the Princely State of Mysore being recurrently contestedafter Independence (Anand, 2004). Anchored in the Indian Constitution, the Inter-State Water Disputes Act (1956) is providing the legal dispositions required for theCentral Government to create a Tribunal for the adjudication of the water dispute(after listening to the various stakeholders and parties). The verdict mainly consists inallocating yearly volumes of surface water to each State, with the proper operational
Findikakis CH005.tex 7/3/2011 13: 35 Page 6
6 Groundwater management practices
monitoring system. Apart from the many socio-political criticisms that have been for-mulated when the verdict was published in 2007, a simple “scientific view’’ notices that(a) once again only one component of the water cycle is considered (the surface waterin this case) though it is known that the over-use of groundwater has a negative impacton the surface water availability (conversely the reduction of surface flows and streamsnegatively impact the replenishment of the groundwater) and (b) an analysis of the his-torical time series of rainfall and river flow shows that statistically the (legal) allocatedwater volume is likely not to be available every year for each State in the future5.
Starting from a survey of the current situation, the 2007 Report of the ExpertGroup on “ground water management and ownership’’ (Planning Commission, 2007)has analyzed the state of the art in groundwater management, governance and owner-ship, and proposed several measures for improving the sustainability of this resource,which is central to many economic activities and dimensions of social life. On one handsuch proposals are bound by many constraints, related in rural areas to the economiccapacities of small producers to pay any kind of tax or pay for the electricity for operat-ing pumps, the size of the parcels and irrigation infrastructures, etc. On the other hand,the negative impacts on the environment of an overexploitation of the groundwatershould be prevented, and projects aiming at producing new water resources (e.g. rain-water harvesting and aquifer recharge) or at its sparing use (improving productivity ofirrigated agriculture, etc.) are to be developed, as well as the control of the resource use(through the registration of existing wells, permits to dig new wells, systems for surfaceand groundwater survey, etc.). Every State Government can promote such initiativesthrough new regulations that try to anticipate the future socio-economic developmentand growth of the country. Karnataka State is implementing the various tools of itswater policy, the objectives of which are mainly to guarantee a minimum daily amountof drinking water to everyone, to develop irrigation, to improve performance of allwater projects and of irrigated agriculture, to harness the hydropower potential and toprovide a legislative, administrative and infrastructural environment, which will ensurefair, just and equitable distribution and utilization of the water resources (GoK, 2002).
However the political will to design and enforce new water policy orientationsscalable to the socio-environmental problems to be solved at the level of the Unionis questionable (Narasimhan, 2008). As noticed previously for other legal texts, thegroundwater is not really considered as one component of a larger system includinginteractions with surface waters and the rainfall regime. Today, scientific knowledgeis not used as a possible basis for the design of an integrated water policy (and rulemaking), nor for its implementation.
THE SOCIO-ENVIRONMENTAL CONTEXTIN THE KABINI RIVER BASIN
The current studies in hydrology provide a lot of useful information for the manage-ment and sustainability of the groundwater resource. They can also provide the basisfor an integrated scientific approach to the larger problem of water governance. Let us
5 Note that from a legal point of view the right to use some resource does not guarantee thatthis resource is available.
Findikakis CH005.tex 7/3/2011 13: 35 Page 7
Lessons from a case study in the Karnataka State of South India 7
illustrate our ideas with the analysis of the groundwater in the Kabini River (drainagearea ∼10,000 km2), a tributary of Cauvery River. The Cauvery River basin coversone-third of the area of Karnataka. Karnataka, a state in the south-west of India, has atotal land area of 191,791 km2 and a population of approximately 53 million, givinga population density of 276 people per km2 (DES, 2001). The state is enclosed bymountain ranges along much of the western, eastern and southern regions with peaksreaching 1,500 meters above sea level. Annual average precipitation ranges between500 and 3500 mm. Rainfall is lowest in the eastern regions of the state and increasesin the western areas, reaching its maximum over the coastal zone. Karnataka is oneof the more developed states in India and with a human development index (HDI) of0.650 in 2001 ranks seventh in the country. The HDI improved by 20 percent over the1991 figure of 0.541. Karnataka is predominantly an agricultural state with more than70 percent of the major agriculture area under rainfed conditions. Recurrent droughts,soil erosion, erratic rainfall, and groundwater depletion have impacted the potentialagricultural productivity significantly. Rainfed areas are often prone to these multiplerisks; therefore, efficient and sustainable use of natural resources has become a basicneed for rural economic development.
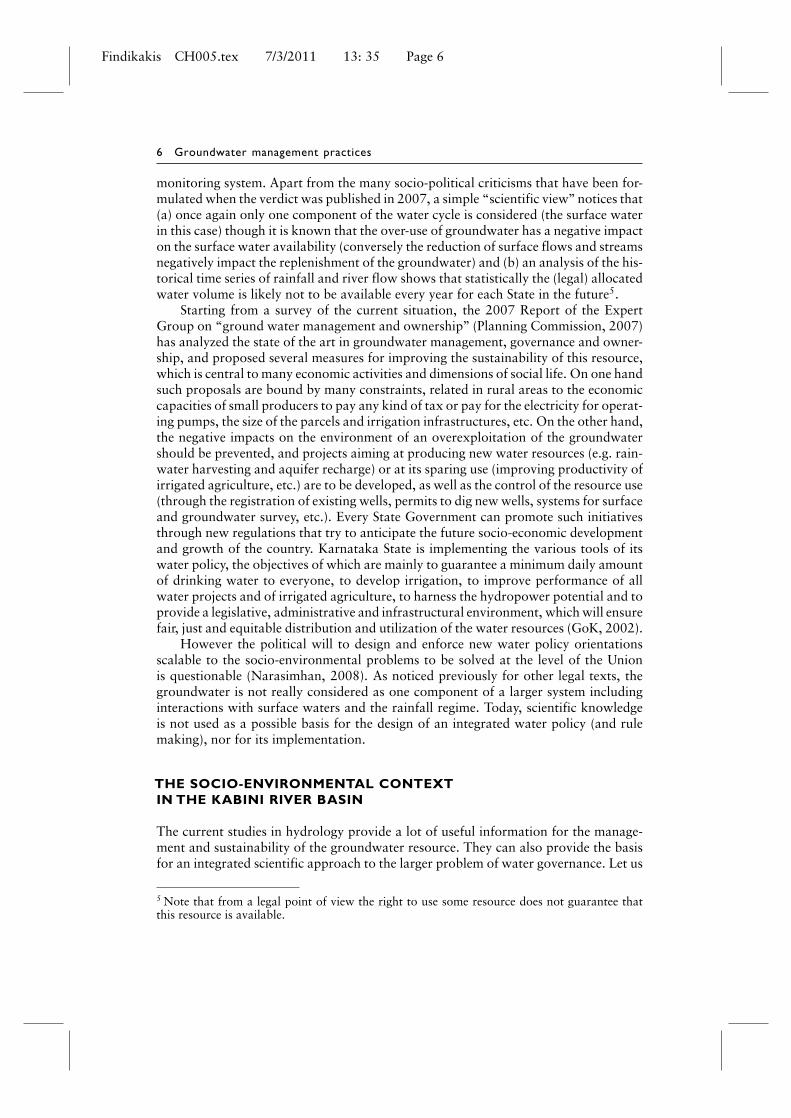
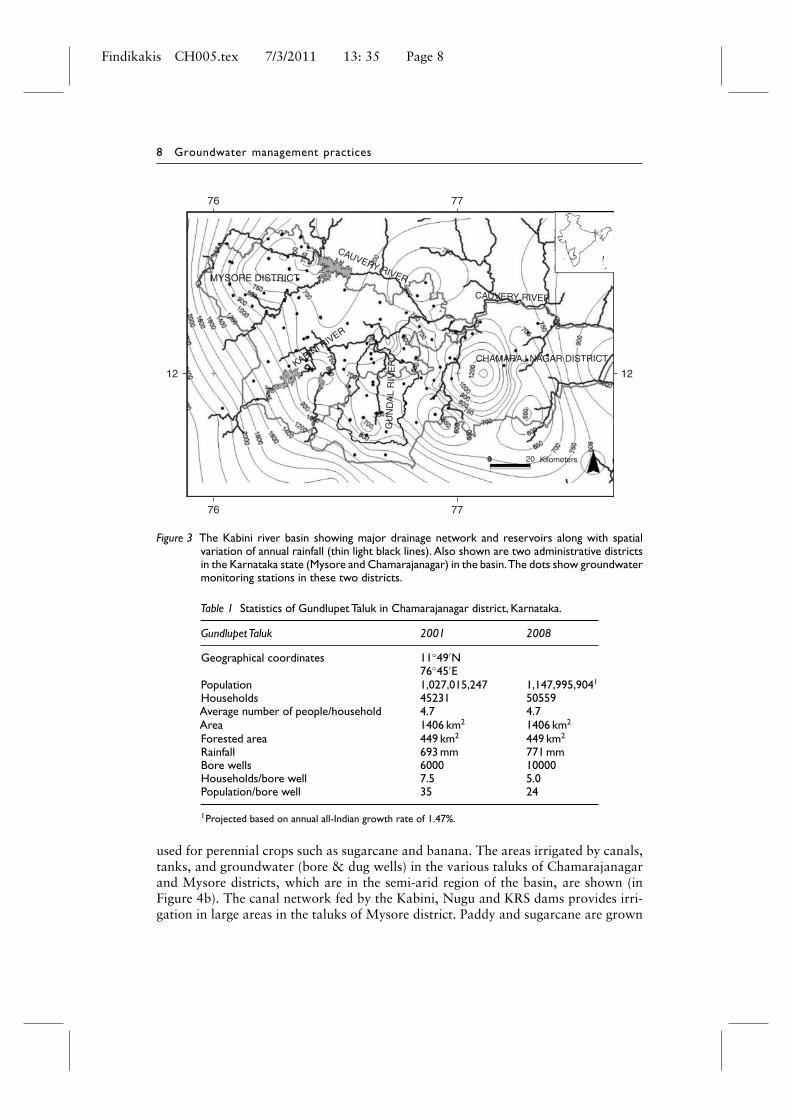
The Kabini River basin comprises the climatic and the geomorphological gradientforming on the edge of the rifted continental passive margin of the Karnataka Plateauin Peninsular India (Gunnell and Bourgeon, 1997). The West-East geomorphologicgradient is associated with a climatic gradient induced by the Western Ghâts, whichform a barrier to the monsoon winds coming from the Indian Ocean and moving northeast. A steep decline of the mean annual rainfall is recorded along the inland region,from 5000 mm/yr to 700 mm/yr (Pascal, 1982). The dynamics of the south-westernmonsoon cause a rapid change in the spatiotemporal pattern of precipitation in theKabini basin (Figure 3). The rainfall patterns also exhibit climatic trends as well asa strong inter-annual variability, like the extreme 1990 and 2002 droughts in thisregion (droughts recorded all across India in 1982, 1985, 1986, and 1987, based onParthasarathy et al., 1994).
The development of groundwater development exhibits characteristic patterns inthe Mysore and Chamarajanagar districts of Karnataka State. The sub-humid andsemi-arid zones in the Kabini River basin form the two administrative districts (Mysoreand Chamarajanagar) in the Karnataka state (Figure 3) and the landscape in thisregion is composed of shallow regolith and outcropping tors/inselbergs. Two majordams exist on the Cauvery and Kabini rivers,which irrigate large areas especially inthe Mysore district (a total geographical area of 6577 km2) in the region betweenthese two rivers. The south part of the Kabini River system in the Chamarajanagardistrict (a total geographical area of 5686 km2) has relatively lower irrigation fromsurface water systems and comprises about 22,000 irrigation wells, based on the cen-sus prepared by the Department of Minor Irrigation, Karnataka state in the year 2005.Typical statistics of Gundlupet Taluk in the Chamarajanagar district is given in Table 1.Conspicuous changes in the agriculture have occurred in the semi-arid zone of theKabini basin moving from agriculturally low water-consuming rainfed crops (sorghumand millet), to intensive agriculture (with increased double cropping), highly depen-dent on irrigation resulting in higher water demand and consumption. Large areas inthe uplands in the districts of the lower Kabini River basin (located in Karnataka state)are under groundwater irrigation (Figure 4a). Currently, groundwater is extensively
Findikakis CH005.tex 7/3/2011 13: 35 Page 8
8 Groundwater management practices
CHAMARAJ NAGAR DISTRICT
MYSORE DISTRICT
76 77
76 77
1212
0 20 Kilometers
CAUVERY RIVER
CAUVERY RIVER
KABINI RIVER
GU
ND
AL
RIV
ER
Figure 3 The Kabini river basin showing major drainage network and reservoirs along with spatialvariation of annual rainfall (thin light black lines). Also shown are two administrative districtsin the Karnataka state (Mysore and Chamarajanagar) in the basin.The dots show groundwatermonitoring stations in these two districts.
Table 1 Statistics of Gundlupet Taluk in Chamarajanagar district, Karnataka.
GundlupetTaluk 2001 2008
Geographical coordinates 11◦49′N76◦45′E
Population 1,027,015,247 1,147,995,9041
Households 45231 50559Average number of people/household 4.7 4.7Area 1406 km2 1406 km2
Forested area 449 km2 449 km2
Rainfall 693 mm 771 mmBore wells 6000 10000Households/bore well 7.5 5.0Population/bore well 35 24
1Projected based on annual all-Indian growth rate of 1.47%.
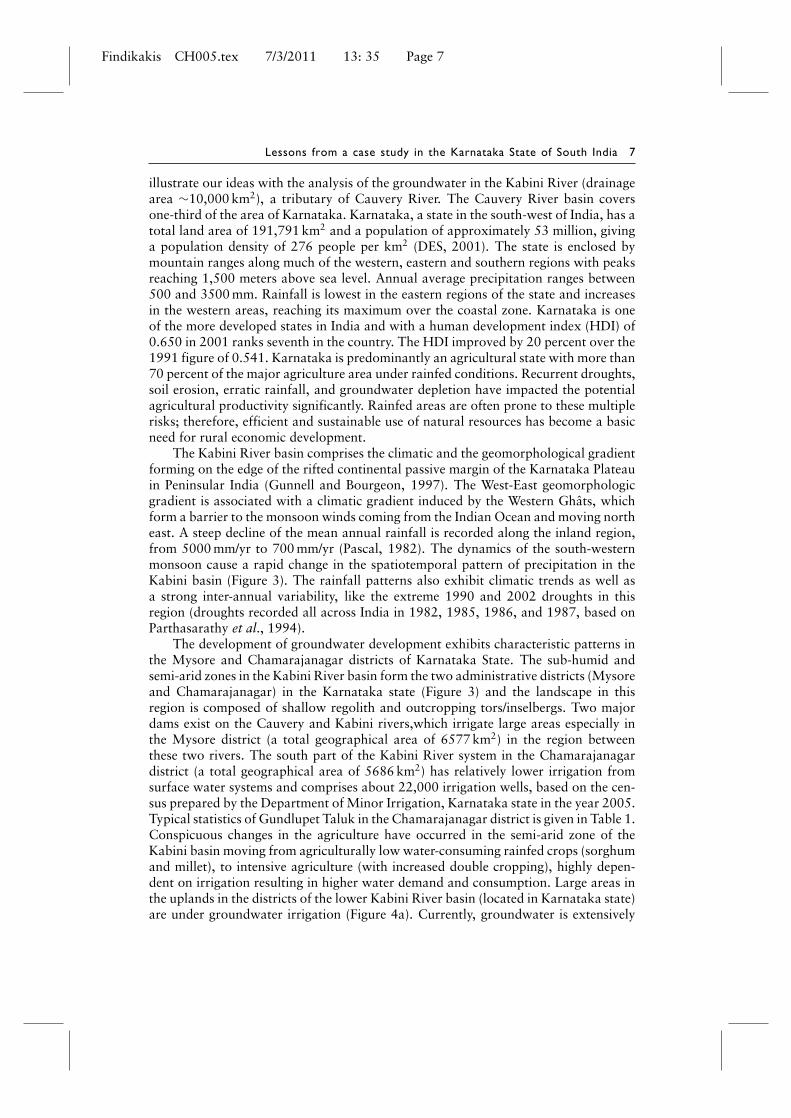
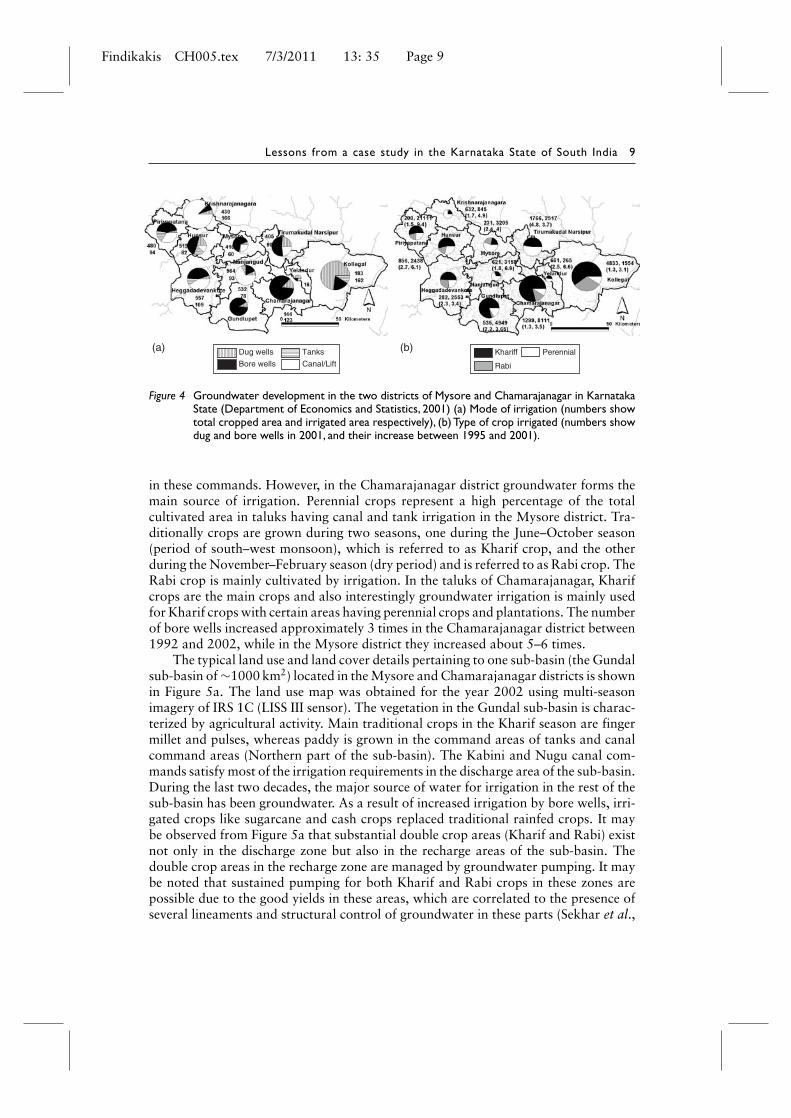
used for perennial crops such as sugarcane and banana. The areas irrigated by canals,tanks, and groundwater (bore & dug wells) in the various taluks of Chamarajanagarand Mysore districts, which are in the semi-arid region of the basin, are shown (inFigure 4b). The canal network fed by the Kabini, Nugu and KRS dams provides irri-gation in large areas in the taluks of Mysore district. Paddy and sugarcane are grown
Findikakis CH005.tex 7/3/2011 13: 35 Page 9
Lessons from a case study in the Karnataka State of South India 9
(a) (b) Khariff
Rabi
PerennialDug wells
Bore wells
Tanks
Canal/Lift
Figure 4 Groundwater development in the two districts of Mysore and Chamarajanagar in KarnatakaState (Department of Economics and Statistics, 2001) (a) Mode of irrigation (numbers showtotal cropped area and irrigated area respectively), (b) Type of crop irrigated (numbers showdug and bore wells in 2001, and their increase between 1995 and 2001).
in these commands. However, in the Chamarajanagar district groundwater forms themain source of irrigation. Perennial crops represent a high percentage of the totalcultivated area in taluks having canal and tank irrigation in the Mysore district. Tra-ditionally crops are grown during two seasons, one during the June–October season(period of south–west monsoon), which is referred to as Kharif crop, and the otherduring the November–February season (dry period) and is referred to as Rabi crop. TheRabi crop is mainly cultivated by irrigation. In the taluks of Chamarajanagar, Kharifcrops are the main crops and also interestingly groundwater irrigation is mainly usedfor Kharif crops with certain areas having perennial crops and plantations. The numberof bore wells increased approximately 3 times in the Chamarajanagar district between1992 and 2002, while in the Mysore district they increased about 5–6 times.
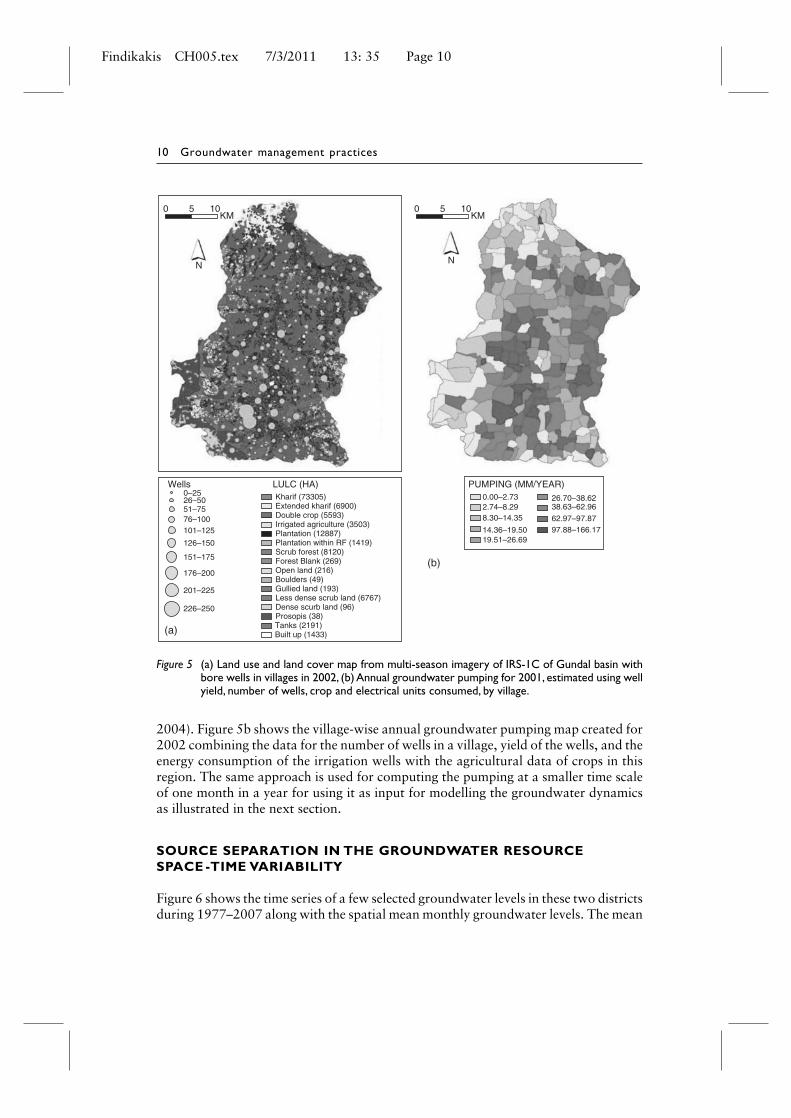
The typical land use and land cover details pertaining to one sub-basin (the Gundalsub-basin of ∼1000 km2) located in the Mysore and Chamarajanagar districts is shownin Figure 5a. The land use map was obtained for the year 2002 using multi-seasonimagery of IRS 1C (LISS III sensor). The vegetation in the Gundal sub-basin is charac-terized by agricultural activity. Main traditional crops in the Kharif season are fingermillet and pulses, whereas paddy is grown in the command areas of tanks and canalcommand areas (Northern part of the sub-basin). The Kabini and Nugu canal com-mands satisfy most of the irrigation requirements in the discharge area of the sub-basin.During the last two decades, the major source of water for irrigation in the rest of thesub-basin has been groundwater. As a result of increased irrigation by bore wells, irri-gated crops like sugarcane and cash crops replaced traditional rainfed crops. It maybe observed from Figure 5a that substantial double crop areas (Kharif and Rabi) existnot only in the discharge zone but also in the recharge areas of the sub-basin. Thedouble crop areas in the recharge zone are managed by groundwater pumping. It maybe noted that sustained pumping for both Kharif and Rabi crops in these zones arepossible due to the good yields in these areas, which are correlated to the presence ofseveral lineaments and structural control of groundwater in these parts (Sekhar et al.,
Findikakis CH005.tex 7/3/2011 13: 35 Page 10
10 Groundwater management practices
Wells
N
(a)
(b)
KM0 5 10
N
KM0 5 10
0–2526–5051–7576–100101–125
126–150
151–175
176–200
201–225
226–250
Tanks (2191)Built up (1433)
Prosopis (38)Dense scurb land (96)Less dense scrub land (6767)Gullied land (193)Boulders (49)Open land (216)Forest Blank (269)Scrub forest (8120)Plantation within RF (1419)Plantation (12887)Irrigated agriculture (3503)Double crop (5593)Extended kharif (6900)Kharif (73305)
97.88–166.1762.97–97.87
38.63–62.9626.70–38.62
19.51–26.6914.36–19.50
8.30–14.352.74–8.290.00–2.73
LULC (HA) PUMPING (MM/YEAR)
Figure 5 (a) Land use and land cover map from multi-season imagery of IRS-1C of Gundal basin withbore wells in villages in 2002, (b) Annual groundwater pumping for 2001, estimated using wellyield, number of wells, crop and electrical units consumed, by village.
2004). Figure 5b shows the village-wise annual groundwater pumping map created for2002 combining the data for the number of wells in a village, yield of the wells, and theenergy consumption of the irrigation wells with the agricultural data of crops in thisregion. The same approach is used for computing the pumping at a smaller time scaleof one month in a year for using it as input for modelling the groundwater dynamicsas illustrated in the next section.
SOURCE SEPARATION IN THE GROUNDWATER RESOURCESPACE -TIME VARIABILITY
Figure 6 shows the time series of a few selected groundwater levels in these two districtsduring 1977–2007 along with the spatial mean monthly groundwater levels. The mean
Findikakis CH005.tex 7/3/2011 13: 35 Page 11
Lessons from a case study in the Karnataka State of South India 11
0
5
10
15
20
25
30
35
40Dep
th t
o gr
ound
wat
er le
vel (
m)
Kagalvady (150113)
0
2
4
6
8
10
12
14
Siddianapura (150202)
0
10
20
30
40
50
60Dep
th t
o gr
ound
wat
er le
vel (
m)
Gundlupet (150201)
0
2
4
6
8
10
12
Krishnarajanagara (150601)
0
2
4
6
8
10
12
14Dep
th to
gro
undw
ater
leve
l (m
)
Kundanhalli (150902)0
1
2
3
4
5
6
Nanjangud (150801)
0
5
10
15
20
25
30
Sep
-77
Sep
-79
Sep
-81
Sep
-83
Sep
-85
Sep
-87
Sep
-89
Sep
-91
Sep
-93
Sep
-95
Sep
-97
Sep
-99
Sep
-01
Sep
-03
Sep
-05
Sep
-07
Sep
-77
Sep
-79
Sep
-81
Sep
-83
Sep
-85
Sep
-87
Sep
-89
Sep
-91
Sep
-93
Sep
-95
Sep
-97
Sep
-99
Sep
-01
Sep
-03
Sep
-05
Sep
-07
Sep
-77
Sep
-79
Sep
-81
Sep
-83
Sep
-85
Sep
-87
Sep
-89
Sep
-91
Sep
-93
Sep
-95
Sep
-97
Sep
-99
Sep
-01
Sep
-03
Sep
-05
Sep
-07
Sep
-77
Sep
-79
Sep
-81
Sep
-83
Sep
-85
Sep
-87
Sep
-89
Sep
-91
Sep
-93
Sep
-95
Sep
-97
Sep
-99
Sep
-01
Sep
-03
Sep
-05
Sep
-07
Sep
-77
Sep
-79
Sep
-81
Sep
-83
Sep
-85
Sep
-87
Sep
-89
Sep
-91
Sep
-93
Sep
-95
Sep
-97
Sep
-99
Sep
-01
Sep
-03
Sep
-05
Sep
-07
Sep
-77
Sep
-79
Sep
-81
Sep
-83
Sep
-85
Sep
-87
Sep
-89
Sep
-91
Sep
-93
Sep
-95
Sep
-97
Sep
-99
Sep
-01
Sep
-03
Sep
-05
Sep
-07
Sep
-77
Sep
-79
Sep
-81
Sep
-83
Sep
-85
Sep
-87
Sep
-89
Sep
-91
Sep
-93
Sep
-95
Sep
-97
Sep
-99
Sep
-01
Sep
-03
Sep
-05
Sep
-07
Dep
th to
gro
undw
ater
leve
l (m
)
Mellahalli (151001)
1980
1982
1984
1986
1988
1990
1992
1994
1996
1998
2000
2002
2004
2006
14
12
10
8
6
Dep
th to
GW
(m
)
Mean of 65 stations
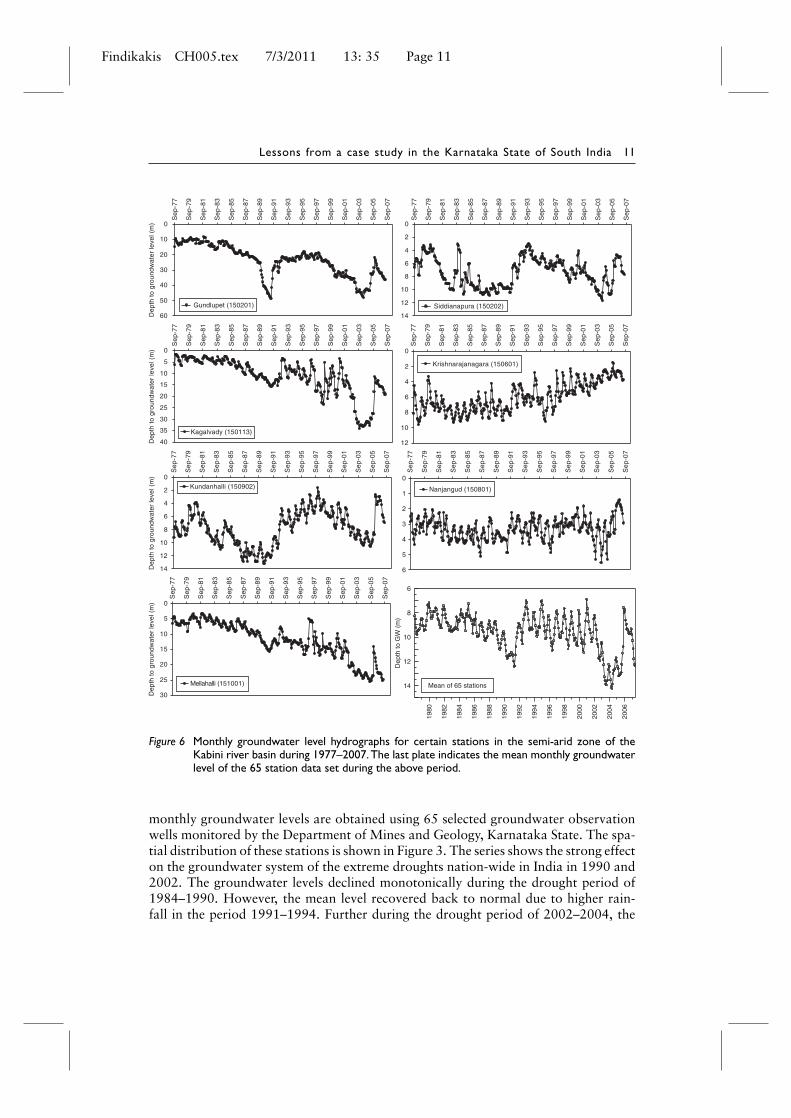
Figure 6 Monthly groundwater level hydrographs for certain stations in the semi-arid zone of theKabini river basin during 1977–2007.The last plate indicates the mean monthly groundwaterlevel of the 65 station data set during the above period.
monthly groundwater levels are obtained using 65 selected groundwater observationwells monitored by the Department of Mines and Geology, Karnataka State. The spa-tial distribution of these stations is shown in Figure 3. The series shows the strong effecton the groundwater system of the extreme droughts nation-wide in India in 1990 and2002. The groundwater levels declined monotonically during the drought period of1984–1990. However, the mean level recovered back to normal due to higher rain-fall in the period 1991–1994. Further during the drought period of 2002–2004, the
Findikakis CH005.tex 7/3/2011 13: 35 Page 12
12 Groundwater management practices
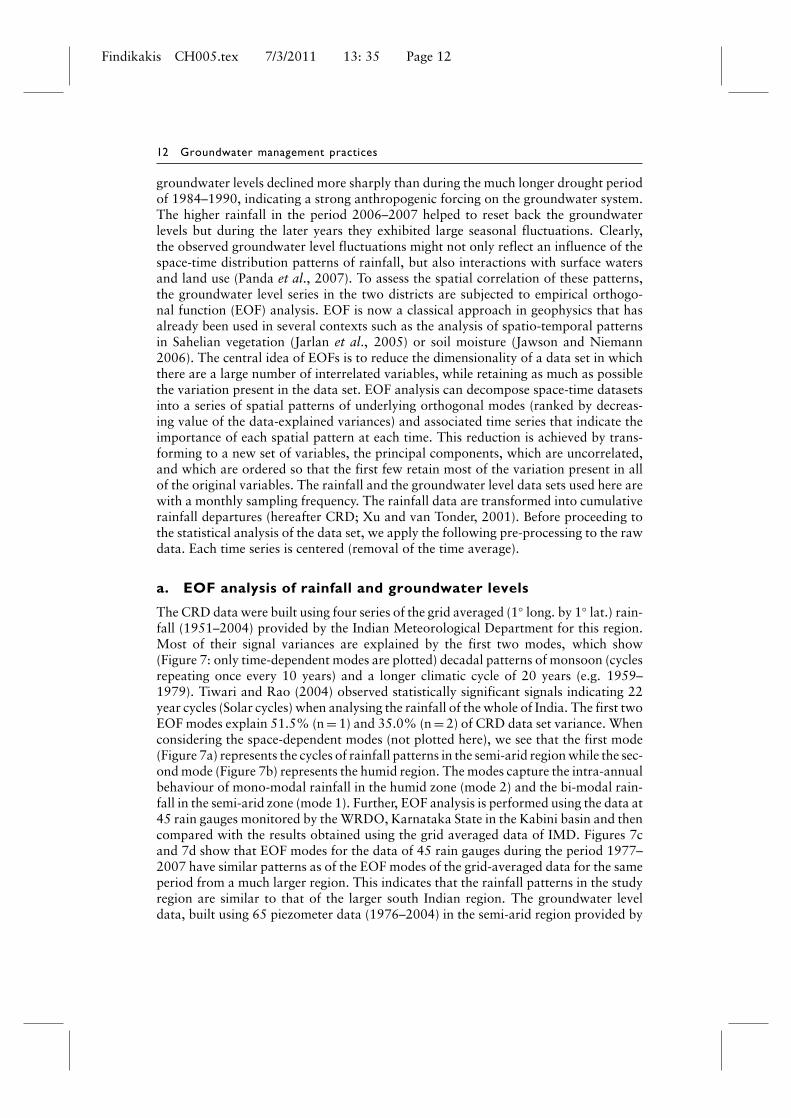
groundwater levels declined more sharply than during the much longer drought periodof 1984–1990, indicating a strong anthropogenic forcing on the groundwater system.The higher rainfall in the period 2006–2007 helped to reset back the groundwaterlevels but during the later years they exhibited large seasonal fluctuations. Clearly,the observed groundwater level fluctuations might not only reflect an influence of thespace-time distribution patterns of rainfall, but also interactions with surface watersand land use (Panda et al., 2007). To assess the spatial correlation of these patterns,the groundwater level series in the two districts are subjected to empirical orthogo-nal function (EOF) analysis. EOF is now a classical approach in geophysics that hasalready been used in several contexts such as the analysis of spatio-temporal patternsin Sahelian vegetation (Jarlan et al., 2005) or soil moisture (Jawson and Niemann2006). The central idea of EOFs is to reduce the dimensionality of a data set in whichthere are a large number of interrelated variables, while retaining as much as possiblethe variation present in the data set. EOF analysis can decompose space-time datasetsinto a series of spatial patterns of underlying orthogonal modes (ranked by decreas-ing value of the data-explained variances) and associated time series that indicate theimportance of each spatial pattern at each time. This reduction is achieved by trans-forming to a new set of variables, the principal components, which are uncorrelated,and which are ordered so that the first few retain most of the variation present in allof the original variables. The rainfall and the groundwater level data sets used here arewith a monthly sampling frequency. The rainfall data are transformed into cumulativerainfall departures (hereafter CRD; Xu and van Tonder, 2001). Before proceeding tothe statistical analysis of the data set, we apply the following pre-processing to the rawdata. Each time series is centered (removal of the time average).
a. EOF analysis of rainfall and groundwater levels
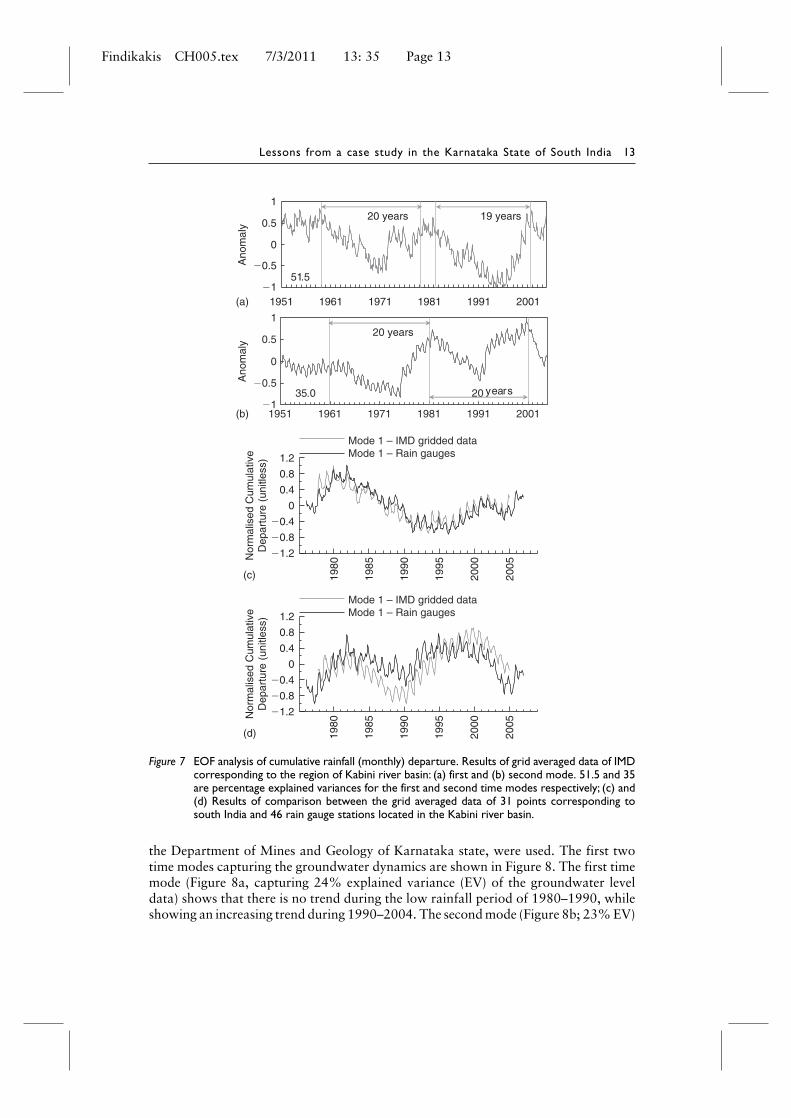
The CRD data were built using four series of the grid averaged (1◦ long. by 1◦ lat.) rain-fall (1951–2004) provided by the Indian Meteorological Department for this region.Most of their signal variances are explained by the first two modes, which show(Figure 7: only time-dependent modes are plotted) decadal patterns of monsoon (cyclesrepeating once every 10 years) and a longer climatic cycle of 20 years (e.g. 1959–1979). Tiwari and Rao (2004) observed statistically significant signals indicating 22year cycles (Solar cycles) when analysing the rainfall of the whole of India. The first twoEOF modes explain 51.5% (n = 1) and 35.0% (n = 2) of CRD data set variance. Whenconsidering the space-dependent modes (not plotted here), we see that the first mode(Figure 7a) represents the cycles of rainfall patterns in the semi-arid region while the sec-ond mode (Figure 7b) represents the humid region. The modes capture the intra-annualbehaviour of mono-modal rainfall in the humid zone (mode 2) and the bi-modal rain-fall in the semi-arid zone (mode 1). Further, EOF analysis is performed using the data at45 rain gauges monitored by the WRDO, Karnataka State in the Kabini basin and thencompared with the results obtained using the grid averaged data of IMD. Figures 7cand 7d show that EOF modes for the data of 45 rain gauges during the period 1977–2007 have similar patterns as of the EOF modes of the grid-averaged data for the sameperiod from a much larger region. This indicates that the rainfall patterns in the studyregion are similar to that of the larger south Indian region. The groundwater leveldata, built using 65 piezometer data (1976–2004) in the semi-arid region provided by
Findikakis CH005.tex 7/3/2011 13: 35 Page 13
Lessons from a case study in the Karnataka State of South India 13
Ano
mal
y
�1
�0.5
0
0.5
1
1951 1961 1971
Mode 1 – IMD gridded dataMode 1 – Rain gauges
Mode 1 – IMD gridded dataMode 1 – Rain gauges
1981 1991 2001
20 years
2035.0
(b)
years
�1
�0.5
0
0.5
1
1951 1961 1971 1981 1991 2001
20 years 19 years
51.5
Ano
mal
y
(a)
1980
1985
1990
1995
2000
2005
�1.2
�0.8
�0.4
0
0.4
0.8
1.2
Nor
mal
ised
Cum
ulat
ive
Dep
artu
re (
unitl
ess)
Nor
mal
ised
Cum
ulat
ive
Dep
artu
re (
unitl
ess)
(c)
1980
1985
1990
1995
2000
2005
�1.2
�0.8
�0.4
0
0.4
0.8
1.2
(d)
Figure 7 EOF analysis of cumulative rainfall (monthly) departure. Results of grid averaged data of IMDcorresponding to the region of Kabini river basin: (a) first and (b) second mode. 51.5 and 35are percentage explained variances for the first and second time modes respectively; (c) and(d) Results of comparison between the grid averaged data of 31 points corresponding tosouth India and 46 rain gauge stations located in the Kabini river basin.
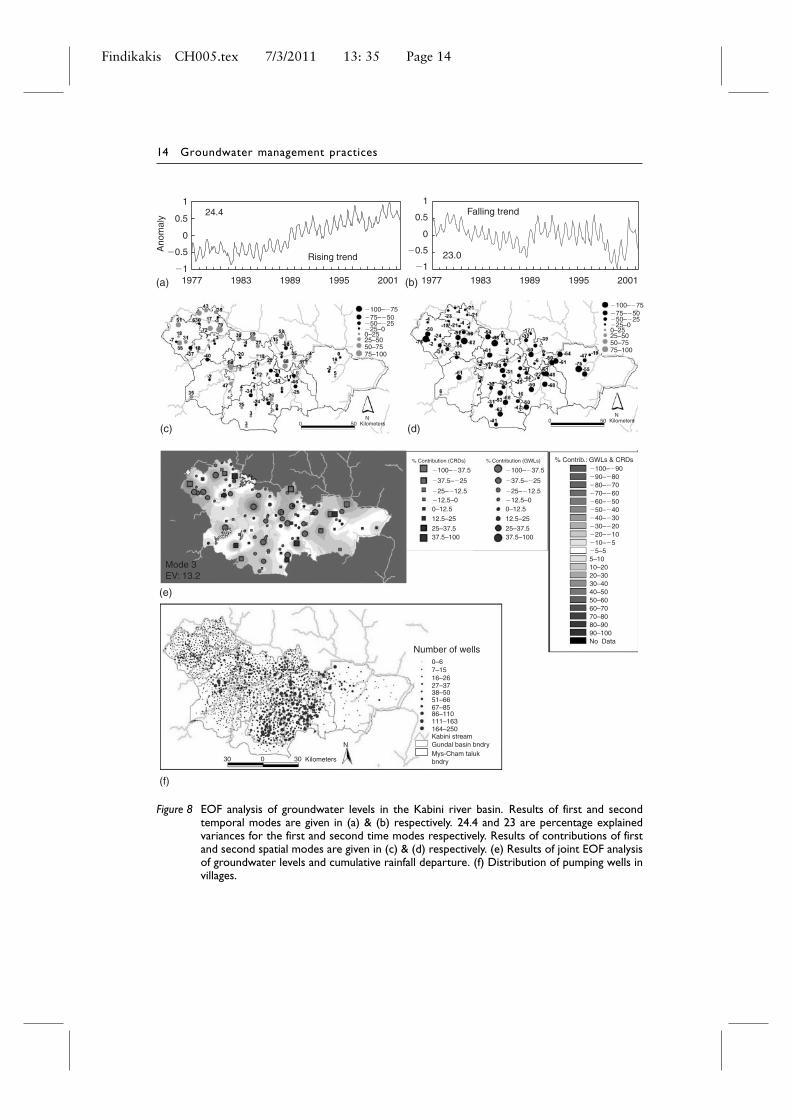
the Department of Mines and Geology of Karnataka state, were used. The first twotime modes capturing the groundwater dynamics are shown in Figure 8. The first timemode (Figure 8a, capturing 24% explained variance (EV) of the groundwater leveldata) shows that there is no trend during the low rainfall period of 1980–1990, whileshowing an increasing trend during 1990–2004. The second mode (Figure 8b; 23% EV)
Findikakis CH005.tex 7/3/2011 13: 35 Page 14
14 Groundwater management practices
0
0.5
1
1977 1983 1989 1995 2001 1977 1983 1989 1995 2001
24.4
Rising trend
0
0.5
1
23.0
Falling trend
Ano
mal
y
(a) (b)
(c) (d)
Mode 3EV: 13.2
(e)
(f)
Number of wells 0–67–1516–2627–3738–5051–6667–8586–110111–163164–250
N
Kilometers30030
Kabini streamGundal basin bndryMys-Cham talukbndry
0–12.5
12.5–25
% Contribution (CRDs) % Contribution (GWLs) % Contrib.: GWLs & CRDs
5–1010–2020–3030–4040–5050–6060–7070–8080–9090–100No Data
25–37.537.5–100
0–2525–5050–7575–100
�100–�75
�100–�37.5
�37.5–�25
�25–�12.5�12.5–0
0–12.5
12.5–25
25–37.537.5–100
�100–�37.5
�37.5–�25
�25–�12.5�12.5–0
�75–�50�50–�25�25–0
0–2525–5050–7575–100
�100–�75�75–�50�50–�25�25–0
0 50 KilometersN
0 50 KilometersN
Figure 8 EOF analysis of groundwater levels in the Kabini river basin. Results of first and secondtemporal modes are given in (a) & (b) respectively. 24.4 and 23 are percentage explainedvariances for the first and second time modes respectively. Results of contributions of firstand second spatial modes are given in (c) & (d) respectively. (e) Results of joint EOF analysisof groundwater levels and cumulative rainfall departure. (f) Distribution of pumping wells invillages.
Findikakis CH005.tex 7/3/2011 13: 35 Page 15
Lessons from a case study in the Karnataka State of South India 15
on the other hand captures the patterns of the groundwater level, which are similar tothe CRD observed during this period. The first and second spatial modes are shown inFigures 8c and 8d respectively. The local amplitude to be attributed to the first ground-water level time-mode (Figure 8a) is given by the first space-mode shown in Figure 8c(see the range of amplitudes in the legend). We see that this first mode mainly capturesthe coherent dynamics of the piezometers located along the river and canal regions(larger amplitudes in Figure 8c). The larger amplitudes corresponding to the secondtime-mode (Figure 8b) are spatially distributed as shown in Figure 8d. The piezometerslocated away from the river and canal system and in the upland regions capture thesepatterns of the dominant climatic signals. The upland region between the Cauvery andKabini rivers and the upland region to the south of the Kabini basin has these patterns.The mean monthly groundwater levels shown in Figure 6 have a similar dynamics.
A joint EOF analysis of CRD time series from 46 rain gauges and that of 65groundwater level monitoring stations was performed. Figure 8e shows the spatialmode corresponding to this analysis, which brings out the stations where the ground-water levels and cumulative rainfall departures are not similar. A comparison of theseresults with the well inventory data set of various villages in Fig. 8f indicates that spatialpatterns as observed in Figure 8e are similar. The EOF analysis provides time modes,which capture spatial mean patterns of the groundwater levels, and it is observed thatthey are following the decadal cycles in annual rainfall. The higher rainfall duringone cycle is able to help in bringing up the groundwater levels, which have declinedduring the lower rainfall cycle. This means that management strategies of augmentinggroundwater recharge are likely to help that much better, if practiced during the peri-ods of higher rainfall cycle. Further the spatial modes help in identifying clearly theregions affected by groundwater pumping or anthropogenic activities. This will help inclassifying areas from a large region that need to be selected for appropriate treatmentunder management plans.
b. Groundwater modeling for assessing climatic andland use effects
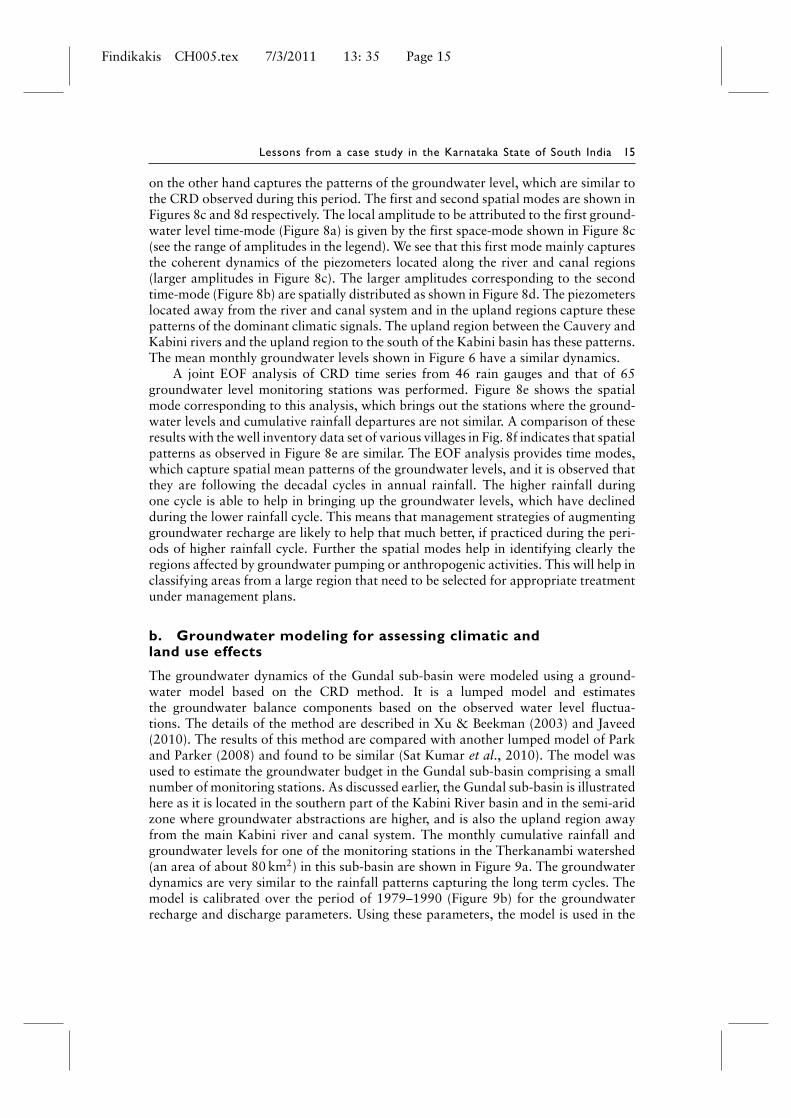
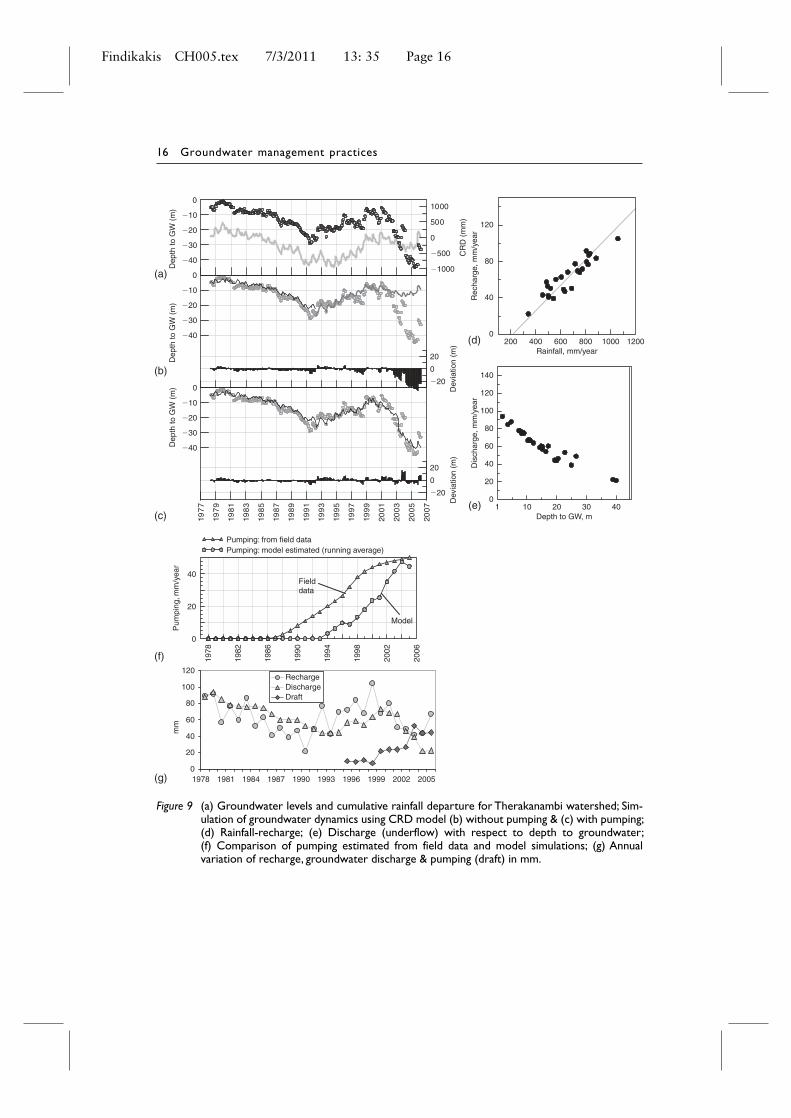
The groundwater dynamics of the Gundal sub-basin were modeled using a ground-water model based on the CRD method. It is a lumped model and estimatesthe groundwater balance components based on the observed water level fluctua-tions. The details of the method are described in Xu & Beekman (2003) and Javeed(2010). The results of this method are compared with another lumped model of Parkand Parker (2008) and found to be similar (Sat Kumar et al., 2010). The model wasused to estimate the groundwater budget in the Gundal sub-basin comprising a smallnumber of monitoring stations. As discussed earlier, the Gundal sub-basin is illustratedhere as it is located in the southern part of the Kabini River basin and in the semi-aridzone where groundwater abstractions are higher, and is also the upland region awayfrom the main Kabini river and canal system. The monthly cumulative rainfall andgroundwater levels for one of the monitoring stations in the Therkanambi watershed(an area of about 80 km2) in this sub-basin are shown in Figure 9a. The groundwaterdynamics are very similar to the rainfall patterns capturing the long term cycles. Themodel is calibrated over the period of 1979–1990 (Figure 9b) for the groundwaterrecharge and discharge parameters. Using these parameters, the model is used in the
Findikakis CH005.tex 7/3/2011 13: 35 Page 16
16 Groundwater management practices
0
20
40
60
80
100
120
1978 1981 1984 1987 1990 1993 1996 1999 2002 2005
RechargeDischargeDraft
mm
(a)
(b)
0
�20
0
20
Dev
iatio
n (m
)
�1000
�500
0
500
1000
CR
D (
mm
)
019
77
197
9
198
1
198
3
198
5
198
7
198
9
199
1
199
3
199
5
199
7
199
9
200
1
200
3
200
5
200
7
�40
�30
�20
�10
�40
�30
�20
�10
�40
�30
�20
�10
0
Dep
th to
GW
(m
)D
epth
to G
W (
m)
Dep
th to
GW
(m
)
�20
0
20
Dev
iatio
n (m
)
Dis
char
ge, m
m/y
ear
Rec
harg
e, m
m/y
ear
(c)
(f)
(g)
1978
1982
1986
1990
1994
1998
2002
2006
0
20
40
Pum
ping
, mm
/yea
r
Pumping: from field data Pumping: model estimated (running average)
Model
Fielddata
200 400 600 800 1000 1200Rainfall, mm/year
0
40
80
120
(d)
1 10 20 30 40Depth to GW, m
0
20
40
60
80
100
120
140
(e)
Figure 9 (a) Groundwater levels and cumulative rainfall departure for Therakanambi watershed; Sim-ulation of groundwater dynamics using CRD model (b) without pumping & (c) with pumping;(d) Rainfall-recharge; (e) Discharge (underflow) with respect to depth to groundwater;(f) Comparison of pumping estimated from field data and model simulations; (g) Annualvariation of recharge, groundwater discharge & pumping (draft) in mm.
Findikakis CH005.tex 7/3/2011 13: 35 Page 17
Lessons from a case study in the Karnataka State of South India 17
simulation framework during 1991–2007 using the rainfall as the model forcing. Thegroundwater level simulations capture the measured patterns but fail to match the levelsduring 2000–2007. Clearly, not considering the effect of pumping shows a poor modelresponse in the later period. In the next step, the model is simulated by choosing suit-able pumping such that a good performance between simulations and measurementsresults during 2000–2007 (Figure 9c). The pumping simulated using the model is com-pared with the field estimates obtained based on the crop statistics, number of wellsoperating, the yields and the number of hours of pumping (Figure 9f). These estimatesare made for each of the villages in the watershed and aggregated for comparison withthe model simulations. Clearly the trends of groundwater pumping are similar but itis observed that there is a lag between model simulations and field estimate. The dif-ferences may be due to the scale of averaging the field estimates. The model used herenot only provides the recharge but also the groundwater discharge. A plot of annualrecharge and rainfall is shown in Figure 9d and the groundwater discharge (underflow)with depth to the groundwater level is shown in Figure 9e. The temporal variationsof annual groundwater balances simulated using the model, are shown in Figure 9g.During the period 1979–1990, the imbalances of annual groundwater recharge anddischarge result in the groundwater storage changes. In the later periods the ground-water discharge plus the pumping are balanced by recharge. The higher pumping inthe later years results in reduced groundwater discharge. The groundwater dischargeforms the underflow from the watershed and relates to the base flow to the streamand tank system of the Gundal River, which drains into the Kabini River. Table 2shows the typical estimate of averaged groundwater draft (276 mm) in a year in thegroundwater irrigated areas in the south region of the Gundal sub-basin. The averagedraft computed for this entire region combining the irrigated and non-irrigated areas isalso given (26 mm), which is one order of magnitude lower than the irrigated areas inthe total cropped area and significantly smaller, as shown in Figure 2a, for the Gund-lupet Taluk. As the recharge is 53 mm, the groundwater irrigated areas are pumpinggroundwater five times the rate of the recharge. However, when averaged over theentire taluk scale, the groundwater development does not show the same ratio withregard to pumping and recharge. The current practice in India is to compute bothgroundwater draft and recharge at the Taluk scale in hectare-meter (HaM) units. Fol-lowing this approach, the net groundwater draft due to irrigation averaged over theGundlupet Taluk is 3640 HaM whereas the net draft from the irrigated area of 75 km2
alone is 2070 HaM. The recharge for the Gundlupet Taluk is 7420 HaM, while for theirrigated area is 398 HaM.
The results clearly indicate that groundwater budgets made at a larger scale are notso useful for targeting management decisions at the scale of a village, for example. Onepossible approach is highlighted here that can be used to achieve groundwater storagechanges for a year, by using the above modeling results combined with village scale datasets of groundwater levels and pumping. This is demonstrated for the Therakanambiwatershed discussed above for the year 2008. Through the model results it is possibleto obtain the recharge-rainfall and discharge-depth relationships as discussed earlier,which are applicable for a region. The groundwater levels in a large number of wellsin this watershed are measured a few times in a year to obtain the mean depth of thegroundwater level in each village of this watershed. Using the groundwater dischargewith depth to groundwater level (Figure 9E), the annual groundwater discharge is
Findikakis CH005.tex 7/3/2011 13: 35 Page 18
18 Groundwater management practices
Table 2 Groundwater statistics of southern region of Gundal sub-basin.
Part of Gundal basin in GundlupetTaluk Groundwater statistics
Number of wells 8000Yield/well ∼2 l/s = 7.2 m3/hTotal hours of pumping/year 360 h (3 months) mainly KharifGroundwater pumped /year 0.021 km3
Area irrigated by wells 75 km2
Total area 800 km2
Draft (in irrigated areas) 276 mmDraft (averaged in total area) 26 mmRainfall 771 mmRecharge 53 mm
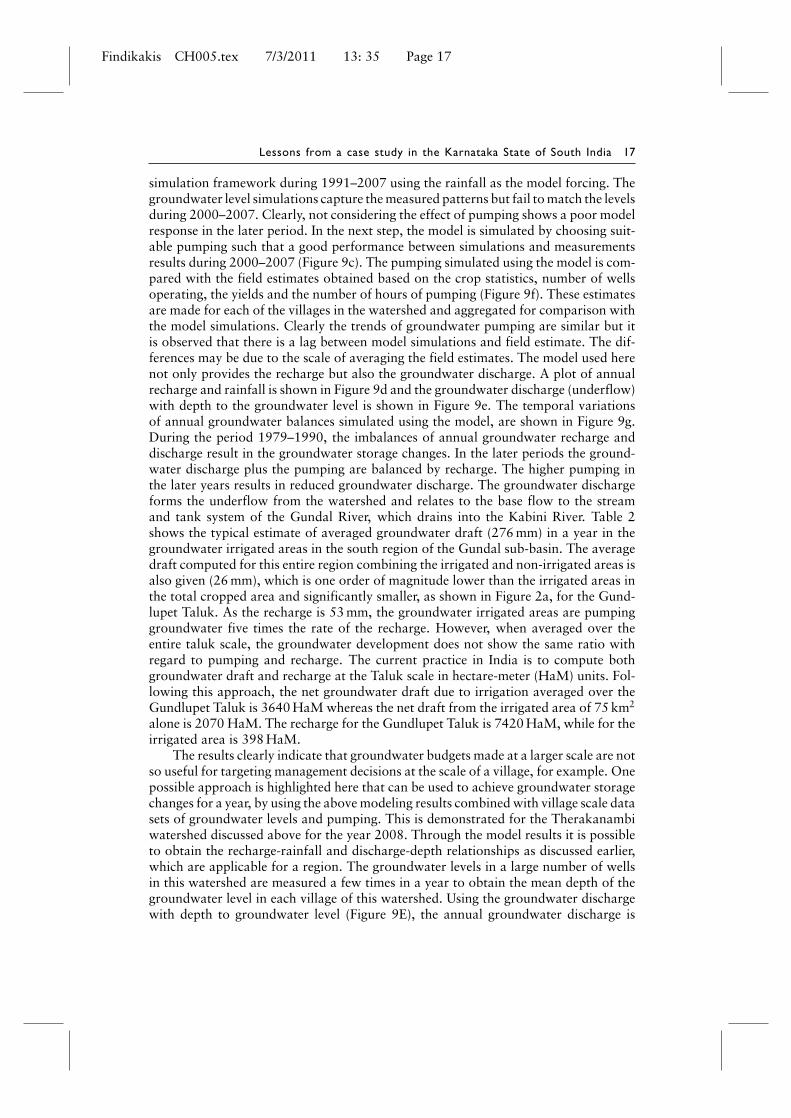
estimated for each of the villages. Using the recharge-rainfall relationship (Figure 9d),the annual recharge is estimated for each of the villages for the year 2008. The aver-age yields (in liters per second) are obtained in several wells in each of these villagesthrough field surveys. This is combined with state-organized data collection of electri-cal energy consumed at each well combined with number of hours of electrical supply,and yielded the spatial and temporal dynamics of the groundwater pumping in a vil-lage. Details of the field campaign and data collected are presented in Javeed (2010).Based on this the annual groundwater pumping in each village is estimated. The annualgroundwater storage change is computed for each village based on the estimated bal-ance components of recharge, groundwater discharge (underflow) and the pumpingfor the year 2008. The positive values of groundwater storage change indicate thatannual recharge is higher than the sum of groundwater pumping and groundwaterdischarge in a village. By spatially distributing the groundwater budget through suchan approach it is feasible to identify villages with negative groundwater storage changeand target them for applying management decisions. The results are shown for eachvillage of Therakanambi watershed in Figure 10. The figure also presents the scale atwhich current annual recharge and annual groundwater pumping are estimated in theKarnataka state.
CHALLENGES & GAPS
Ensuring resource sustainability and equitable access of groundwater for both irri-gation and drinking water in rural areas (close to 90% of rural domestic watersupply is from groundwater) is a vast and complex task, involving many dimensions,such as questions of inter-sectoral competition (especially with irrigation), interfacewith other programs and policies such as watershed development, intra-communityinequities, and capacity-building for various agencies involved. Tied to these socio-political dimensions are the scientific and technological dimensions of the problem.These cover four major aspects, given below.
• Understanding micro-level groundwater hydrology: The science of groundwaterhydrology in India has, however, focused largely on irrigation-relevant variablesand scales, and on exploitation rather than sustainable use. Groundwater data are
Findikakis CH005.tex 7/3/2011 13: 35 Page 19
Lessons from a case study in the Karnataka State of South India 19
�50
�1 �17
�52
�7
�18
�21
�15
�44
�18
�17 �17
�16
�20
�13�19
�34
�13
�4�6
�1
Gundal basin0 1 2 3 4 5 Kilometers
(By watershed)
LEGEND
N
Safe (127)
Semi critical (17)Critical (10)Over exploited (80)
Watershed with code
0
N
10 Kilometers
STATUS OF GROUNDWATER UTILIASTION KARNATAKA STATE
Figure 10 Status of groundwater in ∼234 watersheds is given in Karnataka State, South India, witha typical watershed representing the size of Gundal basin. Results of groundwater balanceestimated for each village of Therakanambi watershed for the year 2007 based on well andelectricity usage census, groundwater levels in each village combined with relationships ofrainfall-recharge and discharge-groundwater depth using.
still often inaccessible or unavailable at the right scale (Arghyam, 2008). The enor-mous variety of geological, climatic and soil hydraulic conditions in the countryremains only partially understood. There are substantial gaps in basic informationon groundwater availability and agricultural use. In general, however, agricultural
Findikakis CH005.tex 7/3/2011 13: 35 Page 20
20 Groundwater management practices
groundwater use appears to be substantially underestimated in most publishedfigures (Giordano and Villholth, 2007).
Several towns and cities in Karnataka state use groundwater for their waterneeds. Hence apart from agricultural areas, there is a need to monitor and esti-mate the groundwater use and status for such cities and towns, wherein suchestimates have to be performed at a very fine spatial scale. Currently there is nomonitoring approach at the required scale. Under the project for integrated urbanwater management being carried out by Arghyam (an NGO), the first author is per-forming studies of groundwater assessment and management for Mulbagal townin Karnataka. One aspect of this study is to assess the status of groundwater at afine scale relevant to the town for a better management of the resource.
• Combining scientific understanding with local knowledge: There is a vast thoughpossibly un-systematized body of local knowledge that needs to be integrated intothe science of groundwater management to make it practical and scalable to thesize of the problem. Shaw and Sutcliffe (2003) in their documentation of ancientsmall dams in the Betwa basin of central India link the size of these structures to therunoff from their catchment. This link leads one to believe that the builders of thesestructures followed some variant of the rainfall-runoff curve during their design ofthese structures and that they used sound observations of local hydrology. Recently,Krishnan et al. (2008) found that one efficient way to tap such local groundwaterknowledge is through well drillers. In the Vaishali district of Bihar state in east-ern India, a new methodological approach was used to identify and sensitize welldrillers towards creating a local groundwater database. A localized lithology of asingle village was created using both the experiential knowledge and current prac-tice of these drillers. Especially in the case of hard rock areas, tapping such informa-tion from well drillers and harnessing it can potentially open up a new directionfor localized groundwater management. Krishnan et al. (2008) believe that thelarge scale picture of surface lineaments available through geophysical and remotesensing studies, imparts a global picture to this localized knowledge and a poten-tial fusing of these two can be highly potent. Similarly the state-organized datacollection of electrical energy consumed at each well when combined with numberof hours of supply and yield of wells can be a wealth of information on the spatialand temporal dynamics of the plot level groundwater pumping in a village or awatershed as illustrated in Figure 5b of this study. Such information linking agri-cultural productivity, land use and land cover patterns can also provide estimates ofeconomic variables at smaller spatial scales and can lead to better estimates of vul-nerability and externalities of other forcing apart from groundwater. An exampleof obtaining annual groundwater storage change in each village from conventionalmodeling combined with gathering auxiliary data is demonstrated above.
• Management strategies: Watershed development projects (e.g. ‘Sujala’ watershedproject in Karnataka State), have been taken up across the country as a waterrecharge technology with an objective to improve the productive potential ofselected watersheds and their associated natural resource base (Milne, 2007). Rain-water harvesting technologies are being promoted to mitigate the groundwaterquality threats for safe drinking water needs. Recent approaches (APFAMGS,2006) are also looking into the demand-side management through participatoryhydrological monitoring, a strategy adopted to transform individual groundwater
Findikakis CH005.tex 7/3/2011 13: 35 Page 21
Lessons from a case study in the Karnataka State of South India 21
users into water resource literates. Based on this knowledge, the farmers havestarted appreciating the causes leading to groundwater changes, rainfall-rechargerelationship, pumping capacity of bore wells and water requirements for vari-ous crops. Such strategies can foster community-based agreements to regulatemeasures of groundwater use and facilitate farmers’ ability to adjust to changinggroundwater conditions.
• Water Policy impact assessment with multi-agent systems: Multi-agent systems arebeing developed for stimulating the participative approaches to the managementof common resources, and for building a new culture of environmental respon-sibility shared by the stakeholders, decision- and rule-makers (Barreteau et al.,2001; Becu et al., 2008). A deep reform of water resource management in southIndia is likely to have to reconsider among others the link between land ownershipand water resource ownership, the pricing of the resource, the pricing of powerconsumption, and charges for the use of and access to the public infrastructurefor irrigation (and other supplies, energy, roads, etc.), as well as the market-drivenoptions in agricultural development, and co-dependency of the city and rural areas.Many different policy orientations supported by the proper legal tools (the designof which is itself presenting a large variety of possibilities) can be conceived, withhuge potential impacts on the resource, ecosystem and environmental sustain-ability, and also on the social organization and economy. The targeted impactsmotivate the development and enforcement of legal frameworks (laws and insti-tutions). Some unexpected impacts are also most likely to occur, the new rulestriggering social adaptations and socio-environmental feedbacks. Plausible sce-narios of what might happen when a new water policy will be adopted can also bebuilt using hybrid multi-agent systems (modeling the roles and decision-makingprocesses under legal and other normative constraints), and equation-driven sys-tems (modeling hydrological and ecological dynamics) in interoperability withGIS. We are now beginning to assemble the various building blocks allowing us tosimulate via computer simulation the potential direct and indirect impacts of theenforcement of new public policy in the interrelated domains of water resourceand environmental management (Boulet et al., 2009), in the specific context of theCauvery River basin, as conceived from the point of view of a panel of scientific dis-ciplines. Such simulation tools will also play a key role in the comparative studiesof the differential impacts: (a) of different policy and legal frameworks on the same“social-ecological system’’ (Oström et al., 2007), and (b) of the same policy andaccompanying legal framework over different socio-ecosystems, in very uncertainenvironmental, climatic, social and economic contexts (Anderies et al., 2007).
CONCLUSIONS
We have seen in this study that a statistical treatment of long time series of thewater table level strongly suggests a marked depletion of the groundwater resource, inparticular in the irrigated watersheds in two districts of Karnataka state, which are inthe Kabini River basin. It is likely that such depletion cannot be explained by a reduc-tion of the yearly rainfall input or inter-annual monsoon variability. Today the overuseand overexploitation of the groundwater resource is probably the main cause of this
Findikakis CH005.tex 7/3/2011 13: 35 Page 22
22 Groundwater management practices
trend, a practice that has overall allowed India to significantly increase the ratio of thenational food production to population size since Independence. But this policy mightnot be sustainable, even over a relatively short time scale of a few years or decades. Atthe same time the needs of agriculture and industry, and for water supply to the cities,are rapidly increasing. The economic development of up-stream States and watershedsis affecting down-stream States and watersheds, with both the overuse of groundwaterand surface water affecting each other and leaving rivers with intermittent courses,and dams or tanks dry or with a negative recharge balance over a period of years.
At a State level the development of technological platforms (including GIS, models,multi-agent systems, etc.) allowing for an a priori impact analysis and assessment of theplanned water public policy or water-related legal systems (including the norms, institu-tions and organizational networks) must be developed by scientists in close cooperationwith policy- and rule-makers, in order to explore various social-ecological trajectoriestoward sustainable development, with the choice of a specific scenario being of courseleft to the will of civil society and of its representatives at the various governance levels.
One practical conclusion of this work is that for purposes of assessing the intensityand sustainability of groundwater use, data should not be averaged at the taluk scale,but at a smaller scale that accounts for the distribution of groundwater users withineach taluk. The science-based decision support tools that can provide informationat village/small watershed scale also need to be developed, which can alleviate thecurrent constraints impeding the planning and decision-making due to lack of data ata smaller scale. An approach is presented by combining conventional modeling withsuch auxiliary data sets at village scale to estimate annual groundwater storage changein each village of a watershed of about 80 km2.
Further it is demonstrated that through the spatial and temporal modes of empir-ical orthogonal function analysis of the rainfall and groundwater levels, it is feasibleto identify the regions affected by groundwater pumping or anthropogenic activi-ties. Identifying such regions from a large regional data set is helpful for targetingmanagement plans.
Finally there is a need for long-term observatories studying the integrated watercycle and the impacts on water resources through the survey of land use and coverchanges over the years, and at the different spatial scales covering the local to basin-wide dynamics. Such observatories will also survey the evolution of the technologyused and agricultural practices and strategies, along with approaches to improve theestimate of the impact of the different crop types on the water cycle.
ACKNOWLEDGEMENTS
The funding received from the sponsored research project of AICTE-NCP and theIndo-French network project of P2R are acknowledged. We are also grateful to theIndo-French Cell for Water Sciences for providing support. The data made availableby the Department of Mines and Geology and Karnataka State Natural Disaster Mon-itoring Center are duly acknowledged. We are extremely thankful to Dr. A. Findikakisand Prof. N. Copty for their reviews and suggestions at various stages during thepreparation of this article.
Findikakis CH005.tex 7/3/2011 13: 35 Page 23
Lessons from a case study in the Karnataka State of South India 23
REFERENCES
Anand, P. B. (2004) Water and identity: an analysis of the Cauvery river water dispute, BradfordCenter for Intern. Dev., University of Bradford, UK, BCID Research Paper n◦3. Avail-able HTTP: <http://www.bradford.ac.uk/acad/des/research/papers/Paper3.pdf> (accessed on21/1/2011).
Anderies, J. M., Rodriguez, A. A., Janssen, M. A. and Cifdaloz, O. (2007) ‘Panaceas, uncertaintyand the robust control framework in sustainability science’, PNAS 104(39): 15194–15199.
APFAMGS (2006) Demand side management of groundwater. Andhra Pradesh farmer man-aged groundwater systems (APFAMGS) project. Report prepared by BIRDS. Available HTTP:<http://9848.org/birdsorg.net/apfamgs.html> (accessed on 21/1/2011).
Arghyam (2008) ‘Technology challenges for Domestic Water Security in Rural India. Focaltheme: Knowledge Based Society Using Environmentally Sustainable Science and Technology’,in: 95th Indian Science Congress, Andhra University, Visakhapatnam, January 3–7, 2008,(www.Arghyam.org).
Barreteau O., Bousquet F. and Attonaty L.-M. (2001) ‘Role-playing games for opening theblack box of multi-agent systems: method and lessons of its application to Senegal RiverValley irrigated systems’, Journal of Artificial Societies and Social Simulation vol. 4, no. 2.Available HTTP <http://jasss.soc.surrey.ac.uk/4/2/5.html> (accessed on 21/1/2011).
Becu, N., Neef, A., Schreinemachers, P. and Sangkapitux, C. (2008) ‘Participatory Modelingto Support Collective Decision-Making: Potential and Limits of Stakeholder Involvement’,Journal of Land Use Policy. Voume no: doi:10.1016/j.landusepol.2007.11.002/25, pp. 498–509.
Boulet R., Mazzega P. and Jouve, B. (2009) ‘Environmental, social and normative networksin the MAELIA Platform’, in: Poblet, M. Schild, U. and Zeleznikow, J. (eds.) CEURWorkshop Proc. Legal & Decision Support Systems ’09, Barcelona – Spain, pp. 83–93,CEUR. Available HTTP: <http://sunsite.informatik.rwth-aachen.de/Publications/CEUR-WS/Vol-482/> (accessed on 21/1/2011).
DES (2001) Census 2001 from Department of Economics and Statistics, Government of India.Giordano, M. F. and Villholth, K.G. (2007) ‘The Agricultural Groundwater Revolution: Set-
ting the Stage’, in: Giordano, M. and Villholth, K.G. (eds.) The agricultural groundwaterrevolution: Opportunities and threats to development, 1–4. CAB International.
GoI (Government of India) (1995) Groundwater Resources of India, Faridabad, India: CentralGround Water Board, Ministry of Water Resources, Government of India,. Available HTTP:<http://cgwb.gov.in/> (accessed on 21/1/2011).
GoK (Government of Karnataka) (2002) State water policy, Water Resources Dept. AvailableHTTP: <http://www.indiawaterportal.org/node/1037> (accessed on 21/1/2011).
Gunnell, Y. and Bourgeon, G. (1997) ‘Soils and climatic geomorphology on the Karnatakaplateau, peninsular India’, CATENA 29: 239–262.
Indian Easements Act, 1882. See e.g. <http://www.helplinelaw.com/docs/> (accessed on21/1/2011).
Jarlan, L., Tourre, Y.M., Mougin, E., Philippon, N. and Mazzega, P. (2005) ‘Dominant patternsof AVHR NDVI interannual variability over the Sahel and linkages with key climate signals(1982–2003)’, Geophysical. Research. Letters, V. 32, L04701, doi:10.1029/2004GL021841,
Javeed, Y. (2010) Analysis of groundwater dynamics in semi-arid regions: effect of rainfallvariability and pumping. PhD thesis (Unpublished), Indian Institute of Science, Bangalore.
Jawson, D. S. and Niemann, J. D. (2007) ‘Spatial patterns from EOF analysis of soil moisture ata large scale and their dependence on soil, land-use, and topographic properties’, Advancesin Water Resources 30: 366–381.
Krishnan, S., Islam, A., Machiwal, D., Sena, D.R., and Villholth, K. (2008) ‘LivingWisdom: using local well driller knowledge to construct digital databases in Indo-Gangetic
Findikakis CH005.tex 7/3/2011 13: 35 Page 24
24 Groundwater management practices
basin’, Groundwater Governance in Asia Research Studies. Available HTTP: <http://www.care water.org/well_driller_study.pdf> (accessed on 21/1/2011).
Milne, G. (2007) India: Karnataka Watershed Development “Sujala’’ Project, World Bank NoteNo. 3, Livelihood Learning Series 1.
Ministry of Water Resources – Government of India (2002) National Water Policy, New Delhi,April 2002. Available HTTP: <http://mowr.gov.in/writereaddata/linkimages/nwp20025617515534.pdf> (accessed on 21/1/2011).
Ministry of Water Resources – Government of India (2005) Model Bill to regulate and con-trol the development and management of ground water, January 2005. Available HTTP:<http://www.indiawaterportal.org/node/794> (accessed on 21/1/2011).
Narasimhan, T. N. (2008) ‘Ground water management and ownership’, Economic and PoliticalWeekly, February 16, 21–27.
Oström, E., Janssen M. A. and Anderies, J. M. (2007) ‘Going beyond panaceas’, PNAS 104(39):15176–15178.
Oström, E. (2007) ‘A diagnostic approach for going beyond panaceas’, PNAS 104(39): 15181–15187.
Panda, D.K., Mishra, A., Jena, S.K., James, B.K. and Kumar, A. (2007) ‘The influence of droughtand anthropogenic effects on groundwater levels in Orissa, India’, Journal of Hydrology 343:140–153.
Park, E., and Parker, J. (2008) ‘A simple model for water table fluctuations in response toprecipitation’, Journal of Hydrology, 356: 344–349.
Parthasarathy, B., Munot, A.A. and Kothawale, D.R. (1994) ‘Droughts over homo-geneous regions of India: 1871–1990’, Drought Network News. Available HTTP:<http://www.drought.unl.edu/pubs/dnn/arch22.pdf> (accessed on 21/1/2011).
Pascal, J.P. (1986) Explanatory booklet on the forest map of South India. Travaux SectionScientifique et Technique Institut Français de Pondichéry, Hors Série, Vol. 18.
Planning Commission – Government of India (2007) Report of the Expert Groupon Ground Water Management and Ownership, New Delhi. Available HTTP:<http://planningcommission.nic.in/reports/genrep/rep_grndwat.pdf> (accessed 21/1/2011).
Sat Kumar, Javeed, Y. and Sekhar, M. (2010) ‘An alternative approach for estimation of ground-water recharge and discharge in hard rock aquifer’, Article No. 26 in: Kaushik, Y.B, Keshri,A.K., Nandkumaran, P.,Chatterjee, R., Saxena, P. and Purohit, R.R (eds.) Proceedings of theworkshop on “The groundwater resources estimation’’ Feb. 23–24, New Delhi. New Delhi(India): Central Ground Water Board, pp. 234–245.
Scanlon, B.R., Jolly, I., Sophocleous, M. and Zhang, L. (2007) ‘Global impacts of conversionfrom natural to agricultural ecosystem on water resources: quantity versus quality’, WaterResour. Res. V. 43, W03437, doi:10.1029/2006WR005486.
Sekhar, M., Rasmi, S.N., Sivapullaiah, P.V. and Ruiz, L. (2004) ‘Groundwater Flow Modelingof the Gundal Sub-basin in Kabini River Basin, India’, Asian Journal of Water, Environmentand Pollution, 1(1 & 2): 65–77.
Shah, T., Roy, A.D., Qureshi, A.S. and Wang, J. (2003) ‘Sustaining Asia’s groundwater boom:an overview of issues and evidence’, Natural Resources Forum 27: 130–140.
Shah, T. (2007) ‘The groundwater economy of South Asia: An assessment of size, significanceand socio-ecological impacts’, in: Giordano, M. and Villholth, K.G. (eds.) The agriculturalgroundwater revolution: Opportunities and threats to development, 7–36. CAB International.
Sharma, K.D. and Kumar, S. (2008) ‘Hydrogeological research in India in managing waterresources’, in: Ahmed, S., Jaykumar, R. and Salih, A. (eds.) Groundwater dynamics in hardrock aquifers), pp. 1–19. Springer, ISBN: 978-1-4020-6539-2.
Shaw, J. and Sutcliffe, J.V. (2003) ‘Ancient dams, settlement archeology and Buddhist propa-gation in central India: the hydrological background’, Hydrological Sciences Journal, 48(2):277–291.

Findikakis CH005.tex 7/3/2011 13: 35 Page 25
Lessons from a case study in the Karnataka State of South India 25
Tambe, J.A. (2007) ‘Groundwater ownership and legal aspects’, in: Romani, S., Sharma, K.D.,Gosh N.C., and Kaushik, Y.B. (eds.) Groundwater Governance – Ownership of Groundwaterand its Pricing, 379–391. New Delhi (India): Capital Publ. Company.
Tiwri, R. K. and Rao, K.N.N. (2004) ‘Signature of ENSO signals in the coral growth rate recordof Arabian Sea and Indian Monsoons’, Pure Appl. Geophys. 161: 413–427.
World Bank (2005) India’s Water Economy, World Bank. Available HTTP: <http://go.worldbank.org/QPUTPV5530> (accessed on 21/1/2011).
Xu, Y. and van Tonder, G. J. (2001) ‘Estimation of recharge using a revised CRD method’, WaterSA 27(3): 341–344.
Xu, Y. and Beekman H.E. (editors) (2003) Groundwater recharge estimation in South Africa.UNESCO IHP Series No. 64.

Findikakis CH005.tex 7/3/2011 13: 35 Page 26