Embed Size (px)
Citation preview
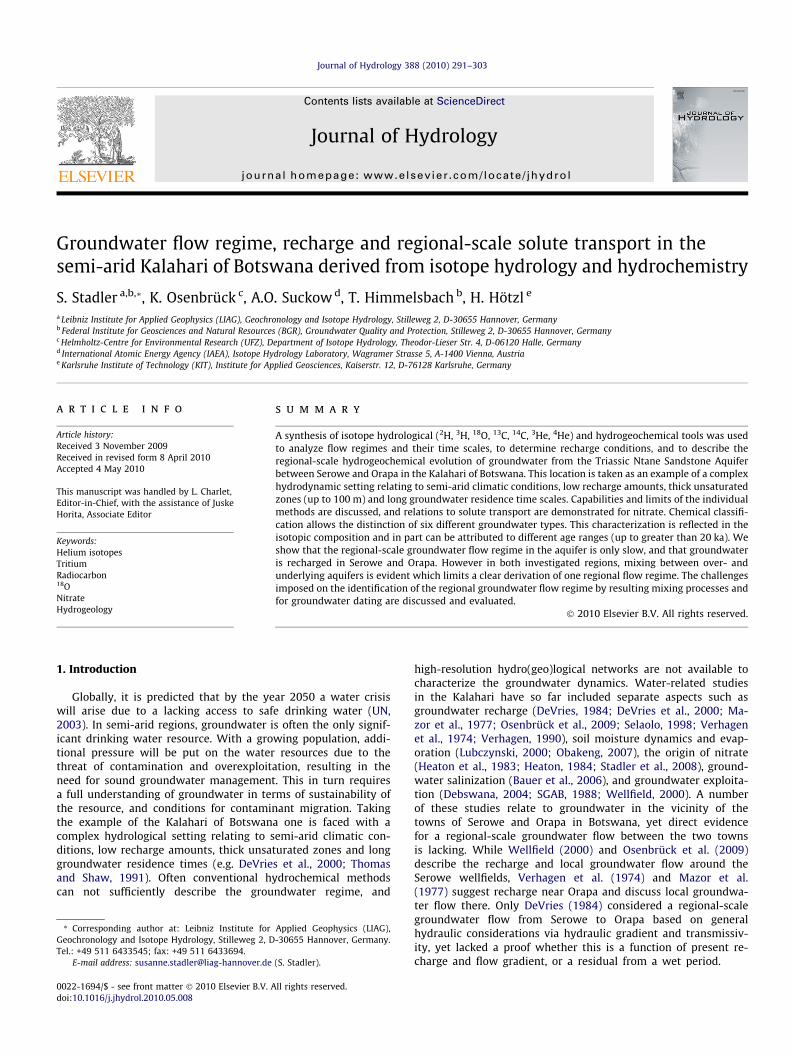
Journal of Hydrology 388 (2010) 291–303
Contents lists available at ScienceDirect
Journal of Hydrology
journal homepage: www.elsevier .com/ locate / jhydrol
Groundwater flow regime, recharge and regional-scale solute transport in thesemi-arid Kalahari of Botswana derived from isotope hydrology and hydrochemistry
S. Stadler a,b,*, K. Osenbrück c, A.O. Suckow d, T. Himmelsbach b, H. Hötzl e
a Leibniz Institute for Applied Geophysics (LIAG), Geochronology and Isotope Hydrology, Stilleweg 2, D-30655 Hannover, Germanyb Federal Institute for Geosciences and Natural Resources (BGR), Groundwater Quality and Protection, Stilleweg 2, D-30655 Hannover, Germanyc Helmholtz-Centre for Environmental Research (UFZ), Department of Isotope Hydrology, Theodor-Lieser Str. 4, D-06120 Halle, Germanyd International Atomic Energy Agency (IAEA), Isotope Hydrology Laboratory, Wagramer Strasse 5, A-1400 Vienna, Austriae Karlsruhe Institute of Technology (KIT), Institute for Applied Geosciences, Kaiserstr. 12, D-76128 Karlsruhe, Germany
a r t i c l e i n f o s u m m a r y
Article history:Received 3 November 2009Received in revised form 8 April 2010Accepted 4 May 2010
This manuscript was handled by L. Charlet,Editor-in-Chief, with the assistance of JuskeHorita, Associate Editor
Keywords:Helium isotopesTritiumRadiocarbon18ONitrateHydrogeology
0022-1694/$ - see front matter � 2010 Elsevier B.V. Adoi:10.1016/j.jhydrol.2010.05.008
* Corresponding author at: Leibniz Institute forGeochronology and Isotope Hydrology, Stilleweg 2, DTel.: +49 511 6433545; fax: +49 511 6433694.
E-mail address: [email protected]
A synthesis of isotope hydrological (2H, 3H, 18O, 13C, 14C, 3He, 4He) and hydrogeochemical tools was usedto analyze flow regimes and their time scales, to determine recharge conditions, and to describe theregional-scale hydrogeochemical evolution of groundwater from the Triassic Ntane Sandstone Aquiferbetween Serowe and Orapa in the Kalahari of Botswana. This location is taken as an example of a complexhydrodynamic setting relating to semi-arid climatic conditions, low recharge amounts, thick unsaturatedzones (up to 100 m) and long groundwater residence time scales. Capabilities and limits of the individualmethods are discussed, and relations to solute transport are demonstrated for nitrate. Chemical classifi-cation allows the distinction of six different groundwater types. This characterization is reflected in theisotopic composition and in part can be attributed to different age ranges (up to greater than 20 ka). Weshow that the regional-scale groundwater flow regime in the aquifer is only slow, and that groundwateris recharged in Serowe and Orapa. However in both investigated regions, mixing between over- andunderlying aquifers is evident which limits a clear derivation of one regional flow regime. The challengesimposed on the identification of the regional groundwater flow regime by resulting mixing processes andfor groundwater dating are discussed and evaluated.
� 2010 Elsevier B.V. All rights reserved.
1. Introduction
Globally, it is predicted that by the year 2050 a water crisiswill arise due to a lacking access to safe drinking water (UN,2003). In semi-arid regions, groundwater is often the only signif-icant drinking water resource. With a growing population, addi-tional pressure will be put on the water resources due to thethreat of contamination and overexploitation, resulting in theneed for sound groundwater management. This in turn requiresa full understanding of groundwater in terms of sustainability ofthe resource, and conditions for contaminant migration. Takingthe example of the Kalahari of Botswana one is faced with acomplex hydrological setting relating to semi-arid climatic con-ditions, low recharge amounts, thick unsaturated zones and longgroundwater residence times (e.g. DeVries et al., 2000; Thomasand Shaw, 1991). Often conventional hydrochemical methodscan not sufficiently describe the groundwater regime, and
ll rights reserved.
Applied Geophysics (LIAG),-30655 Hannover, Germany.
(S. Stadler).
high-resolution hydro(geo)logical networks are not available tocharacterize the groundwater dynamics. Water-related studiesin the Kalahari have so far included separate aspects such asgroundwater recharge (DeVries, 1984; DeVries et al., 2000; Ma-zor et al., 1977; Osenbrück et al., 2009; Selaolo, 1998; Verhagenet al., 1974; Verhagen, 1990), soil moisture dynamics and evap-oration (Lubczynski, 2000; Obakeng, 2007), the origin of nitrate(Heaton et al., 1983; Heaton, 1984; Stadler et al., 2008), ground-water salinization (Bauer et al., 2006), and groundwater exploita-tion (Debswana, 2004; SGAB, 1988; Wellfield, 2000). A numberof these studies relate to groundwater in the vicinity of thetowns of Serowe and Orapa in Botswana, yet direct evidencefor a regional-scale groundwater flow between the two townsis lacking. While Wellfield (2000) and Osenbrück et al. (2009)describe the recharge and local groundwater flow around theSerowe wellfields, Verhagen et al. (1974) and Mazor et al.(1977) suggest recharge near Orapa and discuss local groundwa-ter flow there. Only DeVries (1984) considered a regional-scalegroundwater flow from Serowe to Orapa based on generalhydraulic considerations via hydraulic gradient and transmissiv-ity, yet lacked a proof whether this is a function of present re-charge and flow gradient, or a residual from a wet period.
292 S. Stadler et al. / Journal of Hydrology 388 (2010) 291–303
The aim of our presented paper is to characterize the regional-scale groundwater flow regime and conditions for solute transportin the Kalahari, highlighting the characterization of infiltrationbehaviour and groundwater movement between Serowe and Ora-pa in Botswana using a broad spectrum of environmental tracerscombined with hydrochemical investigations. We hereby focuson helium isotopes (3He, 4He), radiocarbon (14C), tritium (3H) andstable isotopes of water (18O, 2H). We relate this to the migrationof nitrate in the groundwater. This includes the determination ofthe origin and time scales of recharge, groundwater ages, and theregional-scale hydrochemical evolution along the flow path.
2. Study area
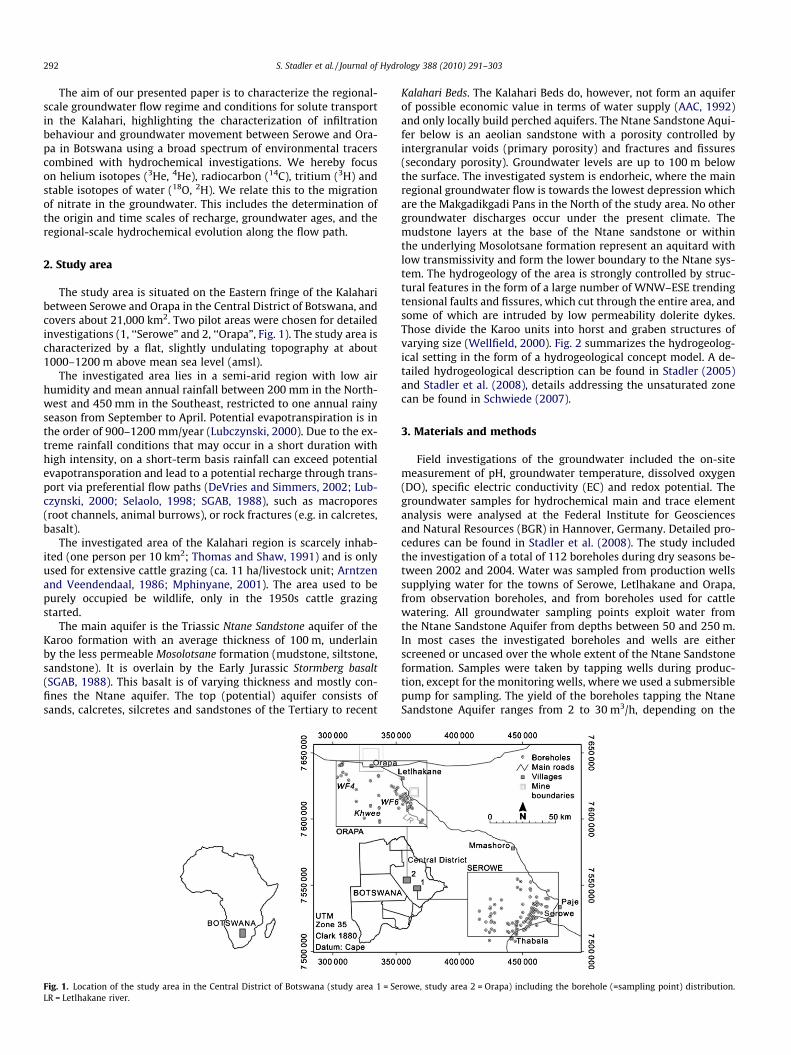
The study area is situated on the Eastern fringe of the Kalaharibetween Serowe and Orapa in the Central District of Botswana, andcovers about 21,000 km2. Two pilot areas were chosen for detailedinvestigations (1, ‘‘Serowe” and 2, ‘‘Orapa”, Fig. 1). The study area ischaracterized by a flat, slightly undulating topography at about1000–1200 m above mean sea level (amsl).
The investigated area lies in a semi-arid region with low airhumidity and mean annual rainfall between 200 mm in the North-west and 450 mm in the Southeast, restricted to one annual rainyseason from September to April. Potential evapotranspiration is inthe order of 900–1200 mm/year (Lubczynski, 2000). Due to the ex-treme rainfall conditions that may occur in a short duration withhigh intensity, on a short-term basis rainfall can exceed potentialevapotransporation and lead to a potential recharge through trans-port via preferential flow paths (DeVries and Simmers, 2002; Lub-czynski, 2000; Selaolo, 1998; SGAB, 1988), such as macropores(root channels, animal burrows), or rock fractures (e.g. in calcretes,basalt).
The investigated area of the Kalahari region is scarcely inhab-ited (one person per 10 km2; Thomas and Shaw, 1991) and is onlyused for extensive cattle grazing (ca. 11 ha/livestock unit; Arntzenand Veendendaal, 1986; Mphinyane, 2001). The area used to bepurely occupied be wildlife, only in the 1950s cattle grazingstarted.
The main aquifer is the Triassic Ntane Sandstone aquifer of theKaroo formation with an average thickness of 100 m, underlainby the less permeable Mosolotsane formation (mudstone, siltstone,sandstone). It is overlain by the Early Jurassic Stormberg basalt(SGAB, 1988). This basalt is of varying thickness and mostly con-fines the Ntane aquifer. The top (potential) aquifer consists ofsands, calcretes, silcretes and sandstones of the Tertiary to recent
Fig. 1. Location of the study area in the Central District of Botswana (study area 1 = SeLR = Letlhakane river.
Kalahari Beds. The Kalahari Beds do, however, not form an aquiferof possible economic value in terms of water supply (AAC, 1992)and only locally build perched aquifers. The Ntane Sandstone Aqui-fer below is an aeolian sandstone with a porosity controlled byintergranular voids (primary porosity) and fractures and fissures(secondary porosity). Groundwater levels are up to 100 m belowthe surface. The investigated system is endorheic, where the mainregional groundwater flow is towards the lowest depression whichare the Makgadikgadi Pans in the North of the study area. No othergroundwater discharges occur under the present climate. Themudstone layers at the base of the Ntane sandstone or withinthe underlying Mosolotsane formation represent an aquitard withlow transmissivity and form the lower boundary to the Ntane sys-tem. The hydrogeology of the area is strongly controlled by struc-tural features in the form of a large number of WNW–ESE trendingtensional faults and fissures, which cut through the entire area, andsome of which are intruded by low permeability dolerite dykes.Those divide the Karoo units into horst and graben structures ofvarying size (Wellfield, 2000). Fig. 2 summarizes the hydrogeolog-ical setting in the form of a hydrogeological concept model. A de-tailed hydrogeological description can be found in Stadler (2005)and Stadler et al. (2008), details addressing the unsaturated zonecan be found in Schwiede (2007).
3. Materials and methods
Field investigations of the groundwater included the on-sitemeasurement of pH, groundwater temperature, dissolved oxygen(DO), specific electric conductivity (EC) and redox potential. Thegroundwater samples for hydrochemical main and trace elementanalysis were analysed at the Federal Institute for Geosciencesand Natural Resources (BGR) in Hannover, Germany. Detailed pro-cedures can be found in Stadler et al. (2008). The study includedthe investigation of a total of 112 boreholes during dry seasons be-tween 2002 and 2004. Water was sampled from production wellssupplying water for the towns of Serowe, Letlhakane and Orapa,from observation boreholes, and from boreholes used for cattlewatering. All groundwater sampling points exploit water fromthe Ntane Sandstone Aquifer from depths between 50 and 250 m.In most cases the investigated boreholes and wells are eitherscreened or uncased over the whole extent of the Ntane Sandstoneformation. Samples were taken by tapping wells during produc-tion, except for the monitoring wells, where we used a submersiblepump for sampling. The yield of the boreholes tapping the NtaneSandstone Aquifer ranges from 2 to 30 m3/h, depending on the
rowe, study area 2 = Orapa) including the borehole (=sampling point) distribution.
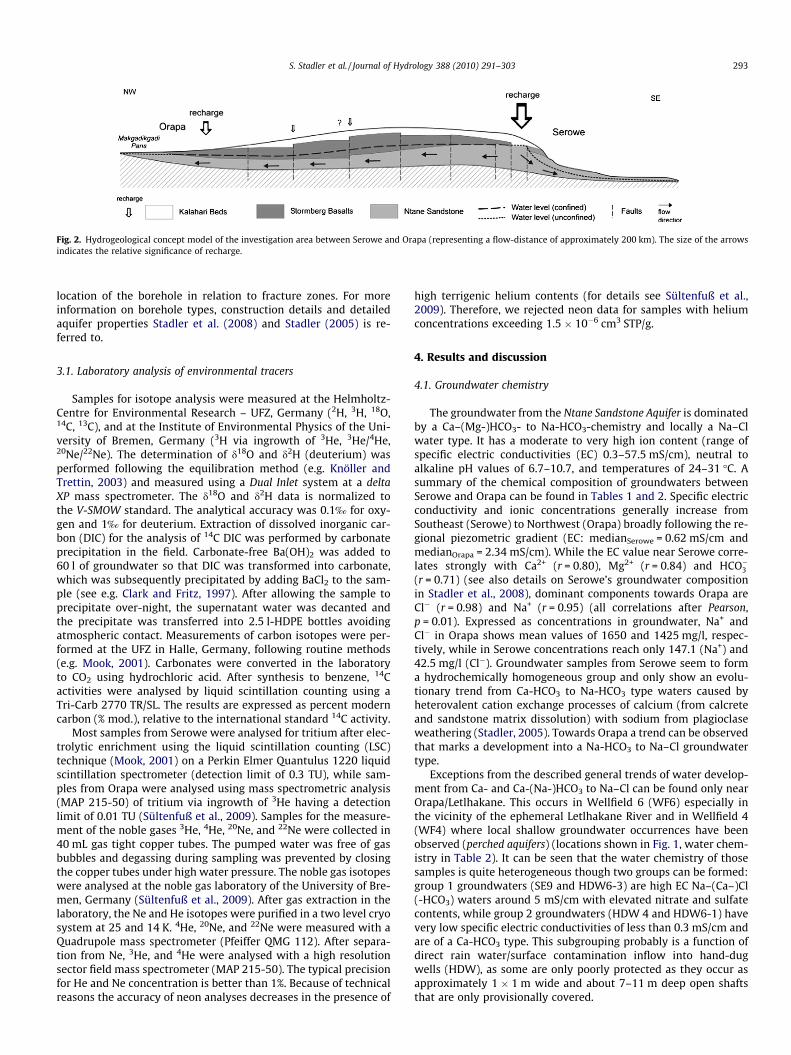
Fig. 2. Hydrogeological concept model of the investigation area between Serowe and Orapa (representing a flow-distance of approximately 200 km). The size of the arrowsindicates the relative significance of recharge.
S. Stadler et al. / Journal of Hydrology 388 (2010) 291–303 293
location of the borehole in relation to fracture zones. For moreinformation on borehole types, construction details and detailedaquifer properties Stadler et al. (2008) and Stadler (2005) is re-ferred to.
3.1. Laboratory analysis of environmental tracers
Samples for isotope analysis were measured at the Helmholtz-Centre for Environmental Research – UFZ, Germany (2H, 3H, 18O,14C, 13C), and at the Institute of Environmental Physics of the Uni-versity of Bremen, Germany (3H via ingrowth of 3He, 3He/4He,20Ne/22Ne). The determination of d18O and d2H (deuterium) wasperformed following the equilibration method (e.g. Knöller andTrettin, 2003) and measured using a Dual Inlet system at a deltaXP mass spectrometer. The d18O and d2H data is normalized tothe V-SMOW standard. The analytical accuracy was 0.1‰ for oxy-gen and 1‰ for deuterium. Extraction of dissolved inorganic car-bon (DIC) for the analysis of 14C DIC was performed by carbonateprecipitation in the field. Carbonate-free Ba(OH)2 was added to60 l of groundwater so that DIC was transformed into carbonate,which was subsequently precipitated by adding BaCl2 to the sam-ple (see e.g. Clark and Fritz, 1997). After allowing the sample toprecipitate over-night, the supernatant water was decanted andthe precipitate was transferred into 2.5 l-HDPE bottles avoidingatmospheric contact. Measurements of carbon isotopes were per-formed at the UFZ in Halle, Germany, following routine methods(e.g. Mook, 2001). Carbonates were converted in the laboratoryto CO2 using hydrochloric acid. After synthesis to benzene, 14Cactivities were analysed by liquid scintillation counting using aTri-Carb 2770 TR/SL. The results are expressed as percent moderncarbon (% mod.), relative to the international standard 14C activity.
Most samples from Serowe were analysed for tritium after elec-trolytic enrichment using the liquid scintillation counting (LSC)technique (Mook, 2001) on a Perkin Elmer Quantulus 1220 liquidscintillation spectrometer (detection limit of 0.3 TU), while sam-ples from Orapa were analysed using mass spectrometric analysis(MAP 215-50) of tritium via ingrowth of 3He having a detectionlimit of 0.01 TU (Sültenfuß et al., 2009). Samples for the measure-ment of the noble gases 3He, 4He, 20Ne, and 22Ne were collected in40 mL gas tight copper tubes. The pumped water was free of gasbubbles and degassing during sampling was prevented by closingthe copper tubes under high water pressure. The noble gas isotopeswere analysed at the noble gas laboratory of the University of Bre-men, Germany (Sültenfuß et al., 2009). After gas extraction in thelaboratory, the Ne and He isotopes were purified in a two level cryosystem at 25 and 14 K. 4He, 20Ne, and 22Ne were measured with aQuadrupole mass spectrometer (Pfeiffer QMG 112). After separa-tion from Ne, 3He, and 4He were analysed with a high resolutionsector field mass spectrometer (MAP 215-50). The typical precisionfor He and Ne concentration is better than 1%. Because of technicalreasons the accuracy of neon analyses decreases in the presence of
high terrigenic helium contents (for details see Sültenfuß et al.,2009). Therefore, we rejected neon data for samples with heliumconcentrations exceeding 1.5 � 10�6 cm3 STP/g.
4. Results and discussion
4.1. Groundwater chemistry
The groundwater from the Ntane Sandstone Aquifer is dominatedby a Ca–(Mg-)HCO3- to Na-HCO3-chemistry and locally a Na–Clwater type. It has a moderate to very high ion content (range ofspecific electric conductivities (EC) 0.3–57.5 mS/cm), neutral toalkaline pH values of 6.7–10.7, and temperatures of 24–31 �C. Asummary of the chemical composition of groundwaters betweenSerowe and Orapa can be found in Tables 1 and 2. Specific electricconductivity and ionic concentrations generally increase fromSoutheast (Serowe) to Northwest (Orapa) broadly following the re-gional piezometric gradient (EC: medianSerowe = 0.62 mS/cm andmedianOrapa = 2.34 mS/cm). While the EC value near Serowe corre-lates strongly with Ca2+ (r = 0.80), Mg2+ (r = 0.84) and HCO�3(r = 0.71) (see also details on Serowe’s groundwater compositionin Stadler et al., 2008), dominant components towards Orapa areCl� (r = 0.98) and Na+ (r = 0.95) (all correlations after Pearson,p = 0.01). Expressed as concentrations in groundwater, Na+ andCl� in Orapa shows mean values of 1650 and 1425 mg/l, respec-tively, while in Serowe concentrations reach only 147.1 (Na+) and42.5 mg/l (Cl�). Groundwater samples from Serowe seem to forma hydrochemically homogeneous group and only show an evolu-tionary trend from Ca-HCO3 to Na-HCO3 type waters caused byheterovalent cation exchange processes of calcium (from calcreteand sandstone matrix dissolution) with sodium from plagioclaseweathering (Stadler, 2005). Towards Orapa a trend can be observedthat marks a development into a Na-HCO3 to Na–Cl groundwatertype.
Exceptions from the described general trends of water develop-ment from Ca- and Ca-(Na-)HCO3 to Na–Cl can be found only nearOrapa/Letlhakane. This occurs in Wellfield 6 (WF6) especially inthe vicinity of the ephemeral Letlhakane River and in Wellfield 4(WF4) where local shallow groundwater occurrences have beenobserved (perched aquifers) (locations shown in Fig. 1, water chem-istry in Table 2). It can be seen that the water chemistry of thosesamples is quite heterogeneous though two groups can be formed:group 1 groundwaters (SE9 and HDW6-3) are high EC Na–(Ca–)Cl(-HCO3) waters around 5 mS/cm with elevated nitrate and sulfatecontents, while group 2 groundwaters (HDW 4 and HDW6-1) havevery low specific electric conductivities of less than 0.3 mS/cm andare of a Ca-HCO3 type. This subgrouping probably is a function ofdirect rain water/surface contamination inflow into hand-dugwells (HDW), as some are only poorly protected as they occur asapproximately 1 � 1 m wide and about 7–11 m deep open shaftsthat are only provisionally covered.
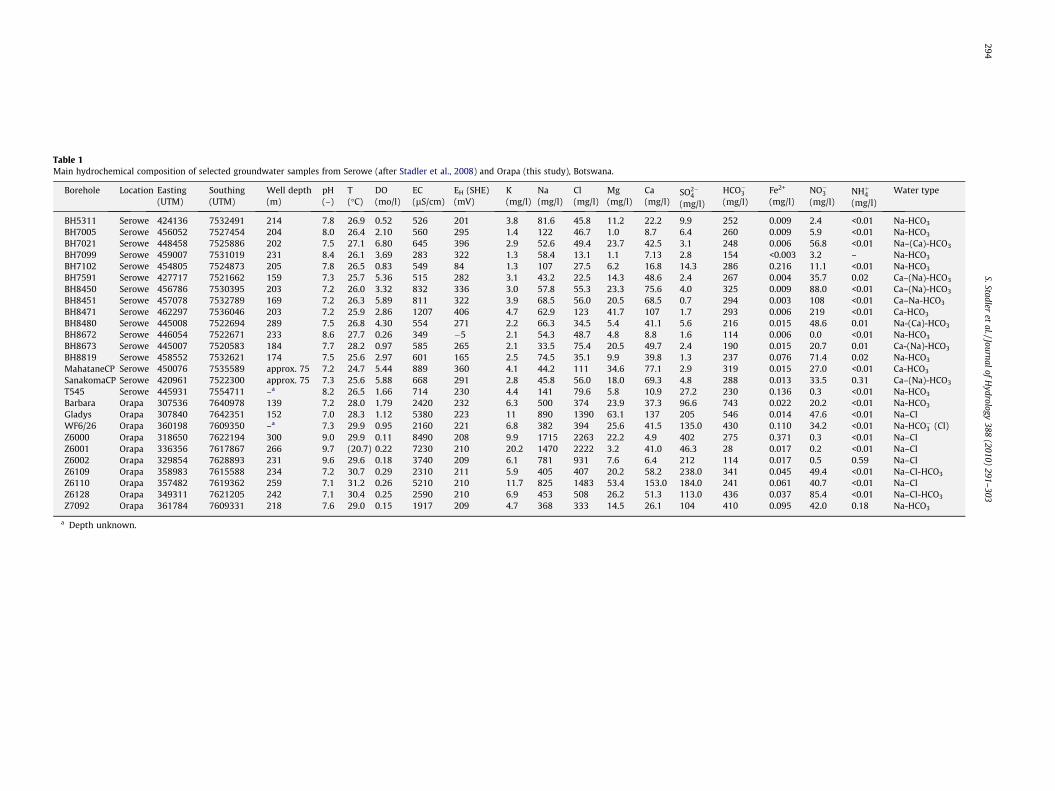
Table 1Main hydrochemical composition of selected groundwater samples from Serowe (after Stadler et al., 2008) and Orapa (this study), Botswana.
Borehole Location Easting(UTM)
Southing(UTM)
Well depth(m)
pH(–)
T(�C)
DO(mo/l)
EC(lS/cm)
EH (SHE)(mV)
K(mg/l)
Na(mg/l)
Cl(mg/l)
Mg(mg/l)
Ca(mg/l)
SO2�4
(mg/l)
HCO�3(mg/l)
Fe2+
(mg/l)NO�3(mg/l)
NHþ4(mg/l)
Water type
BH5311 Serowe 424136 7532491 214 7.8 26.9 0.52 526 201 3.8 81.6 45.8 11.2 22.2 9.9 252 0.009 2.4 <0.01 Na-HCO3
BH7005 Serowe 456052 7527454 204 8.0 26.4 2.10 560 295 1.4 122 46.7 1.0 8.7 6.4 260 0.009 5.9 <0.01 Na-HCO3
BH7021 Serowe 448458 7525886 202 7.5 27.1 6.80 645 396 2.9 52.6 49.4 23.7 42.5 3.1 248 0.006 56.8 <0.01 Na–(Ca)-HCO3
BH7099 Serowe 459007 7531019 231 8.4 26.1 3.69 283 322 1.3 58.4 13.1 1.1 7.13 2.8 154 <0.003 3.2 – Na-HCO3
BH7102 Serowe 454805 7524873 205 7.8 26.5 0.83 549 84 1.3 107 27.5 6.2 16.8 14.3 286 0.216 11.1 <0.01 Na-HCO3
BH7591 Serowe 427717 7521662 159 7.3 25.7 5.36 515 282 3.1 43.2 22.5 14.3 48.6 2.4 267 0.004 35.7 0.02 Ca–(Na)-HCO3
BH8450 Serowe 456786 7530395 203 7.2 26.0 3.32 832 336 3.0 57.8 55.3 23.3 75.6 4.0 325 0.009 88.0 <0.01 Ca–(Na)-HCO3
BH8451 Serowe 457078 7532789 169 7.2 26.3 5.89 811 322 3.9 68.5 56.0 20.5 68.5 0.7 294 0.003 108 <0.01 Ca–Na-HCO3
BH8471 Serowe 462297 7536046 203 7.2 25.9 2.86 1207 406 4.7 62.9 123 41.7 107 1.7 293 0.006 219 <0.01 Ca-HCO3
BH8480 Serowe 445008 7522694 289 7.5 26.8 4.30 554 271 2.2 66.3 34.5 5.4 41.1 5.6 216 0.015 48.6 0.01 Na-(Ca)-HCO3
BH8672 Serowe 446054 7522671 233 8.6 27.7 0.26 349 �5 2.1 54.3 48.7 4.8 8.8 1.6 114 0.006 0.0 <0.01 Na-HCO3
BH8673 Serowe 445007 7520583 184 7.7 28.2 0.97 585 265 2.1 33.5 75.4 20.5 49.7 2.4 190 0.015 20.7 0.01 Ca-(Na)-HCO3
BH8819 Serowe 458552 7532621 174 7.5 25.6 2.97 601 165 2.5 74.5 35.1 9.9 39.8 1.3 237 0.076 71.4 0.02 Na-HCO3
MahataneCP Serowe 450076 7535589 approx. 75 7.2 24.7 5.44 889 360 4.1 44.2 111 34.6 77.1 2.9 319 0.015 27.0 <0.01 Ca-HCO3
SanakomaCP Serowe 420961 7522300 approx. 75 7.3 25.6 5.88 668 291 2.8 45.8 56.0 18.0 69.3 4.8 288 0.013 33.5 0.31 Ca–(Na)-HCO3
T545 Serowe 445931 7554711 –a 8.2 26.5 1.66 714 230 4.4 141 79.6 5.8 10.9 27.2 230 0.136 0.3 <0.01 Na-HCO3
Barbara Orapa 307536 7640978 139 7.2 28.0 1.79 2420 232 6.3 500 374 23.9 37.3 96.6 743 0.022 20.2 <0.01 Na-HCO3
Gladys Orapa 307840 7642351 152 7.0 28.3 1.12 5380 223 11 890 1390 63.1 137 205 546 0.014 47.6 <0.01 Na–ClWF6/26 Orapa 360198 7609350 –a 7.3 29.9 0.95 2160 221 6.8 382 394 25.6 41.5 135.0 430 0.110 34.2 <0.01 Na-HCO�3 (Cl)Z6000 Orapa 318650 7622194 300 9.0 29.9 0.11 8490 208 9.9 1715 2263 22.2 4.9 402 275 0.371 0.3 <0.01 Na–ClZ6001 Orapa 336356 7617867 266 9.7 (20.7) 0.22 7230 210 20.2 1470 2222 3.2 41.0 46.3 28 0.017 0.2 <0.01 Na–ClZ6002 Orapa 329854 7628893 231 9.6 29.6 0.18 3740 209 6.1 781 931 7.6 6.4 212 114 0.017 0.5 0.59 Na–ClZ6109 Orapa 358983 7615588 234 7.2 30.7 0.29 2310 211 5.9 405 407 20.2 58.2 238.0 341 0.045 49.4 <0.01 Na–Cl-HCO3
Z6110 Orapa 357482 7619362 259 7.1 31.2 0.26 5210 210 11.7 825 1483 53.4 153.0 184.0 241 0.061 40.7 <0.01 Na–ClZ6128 Orapa 349311 7621205 242 7.1 30.4 0.25 2590 210 6.9 453 508 26.2 51.3 113.0 436 0.037 85.4 <0.01 Na–Cl-HCO3
Z7092 Orapa 361784 7609331 218 7.6 29.0 0.15 1917 209 4.7 368 333 14.5 26.1 104 410 0.095 42.0 0.18 Na-HCO3
a Depth unknown.
294S.Stadler
etal./Journal
ofH
ydrology388
(2010)291–
303
Tabl
e2
Hyd
roch
emic
alco
mpo
siti
onof
sele
cted
grou
ndw
ater
sam
ples
that
devi
ate
from
the
gene
ral
hydr
oche
mic
altr
end
inO
rapa
(per
ched
aqui
fers
and
Khw
eebl
ock)
.
Bor
ehol
eLo
cati
onpH (–
)T (�
C)
DO
(mg/
l)EC ( l
S/cm
)E H
(SH
E)(m
V)
K (mg/
l)N
a(m
g/l)
Cl
(mg/
l)M
g(m
g/l)
Ca
(mg/
l)SO
2� 4
(mg/
l)
HC
O� 3
(mg/
l)Fe
2+
(mg/
l)N
O� 3
(mg/
l)N
Hþ 4
(mg/
l)W
ater
type
HD
W6-
3Pe
rch
eda
7.4
27.1
4.23
4740
397
5.8
584
1227
119
238
108
590
0.00
384
.0<0
.01
Na–
Cl-
(HC
O3)
SE9
Perc
hed
a6.
724
.31.
6355
4022
84.
156
214
9318
134
411
243
10.
353
244
0.72
Na–
Cl-
(HC
O3)
HD
W4
Perc
hed
b7.
522
.92.
3415
640
23.
63.
94.
63
19.5
3.4
79.4
0.02
50.
1<0
.02
Ca-
HC
O3
HD
W6-
1Pe
rch
edb
7.2
23.4
0.44
282
397
9.4
147
6.5
31.8
316
10.
003
0.8
0.07
Ca-
HC
O3
Z710
1K
hw
ee9.
229
.80.
1015
,640
–42
18.3
3526
4890
9.9
213
1438
70.
053
0.9
<0.0
1N
a–C
lZ7
152
Kh
wee
8.4
(31.
0)0.
9847
2022
214
.083
612
8037
.432
.474
.616
00.
109
3.4
<0.0
1N
a–C
lZ7
157
Kh
wee
8.8
29.1
0.10
57,5
00–7
131
5.0
14,6
2223
,000
144
461
2758
470.
018
5.1
<0.0
1N
a–C
lZ7
102
Kh
wee
10.7
(30.
7)0.
1244
2020
95.
888
610
760.
51.
488
.519
90.
008
0.4
–N
a–C
lZ7
100
Kh
wee
9.3
30.2
0.21
11,6
30–3
920
.926
0138
5014
.120
.041
924
<0.0
030.
7<0
.01
Na–
Cl
aG
rou
p1
ofpe
rch
edaq
uif
ers.
bG
rou
p2
ofpe
rch
edaq
uif
ers.
S. Stadler et al. / Journal of Hydrology 388 (2010) 291–303 295
A further distinct deviation from the general water chemistry inOrapa is found in and near the Khwee block, which is the mostprominent horst structure in the area, where the Ntane sandstoneaquifer is very thin to absent. Groundwater sampled there exhibitsextremely high electric conductivities up to 57.5 mS/cm (Z7157)(Table 2). These waters are mainly dominated by sodium and chlo-ride, have reducing redox conditions (compared to predominantlyoxic conditions in the rest of the study area) and appear to bestrongly influenced by Na–Cl type groundwater likely to stem fromMosolotsane layers. It was not possible to sample water that onlyoriginated from the Mosolotsane mud- and siltstone layers. How-ever, in some boreholes in or near the Khwee block, the NtaneSandstone Aquifer was very thin, and boreholes penetrated deepinto the Mosolotsane layers. The water from the Khwee block gen-erally has a Na–Cl signature of high specific electric conductivities,which coincides with Mosolotsane waters described in the vicinityof the study area (Rahube, 2003). The data sets in Table 2 also showthat the amount of dissolved solids varies quite strongly as re-flected by the electric conductivity ranges. Those are mainly gov-erned by sodium, chloride and sulfate concentrations. The rangesin specific electric conductivities probably reflect effects of mixingof water from the Ntane sandstone with water from Mosolotsanelayers in areas where the geologic situation permits mixing.
4.1.1. NitrateThroughout the groundwater of both study areas (Serowe and
Orapa), high nitrate concentrations occur. Nitrate in the study areais predominantly of natural origin, leached from a pool in theunsaturated zone (Stadler et al., 2008). Nitrate concentrations (asNO3) in Serowe range from less than 5–219 mg/l, with a mean con-centration of 22.8 mg/l and a median value of 8.4 mg/l. In Serowe,the Ca-HCO3 water type is associated with elevated nitrate concen-trations in the order of 30–219 mg/l, while the Na-HCO3 water typeis connected to low nitrate concentrations mostly in the order of0–10 mg/l (Table 1). In Orapa, the average nitrate concentrationsare higher (mean nitrate concentration of 30.6 mg/l, median valueof 29.0 mg/l) than in Serowe. However, a narrower total range ofconcentrations was observed in Orapa that lies between 0 and93.7 mg/l. Contrary to observations from Serowe, higher NO�3 con-centrations in Orapa are not found in Ca-HCO3 waters but rather ingroundwaters with a Na-(HCO3)-Cl signature (Tables 1 and 2).
In groundwater near Serowe a general nitrate concentration de-crease through denitrification appears to play a minor role due toprevailing oxic conditions (Stadler et al., 2008). Groundwater fromOrapa appears to locally provide appropriate conditions for nitratereduction (especially where the influence of perched aquifers islacking), which may explain the less broad nitrate concentrationrange in Orapa.
Localized denitrification is also confirmed by the investigationof the stable isotopes of nitrate (Stadler et al., 2008) for a subsetof the samples, and from the partial absence of oxygen, the pres-ence of carbon sources and appropriate redox potentials (Table 1).
Yet, as can be seen from Table 1 this is not the case for all sam-ples, as dissolved oxygen concentrations up to 3.7 mg/l occur. Fromthe hydrochemical perspective it is possible that nitrate originatingfrom the recharge area in Serowe is fully reduced along the flowpath and that the observed concentration pattern is a function ofnitrate input from perched aquifers. These aquifers are more com-mon in the Orapa area and some have been observed to carry ele-vated nitrate concentrations. In addition, the groundwater table isshallower in Orapa than in Serowe, enabling faster surficial input.
4.1.2. Derived groundwater componentsDue to the complex hydraulic setting owing to the structural
geology and the observed localized differences in groundwaterchemistry, it is not possible to derive flow paths from aligning
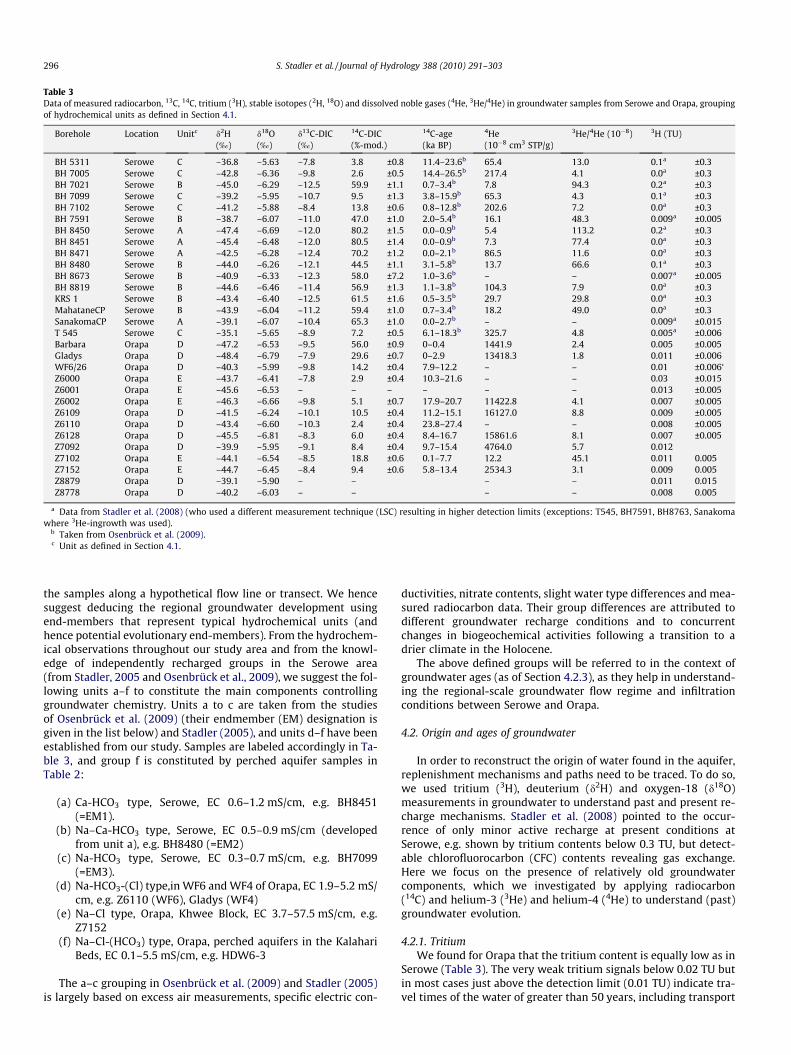
Table 3Data of measured radiocarbon, 13C, 14C, tritium (3H), stable isotopes (2H, 18O) and dissolved noble gases (4He, 3He/4He) in groundwater samples from Serowe and Orapa, groupingof hydrochemical units as defined in Section 4.1.
Borehole Location Unitc d2H(‰)
d18O(‰)
d13C-DIC(‰)
14C-DIC(%-mod.)
14C-age(ka BP)
4He(10�8 cm3 STP/g)
3He/4He (10�8) 3H (TU)
BH 5311 Serowe C –36.8 –5.63 –7.8 3.8 ±0.8 11.4–23.6b 65.4 13.0 0.1a ±0.3BH 7005 Serowe C –42.8 –6.36 –9.8 2.6 ±0.5 14.4–26.5b 217.4 4.1 0.0a ±0.3BH 7021 Serowe B –45.0 –6.29 –12.5 59.9 ±1.1 0.7–3.4b 7.8 94.3 0.2a ±0.3BH 7099 Serowe C –39.2 –5.95 –10.7 9.5 ±1.3 3.8–15.9b 65.3 4.3 0.1a ±0.3BH 7102 Serowe C –41.2 –5.88 –8.4 13.8 ±0.6 0.8–12.8b 202.6 7.2 0.0a ±0.3BH 7591 Serowe B –38.7 –6.07 –11.0 47.0 ±1.0 2.0–5.4b 16.1 48.3 0.009a ±0.005BH 8450 Serowe A –47.4 –6.69 –12.0 80.2 ±1.5 0.0–0.9b 5.4 113.2 0.2a ±0.3BH 8451 Serowe A –45.4 –6.48 –12.0 80.5 ±1.4 0.0–0.9b 7.3 77.4 0.0a ±0.3BH 8471 Serowe A –42.5 –6.28 –12.4 70.2 ±1.2 0.0–2.1b 86.5 11.6 0.0a ±0.3BH 8480 Serowe B –44.0 –6.26 –12.1 44.5 ±1.1 3.1–5.8b 13.7 66.6 0.1a ±0.3BH 8673 Serowe B –40.9 –6.33 –12.3 58.0 ±7.2 1.0–3.6b – – 0.007a ±0.005BH 8819 Serowe B –44.6 –6.46 –11.4 56.9 ±1.3 1.1–3.8b 104.3 7.9 0.0a ±0.3KRS 1 Serowe B –43.4 –6.40 –12.5 61.5 ±1.6 0.5–3.5b 29.7 29.8 0.0a ±0.3MahataneCP Serowe B –43.9 –6.04 –11.2 59.4 ±1.0 0.7–3.4b 18.2 49.0 0.0a ±0.3SanakomaCP Serowe A –39.1 –6.07 –10.4 65.3 ±1.0 0.0–2.7b – – 0.009a ±0.015T 545 Serowe C –35.1 –5.65 –8.9 7.2 ±0.5 6.1–18.3b 325.7 4.8 0.005a ±0.006Barbara Orapa D –47.2 –6.53 –9.5 56.0 ±0.9 0–0.4 1441.9 2.4 0.005 ±0.005Gladys Orapa D –48.4 –6.79 –7.9 29.6 ±0.7 0–2.9 13418.3 1.8 0.011 ±0.006WF6/26 Orapa D –40.3 –5.99 –9.8 14.2 ±0.4 7.9–12.2 – – 0.01 ±0.006‘Z6000 Orapa E –43.7 –6.41 –7.8 2.9 ±0.4 10.3–21.6 – – 0.03 ±0.015Z6001 Orapa E –45.6 –6.53 – – – – – – 0.013 ±0.005Z6002 Orapa E –46.3 –6.66 –9.8 5.1 ±0.7 17.9–20.7 11422.8 4.1 0.007 ±0.005Z6109 Orapa D –41.5 –6.24 –10.1 10.5 ±0.4 11.2–15.1 16127.0 8.8 0.009 ±0.005Z6110 Orapa D –43.4 –6.60 –10.3 2.4 ±0.4 23.8–27.4 – – 0.008 ±0.005Z6128 Orapa D –45.5 –6.81 –8.3 6.0 ±0.4 8.4–16.7 15861.6 8.1 0.007 ±0.005Z7092 Orapa D –39.9 –5.95 –9.1 8.4 ±0.4 9.7–15.4 4764.0 5.7 0.012Z7102 Orapa E –44.1 –6.54 –8.5 18.8 ±0.6 0.1–7.7 12.2 45.1 0.011 0.005Z7152 Orapa E –44.7 –6.45 –8.4 9.4 ±0.6 5.8–13.4 2534.3 3.1 0.009 0.005Z8879 Orapa D –39.1 –5.90 – – – – 0.011 0.015Z8778 Orapa D –40.2 –6.03 – – – – 0.008 0.005
a Data from Stadler et al. (2008) (who used a different measurement technique (LSC) resulting in higher detection limits (exceptions: T545, BH7591, BH8763, Sanakomawhere 3He-ingrowth was used).
b Taken from Osenbrück et al. (2009).c Unit as defined in Section 4.1.
296 S. Stadler et al. / Journal of Hydrology 388 (2010) 291–303
the samples along a hypothetical flow line or transect. We hencesuggest deducing the regional groundwater development usingend-members that represent typical hydrochemical units (andhence potential evolutionary end-members). From the hydrochem-ical observations throughout our study area and from the knowl-edge of independently recharged groups in the Serowe area(from Stadler, 2005 and Osenbrück et al., 2009), we suggest the fol-lowing units a–f to constitute the main components controllinggroundwater chemistry. Units a to c are taken from the studiesof Osenbrück et al. (2009) (their endmember (EM) designation isgiven in the list below) and Stadler (2005), and units d–f have beenestablished from our study. Samples are labeled accordingly in Ta-ble 3, and group f is constituted by perched aquifer samples inTable 2:
(a) Ca-HCO3 type, Serowe, EC 0.6–1.2 mS/cm, e.g. BH8451(=EM1).
(b) Na–Ca-HCO3 type, Serowe, EC 0.5–0.9 mS/cm (developedfrom unit a), e.g. BH8480 (=EM2)
(c) Na-HCO3 type, Serowe, EC 0.3–0.7 mS/cm, e.g. BH7099(=EM3).
(d) Na-HCO3-(Cl) type,in WF6 and WF4 of Orapa, EC 1.9–5.2 mS/cm, e.g. Z6110 (WF6), Gladys (WF4)
(e) Na–Cl type, Orapa, Khwee Block, EC 3.7–57.5 mS/cm, e.g.Z7152
(f) Na–Cl-(HCO3) type, Orapa, perched aquifers in the KalahariBeds, EC 0.1–5.5 mS/cm, e.g. HDW6-3
The a–c grouping in Osenbrück et al. (2009) and Stadler (2005)is largely based on excess air measurements, specific electric con-
ductivities, nitrate contents, slight water type differences and mea-sured radiocarbon data. Their group differences are attributed todifferent groundwater recharge conditions and to concurrentchanges in biogeochemical activities following a transition to adrier climate in the Holocene.
The above defined groups will be referred to in the context ofgroundwater ages (as of Section 4.2.3), as they help in understand-ing the regional-scale groundwater flow regime and infiltrationconditions between Serowe and Orapa.
4.2. Origin and ages of groundwater
In order to reconstruct the origin of water found in the aquifer,replenishment mechanisms and paths need to be traced. To do so,we used tritium (3H), deuterium (d2H) and oxygen-18 (d18O)measurements in groundwater to understand past and present re-charge mechanisms. Stadler et al. (2008) pointed to the occur-rence of only minor active recharge at present conditions atSerowe, e.g. shown by tritium contents below 0.3 TU, but detect-able chlorofluorocarbon (CFC) contents revealing gas exchange.Here we focus on the presence of relatively old groundwatercomponents, which we investigated by applying radiocarbon(14C) and helium-3 (3He) and helium-4 (4He) to understand (past)groundwater evolution.
4.2.1. TritiumWe found for Orapa that the tritium content is equally low as in
Serowe (Table 3). The very weak tritium signals below 0.02 TU butin most cases just above the detection limit (0.01 TU) indicate tra-vel times of the water of greater than 50 years, including transport
S. Stadler et al. / Journal of Hydrology 388 (2010) 291–303 297
in the unsaturated and the saturated zones (Zoellmann et al.,2001), since tritium reflects the time of the separation of the watermolecule from the atmosphere. Considering the tritium content ofcurrent precipitation of 2–4 TU (IAEA/WMO, 2006) in SouthernAfrica, the maximum percentage of young water in the investi-gated system in Orapa would be in the order of less than 0.5%,assuming that the modern component has a current atmosphericcomposition. Most likely the tritium content of precipitation waseven much higher at the time of infiltration due to the long traveltime of infiltration water through the thick unsaturated zone.Unfortunately, there are no CFC data available for Orapa to giveconclusions on gas exchange.
4.2.2. Stable isotopes of water (2H and 18O)d2H and d18O measurements of groundwater can reveal infor-
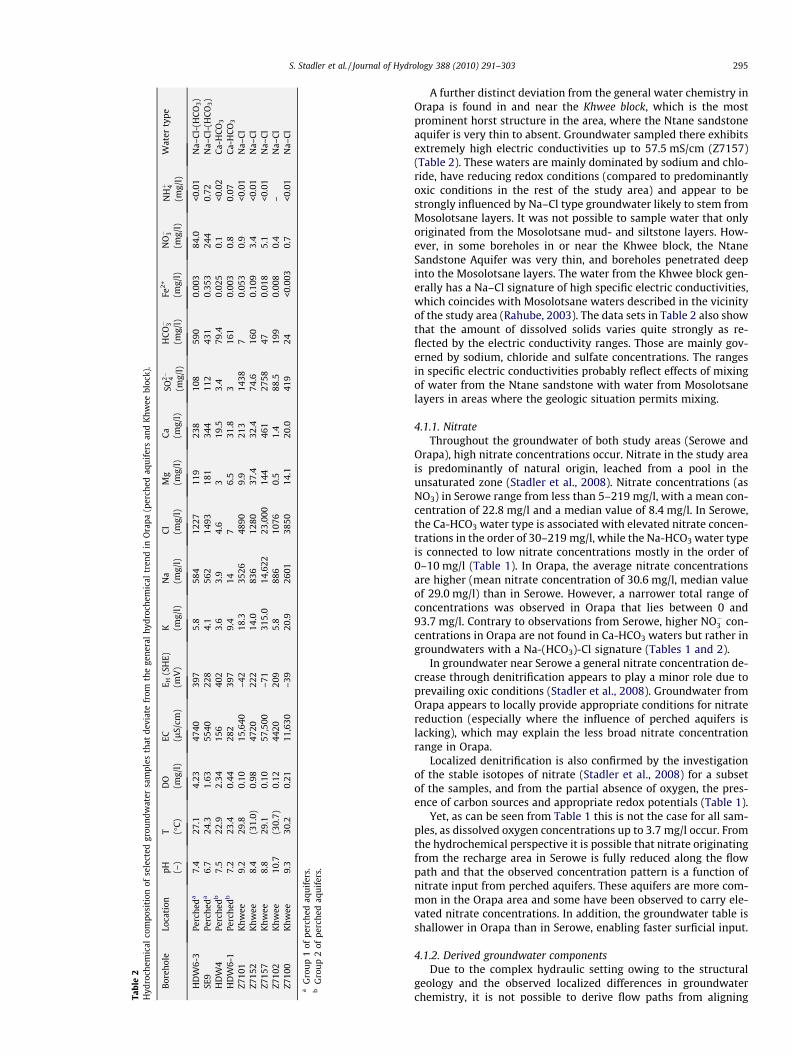
mation on formation conditions and fate of the water (e.g. Mook,2001). All d2H and d18O values of groundwater sampled from theNtane Sandstone Aquifer near Serowe lie in a narrow range be-tween �47.4‰ and �35.1‰, and �6.7‰ and �5.6‰, respectively(Table 3). The groundwater samples taken from Orapa denote avery similar range for d2H from �48.4‰ to �39.1‰, and for d18Ovalues of �6.8‰ to �5.9 ‰ (Table 3). The values lie within therange observed in previous studies (e.g. Verhagen, 1991). InFig. 3 the samples group around (and slightly below) the globalmeteoric water line (GMWL). There is no GNIP station (Global Net-work of Precipitation) in the immediate vicinity of the study areato derive a local meteoric water line. However, combining informa-tion of several more distant GNIP stations, Verhagen (1992) sug-gested that samples from the Kalahari environment should plotnear the GMWL.
Possible mechanisms causing the displacement of the measuredsamples below the meteoric water line are (i) partial evaporationfrom soils and dilution by subsequent recharge as described e.g.in Allison et al. (1983) as a common feature of semi-arid regions.Long residence times of the infiltration water in the top few metersof the soil (e.g. Obakeng, 2007; Schwiede et al., 2005; Schwiede,2007; Stadler et al., 2008) make it subject to partial evaporation.Water infiltrated in this manner is more enriched in heavy stableisotopes than water that enters the soil by direct infiltration.
Fig. 3. d18O–d2H diagram of groundwater samples taken in the Serowe and Orapaarea. The line represents the Global Meteoric Water Line (GMWL), given byd2H = 8 � d18O + 10‰ V-SMOW. Open symbols represent external data fromWellfield (2000) for Serowe. Serowe symbol groups are in accordance with groupsinferred from 14C investigations. Squared symbols represent data from Serowe(black: >40%-mod., cross: <30%-mod.), round symbols represent data from Orapa(black: >30%-mod, grey: �20%-mod.).
And/or (ii) the observed stable isotope signatures could also be ex-plained as a result of evaporation already during rainfall throughan atmosphere of lower humidity prior to infiltration (Yurtseverand Gat, 1981). The close clustering of the groundwater samplessuggests that there is little variation in recharge conditions, as alsoconfirmed by stable isotope data in previous studies in the area(e.g. Verhagen, 1992). From the present data we cannot distinguishif mechanism (i) or (ii) is the dominating mechanism. With the lackor only little amount of surface runoff in the study area (Schwiedeet al., 2005), rain water could be suspected to collect in surfacedepressions and undergo significant open surface evaporation assuggested by Verhagen (1995), which would show stronger enrich-ment, especially in d18O. Such a strong enrichment, however, can-not be confirmed from stable isotope data recorded in this study.
Only when grouped according to their 14C content, can moder-ate trends be observed. The bulk of 14C rich groundwaters fromSerowe show a greater depletion in 18O and 2H relative to thegroundwaters poorer in 14C (Fig. 4). Adding other published stableisotope data from the area (e.g. Wellfield, 2000, which is includedinto Fig. 3) confirms this observation. Given different temperature/climatic conditions at recharge as suggested by apparent 14C ages(as will be shown in Section 4.2.3) and in the literature (DeVries,1984; Osenbrück et al., 2009; Verhagen, 1992), the samples wereexpected to show a temperature effect, where waters replenishedunder warmer conditions would be enriched in heavy isotopes asopposed to those formed during colder and probably wetter peri-ods. The former would be representing present semi-arid condi-tions (14C rich samples), while the latter would represent waterrecharged at the end of the Pleistocene (as assumed for 14C poorsamples), where the last major pluvial phase was assumed to havebeen (e.g. Thomas and Shaw, 2002, 1991; Tyson and Preston-Whyte, 2000). Given the anticipated difference in temperature of5 �C between the Holocene and the Pleistocene (Kulongowskiet al., 2004; Stute and Talma, 1997), a 2‰ shift of the d18O values(Gat and Gonfiantini, 1981; Kipfer et al., 2002) should be observed,corresponding to 16‰ in d2H. However, a potential temperature ef-fect, if present, appears to be covered by an extensive amount ef-fect (Dansgaard, 1964) as already suggested by Selaolo (1998),which shows that only high-intensity rainfall events replenishthe aquifer.
For water samples from Orapa again the 14C-rich samples aregenerally isotopically (18O, 2H) lighter, thus theoretically may con-firm the amount effect observed in groundwater samples fromSerowe (Fig. 3). Yet as only two samples from Orapa have elevated14C contents (Barbara and Gladys), they might be a too small entityto derive robust trends. The samples poor in 14C are scattered overthe entire observed 2H and 18O range. One reason for this range
Fig. 4. Relations of 14C content to d2H, indicating a greater enrichment in d2H forsamples poorer in 14C – especially in data from Serowe (squares). A poorercorrelation of data from Orapa was found (circles). Symbol groups are in accordancewith those given in Fig. 3, where ‘elev. 14C’ indicates 40–80%-mod., and ‘low 14C’indicates <30%-mod.
298 S. Stadler et al. / Journal of Hydrology 388 (2010) 291–303
might be the decreasing precipitation gradient from Serowe toOrapa.
4.2.3. Carbon-14 and the carbonate systemRadiocarbon dating of groundwater has been applied in previ-
ous studies in the Kalahari environment (Mazor et al., 1977; Sela-olo, 1998, Stute and Talma, 1997, Verhagen, 1995, Vogel et al.,1982). The 14C-DIC signal in the studied samples may reflect either(i) decay alone (if only a minor effect of carbonate in the NtaneSandstone aquifer matrix is assumed), (ii) dilution of the 14Ccontent with groundwater containing ‘dead’ carbon (activity14aC = 0%-mod.) from carbonate dissolution (of calcretes in the Kal-ahari Beds, or from a potential stronger impact of the Ntane sand-stone’s matrix), and (iii) a disturbance of the originally infiltratedcarbon amount through sulfate reduction, incorporation of geogen-ic CO2 and/or methanogenesis. Case iii has no or only minor impactin the study area as established from prevailing redox conditions.Several correction models have been produced to account for theseeffects, which are well documented in the literature (e.g. Clark andFritz, 1997; Fontes and Garnier, 1979; Geyh, 2000; Zhu and Mur-phy, 2000). Verhagen (1992) used initial 14C ranges of 70–90%mod. for Kalahari groundwaters without specifying how these val-ues were determined. Vogel et al. (1982) used a rather simple sta-tistical correction model (Vogel, 1970) and added a chemicalcorrection for some data points. Likewise, Mazor et al. (1977) onlyused an initial 14C value of 85%-mod., while Stute and Talma (1997)used d13C mixing approaches. Selaolo (1998) calculated 14C derivedages using the Netpath model (Plummer et al., 1991) without giv-ing specific calculation details.
Our measured 14C and 13C values are listed in Table 3. To com-pute the initial 14C content and the apparent ages in Table 3 weused the d13C mixing approach (Ingerson and Pearson (1964) mod-ified by inclusion of open system carbon dissolution which re-quires the knowledge of the pH at recharge (Clark and Fritz,1997). In our calculations the soil carbonates were assumed tohave d13C values of �4‰ to �9‰. The value of �4 ‰ representsan average literature value for terrestrial carbonates (e.g. Eichinger,1983; Geyh, 2000; Kendall and McDonnell, 1998), �9 ‰ (Selaolo,1998) represents the only available measured value for carbonatein the study area. Following Osenbrück et al. (2009) we assumedopen system carbonate dissolution in the unsaturated zone (cal-cretes) as the most relevant process of carbon dissolution, andthe pH of infiltrating water to vary between 6.8 and 7.2, as themeasured pH range of the samples is 7.2–8.0, and typically re-charge waters have lower pH values than observed in groundwaterthat has passed through a (pH buffering) carbonatic environment.Because of large uncertainties in some of the required modelparameters (e.g. d13C of soil CO2 or pH at recharge) our maximum
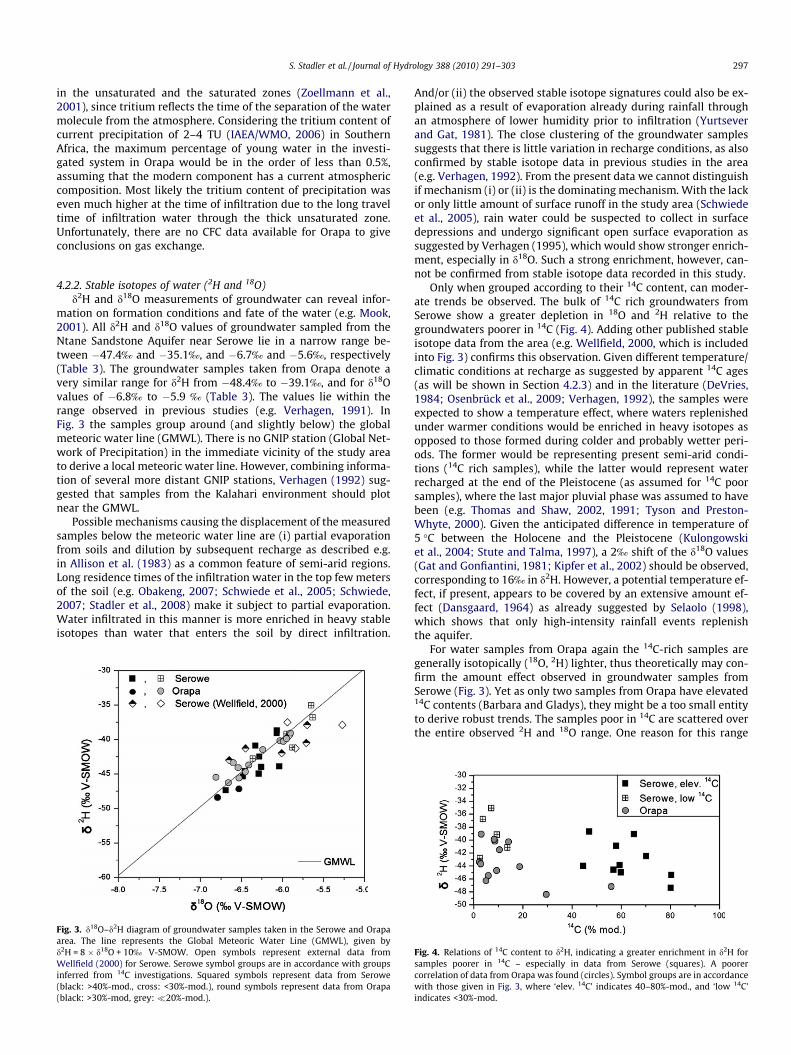
Fig. 5. Plot of 14C activities of groundwater samples in relation to their d13C values.Group 1 represents 14C-poor (<30%-mod.) and group 2 represents 14C-rich samples(40–80%-mod.). Symbol groups are in accordance with those given in Fig. 4.
ranges for the initial 14C DIC values of groundwater recharge to theNtane sandstone aquifer were 22–67%-mod. These ranges were de-rived from the above given constraints for the isotope mixing mod-els. Uncertainties in derived apparent ages resulting from the rangeof parameters used to derive the initial radiocarbon content can beas large as 12 ka.
4.2.3.1. Carbon-13. The d13C-DIC values (in the following referred toas d13C) found in the groundwater from Serowe and Orapa are be-tween �12.5‰ and �7.8 ‰ (Table 3). Two groups can be identifiedand are termed according to their 14C content in 14C-poor (less than30%-mod., group 1) and 14C-rich samples (40–80%-mod., group 2)(Fig. 5) and their 13C signals. 14C-poor samples have a mean d13Csignal of �9.0‰. The 14C-rich samples represent a narrow rangeof d13C values with a mean d13C value of �11.8‰. The differencesbetween mean values of the groups are statistically significant(two-tailed t-test, at a = 0.01). The encountered grouping of thed13C values may reflect that (i) the samples were recharged underdifferent conditions (humid-dry, open-closed, different aquifermatrices), (ii) some of the samples progressed further in their geo-chemical evolution (regarding carbonate chemistry), or (iii) theyrepresent a mixed signal with varying contributions from C3- andC4-plants (which can also be regarded as a special case of (i), orwith carbonate from carbonate matrix dissolution. In the Kalaharithe predominant vegetation are acacias (Ringrose et al., 1998; Tho-mas and Shaw, 1991) which are C3-plants, while grass is a C4-plant(Vogel, 1970). The proportion of each plant group is, however, notprecisely known (Wang et al., 2007), yet acacias appear to be pre-dominant year-round, while grass only seems to be of importanceduring rainy season. With these considerations we estimated thecontribution of C3-plants to the soil CO2-production to be between70–90%, resulting in d13C values of soil-CO2 between �18.8 and�21.6‰.
4.2.3.2. Apparent groundwater ages (14C). In the following, we dis-cuss if and how groundwater ages can be derived from our 14Cdata. We measured the following 14C data for the hydrochemicalunits defined in 4.1:
(a) Ca-HCO3 type, Serowe, 65.3–80.5%-mod. (d13C: �10.4 to�12.4‰).
(b) Na–Ca-HCO3 type, Serowe, 44.5–61.5%-mod. (d13C: �11.0 to�12.5‰).
(c) Na-HCO3 type, Serowe, 2.6–13.8%-mod. (d13C: �7.8 to�10.7‰).
(d) Na-HCO3–(Cl) type, Orapa, 2.4–56%-mod. (d13C: �7.9 to�10.3‰).
(e) Na–Cl type, Orapa, Khwee Block, 2.9–18.8%-mod. (d13C: �7.8to �9.8‰).
For unit f unfortunately no isotopic data is available. A highapparent age range has been produced by the application of the gi-ven constraints for initial carbon correction as depicted in Table 3.However, these calculations provide a tool in the qualitative agedetermination that is relevant to determine the fate of solutes inthe aquifer and results will be interpreted in their relative contextonly.
Osenbrück et al. (2009) suggests ages of 0.0–2.7 ka BP for unit a(their EM 1), 0.0–5.8 ka BP for unit b (their EM2), and 0.8–26.5 kaBP for unit c (their EM3) as given in Table 3. Our calculated ground-water ages for Orapa (Table 3) show values between 0.1–21.6 and 0–27.4 ka BP (units e and d). Most of the Orapa samples (units e, andmost of unit d) lie in approximately the same 13C and 14C range asunit c (Table 3). Only two boreholes in unit d in Orapa (Gladys andBarbara) have a strikingly high 14C content (29.6 and
S. Stadler et al. / Journal of Hydrology 388 (2010) 291–303 299
56.0%-mod., respectively), as opposed to�30%-mod. for the remain-ing samples in Orapa.
4.2.4. The noble gas isotopes helium-3 and helium-4Dissolved noble gases can be used for the estimation of ground-
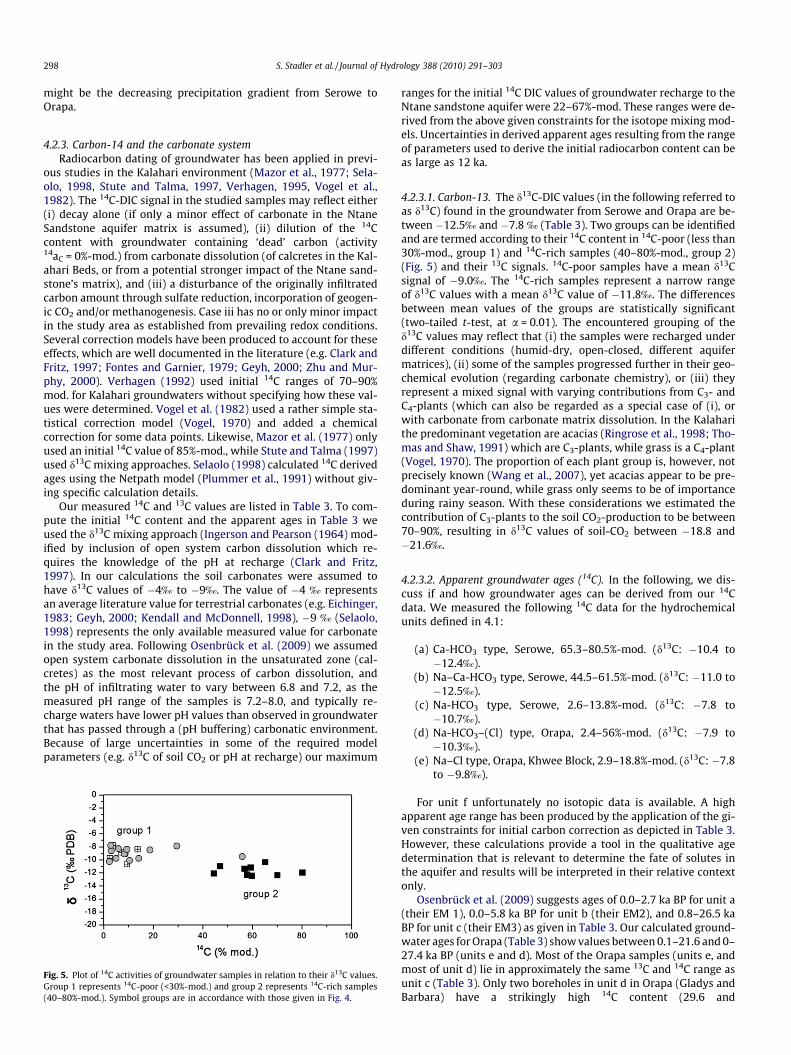
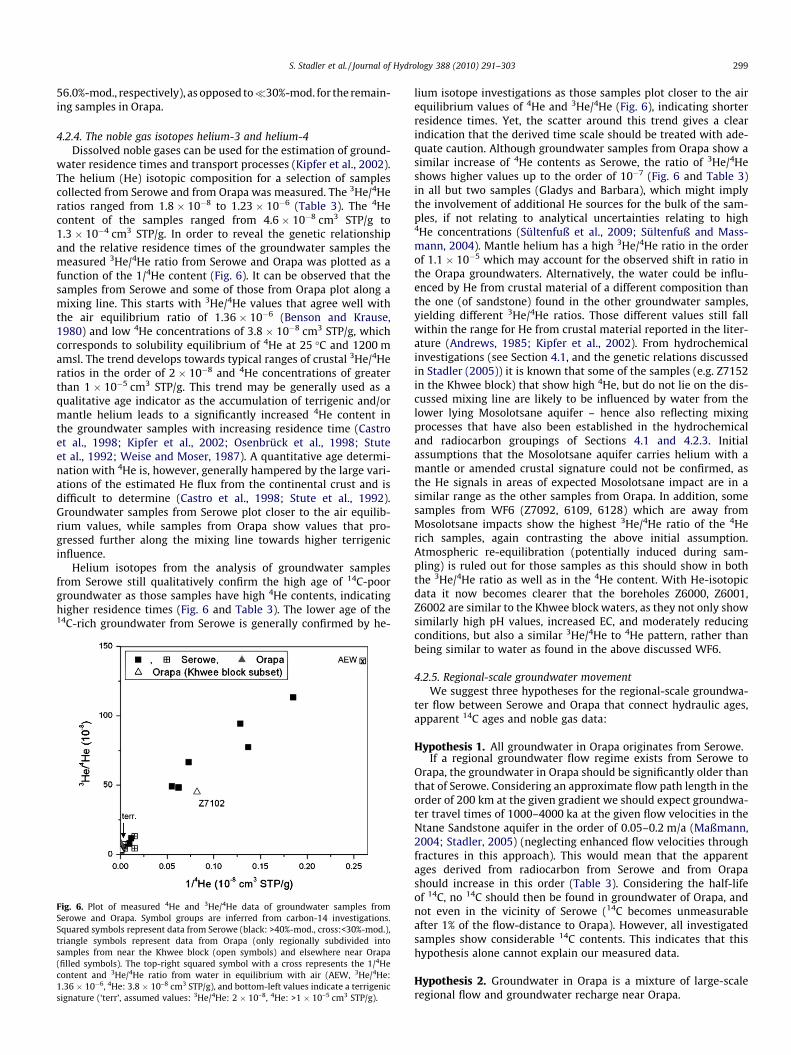
water residence times and transport processes (Kipfer et al., 2002).The helium (He) isotopic composition for a selection of samplescollected from Serowe and from Orapa was measured. The 3He/4Heratios ranged from 1.8 � 10�8 to 1.23 � 10�6 (Table 3). The 4Hecontent of the samples ranged from 4.6 � 10�8 cm3 STP/g to1.3 � 10�4 cm3 STP/g. In order to reveal the genetic relationshipand the relative residence times of the groundwater samples themeasured 3He/4He ratio from Serowe and Orapa was plotted as afunction of the 1/4He content (Fig. 6). It can be observed that thesamples from Serowe and some of those from Orapa plot along amixing line. This starts with 3He/4He values that agree well withthe air equilibrium ratio of 1.36 � 10�6 (Benson and Krause,1980) and low 4He concentrations of 3.8 � 10�8 cm3 STP/g, whichcorresponds to solubility equilibrium of 4He at 25 �C and 1200 mamsl. The trend develops towards typical ranges of crustal 3He/4Heratios in the order of 2 � 10�8 and 4He concentrations of greaterthan 1 � 10�5 cm3 STP/g. This trend may be generally used as aqualitative age indicator as the accumulation of terrigenic and/ormantle helium leads to a significantly increased 4He content inthe groundwater samples with increasing residence time (Castroet al., 1998; Kipfer et al., 2002; Osenbrück et al., 1998; Stuteet al., 1992; Weise and Moser, 1987). A quantitative age determi-nation with 4He is, however, generally hampered by the large vari-ations of the estimated He flux from the continental crust and isdifficult to determine (Castro et al., 1998; Stute et al., 1992).Groundwater samples from Serowe plot closer to the air equilib-rium values, while samples from Orapa show values that pro-gressed further along the mixing line towards higher terrigenicinfluence.
Helium isotopes from the analysis of groundwater samplesfrom Serowe still qualitatively confirm the high age of 14C-poorgroundwater as those samples have high 4He contents, indicatinghigher residence times (Fig. 6 and Table 3). The lower age of the14C-rich groundwater from Serowe is generally confirmed by he-
Fig. 6. Plot of measured 4He and 3He/4He data of groundwater samples fromSerowe and Orapa. Symbol groups are inferred from carbon-14 investigations.Squared symbols represent data from Serowe (black: >40%-mod., cross:<30%-mod.),triangle symbols represent data from Orapa (only regionally subdivided intosamples from near the Khwee block (open symbols) and elsewhere near Orapa(filled symbols). The top-right squared symbol with a cross represents the 1/4Hecontent and 3He/4He ratio from water in equilibrium with air (AEW, 3He/4He:1.36 � 10�6, 4He: 3.8 � 10–8 cm3 STP/g), and bottom-left values indicate a terrigenicsignature (‘terr’, assumed values: 3He/4He: 2 � 10–8, 4He: >1 � 10–5 cm3 STP/g).
lium isotope investigations as those samples plot closer to the airequilibrium values of 4He and 3He/4He (Fig. 6), indicating shorterresidence times. Yet, the scatter around this trend gives a clearindication that the derived time scale should be treated with ade-quate caution. Although groundwater samples from Orapa show asimilar increase of 4He contents as Serowe, the ratio of 3He/4Heshows higher values up to the order of 10�7 (Fig. 6 and Table 3)in all but two samples (Gladys and Barbara), which might implythe involvement of additional He sources for the bulk of the sam-ples, if not relating to analytical uncertainties relating to high4He concentrations (Sültenfuß et al., 2009; Sültenfuß and Mass-mann, 2004). Mantle helium has a high 3He/4He ratio in the orderof 1.1 � 10�5 which may account for the observed shift in ratio inthe Orapa groundwaters. Alternatively, the water could be influ-enced by He from crustal material of a different composition thanthe one (of sandstone) found in the other groundwater samples,yielding different 3He/4He ratios. Those different values still fallwithin the range for He from crustal material reported in the liter-ature (Andrews, 1985; Kipfer et al., 2002). From hydrochemicalinvestigations (see Section 4.1, and the genetic relations discussedin Stadler (2005)) it is known that some of the samples (e.g. Z7152in the Khwee block) that show high 4He, but do not lie on the dis-cussed mixing line are likely to be influenced by water from thelower lying Mosolotsane aquifer – hence also reflecting mixingprocesses that have also been established in the hydrochemicaland radiocarbon groupings of Sections 4.1 and 4.2.3. Initialassumptions that the Mosolotsane aquifer carries helium with amantle or amended crustal signature could not be confirmed, asthe He signals in areas of expected Mosolotsane impact are in asimilar range as the other samples from Orapa. In addition, somesamples from WF6 (Z7092, 6109, 6128) which are away fromMosolotsane impacts show the highest 3He/4He ratio of the 4Herich samples, again contrasting the above initial assumption.Atmospheric re-equilibration (potentially induced during sam-pling) is ruled out for those samples as this should show in boththe 3He/4He ratio as well as in the 4He content. With He-isotopicdata it now becomes clearer that the boreholes Z6000, Z6001,Z6002 are similar to the Khwee block waters, as they not only showsimilarly high pH values, increased EC, and moderately reducingconditions, but also a similar 3He/4He to 4He pattern, rather thanbeing similar to water as found in the above discussed WF6.
4.2.5. Regional-scale groundwater movementWe suggest three hypotheses for the regional-scale groundwa-
ter flow between Serowe and Orapa that connect hydraulic ages,apparent 14C ages and noble gas data:
Hypothesis 1. All groundwater in Orapa originates from Serowe.
If a regional groundwater flow regime exists from Serowe toOrapa, the groundwater in Orapa should be significantly older thanthat of Serowe. Considering an approximate flow path length in theorder of 200 km at the given gradient we should expect groundwa-ter travel times of 1000–4000 ka at the given flow velocities in theNtane Sandstone aquifer in the order of 0.05–0.2 m/a (Maßmann,2004; Stadler, 2005) (neglecting enhanced flow velocities throughfractures in this approach). This would mean that the apparentages derived from radiocarbon from Serowe and from Orapashould increase in this order (Table 3). Considering the half-lifeof 14C, no 14C should then be found in groundwater of Orapa, andnot even in the vicinity of Serowe (14C becomes unmeasurableafter 1% of the flow-distance to Orapa). However, all investigatedsamples show considerable 14C contents. This indicates that thishypothesis alone cannot explain our measured data.
Hypothesis 2. Groundwater in Orapa is a mixture of large-scaleregional flow and groundwater recharge near Orapa.
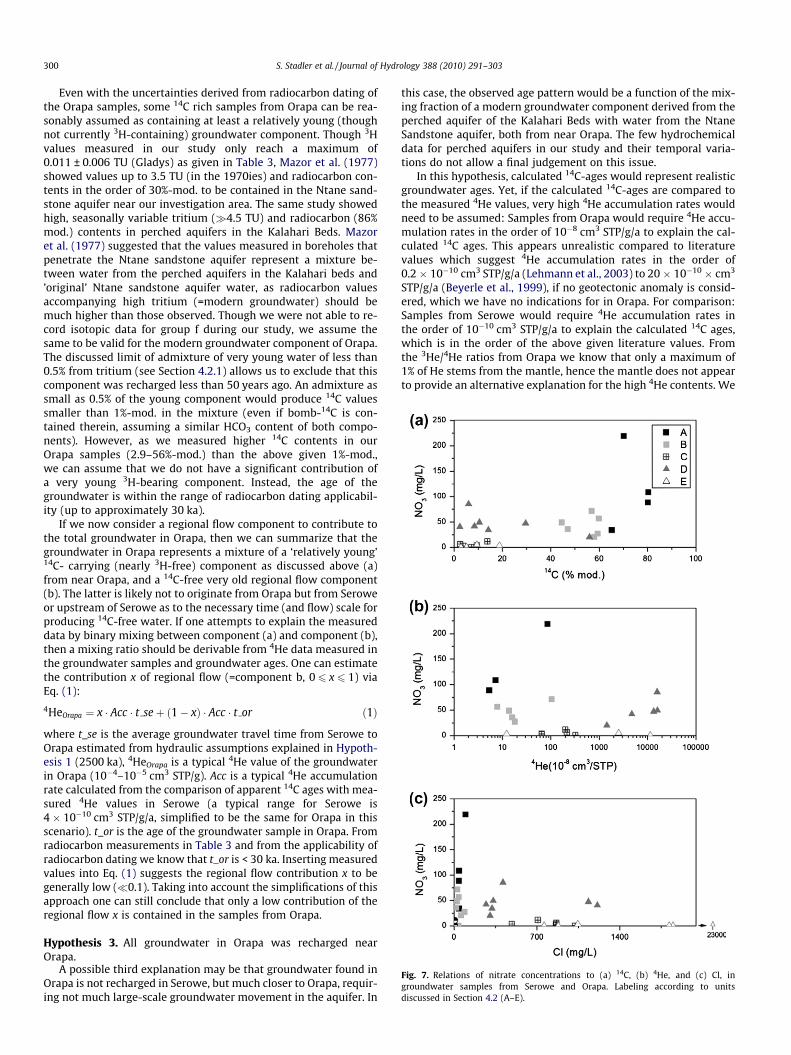
Fig. 7. Relations of nitrate concentrations to (a) 14C, (b) 4He, and (c) Cl, ingroundwater samples from Serowe and Orapa. Labeling according to unitsdiscussed in Section 4.2 (A–E).
300 S. Stadler et al. / Journal of Hydrology 388 (2010) 291–303
Even with the uncertainties derived from radiocarbon dating ofthe Orapa samples, some 14C rich samples from Orapa can be rea-sonably assumed as containing at least a relatively young (thoughnot currently 3H-containing) groundwater component. Though 3Hvalues measured in our study only reach a maximum of0.011 ± 0.006 TU (Gladys) as given in Table 3, Mazor et al. (1977)showed values up to 3.5 TU (in the 1970ies) and radiocarbon con-tents in the order of 30%-mod. to be contained in the Ntane sand-stone aquifer near our investigation area. The same study showedhigh, seasonally variable tritium (�4.5 TU) and radiocarbon (86%mod.) contents in perched aquifers in the Kalahari Beds. Mazoret al. (1977) suggested that the values measured in boreholes thatpenetrate the Ntane sandstone aquifer represent a mixture be-tween water from the perched aquifers in the Kalahari beds and’original’ Ntane sandstone aquifer water, as radiocarbon valuesaccompanying high tritium (=modern groundwater) should bemuch higher than those observed. Though we were not able to re-cord isotopic data for group f during our study, we assume thesame to be valid for the modern groundwater component of Orapa.The discussed limit of admixture of very young water of less than0.5% from tritium (see Section 4.2.1) allows us to exclude that thiscomponent was recharged less than 50 years ago. An admixture assmall as 0.5% of the young component would produce 14C valuessmaller than 1%-mod. in the mixture (even if bomb-14C is con-tained therein, assuming a similar HCO3 content of both compo-nents). However, as we measured higher 14C contents in ourOrapa samples (2.9–56%-mod.) than the above given 1%-mod.,we can assume that we do not have a significant contribution ofa very young 3H-bearing component. Instead, the age of thegroundwater is within the range of radiocarbon dating applicabil-ity (up to approximately 30 ka).
If we now consider a regional flow component to contribute tothe total groundwater in Orapa, then we can summarize that thegroundwater in Orapa represents a mixture of a ‘relatively young’14C- carrying (nearly 3H-free) component as discussed above (a)from near Orapa, and a 14C-free very old regional flow component(b). The latter is likely not to originate from Orapa but from Seroweor upstream of Serowe as to the necessary time (and flow) scale forproducing 14C-free water. If one attempts to explain the measureddata by binary mixing between component (a) and component (b),then a mixing ratio should be derivable from 4He data measured inthe groundwater samples and groundwater ages. One can estimatethe contribution x of regional flow (=component b, 0 6 x 6 1) viaEq. (1):
4HeOrapa ¼ x � Acc � t seþ ð1� xÞ � Acc � t or ð1Þ
where t_se is the average groundwater travel time from Serowe toOrapa estimated from hydraulic assumptions explained in Hypoth-esis 1 (2500 ka), 4HeOrapa is a typical 4He value of the groundwaterin Orapa (10�4–10�5 cm3 STP/g). Acc is a typical 4He accumulationrate calculated from the comparison of apparent 14C ages with mea-sured 4He values in Serowe (a typical range for Serowe is4 � 10�10 cm3 STP/g/a, simplified to be the same for Orapa in thisscenario). t_or is the age of the groundwater sample in Orapa. Fromradiocarbon measurements in Table 3 and from the applicability ofradiocarbon dating we know that t_or is < 30 ka. Inserting measuredvalues into Eq. (1) suggests the regional flow contribution x to begenerally low (�0.1). Taking into account the simplifications of thisapproach one can still conclude that only a low contribution of theregional flow x is contained in the samples from Orapa.
Hypothesis 3. All groundwater in Orapa was recharged nearOrapa.
A possible third explanation may be that groundwater found inOrapa is not recharged in Serowe, but much closer to Orapa, requir-ing not much large-scale groundwater movement in the aquifer. In
this case, the observed age pattern would be a function of the mix-ing fraction of a modern groundwater component derived from theperched aquifer of the Kalahari Beds with water from the NtaneSandstone aquifer, both from near Orapa. The few hydrochemicaldata for perched aquifers in our study and their temporal varia-tions do not allow a final judgement on this issue.
In this hypothesis, calculated 14C-ages would represent realisticgroundwater ages. Yet, if the calculated 14C-ages are compared tothe measured 4He values, very high 4He accumulation rates wouldneed to be assumed: Samples from Orapa would require 4He accu-mulation rates in the order of 10�8 cm3 STP/g/a to explain the cal-culated 14C ages. This appears unrealistic compared to literaturevalues which suggest 4He accumulation rates in the order of0.2 � 10�10 cm3 STP/g/a (Lehmann et al., 2003) to 20 � 10�10 � cm3
STP/g/a (Beyerle et al., 1999), if no geotectonic anomaly is consid-ered, which we have no indications for in Orapa. For comparison:Samples from Serowe would require 4He accumulation rates inthe order of 10�10 cm3 STP/g/a to explain the calculated 14C ages,which is in the order of the above given literature values. Fromthe 3He/4He ratios from Orapa we know that only a maximum of1% of He stems from the mantle, hence the mantle does not appearto provide an alternative explanation for the high 4He contents. We
S. Stadler et al. / Journal of Hydrology 388 (2010) 291–303 301
cannot exclude an influence of groundwater from deeper aquiferse.g. near the Khwee block. Yet high 4He contents were observedin all groundwater samples from Orapa (including Gladys andWF6), which necessitates a regional rather than a local enhanced4He flux, which renders this scenario less likely.
As a general conclusion on the discussed hypotheses one cansummarize the following: The fact that detectable 14C contentsare found throughout the study areas (Serowe and Orapa) underthe given hydraulic setting and dimensions of the study area ar-gues against a regional groundwater flow. On the other hand theprevailing 14C contents may well be explained by mixing, whichis supported by measurement results and mixing calculations fromnoble gas investigations. We hence cannot exclude that a minorportion of the water (the old groundwater component) stems froma slow regional-scale groundwater movement from Serowe to Ora-pa, supporting our presented Hypothesis 2. Groundwater move-ment may proceed in time scales beyond the applicable timerange for radiocarbon dating.
4.3. Relations to solute transport using the example of nitrate
Using the example of nitrate, solute behaviour is discussed inthe context of groundwater mixing and observed residence times.The relation of nitrate concentrations to different water constitu-ents (14C, 4He, Cl) is shown in Figs. 7a–c, respectively. As can beseen from the graph, elevated nitrate contents are associated withthe earlier suggested hydrochemical unit a (up to >200 mg/l), andshow a group-related concentration pattern. Medium nitrate con-centrations are related to units b and d (20–85 mg/l); and low toabsent nitrate concentrations are related to units c and e. From iso-tope hydrological investigations coupled with hydrochemistry, asshown in Sections 4.1–4.3, we learned that though three main ni-trate concentrations clusters can be found, within the clusters theydo not relate to identical processes, but obey previously derivedgroupings. E.g. absent nitrate concentration can result from deni-
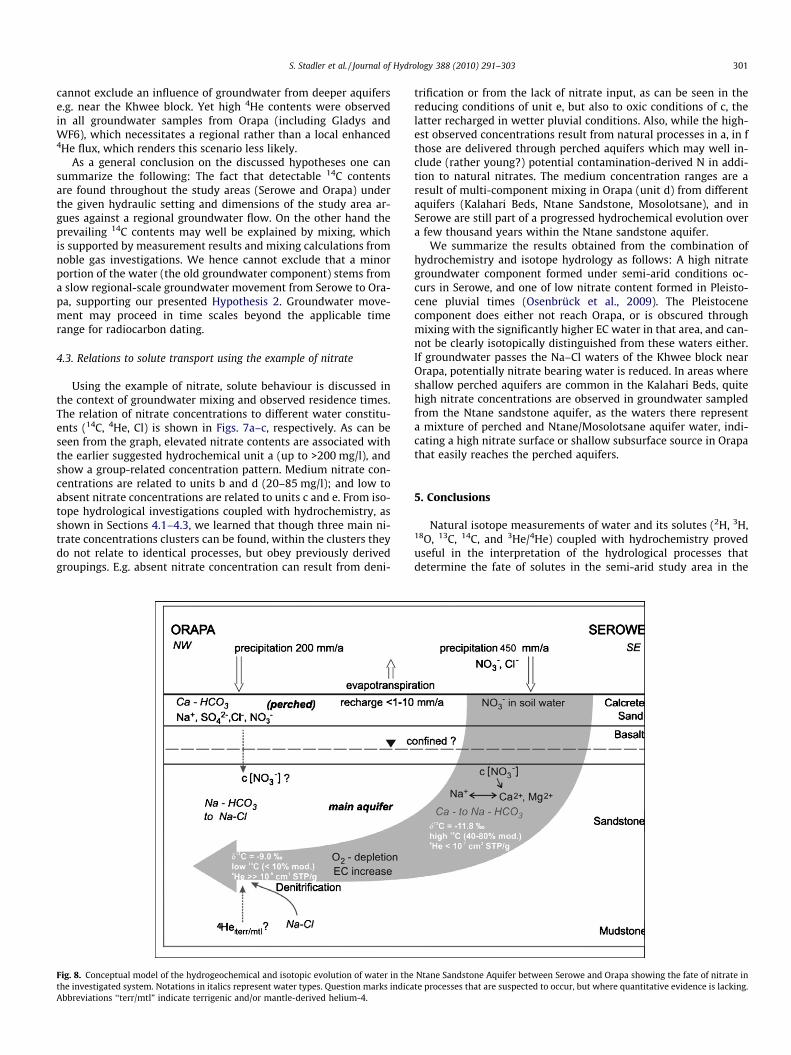
Fig. 8. Conceptual model of the hydrogeochemical and isotopic evolution of water in thethe investigated system. Notations in italics represent water types. Question marks indicaAbbreviations ‘‘terr/mtl” indicate terrigenic and/or mantle-derived helium-4.
trification or from the lack of nitrate input, as can be seen in thereducing conditions of unit e, but also to oxic conditions of c, thelatter recharged in wetter pluvial conditions. Also, while the high-est observed concentrations result from natural processes in a, in fthose are delivered through perched aquifers which may well in-clude (rather young?) potential contamination-derived N in addi-tion to natural nitrates. The medium concentration ranges are aresult of multi-component mixing in Orapa (unit d) from differentaquifers (Kalahari Beds, Ntane Sandstone, Mosolotsane), and inSerowe are still part of a progressed hydrochemical evolution overa few thousand years within the Ntane sandstone aquifer.
We summarize the results obtained from the combination ofhydrochemistry and isotope hydrology as follows: A high nitrategroundwater component formed under semi-arid conditions oc-curs in Serowe, and one of low nitrate content formed in Pleisto-cene pluvial times (Osenbrück et al., 2009). The Pleistocenecomponent does either not reach Orapa, or is obscured throughmixing with the significantly higher EC water in that area, and can-not be clearly isotopically distinguished from these waters either.If groundwater passes the Na–Cl waters of the Khwee block nearOrapa, potentially nitrate bearing water is reduced. In areas whereshallow perched aquifers are common in the Kalahari Beds, quitehigh nitrate concentrations are observed in groundwater sampledfrom the Ntane sandstone aquifer, as the waters there representa mixture of perched and Ntane/Mosolotsane aquifer water, indi-cating a high nitrate surface or shallow subsurface source in Orapathat easily reaches the perched aquifers.
5. Conclusions
Natural isotope measurements of water and its solutes (2H, 3H,18O, 13C, 14C, and 3He/4He) coupled with hydrochemistry proveduseful in the interpretation of the hydrological processes thatdetermine the fate of solutes in the semi-arid study area in the
Ntane Sandstone Aquifer between Serowe and Orapa showing the fate of nitrate inte processes that are suspected to occur, but where quantitative evidence is lacking.
302 S. Stadler et al. / Journal of Hydrology 388 (2010) 291–303
Kalahari of Botswana. The isotope hydrologic observations alongthe flow path – combined with hydrochemical observations – areschematized in Fig. 8.
Though individual findings may sometimes be ambiguous, com-bining the different indices yields a plausible scenario for the flowregime and solute transport conditions in the Ntane sandstoneaquifer. We showed that the regional-scale groundwater flow re-gime in the aquifer is only slow, and strongly impacted by mixing,especially where perched aquifers are occurring. Hence groundwa-ter is not only recharged in Serowe but also indirectly near Orapa,which was often not considered by previous authors. Knowing thisis especially important in the light of potential pollution, if intro-duced to shallow perched aquifers (which predominate aroundOrapa), as it may subsequently enter the Ntane sandstone aquifer– which we demonstrated for nitrate. However, these perchedaquifers also play a role in rendering high EC Na–Cl water (e.g.downstream of the Khwee block) into mixed lower EC waters,hence influencing their quality as process or (potential) drinkingwater. Whether and to what degree groundwater abstraction forwater supply (for human consumption or diamond mining opera-tions in the area) enhances these mixing processes should be ad-dressed in future studies. In addition, the spatial complexity ofwater transport in unsaturated zone by lithological and soil inho-mogeneities, as well as the role of vegetation therein, should beinvestigated in more detail, as those may play a more crucial rolein this semi-arid region of low topographic gradient than in humidareas.
Hence, this study was able to explain and qualitatively describesolute transport time scales and mechanisms in groundwater insemi-arid settings. It pointed out that these settings still pose achallenge in the interpretation of individual findings due to theencountered heterogeneities and the lack of quantitative data. Thisstudy showed that for the investigation of the fate of solutes ingroundwater an understanding of the water chemistry, but alsoof environmental tracers is crucial, as only a combination of thosemay reveal the flow and mixing mechanisms. Challenges are im-posed by the low data and/or borehole resolution that is oftenencountered in comparable semi-arid settings.
Acknowledgements
This study was funded by the Federal Institute for Geosciencesand Natural Resources (BGR), Hannover, Germany, as part of abilateral research project between BGR and the Department ofGeological Survey (DGS), Botswana. We would like to kindlyacknowledge DGS, Debswana, the teams of BGR section B 2; andM. v. Hoyer, as well as J. Sültenfuß.
References
AAC (Anglo American Corporation of Southern Africa Ltd.), 1992. Orapa 1992 Watersupply investigation. Vol. I – Main Report, CED/068/92. Internal Report forDebswana Diamond Co. (Pty.) Ltd. Orapa and Letlhakane Mines.
Allison, G.B., Barnes, C.J., Hughes, M.W., Leaney, F.W.J., 1983. Effect of climate andvegetation on oxygen-18 and deuterium in soils. Isotope hydrology. IAEA,Vienna. pp. 105–123.
Andrews, J.N., 1985. The isotopic composition of radiogenic helium and its useto study groundwater movement in confined aquifers. Chem. Geol. 49,339–351.
Arntzen, J.W., Veendendaal, E.M., 1986. A Profile of Environment and Developmentin Botswana. Report of the Institute for Environmental Studies (IES), FreeUniversity of Amsterdam, The Netherlands and the National Institute ofDevelopment, Research and Documentation (NIR), Gaborone, Botswana.
Bauer, P., Held, R.J., Zimmermann, S., Linn, F., Kinzelbach, W., 2006. Coupled flowand salinity transport modelling in semi-arid environments: The Shashe RiverValley, Botswana. J. Hydrol. 316, 163–183.
Benson, B.B., Krause, D., 1980. Isotopic fractionation of helium during solution:A probe for the liquid state. J. Solut. Chem. 9, 895–909.
Beyerle, U., Aeschbach-Hertig, W., Hofer, M., Imboden, D.M., Baur, H., Kipfer, R.,1999. Infiltration of river water to a shallow aquifer investigated with3H/3 He,noble gases and CFCs. J. Hydrol. 200, 169–185.
Castro, M.C., Goblet, P., Ledoux, E., Violette, de Marsily, G., 1998. Noble gases asnatural tracers of water circulation in Paris Basin 2. Calibration of agroundwater flow model using noble gas isotopic data. Water Resour. Res. 34,2467–2483.
Clark, I.D., Fritz, P., 1997. Environmental Isotopes in Hydrogeology. Springer, Berlin,Heidelberg, New York. pp. 350.
Dansgaard, W., 1964. Stable isotopes in precipitation. Tellus 16 (4), 436–468.Debswana, 2004. Wellfields Groundwater Monitoring Report. Internal Report
Compiled by A. Doorgapershad and P. Khutjwe, Number 32, 1 January–31December 2003.
DeVries, J.J., 1984. Holocene depletion and active recharge of the Kalaharigroundwaters. A review and an indicative model. J. Hydrol. 70, 221–232.
DeVries, J.J., Simmers, I., 2002. Groundwater recharge: an overview of processes andchallenges. Hydrol. J. 10, 5–17.
DeVries, J.J., Selaolo, E.T., Beekman, H.E., 2000. Groundwater recharge in the Kalahari,with reference to paleo-hydrologic conditions. J. Hydrol. 238, 110–123.
Eichinger, L., 1983. A contribution to the interpretation of 14C groundwater agesconsidering the example of a partially confined sandstone aquifer. Radiocarbon25, 347–356.
Fontes, J.C., Garnier, J.M., 1979. Determination of the initial 14C activity of the totaldissolved carbon: a review of the existing models and a new approach. WaterResour. Res. 5 (2), 399–413.
Gat, J.R., Gonfiantini, R., 1981. Stable Isotope Hydrology. Technical Report Series210. IAEA, Vienna.
Geyh, M.A., 2000. An overview of 14C analysis in the study of groundwater.Radiocarbon 42 (1), 99–114.
Heaton, T.H.E., 1984. Sources of the nitrate in phreatic groundwater in the WesternKalahari. J. Hydrol. 67, 249–259.
Heaton, T.H.E., Talma, A.S., Vogel, J.C., 1983. Origin and history of nitrate in confinedgroundwater in the Western Kalahari. J. Hydrol. 62, 243–262.
IAEA/WMO, 2006. Global Network of Isotopes in Precipitation. The GNIP Database.<http://isohis.iaea.org>.
Ingerson, E., Pearson, F.J., 1964. Estimation of age and rate of motion of groundwaterby the 14C-method. In: Miyake, Y., Koyama, T. (Eds.), Recent Researches in theFields of Hydrosphere, Atmosphere and Nuclear Geochemistry. Nagoya WaterResearch Laboratory, Tokyo, pp. 263–283.
Kendall, C., McDonnell, J.J., 1998. Isotope Tracers in Catchment Hydrology. Elsevier,Amsterdam. pp. 839.
Kipfer, R., Aeschbach-Hertig, W., Peeters, F., Stute, M., 2002. Noble gases in lakes andground waters. In: Porcelli, D.P., Ballentine, C.J., Wieler, R. (Eds.), Noble gases ingeochemistry and cosmochemistry, vol. 47. Reviews in Mineralogy andGeochemistry, pp. 615–700.
Knöller, K., Trettin, R., 2003. Isotopenanalytische Bewertung des Sulfathaushaltes inlandwirtschaftlich genutzten Wassergewinnungsgebieten. UFZ Bericht 16/2003, ISSN 0948-9452. pp. 157.
Kulongowski, J.T., Hilton, D.R., Selaolo, E.T., 2004. Climate variability in theBotswana Kalahari from the late Pleistocene to the present day. Geophys. Res.Lett. 31 (L10204), 1–5.
Lehmann, B.E., Love, A., Purtschert, R., Collon, P., Loosli, H.H., Kutschera, W., Beyerle,U., Aeschbach-Hertig, W., Kipfer, R., Frape, S.K., Herczeg, A., Moran, J., Tolstikhin,N.I., Gröning, M., 2003. A comparison of groundwater dating with 81Kr, 36Cl and4He in four wells of the Great Artesian Basin, Australia. Earth Planet. Sci. Lett.211, 237–250.
Lubczynski, M.W., 2000. Groundwater Evapotranspiration – UnderestimatedComponent of Groundwater Balance in a Semi-arid Environment – SeroweCase, Botswana. Groundwater: Past Achievements and future challenges.Balkema, Rotterdam. pp. 199–204.
Maßmann, J., 2004. Simulation der Nitratverteilung in einem klüftig-porösenGrundwasserleiter in Botswana. MSc Thesis, University of Hannover, Germany.
Mazor, E., Verhagen, B.Th., Sellschop, J.P.F., Jones, M.T., Robins, N.E., Hutton, L.G.,Jennings, C.H.M., 1977. Hydrologic, isotopic and chemical studies at Orapa,Botswana. J. Hydrol. 34, 203–234.
Mook, W.G. (Ed.), 2001. UNESCO/IAEA Series on Environmental Isotopes in theHydrological Cycle. Principles and Applications. <http://www.iaea.org/programmes/ripc/ih/volumes/volumes.htm>.
Mphinyane, W.N., 2001. Influence of Livestock Grazing within Piospheres underFree Range and Controlled Conditions in Botswana. PhD Thesis, Department ofPlant Production and Soil Science, Faculty of Natural and Agricultural Sciences,University of Pretoria, South Africa.
Obakeng, O. T., 2007. Soil Moisture Dynamics and Evapotranspiration at the Fringeof the Botswana Kalahari, with Emphasis on Deep Rooting Vegetation. PhDthesis, Vrije Universiteit, Amsterdam, The Netherlands. pp. 225.
Osenbrück, K., Lippmann, J., Sonntag, C., 1998. Dating very old pore water inimpermeable rocks by noble gas isotopes. Geochim. Cosmochim. Acta 62 (18),3041–3045.
Osenbrück, K., Stadler, S., Himmelsbach, T., Sültenfuß, J., Suckow, A.O., Hötzl, H.,Weise, S.M., 2009. Impact of recharge variations on water quality as indicatedby excess air in groundwater of the Kalahari, Botswana. Geochim. Cosmochim.Acta 73, 911–922.
Plummer, L.N., Prestemon, E.C., Parkhurst, D.L., 1991. NETPATH, an Interactive Codefor Modeling NET Geochemical Reactions along a Flow Path. USGS Water-Resources Investigation Report 91-4078.
Rahube, T.B., 2003. Recharge and Groundwater Resources Evaluation of theLokalane-Ncojane Basin (Botswana) Using Numerical Modelling. MSc Thesis,International Institue for Geo-Information Science and Earth Observation.Enschede, The Netherlands.
S. Stadler et al. / Journal of Hydrology 388 (2010) 291–303 303
Ringrose, S., Vanderpost, C., Matheson, W., 1998. Analysis of soil organic carbon andvegetation cover trends along the Botswana Kalahari transect. J. Arid Environ.38 (3), 379–396.
Schwiede, M., 2007. Stickstoffhaushalt und Nitratauswaschung sandiger Böden dersemiariden Kalahari, Botswana. PhD thesis, University of Hannover, Germany,pp. 285.
Schwiede, M., Duijnisveld, W.H.M., Böttcher, J., 2005. Investigation of processesleading to nitrate enrichment in soils in the Kalahari Region, Botswana. Phys.Chem. Earth 30, 712–716.
Selaolo, E.D., 1998. Tracer Studies and Groundwater Recharge Assessment in theEastern Fringe of the Botswana Kalahari. The Lethlakeng – Botlhapatlou Area.PhD Thesis, Vrije Universiteit te Amsterdam (ISBN 99912-9-3), TheNetherlands. pp. 228.
SGAB (Swedish Geological Survey), 1988. Serowe – Groundwater ResourcesEvaluation Project. Internal Report. DGS-Botswana, Lobatse.
Stadler, S., 2005. Investigation of Natural Processes Leading to Nitrate Enrichment inAquifers of Semi-arid Regions. PhD thesis, Karlsruhe University, Germany. pp.238. <http://digbib.ubka.uni-karlsruhe.de/volltexte/1000004372>.
Stadler, S., Osenbrück, K., Knöller, K., Suckow, A., Sültenfuss, J., Oster, H.,Himmelsbach, T., Hötzl, H., 2008. Understanding the origin and fate of nitratein groundwater of semi-arid environments. J. Arid Environ. 72, 1830–1842.
Stute M., Talma S., 1997. Glacial temperatures and moisture transport regimesreconstructed from noble gases and d18O, Stampriet aquifer, Namibia. In:Isotope Techniques in the Study of Environmental Change. IAEA, Vienna,Austria. pp. 307–320.
Stute, M., Sonntag, C., Deák, J., Schlosser, P., 1992. Helium in deep circulatinggroundwater in the Great Hungarian Plain: flow dynamics and crustal andmantle helium fluxes. Geochim. Cosmochim. Acta 56, 2051–2067.
Sültenfuß, J., Massmann, J., 2004. Datierung mit der 3He–Tritium-Methode amBeipiel der Uferfiltration im Oderbruch. Grundwasser 9 (4), 221–234.
Sültenfuß, J., Roether, W., Rhein, M., 2009. The Bremen mass spectrometric facilityfor the measurement of helium isotopes, neon, and tritium in water. IsotopesEnviron. Health Sci. 45 (2), 83–95.
Thomas, S.G., Shaw, P.A., 1991. The Kalahari Environment. Cambridge UniversityPress, Cambridge. pp. 284.
Thomas, D.S.G., Shaw, P.A., 2002. Late quaternary environmental change in centralsouthern Africa: new data, synthesis, issues and prospects. Quatern. Sci. Rev. 21,783–797.
Tyson, P.D., Preston-Whyte, R.A., 2000. The Weather and Climate of Southern Africa.Oxford University Press, Cape Town South Africa. pp. 408.
UN, 2003. Implementation of the United Nations Millennium Declaration. Report ofthe Secretary-General. <http://www.un.org/millenniumgoals/sgreport2003.pdf>58th session of the UN general assembly.
Verhagen, B.Th., 1990. Isotope hydrology of the Kalahari: recharge or no recharge?Paleoecology of Africa 21, 143–158.
Verhagen, B.Th., 1991. The isotope geohydrology of the Karoo Basin underlying theKalahari Thirstland, Southern Africa. In: Perth, W. (Ed.), Proceeding ofInternational Conference on Groundwater in Large Sedimentary Basins.Australian Water Resources Council, Cof. Series 20, Australia, July 2004. pp.390–402.
Verhagen, B.Th., 1992. Detailed geohydrology with environmental isotopes. A casestudy at Serowe, Botswana. In: Isotope Techniques in Water ResourcesDevelopment. pp. 345–362.
Verhagen, B.Th., 1995. Semiarid zone groundwater mineralization processes asrevealed by environmental isotope studies. In: Adar, E., Leibundgut, C. (Eds.),Application of Tracers in Arid Zone Hydrology, vol. 232. IAHS Publication, pp.245–266.
Verhagen, B.Th., Mazor, E., Sellschop, J.P.F., 1974. Radiocarbon and tritium evidencefor direct recharge to groundwaters in the Northern Kalahari. Nature 249, 643–644.
Vogel, J.C., 1970. Carbon-14 Dating of Groundwater. Isotope Hydrology. IAEA,Vienna. pp. 225–239.
Vogel, J.C., Talma, A. S., Heaton, T.H.E., 1982. The Age and Isotopic Composition ofGroundwater in the Stampriet Artesian Basin, SWA. Internal Report: CSIRNational Physical Research Laboratory Project No. 400/90615.
Wang, L., D’Odorico, P., Ringrose, S., Coetzee, S., Macko, S.A., 2007. Biogeochemistryof Kalahari sands. J. Arid Environ. 71 (3), 259–279.
Weise, S.M., Moser, H., 1987. Groundwater Dating with Helium Isotopes. In: Iso-tope Techniques in Water Resources Development. IAEA, Vienna, pp. 105–126).
Wellfield (Wellfield Consulting Services), 2000. Serowe Wellfield 2 ExtensionProject (TB10/3/10/95-96). Final Report. Internal Report for the Ministry ofMinerals, Energy and Water Affairs, Department of Water Affairs, Botswana.
Yurtsever, Y., Gat, J.R., 1981. Atmospheric Waters. In: Stable Isotope Hydrology.Technical Report Series No. 210. IAEA, Vienna. pp. 103–142.
Zhu, C., Murphy, W.M., 2000. On radiocarbon dating of ground water. Ground Water38 (6), 802–804.
Zoellmann, K., Kinzelbach, W., Fulda, C., 2001. Environmental tracer transport (3Hand SF6) in the saturated and unsaturated zones and its use in nitrate pollutionmanagement. J. Hydrol. 204, 187–205.