Embed Size (px)
Citation preview

GROUNDWATER EXPLORATION USING FUZZY LOGIC APPROACH IN GIS FOR AN
AREA AROUND AN ANTICLINE, FARS PROVINCE
S. Rafati a *, M. Nikeghbal b
a Dept. of Geography, Sayyed Jamaleddin Asadabadi University, Assadabad, Hamedan, Iran- [email protected] b Master of Geography, Tarbiat Modares University, Tehran, Iran- [email protected]
KEY WORDS: ground water, explore, fuzzy gamma, anticline
ABSTRACT:
In the recent years, the over-use of water resource due to the population growth and industrial developing has become serious. With
attention to demand for water, it's essential to explore and evaluate new water resource and mapping its potential. In this paper, a
fuzzy set theory, as a knowledge driven approach for map combination, was applied to produce a potential map for ground water
resources. To achieve this objective, a variety of spatial data including geology, slope, elevation, drainage, fault and joint were
complied. Then fuzzy membership functions were evaluated for each data layer. These data were integrated using the fuzzy operator with a value of = 0.95. The final map indicates Quaternary formation consists of alluvial deposits near the 200 meter
distance from the anti-cline as a suitable area for groundwater resource. Finding out an accurate method which accelerates processing
for determining the location of groundwater before drilling is an effective solution leading to save budget and time.
* Corresponding author
1. INTRODUCTION
The total amount of water on Earth is 1.4 billion Km3, but only
around 41.000 km3 circulates through the hydrological cycle
(Acreman, 2000), falling as rain or snow, infiltrating into the
soil, flowing as rivers to the sea and evaporating. Only 2.5% of
the Earth's total water resources are freshwater, of which as
little as 0.5 % is directly usable; the rest being ice and glaciers
(UNEP, 2002). With the increasing demands for water due to
increasing population, urbanization and agricultural expansion,
groundwater resources are gaining much attention, particularly
in arid and semi-arid climatic zone, which faces acute shortages
of water throughout the year. A great part of Iran is
characterized as an arid and semi-arid region which
groundwater in most of these regions is the only water resource,
due to very unevenly spatially and temporally distribution of
water resource. Groundwater occurs beneath essentially every
spot on the Earth, finding usable supplies can be a challenge.
Groundwater exploration is an effective technique to
compensate the pressure result by lack of surface water in dry
climate zone. Exploration of water resource especially
underground is a complex set of collecting data, assessment of a
suitable methodology, analysis, examination and exploration
which needs highly cost supplements. Several studies have been
carried out for determination of most suitable area for ground
water resource by a variety of methods in the most arid of the
world such as artificial recharge (Krishnamurthy et al., 1995;
Han, 2003; Ghayoumian et al., 2007) the identification of
suitable sites for flood spreading as an artificial groundwater
recharge technique (Ghayoumian et al, 2005).
So finding out an accurate method which accelerates processing
for determining the location of groundwater before drilling is a
cost-effectiveness solution leading a greater part of budget to
the other sections of project. GIS application in water resource
evaluation has recently expanded with increasing emphasis in
surface and subsurface applications (Maidment, 1991; Moore et
al., 1991). GIS is a powerful tool to collect and store data,
processing and making an appropriate output which would be
useful to manage time and cost in most of projects. There are
many types of GIS model such as Boolean Logic, Index
Overlay, Fuzzy Logic and , … that related to the purpose of the
project can be used effectively . Because of imprecise and
uncertainly, ambiguous data or relationships among data sets,
fuzzy logic and fuzzy sets have been applied in a wide range of
ecological and environmental issues, including environmental
impact evaluation (Enea et al., 2001), prediction and modeling
of soil erosion (Nisar et al., 2000; Mitra et al., 1998), crop-land
suitability (Nisar et al., 2000), assessing spatial and temporal
change of salinity (Metternicht., 2001), modeling of time-series
of atmospheric pollution (Nunnari et al.,1998), modeling the
spatial distribution and species density of vegetation
(Kampichler et al., 2000), spatial prediction of landslide hazard
(Gorsevski et al., 2003), and mineral exploration (Zadeh, 1965).
Many of the fuzzy expert systems discussed in these work to
integrate scientific and local knowledge expert about the
phenomenon. In fuzzy logic, fuzzy quantifiers such as "likely"
and "usually" are treated as fuzzy numbers that represent
imprecisely, the absolute or relative count of elements in a fuzzy
set (Tangestani et al., 2003). Fuzzy logic was chosen in this
research because of its qualification rather than the Boolean
logic.
2. STUDY AREA
The study area is the region around an anti-cline which located
in the 15 kilometer of southeast of Haji Abad city in the Fars
province. The area is bounded by latitude 27°55' to 28°25' N
and longitude 54°24' to 55°20'E, as shown in Figure 1. It has an
arid and semi-arid climate with annual rainfall less than 250 mm
while the evaporation is more than 2600 mm. Mean temperature
The International Archives of the Photogrammetry, Remote Sensing and Spatial Information Sciences, Volume XLII-4/W4, 2017 Tehran's Joint ISPRS Conferences of GI Research, SMPR and EOEC 2017, 7–10 October 2017, Tehran, Iran
This contribution has been peer-reviewed. https://doi.org/10.5194/isprs-archives-XLII-4-W4-441-2017 | © Authors 2017. CC BY 4.0 License. 441

is about 21-24 °C. The anti-cline axis lies in the Zagros Folded
Belt with a NW-SE trend. Most of the area is occupied by
Quaternary alluvial deposits. The mountains to the north are
formed mainly of Jahrum formation and the mountains around
the anti-cline formed of resistant formation of Asmari-Jahrum.
Figure1. Geographical location of study area
3. METHODS
3.1 Fuzzy system
The main purpose of this research is exploration of groundwater
resource using fuzzy logic approach. A fuzzy system is
composed of three primary elements namely fuzzy sets, fuzzy
membership and fuzzy production rules (Klein, 1999). The
fuzzy set theory was introduced by Zadeh (1965), which
facilities analysis of non-discrete natural processes or
phenomena as mathematical formula (Zimmermann, 1996). It
consists of objects and their respective grades of membership in
this set. The membership grade of an object is range between 0
and 1 (Assimakopoulos et al., 2003). A fuzzy subset A of X is
characterized by a membership function 1,0:
,
which associates with each element x of X a number
representing the grade of membership of x in A. The value of 1
denotes full membership and the closer the value is to 0 the
weaker is the object’s membership in the fuzzy set (Kollias et
al., 1998). Each data layer denoted from fuzzy theory can be
integrated by using fuzzy operators. In a combination of two
membership functions
and
, some useful fuzzy
sets operators can be used such as union (And), intersection
(Or), product, complement (Not), power and join (weighted
sum). Production rules represent human knowledge in the form
of ‘if–then’ logical statements. However, expert systems rely on
binary logic and probability to develop the inferences used in
the production rules. Fuzzy sets allow incorporating vagueness
into the production rules since they represent less precise
linguistic terms. The logical processing using fuzzy sets is
known as fuzzy logic (Klein, 1999).
3.2 DATA
Data is a necessity in the all projects, so we process 3 steps
relevant to objective of study, consists of spatial data base
building, data processing, data integration in the first steps of
project.
3.2.1 Spatial data building
Evaluation and exploration for water resource is the primary
purpose of this study. The important step in the most GIS
project is building spatial data base. To do so, we compiled and
collected data layers from various source, relating to projects
purpose. The primary data layers were generated based on the
topographic maps with scale 1:25000 produced by the National
Cadastre Centre of Iran to build up a DEM (Digital Elevation
Model), and Geological data derived from a geological map of
area, complied by National Geological organization at the scale
of 1:100000. Slope steepness was calculated of a raster grid cell
of 50×50 m based on the DEM. the slopes were re-classified in
to 8 categorizes (Fig.2). Also, the built DEM were used to
generate Elevation range with 100 meter intervals. The
elevation range was re-classified into 5 categories. As figure1
shows in the area elevation verified from 500 meter mostly in
the southeast to 2500 meter in the northeast. Drainage layer was
derived from the topographic maps which was used to generate
drainage density (Fig.3) and classified into 8 ranging from less
than 1 km/ km2 to more than 8 km/ km2 density. As it can be
shown in the figure 4 most of the area around the anti-cline has
less than 2 km/ km2 density and only a small area has 7-8 km/
km2 density. The geological map of study area was digit and the
lithological units generated as a formation layer. The fracture
and fault have been prepared by digitizing paper based on a
1:100,000 map of geology (Fig 4). The fracture layer was used
to create separate buffers with 200 meter interval distance from
the major fractures and faults (Fig 5).
Figure 2. Slope map of study area
Figure 3. Drainage density of study area
The International Archives of the Photogrammetry, Remote Sensing and Spatial Information Sciences, Volume XLII-4/W4, 2017 Tehran's Joint ISPRS Conferences of GI Research, SMPR and EOEC 2017, 7–10 October 2017, Tehran, Iran
This contribution has been peer-reviewed. https://doi.org/10.5194/isprs-archives-XLII-4-W4-441-2017 | © Authors 2017. CC BY 4.0 License.
442
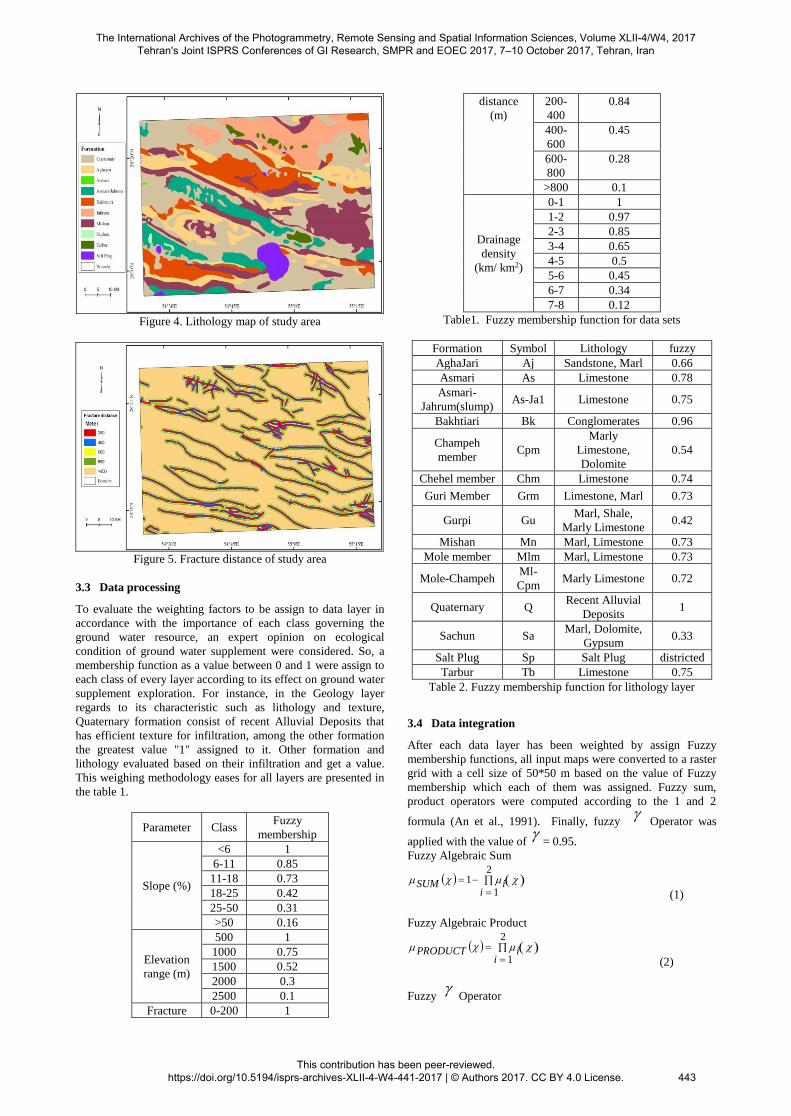
Figure 4. Lithology map of study area
Figure 5. Fracture distance of study area
3.3 Data processing
To evaluate the weighting factors to be assign to data layer in
accordance with the importance of each class governing the
ground water resource, an expert opinion on ecological
condition of ground water supplement were considered. So, a
membership function as a value between 0 and 1 were assign to
each class of every layer according to its effect on ground water
supplement exploration. For instance, in the Geology layer
regards to its characteristic such as lithology and texture,
Quaternary formation consist of recent Alluvial Deposits that
has efficient texture for infiltration, among the other formation
the greatest value "1" assigned to it. Other formation and
lithology evaluated based on their infiltration and get a value.
This weighing methodology eases for all layers are presented in
the table 1.
Parameter Class Fuzzy
membership
Slope (%)
<6 1
6-11 0.85
11-18 0.73
18-25 0.42
25-50 0.31
>50 0.16
Elevation
range (m)
500 1
1000 0.75
1500 0.52
2000 0.3
2500 0.1
Fracture 0-200 1
distance
(m)
200-
400
0.84
400-
600
0.45
600-
800
0.28
>800 0.1
Drainage
density
(km/ km2)
0-1 1
1-2 0.97
2-3 0.85
3-4 0.65
4-5 0.5
5-6 0.45
6-7 0.34
7-8 0.12
Table1. Fuzzy membership function for data sets
Formation Symbol Lithology fuzzy
AghaJari Aj Sandstone, Marl 0.66
Asmari As Limestone 0.78
Asmari-
Jahrum(slump) As-Ja1 Limestone 0.75
Bakhtiari Bk Conglomerates 0.96
Champeh
member Cpm
Marly
Limestone,
Dolomite
0.54
Chehel member Chm Limestone 0.74
Guri Member Grm Limestone, Marl 0.73
Gurpi Gu Marl, Shale,
Marly Limestone 0.42
Mishan Mn Marl, Limestone 0.73
Mole member Mlm Marl, Limestone 0.73
Mole-Champeh Ml-
Cpm Marly Limestone 0.72
Quaternary Q Recent Alluvial
Deposits 1
Sachun Sa Marl, Dolomite,
Gypsum 0.33
Salt Plug Sp Salt Plug districted
Tarbur Tb Limestone 0.75
Table 2. Fuzzy membership function for lithology layer
3.4 Data integration
After each data layer has been weighted by assign Fuzzy
membership functions, all input maps were converted to a raster
grid with a cell size of 50*50 m based on the value of Fuzzy
membership which each of them was assigned. Fuzzy sum,
product operators were computed according to the 1 and 2
formula (An et al., 1991). Finally, fuzzy
Operator was
applied with the value of
= 0.95.
Fuzzy Algebraic Sum
2
1
1
iiSUM
(1)
Fuzzy Algebraic Product
2
1iiPRODUCT
(2)
Fuzzy
Operator
The International Archives of the Photogrammetry, Remote Sensing and Spatial Information Sciences, Volume XLII-4/W4, 2017 Tehran's Joint ISPRS Conferences of GI Research, SMPR and EOEC 2017, 7–10 October 2017, Tehran, Iran
This contribution has been peer-reviewed. https://doi.org/10.5194/isprs-archives-XLII-4-W4-441-2017 | © Authors 2017. CC BY 4.0 License.
443

PRODUCTSUM
1
(3)
By using the fuzzy operator “OR and AND”, only one of the
contributing fuzzy sets has effect on the resultant value. The
fuzzy algebraic sum and product operators make the resultant
set larger than or equal to the maximum value and smaller than,
or equal to the minimum value among all fuzzy sets.
Meanwhile, the resultant set that is combined by the fuzzy
operator has the value between that of the fuzzy algebraic
product and the fuzzy algebraic sum operator.
4. CONCLUSIONS
In this paper, Fuzzy logic approach was used in a suitable
combination of slope, elevation range, drainage density, fracture
distance and lithology layers to ground water exploration. To
combine various spatial data, we applied fuzzy product and sum
operators. Also, the fuzzy
operator with the value of
=
0.95 was tested. Figure 6 shows fuzzy map of ground water
exploration. Result indicated that most of the nearest area to
anticline has very high, high and moderate potential especially
in the SE direction. Further results show, the most appropriate
area to drilling is the region with Quaternary formation which is
approximately, in the 200 m from the anti-cline. Very high
potential area, generally, are found in the land with less than 4%
slope and less than 400 meter from sea level. In verse, very low
potential area are characterize by harder lithology such as
Dolomite, Gypsum which covers land with more than 30%.
Finding out an accurate method which accelerates processing
for determining the location of groundwater before drilling is an
effective solution leading to save budget and time. In this paper,
we conducted a fuzzy set theory, as a knowledge driven
approach for map combination using the fuzzy
operator with
a value of95.0
. The final results indicate the most
suitable formation for drilling.
Figure 6. Groundwater potential map using fuzzy logic
approach
REFERENCES
Acreman, M., 2000. Wetlands and Hydrology, Conservation of
Mediterranean Wetlands, 10. Tour du Valat, Arles (France).
An, P., Moon, W.M., Rencz, A., 1991. Application of fuzzy set
theory to integrated mineral exploration. Canadian Journal of
Exploration Geophysics, 27(1), pp.1-11
Assimakopoulos, J.H., Kalivas, D.P., Kollias, V.J., 2003. A
GIS-based fuzzy classification for mapping the agricultural soils
for N-fertilizers use, The Science of the Total Environment, 309,
pp. 19–33.
Enea, M. & Salemi, G., 2001. Fuzzy approach to the
environmental impact evaluation, Ecological Modelling. 136,
pp. 131–147.
Ghayoumian, J., Ghermezcheshmeh, B., Feiznia, S., Noroozi,
A.A., 2007. Application of GIS techniques to determine areas
most suitable for artificial groundwater recharge in a coastal
aquifer in southern Iran, Journal of Asian Earth Sciences, 30,
pp. 364–374.
Ghayoumian, J., Ghermezcheshmeh, B., Feiznia, S., Noroozi,
A.A., 2005. Integrating GIS and DSS for identification of
suitable areas for artificial recharge, case study Meimeh Basin,
Isfahan, Iran. Environmental Geology, 47 (4), pp. 493–500.
Gorsevski, Pece V., Gessler, Paul E., Jankowski, P., 2003.
Integrating a fuzzy k-means classification and a Bayesian
approach for spatial prediction of landslide hazard. Journal of
Geographic System, 5, pp. 223–251.
Han, Z., 2003.Groundwater resources protection and aquifer
recovery in China. Environmental Geology, 44(1), pp.106–111.
Kampichler, C. & Barthel, J. & Wieland, R., 2000. Species
density of foliage-dwelling spiders in field margins: a simple,
fuzzy rule-based model. Ecological Modelling, 129, pp. 87–99.
Klein, L., 1999. Sensor and Data Fusion Concepts and
Applications. SPIE Optical Engineering Press, Bellingham,
Washington.
Kollias, V.J., D.P., Kollias, 1998. The enhancement of a
commercial geographical information system (ARC: INFO)
with fuzzy processing capabilities for the evaluation of land
resources, Computers and Electronics in Agriculture, 20, pp.
79–95.
Krishnamurthy, J., Srinivas, G., 1995. Role of geological and
geomorphological factors in groundwater exploration: a study
using IRS LISS data. International Journal of Remote Sensing,
16 (14), pp. 2595–2618.
Maidment, D. R., GIS and Hydrologic Modelling, 1991. The
First International Conference/Workshop on Integrating
Geographic Information Systems and Environmental
Modelling. Boulder, CO.
Metternicht, G., 2001. Assessing temporal and spatial changes
of salinity using fuzzy logic, remote sensing and GIS.
Foundations of an expert system. Ecological Modelling, 144,
pp. 163–179.
The International Archives of the Photogrammetry, Remote Sensing and Spatial Information Sciences, Volume XLII-4/W4, 2017 Tehran's Joint ISPRS Conferences of GI Research, SMPR and EOEC 2017, 7–10 October 2017, Tehran, Iran
This contribution has been peer-reviewed. https://doi.org/10.5194/isprs-archives-XLII-4-W4-441-2017 | © Authors 2017. CC BY 4.0 License.
444
Mitra, B., Scott, H.D., Dixon, J.C., McKimmey, J.M., 1998.
Applications of fuzzy logic to the prediction of soil erosion in a
large watershed. Geoderma, 86, pp. 183–209.
Moore, I. D., Turner, A. K., Wilson, J. P., Jenson, S. K., Band,
L. E. GIS and Land Surface-Subsurface Process Modelling,
(1991). The First International Conference/Workshop on
Integrating Geographic Information Systems and
Environmental Modelling. Boulder, CO.
Nisar Ahamed, T.R., Gopal Rao, K., Murthy, J.S.R., 2000.
Fuzzy class membership approach to soil erosion Modelling.
Agricultural Systems, 63, pp. 97-110.
Nisar Ahamed, T.R., Gopal Rao, K., Murthy, J.S.R., 2000. GIS-
based fuzzy membership model for crop-land suitability
analysis. Agricultural Systems, 63, pp. 75-95.
Nunnari, G. & Nucifora, A. & Randieri, C., 1998. The
application of neural techniques to the modelling of time-series
of atmospheric pollution data. Ecological Modelling, 111, pp.
187–205.
Tangestani, M.H., Moore, F., 2003. Mapping porphyry copper
potential with a fuzzy model, northern Shahr-e-Babak, Iran,
Australian Journal of Earth Science, 50, pp. 311-317.
UNEP, 2002. Global Environmental Outlook 3, Nairobi, Kenya.
Zadeh, L., 1965. Fuzzy sets. Information and Control, 8, pp.
338–353.
Zimmermann, H.J., 1996. Fuzzy set theory and its applications.
Kluwer Academic Publisher.
The International Archives of the Photogrammetry, Remote Sensing and Spatial Information Sciences, Volume XLII-4/W4, 2017 Tehran's Joint ISPRS Conferences of GI Research, SMPR and EOEC 2017, 7–10 October 2017, Tehran, Iran
This contribution has been peer-reviewed. https://doi.org/10.5194/isprs-archives-XLII-4-W4-441-2017 | © Authors 2017. CC BY 4.0 License. 445