Embed Size (px)
Citation preview

Groundwater biodiversity patterns in the LessinianMassif of northern Italy
DIANA M. P. GALASSI , FABIO STOCH, BARBARA FIASCA, TIZIANA DI LORENZO AND
ENRICO GATTONE
Dipartimento di Scienze Ambientali, University of L’Aquila, Italy
SUMMARY
1. The distribution patterns of stygobiotic invertebrates were examined with a stratified
sampling design at 197 sites selected among four hydrogeographic basins in the
Lessinian Massif (northern Italy). The sites were approximately evenly distributed among
four hydrogeological zones: unsaturated and saturated zone of karstic aquifers, and
hyporheic and saturated zone of porous aquifers.
2. Outlying Mean Index (OMI) analysis which assesses deviation of habitat conditions
from reference conditions, was used to evaluate the importance of 14 selected environ-
mental variables in shaping groundwater biodiversity patterns in the region (total of 89
stygobiotic species). The measured variables explained 80% of the variability in the data
set.
3. Sampling sites were distributed along the environmental gradients defined by OMI
analysis. Significant differences were detected between karstic and porous site, as well
as among sites located in the four hydrogeological zones. Differences among the four
hydrogeographic basins were not observed.
4. Ordination of stygobiotic species along the environmental gradients was best explained
by historical variables (mainly Wurmian glaciation and age of the underlying geological
formation), while variables related to hydrogeology (mainly pH, calcium concentration
and habitat fragmentation) influenced species distributions in the hydrogeological zones.
An Environmental Integrity Index and nitrate concentration were significantly correlated
with altitude, but appeared not to play a significant role in determining stygobiotic
biodiversity patterns at the regional scale.
5. Results of the OMI analysis were highly significant for all taxa, suggesting that
stygobiotic species are sensitive to the environmental factors studied. Thirty-five species
showed high habitat specialization (OMI index > 10). These species were usually rare and
endemic to the Lessinian Massif. Most of them were found in a single hydrogeological
zone.
6. Quaternary glaciations appear not to have lowered stygobiotic species richness in the
Lessinian Massif. This may be because of the marginal location of the region with
respect to the Wurmian glacier limit and because of extensive networks of fractures in
the vadose zone of the karst, which may have allowed stygobionts to move deep down
in the aquifers to seek refuge during surface freezing and to recolonise ancestral habitats
after the glaciers retreated.
Keywords: biogeography, ecology, ground water, Italy, stygobionts
Correspondence: Diana M. P. Galassi, Dipartimento di Scienze Ambientali, University of L’Aquila, L’Aquila, Italy.
E-mail: [email protected]
Freshwater Biology (2009) 54, 830–847 doi:10.1111/j.1365-2427.2009.02203.x
830 � 2009 Blackwell Publishing Ltd

Introduction
Despite great strides in recent years, the true dimen-
sion of groundwater biodiversity is largely underes-
timated and the distribution of groundwater species
at various spatial scales remains only sketchily
understood (Gibert & Deharveng, 2002; Culver,
2005). This situation stems from the still highly
fragmentary knowledge of groundwater biodiversity
as a whole, compared to the biodiversity of surface
waters, and specifically from the limited number of
studies that have analysed the partitioning of ground-
water biodiversity at different spatial scales (Gibert
et al., 1994a,b, 2000; Ferreira et al., 2005; Dole-Olivier
et al., 2009b; Martin et al., 2009).
It is widely recognised that both contemporary
ecological events and historical contingencies
resulting from evolutionary processes shape
biodiversity patterns in different environments (Stoch,
1995; Drake et al., 1996; Galassi, 2001; Moritz et al.,
2001; Whittaker, Willis & Field, 2001; Gibert &
Deharveng, 2002; Moritz, 2002; Colwell, Rahbek &
Gotelli, 2004). However, it is far from being
understood how these factors interact to control
present species diversity and distributions and,
consequently, composition of groundwater assem-
blages. Spatial patterns of biodiversity have mainly
been interpreted from an ecological perspective. Only
occasionally has the role of historical events been
taken into account, and in most of those cases, only
narrative explanations have been proposed to
elucidate the role of historical factors in determining
species diversity and distributions (Rundle et al., 2002;
Castellarini et al., 2005; Hahn & Fuchs, 2005;
Martin et al., 2005). Approaches that account for
both past events and current constraints are complex,
however, because of possible interactions among a
range of variables, which may obscure the influence of
individual factors in shaping species assemblages.
This paper examines regional patterns of ground-
water biodiversity from both an ecological and
historical perspective. Its aims are: (i) to determine
the relative importance of various environmental
descriptors of species distribution patterns in a region;
(ii) to define habitat preferences of groundwater
species and characteristic species assemblages along
environmental gradients and (iii) to identify the main
historical and ecological variables shaping ground-
water biodiversity patterns at different spatial scales
within the region.
Methods
Study area
The study was carried out in the Lessinian Massif,
which is one of six European regions chosen for
assessing groundwater biodiversity in the PASCALIS
project (Gibert, 2001). The region is located in the
southernmost part of the Venetian pre-Alps in northern
Italy (Fig. 1). The rocky massif of 691 km2 emerged in
the Oligocene, 25–24 million years BP (Boccaletti et al.,
1990). It extends southward in divergent finger-like
ridges that reach the alluvial plain of the River Adige
with a mean slope of 10%. The aquifer discharges on
average about 50 m3 s)1: 15 m3 s)1 through alluvial
deposits, 30 m3 s)1 through stream beds and 5 m3 s)1
through a spring system (Montorio). The ground water
flows from north-west to south-east. The main outlets
are located along the boundaries of the alluvial plain of
the River Adige, where limestone comes in contact with
Quaternary alluvial sediments (Patrizi et al., 2001). The
hydrological regime of the Lessinian Massif is mostly
governed by meteorological events. Infiltrating rainfall
tends to flow vertically through the vadose zone of the
karstic massif and reaches the deep saturated aquifers
in a few hours to a maximum of a few days through an
extended network of large and small fractures in the
limestone strata. The drainage network consists of
tributaries of the River Adige, flowing southward along
narrow steep valleys. Streams are often temporary and
predominantly fed by rainfall, to a lesser extent by
ground water.
The geological structure of the massif is dominated
by carbonate rocks of Cretaceous and Jurassic ages in
the northern part. The basement is represented by a
1000-m deep dolomite stratum, covered by several
limestone banks of different origin, reaching a thick-
ness of about 550 m. Eocene limestone is primarily
located in the southern part of the massif, while
outcrops of volcanic rocks, mainly basaltic, are located
in the eastern part. Quaternary alluvial deposits,
covering the limestone basement, fill the smaller
valleys, as well as the broad Adige plain, where
thickness of the alluvial sediments ranges from 100 to
200 m (Patrizi et al., 2001).
Groundwater biodiversity in the Lessinian Massif 831
� 2009 Blackwell Publishing Ltd, Freshwater Biology, 54, 830–847

Sampling
The stratified sampling approach used in the study
area followed the standard protocol of the PASCALIS
project, designed to capture most of the environmen-
tal heterogeneity at different spatial scales (Dole-
Olivier et al., 2009a). Four spatial scales were defined:
(i) region (Lessinian Massif); (ii) hydrogeographic
basin (four basins: Progno di Fumane, 43 km2; Progno
di Valpantena, 154 km2; Vaio di Squaranto, 94 km2;
Alpone-Tramigna, 137 km2); (iii) aquifer type (karstic
and porous) and (iv) hydrogeological zone (unsatu-
rated and saturated zone of karstic aquifers, and
hyporheic and saturated zone of porous aquifers). A
total of 197 sites were approximately evenly distrib-
uted among the four hydrogeological zones in the
four basins (Fig. 1). Caves were sampled in the
unsaturated (vadose) zone of karstic aquifers (Ku),
springs and wells in the saturated zone of karstic
aquifers (Ks), interstitial habitats in the hyporheic zone
of porous aquifers (Ph), and wells in the saturated
zone of porous aquifers (Ps).
Fourteen environmental variables were chosen as
environmental descriptors of stygobiotic species dis-
tribution in the region and measured at each site: (i)
altitude, determined with a geographic positioning
system (GPS III Plus�; Garmin (Europe) Ltd, South-
ampton, U.K.) and verified on topographic maps; (ii)
temperature; (iii) specific conductivity at 25 �C; (iv)
dissolved oxygen concentration and (v) pH, measured
in the field with a multiparametric probe (ECM
Multi�; Dr Lange GmbH, Dusseldorf, Germany); (vi)
calcium concentration, measured by a titrimetric
method with EDTA; (vii) magnesium concentration,
obtained by difference between total hardness and
calcium hardness; (viii) nitrate and (ix) phosphate
Fig. 1 Map of the Lessinian Massif of northern Italy showing the distribution of sampling sites.
832 D. M. P. Galassi et al.
� 2009 Blackwell Publishing Ltd, Freshwater Biology, 54, 830–847

concentrations, measured spectrophotometrically
(HACH DR 2000; Hach Co., Loveland, CO, U.S.A.)
with the cadmium reduction method and the ascorbic
acid method, respectively. Five additional environ-
mental variables were determined at each site: (x)
distance to the Wurmian glacier border on
palaeogeographic maps (Sauro, 1973); (xi) an
Environmental Integrity Index according to the
CORINE Land Cover classification (CLC; CEC,
1994), available at the web site of the European
Environmental Agency (http://www.eea.europa.eu);
(xii) age of the underlying geological formation
(hereafter called geological age); (xiii) degree of
habitat fragmentation and (xix) degree of hydrological
isolation from the surface. The Environmental
Integrity Index was developed by first defining the
extent of the area of interest, assessed in different
ways depending on the hydrogeological features of
each sampling site: (i) for springs, the catchment area;
(ii) for cave streams, the functional catchment area of
the river, and for the vadose habitats, a surface area
corresponding to the extension of the underlying
karstic vadose zone; (iii) for hyporheic sites, a strip 50-
m wide along the river banks from the sampling site
to the source; (iv) for wells, a circular surface (200 m
diameter) around the well. In a second step, the per
cent land surface area occupied by the dominant CLC
category was assessed. The nominal variables no.
xi–xiv were scored according to the criteria described
in Table 1.
Table 1 Basic criteria used for the physiographic description of sampling sites in the Lessinian Massif
Score
Environmental integrity index*
3. Forests and semi-natural areas
3.1. Forests 5
3.2. Shrub and ⁄ or herbaceous vegetation 4
2. Agricultural lands
2.3. Pasture 3
2.4. Heterogeneous agricultural areas 3
2.1. Arable land 2
2.2 Permanent crops 2
1. Artificial surfaces 1
Geological age
Jurassic limestone 4
Cretaceous limestone 3
Eocene limestone 2
Quaternary sediments 1
Habitat fragmentation
Rimstone pool or trickle 4
Saturated karst 3
Phreatic groundwater in unconsolidated sediments or spring 2
Subterranean river or hyporheic habitat 1
Hydrological isolation from the surface**
Porous
Thickness of unsaturated zone Recharge by the river Permeability (m s)1)
>10 m >10)6 3
5–10 m No 10)4 2
<5 m Yes <10)3 1
Karstic
Karstification level Distance to the surface Type of karst
Low >100 m 3
Medium 10–100 m Binary 2
High <10 m Unitary 1
*Nomenclature and scoring follow the standard CORINE land cover classification (CEC, 1994).
**The final score is obtained by the sum of the values assigned to each parameter measured for porous and karstic sites,
respectively.
Groundwater biodiversity in the Lessinian Massif 833
� 2009 Blackwell Publishing Ltd, Freshwater Biology, 54, 830–847

Faunal samples were taken and treated according to
a standardised protocol (Malard et al., 2002), using a
range of sampling methods and devices. Vadose
waters dropping from cave ceilings were filtered
using a plankton net (60-lm mesh size) and a funnel.
Rimstone pools, trickles and temporary streams in
caves were sampled with small hand pumps or by
sieving sediments through a hand net (60-lm mesh
size). Baited traps were used to collect predatory
amphipods from larger pools and siphons in caves.
Ground water from saturated karstic and porous
aquifers was sampled from wells (3–240 m depth)
equipped with pumps, and by sieving the water
(500 L) at the pump outlet with a hand net (60-lm
mesh size). In some cases, the saturated karst was
sampled using a hand net (60-lm mesh size, 25 cm in
diameter), positioned near the mouths of karstic
springs, by stirring the sediment upstream and
sieving the water immediately downstream of the
disturbed area. Hyporheic habitats were sampled
using a Bou-Rouch pump (Bou & Rouch, 1967) by
extracting and filtering 5 L of interstitial water and
sediments through a hand net (60-lm mesh size). Four
replicate samples were collected at a depth of 50 cm
below the stream bed at each site to cover microhabi-
tat heterogeneity. All faunal samples were preserved
in 4% formaldehyde solution. Invertebrates were
sorted, counted and identified, whenever possible to
species level.
Data analysis
Only stygobionts (i.e. obligate groundwater species)
were retained for statistical analyses. Since faunal data
were not quantitative because of difference in the
sampling methods adopted for different habitats, they
were analysed on the basis of presence or absence at a
given site. Relationships between environmental
variables and the composition of stygobiotic assem-
blages were investigated by means of Outlying Mean
Index (OMI) analysis (Doledec, Chessel & Gimaret-
Carpentier, 2000) using the ADEADE-4 software
(Thioulouse et al., 1997). OMI analysis decomposes
the inertia associated with the distribution of a species
into three terms: (i) the OMI, which measures species
marginality (i.e. habitat deviation from a reference
condition corresponding to a species uniformly
distributed along a given environmental gradient);
(ii) tolerance, which corresponds to the dispersion of
sampling sites containing a species along an environ-
mental gradient (i.e. habitat breadth of the species) and
(iii) residual tolerance, which represents the proportion
of variability in the habitat not explained by the
measured environmental variables (Doledec et al.,
2000). The higher the OMI index of a species, the
higher its habitat specialization. Monte-Carlo permu-
tation tests were used to assess statistical significance
of the marginality of each taxon. OMI analysis was also
used for the ordination of environmental variables,
species and sites, where species are positioned along
an environmental gradient based on their average
marginality.
Results
Environmental gradients
A summary of environmental characteristics at dif-
ferent spatial scales in the Lessinian Massif is given in
Table 2. The basins are all roughly north-to-south
oriented, and are defined by repeated longitudinal
environmental gradients. They share the same under-
lying geological formation of ancient Cretaceous and
Jurassic limestone upstream and recent Quaternary
alluvial deposits downstream. Similarly, the highest
anthropogenic pressures occur in the southernmost
part of all basins, whereas the northern parts charac-
terised by forests and semi-natural areas are much
less affected. Mean values of the Environmental
Integrity Index were very similar among the basins,
except for the Progno di Fumane basin, where most
sites are located in the northern, more natural area of
the Lessinian region. Karstic and porous aquifers
showed some differences in habitat fragmentation,
which was higher in karstic aquifers, especially in the
unsaturated karst (Tables 1 & 2).
Sites belonging to the unsaturated karst were gener-
ally characterised by the lowest temperatures
(mean ± SD: 10.1 ± 2.6 �C) and specific conductivities
(mean ± SD: 384 ± 99 lS cm)1), due to short residence
times in the ground of rainfall infiltrating at high
altitude. Most of these sites also experienced low
anthropogenic disturbance, as reflected in lower
nitrate concentrations (mean ± SD: 11.9 ± 8.3 mg L)1)
compared to saturated porous (mean ± SD: 29.7 ±
18.2 mg L)1) and karstic aquifers (mean ± SD: 20.7 ±
13.5 mg L)1). The hyporheic sites were characterised by
recent Quaternary alluvial deposits, high connectivity
834 D. M. P. Galassi et al.
� 2009 Blackwell Publishing Ltd, Freshwater Biology, 54, 830–847

to the surface, the lowest degree of habitat fragmenta-
tion (scores never exceeded the value of 1.0), and
intermediate scores of the Environmental Integrity
Index (mean ± SD: 2.8 ± 1.0). The saturated porous
and karstic aquifers had similar hydrochemistry,
differing from the other hydrogeological zones by
lower oxygen concentrations and higher specific
conductivity and calcium and nitrate concentrations.
The 197 sites sampled were arranged by OMI
analysis along an altitudinal gradient (first axis,
61.7% of total variation) defined by distance to the
Wurmian glacier border, altitude, environmental
integrity and temperature (Fig. 2a). Three additional
variables (magnesium, nitrate and dissolved oxygen
concentration) also contributed to defining the envi-
ronmental gradient, although to a lesser extent. These
ecological and historical factors separated the sites of
three hydrogeological zones along the first OMI axis,
i.e. saturated porous aquifers from saturated and
vadose karstic aquifers (Fig. 2b). The second axis
(18.3% of total variation) was primarily defined by
habitat fragmentation and pH, and secondarily by
calcium concentration and geological age. This gradi-
ent mainly separated hyporheic sites from the sites
located in other hydrogeological zones.
The centroid coordinates of the sites located in each
of the four hydrogeological zones were statistically
different from each other (Student’s t-test, P < 0.0001
after Bonferroni correction for all pair-wise compar-
isons). Conversely, sites grouped by hydrogeographic
basins were not distinguished, indicating no statisti-
cally significant differences between basins (t-test,
P > 0.28).
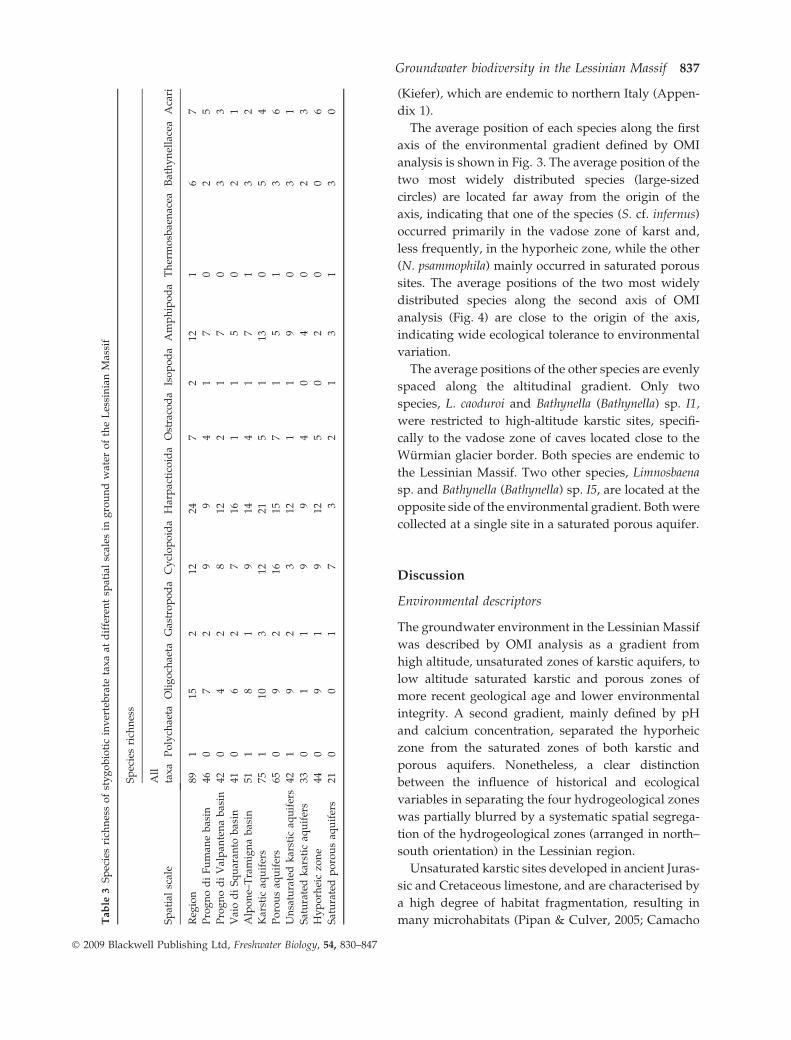
Species richness
A total of 89 stygobiotic species were identified in the
Lessinian region (Appendix 1). Over one-third of
them (35 species) are new to science. Most of these
were found for the first time during this survey, but a
few were already known from other aquifers in
northern Italy (F. Stoch, unpubl. data). Thirty-six
species have a distribution apparently restricted to the
Lessinian area, i.e. they are strict endemics, and
another 23 species appear to be endemic to small
karstic or alluvial areas in north-eastern Italy. The
highest stygobiotic species richness was found in
Copepoda, followed by Oligochaeta and Amphipoda
(Table 3). Species richness of the unsaturated karstTab
le2
Su
mm
ary
of
env
iro
nm
enta
lv
aria
ble
s(m
ean
±S
D)
mea
sure
dat
dif
fere
nt
spat
ial
scal
esin
gro
un
dw
ater
of
the
Les
sin
ian
Mas
sif
Sp
atia
lsc
ale
No.ofsites
Altitudeðma.s.l.Þ
pH
Specific
conductivity
ðlScm�1;25�CÞ
Temperature
ð�CÞ
Dissolvedoxygen
ðmgL�1Þ
Ca2þ
ðmgL�1Þ
Mg2þ
ðmgL�1Þ
NO�3
ðmgL�1Þ
PO3�4
ðmgL�1Þ
DistancetoW€urmianglacier
borderðkmÞ
EnvironmentalIntegrityIndex
Habitatfragmentation
Geologicalage
Hydrological
isolationfromthesurface
Reg
ion
197
323
±31
57.
4±
0.5
557
±20
513
.6±
3.4
6.6
±2.
154
±23
23±
1218
.8±
14.0
0.11
±0.
2015
.7±
9.4
2.8
±1.
12.
2±
1.1
1.9
±0.
94.
9±
1.4
Pro
gn
od
iF
um
ane
bas
in
4935
3±
210
7.3
±0.
458
6±
213
14.4
±3.
46.
7±
1.6
55±
2323
±13
18.4
±11
.40.
10±
0.23
8.8
±5.
33.
7±
1.1
2.2
±1.
11.
7±
0.8
4.9
±1.
4
Pro
gn
od
iV
alp
ante
na
bas
in
4939
1±
322
7.4
±0.
455
7±
242
13.4
±3.
07.
2±
1.7
60±
2418
±14
23.0
±16
.50.
12±
0.16
12.4
±8.
02.
7±
1.2
2.3
±1.
11.
9±
0.9
4.9
±1.
4
Vai
od
iS
qu
aran
tob
asin
5032
2±
414
7.3
±0.
449
4±
184
12.2
±3.
17.
2±
2.1
46±
1821
±9
16.5
±12
.90.
12±
0.25
17.7
±8.
52.
8±
0.9
2.2
±1.
12.
0±
1.0
5.0
±1.
0
Alp
on
e–T
ram
ign
ab
asin
4922
6±
259
7.5
±0.
559
5±
164
14.5
±3.
15.
1±
2.2
56±
2529
±10
17.3
±14
.20.
11±
0.13
23.8
±8.
22.
2±
1.0
2.1
±1.
12.
0±
1.0
4.6
±1.
6
Kar
stic
aqu
ifer
s10
147
0±
343
7.4
±0.
449
7±
173
12.0
±3.
16.
8±
1.9
55±
1818
±9
16.1
±11
.90.
08±
0.05
12.4
±8.
33.
2±
0.7
2.9
±1.
12.
7±
0.4
5.7
±1.
4
Po
rou
saq
uif
ers
9616
8±
184
7.4
±0.
562
1±
218
15.3
±2.
96.
3±
2.2
54±
2827
±13
21.7
±15
.40.
11±
0.16
19.1
±9.
42.
5±
1.1
1.5
±0.
51.
0±
0.0
4.0
±1.
0
Un
satu
rate
dk
arst
5369
2±
297
7.5
±0.
338
4±
9910
.1±
2.6
7.6
±1.
848
±12
15±
711
.9±
8.3
0.06
±0.
077.
3±
4.4
3.7
±1.
13.
1±
1.4
2.8
±0.
45.
1±
1.4
Sat
ura
ted
kar
st48
225
±18
97.
2±
0.4
622
±15
014
.1±
2.3
6.0
±1.
963
±20
22±
1020
.7±
13.5
0.20
±0.
3418
.1±
8.0
2.7
±0.
92.
7±
0.5
2.8
±0.
46.
5±
0.9
Hy
po
rhei
czo
ne
4825
4±
227
7.8
±0.
346
3±
6815
.2±
3.2
7.6
±1.
732
±12
23±
1113
.6±
4.5
0.12
±0.
3216
.4±
10.5
2.8
±1.
01.
0±
0.0
1.0
±0.
03.
9±
1.0
Sat
ura
ted
po
rou
s
aqu
ifer
s
4882
±39
6.9
±0.
377
9±
201
15.4
±2.
55.
0±
1.9
76±
2231
±14
29.7
±18
.20.
08±
0.06
21.8
±7.
22.
2±
0.8
2.0
±0.
01.
0±
0.0
4.0
±1.
0
Groundwater biodiversity in the Lessinian Massif 835
� 2009 Blackwell Publishing Ltd, Freshwater Biology, 54, 830–847

and hyporheic zone was higher than in the saturated
zones of karstic and porous aquifers, while the
number of species found in the four hydrogeographic
basins was similar (Table 3). Distributional rarity was
exceedingly high: no stygobionts were found in 29
sites (15% of all sites) and 27 species (30% of all
species) occurred in one site only. Even the two most
frequently occurring species, the copepods Nitocrella
psammophila Chappuis and Speocyclops cf. infernus
(Kiefer), were collected in only 27% of the sites.
Species–environment relationships
The first two axes of OMI analysis accounted for 80%
of the marginality of all taxa. The average marginality
of all taxa was highly significant (P < 0.00001; Monte-
Carlo permutation test on the whole data set),
suggesting a strong influence of environmental gra-
dients on the composition of stygobiotic assemblages
(Appendix 2). Thirty-nine species (44%) departed
significantly from a uniform distribution along the
environmental gradient (i.e. they had a statistically
significant marginality: P < 0.05; Monte-Carlo permu-
tation test).
The high deviations (OMI index > 10) shown by 35
species indicate high habitat specialization. Almost all
of these species were found in one of the four
hydrogeological zones only, mostly in unsaturated
karst or in the hyporheic zone (Fig. 2c). Seventeen of
the above 35 species occurred exclusively in the
unsaturated zone of the Lessinian karst (Appendix 2).
Among the species showing a statistically significant
marginality were endemic harpacticoid copepods of
the genus Lessinocamptus (L. caoduroi Stoch, L. pivai
Stoch) and Parastenocaris (Parastenocaris sp. I1), the
endemic bathynellacean Bathynella sp. I1, the endemic
isopod Monolistra (Typhlosphaeroma) berica (Fabiani),
and the amphipod Niphargus forelii Humbert. Eleven
species were recorded exclusively in the hyporheic
zone, but only two of them (the ostracod Fabaeformi-
scandona cf. wegelini Danielopol and the halacaridan
Soldanellonyx visurgis Vietz) showed a statistically
significant marginality. The number of specialised
species found in the saturated zones of porous
(six species) and karstic (two species) aquifers was
low. Among the most ecologically tolerant species
(OMI index < 2) were the gastropod Paladilhliopsis
virei (Locard), the amphipod Niphargus longidactylus
Ruffo and the cyclopoid copepod Diacyclops italianus
(a)
Altitude
pH
Specific conductivity
T Oxygen
Ca2+
Mg2+
NO3-
PO43-
Environmentalintegrity index
Hydrologicalisolation
Distance toglacier
Habitatfragmentation
Geologicalage
0.8
–0.8
1–1
(b) 4
–5
8–6
(c)
Ba1
BaBI1
BaLI1
BaLI2
CaSu
CeSe
CnI1
CnI2
CnI3
CnI4
Cv2P
Di2C
Di2MDiI1
DiI2
DiI3
DiI4
DiItDiPa
DiRu
EcI1
ElEl
ElI1
ElPs
Gi2L
GiI1
GiI2
GrUn
Ha1HaPh
IgCo
Ko1 KoDe
LeCa
LeI1
LeI2
LeIn
LePi
LoWQ
MeI1
MM2C
MMI1
MMSt MTBeNiPs
Np2CNp2F Np2L
NpAq
NpBG
NpFor
NpGa
NpLe
NpLo
NpSiNpTa
NpTr
PaGe
PaI1
PaI2
PaI3
PaI4
PaIt
Ph1
PlVi
PmI1
PmI2
PpIt
PrI1
PrI2
PrI3
Ps2E
PvSp
Rh2D
RhI1
RhI2
SgLa SoCh
Sp2I
Tr2P
TrI1
TroB
3
–3
–3 6
Fig. 2 (a) Ordination of environmental variables (indicated by
arrows) on the space defined by the first two canonical axes
extracted by OMI analysis and explaining 80% of the variability
in the data set; (b) ordination of sampling sites (black cir-
cles = sites in the unsaturated zone of karstic aquifers; grey
circles = sites in the saturated zone of karstic aquifers; black
triangles = sites in the hyporheic zone of porous aquifers; grey
triangles = sites in the saturated zone of porous aquifers); (c)
ordination of stygobiotic species (see Appendix 1 for species
identification codes).
836 D. M. P. Galassi et al.
� 2009 Blackwell Publishing Ltd, Freshwater Biology, 54, 830–847
(Kiefer), which are endemic to northern Italy (Appen-
dix 1).
The average position of each species along the first
axis of the environmental gradient defined by OMI
analysis is shown in Fig. 3. The average position of the
two most widely distributed species (large-sized
circles) are located far away from the origin of the
axis, indicating that one of the species (S. cf. infernus)
occurred primarily in the vadose zone of karst and,
less frequently, in the hyporheic zone, while the other
(N. psammophila) mainly occurred in saturated porous
sites. The average positions of the two most widely
distributed species along the second axis of OMI
analysis (Fig. 4) are close to the origin of the axis,
indicating wide ecological tolerance to environmental
variation.
The average positions of the other species are evenly
spaced along the altitudinal gradient. Only two
species, L. caoduroi and Bathynella (Bathynella) sp. I1,
were restricted to high-altitude karstic sites, specifi-
cally to the vadose zone of caves located close to the
Wurmian glacier border. Both species are endemic to
the Lessinian Massif. Two other species, Limnosbaena
sp. and Bathynella (Bathynella) sp. I5, are located at the
opposite side of the environmental gradient. Both were
collected at a single site in a saturated porous aquifer.
Discussion
Environmental descriptors
The groundwater environment in the Lessinian Massif
was described by OMI analysis as a gradient from
high altitude, unsaturated zones of karstic aquifers, to
low altitude saturated karstic and porous zones of
more recent geological age and lower environmental
integrity. A second gradient, mainly defined by pH
and calcium concentration, separated the hyporheic
zone from the saturated zones of both karstic and
porous aquifers. Nonetheless, a clear distinction
between the influence of historical and ecological
variables in separating the four hydrogeological zones
was partially blurred by a systematic spatial segrega-
tion of the hydrogeological zones (arranged in north–
south orientation) in the Lessinian region.
Unsaturated karstic sites developed in ancient Juras-
sic and Cretaceous limestone, and are characterised by
a high degree of habitat fragmentation, resulting in
many microhabitats (Pipan & Culver, 2005; CamachoTa
ble
3S
pec
ies
rich
nes
so
fst
yg
ob
ioti
cin
ver
teb
rate
tax
aat
dif
fere
nt
spat
ial
scal
esin
gro
un
dw
ater
of
the
Les
sin
ian
Mas
sif
Sp
atia
lsc
ale
Sp
ecie
sri
chn
ess
All
tax
aP
oly
chae
taO
lig
och
aeta
Gas
tro
po
da
Cy
clo
po
ida
Har
pac
tico
ida
Ost
raco
da
Iso
po
da
Am
ph
ipo
da
Th
erm
osb
aen
acea
Bat
hy
nel
lace
aA
cari
Reg
ion
891
152
1224
72
121
67
Pro
gn
od
iF
um
ane
bas
in46
07
29
94
17
02
5
Pro
gn
od
iV
alp
ante
na
bas
in42
04
28
122
17
03
3
Vai
od
iS
qu
aran
tob
asin
410
62
716
11
50
21
Alp
on
e–T
ram
ign
ab
asin
511
81
914
41
71
32
Kar
stic
aqu
ifer
s75
110
312
215
113
05
4
Po
rou
saq
uif
ers
650
92
1615
71
51
36
Un
satu
rate
dk
arst
icaq
uif
ers
421
92
312
11
90
31
Sat
ura
ted
kar
stic
aqu
ifer
s33
01
19
94
04
02
3
Hy
po
rhei
czo
ne
440
91
912
50
20
06
Sat
ura
ted
po
rou
saq
uif
ers
210
01
73
21
31
30
Groundwater biodiversity in the Lessinian Massif 837
� 2009 Blackwell Publishing Ltd, Freshwater Biology, 54, 830–847

et al., 2006) with different degrees of isolation (Pipan,
Christman & Culver, 2006; Pipan & Culver, 2007).
Hyporheic waters were characterised by the lowest
calcium concentrations measured in this study. Water
flowing through sandy and silty sediments of the
hyporheic zones may account for the relatively low
calcium concentrations compared to ground water of
limestone or gravel aquifers (Bakalowicz, 1994).
Separation of saturated porous and karstic sites
along the axes of OMI analysis is less sharp,
albeit statistically significant, because both are
located at low altitude, in areas with low scores
of the Environmental Integrity Index and high
nitrate concentrations. Consequently, environmental
contrasts among sites in saturated aquifers were
low.
(a)
(c) (b)
Fig. 3 First axis extracted by the OMI analysis of stygobiotic assemblages, which explains 61.7% of the variability in the data set:
(a) Environmental variables arranged along the first axis using their canonical weights (environmental gradient); (b) ordination of
the 89 stygobiotic species along the first axis using their factorial scores; (c) distribution of species along the environmental gradient as
a function of their weighted average position along site scores. Small grey circles represent sites where a species occurs, dark grey
circles the centroid (mean position) of a given species along the environmental gradient. Size of the circles is proportional to the total
occurrence of a given species. Horizontal bars represent standard deviations. See Appendix 1 for species identification codes.
838 D. M. P. Galassi et al.
� 2009 Blackwell Publishing Ltd, Freshwater Biology, 54, 830–847

Phosphate concentration was not an important
environmental factor in the ordination of sites by
OMI analysis, and the contribution of NO3) was also
weak, albeit statistically significant. This suggests that
groundwater pollution by nutrients plays a minor role
in defining environmental gradients of groundwater
habitats in the region, as was also observed by Hahn
& Fuchs (2005), Paran et al. (2005), Dole-Olivier et al.
(2009b) and Martin et al. (2009).
Habitat preferences of stygobionts
The stygobiotic species collected in ground water of
the Lessinian Massif showing low tolerance (i.e. a
(a)
(b)
(c)
Fig. 4 Second axis extracted by OMI analysis of stygobiotic assemblages, which explains 18.3% of the variability in the data set.
See caption of Fig. 3 for details.
Groundwater biodiversity in the Lessinian Massif 839
� 2009 Blackwell Publishing Ltd, Freshwater Biology, 54, 830–847

high OMI index) were also rare in a geographical
sense, showing low frequencies of occurrence, which
frequently results in a restricted geographic distribu-
tion as well. This is the case for species found almost
exclusively in the vadose zone of karst and that are
endemic to the Lessinian Massif. Some of these rare
species are new to science, such as Bathynella (Bathy-
nella) sp. I1, Bathynella (Lombardobathynella) sp. I2,
Parastenocaris sp. I4, Paramorariopsis sp. I1 and three
species of the genus Lessinocamptus. Larger stygobiotic
species in the region have a wider geographical
distribution in the Italian Pre-Alpine or Alpine area,
such as the isopod M. (Typhlosphaeroma) berica and
the amphipods Niphargus sp. gr. aquilex Schiodte,
N. lessiniensis Stoch, N. galvagnii Ruffo, and N. forelii
Humbert (Ruffo & Stoch, 2006).
Some species with restricted ecological tolerance
were found exclusively in the hyporheic habitat, e.g.
most species of the oligochaete genera Rhyacodrilus
and Pristina (new to science and strict endemics to
the Lessinian Massif), the ostracod F. cf. wegelini, and
several copepod species of the genera Diacyclops and
Parastenocaris. Such species often occurred only at a
single site. The water mites Kongsbergia dentata
Walter, Stygomomonia latipes Szalay and S. visurgis
Vietz were mostly found in the same environment,
probably because of their strict association with
epigean aquatic insects for phoresy (i.e. attachment
to other animals for transportation) (Davids et al.,
2006).
In deep saturated aquifers, most species showed
wide ecological tolerance, which is also reflected
in their wide geographical distribution [e.g. Elaphoid-
ella elaphoides (Chappuis), N. psammophila, Para-
pseudoleptomesochra italica Pesce & Petkovski,
Niphargus transitivus Sket]. A unique assemblage of
ancient marine origin was found at one site. It
included two Malacostraca [a Limnosbaena species of
the order Thermosbaenacea and the isopod Monolistra
(Monolistra) sp. I1], together with an undescribed
genus of the harpacticoid family Ectinosomatidae.
Local factors may account for this assemblage
composition. This fauna may have survived in a very
restricted part of the Alpone-Tramigna basin in
connate waters, also named fossil aquifers, i.e. con-
fined aquifers in which trapped water has a different
age than the geological formation (Fetter, 1994).
The most tolerant species, displaying a very low
OMI index, had a wide geographical distribution, as
also found by Dole-Olivier et al. (2009b) in a parallel
study in the French Jura. The highest tolerance indices
were found for (i) the gastropod P. virei, the amphi-
pod N. longidactylus, and the cyclopoid copepod D.
italianus, which are restricted to north-eastern Italy
(Appendix 1); (ii) the harpacticoid Moraria (Moraria)
stankovitchi Chappuis, which is widely distributed in
eastern Europe (Petkovski & Brancelj, 1985) and (iii)
the cyclopoid Graeteriella (Graeteriella) unisetigera
(Graeter), which has a wide geographical range across
Europe (Fiers & Ghenne, 2000; Galassi, 2001) and is
one of the most common species in the French Jura
(Dole-Olivier et al., 2009b) and in the Walloon karst of
Belgium (Martin et al., 2009). These species were
collected from different groundwater habitats, springs
and hyporheic sites (Botosaneanu, 1986). Slight niche
shifts among locations together with greater dispersal
potential may explain the wide ecological and bio-
geographical distribution of these tolerant species
(indicated by their low OMI index), as observed for
some copepod species from both ground water
(Galassi, 2001) and surface water (Rundle et al., 2002).
Biodiversity patterns
The Lessinian Massif showed a higher stygobiotic
species richness (89 species) than all but one of the
other European regions investigated in the PASCALIS
project with identical methods. Only the Krim Massif
in Slovenia had more species, a total of 92 (Dole-
Olivier et al., 2009a). This high species richness in
Lessinian ground water is paralleled by a high
number of endemic species, 59 in total, which is equal
to as much as 66% of the total species richness.
Outlying Mean Index analysis indicates that both
historical and ecological variables are influential in
determining species diversity patterns in the four
hydrogeological zones studied. The historical compo-
nent, mostly defined by geological age of the aquifer,
appears to be important in increasing both total
species richness and degree of endemism. This is
especially true in the ancient unsaturated karst, where
habitats are highly fragmented, thus favouring long-
term vicariant events, multiple disjunct refugia and
hence speciation. Relatively high species richness was
also found in the hyporheic habitat, as also noted by
Paran et al. (2005) for a shallow aquifer in France. The
richness level of 44 species in the Lessinian Massif is
comparable to that found in the unsaturated karst of
840 D. M. P. Galassi et al.
� 2009 Blackwell Publishing Ltd, Freshwater Biology, 54, 830–847

the region (42 species). In contrast, the saturated
porous and karstic aquifers showed relatively low
species richness, probably reflecting low microhabitat
diversity and, though less clearly, anthropogenic
impacts. Even though the Environmental Integrity
Index and nitrate concentration showed statistically
significant correlations with altitude in the Lessinian
Massif, these variables appear to have played minor
roles in explaining stygobiotic biodiversity patterns at
the regional scale, as also noted for the French Jura
(Dole-Olivier et al., 2009b) and the Walloon karst in
Belgium (Martin et al., 2009). This conclusion is ten-
tative, however, since the potential impact of human
activities on stygobiotic species richness remains
incompletely understood in general (Hancock, 2002;
Hancock & Boulton, 2005; Lafont et al., 2006).
Separation of stygobiotic assemblages in karstic and
porous aquifers and, to a lesser extent, among hydro-
geological zones in the French Jura was also found by
Castellarini et al. (2005). These authors postulated that
differences in physical habitat structure are the major
source of variation in species richness and composi-
tion between karstic and porous aquifers. Neverthe-
less, connectivity between basins within the region
and distance to the Wurmian glacier limit were
important factors accounting for differences in stygo-
biotic assemblages in their study. This contrasts results
obtained by Martin et al. (2009) who failed to find
environmental gradients distinguishing karstic and
porous aquifers or hydrogeological zones in the
Walloon karst of Belgium. The different result of the
study of Martin et al.’s (2009), compared to those of both
Castellarini et al. (2005) in the French Jura and the
present study, could have resulted from strong
influences of the Weichselian glaciation on the Walloon
karst. Stygobiotic species richness in the Walloon karst
is very low (36 species) and most species are habitat
generalists with wide geographical distributions,
suggesting that aquifers in that region were recolonised
after the glaciers retreated (Martin et al., 2009).
In the Lessinian ground water, Quaternary glacia-
tions, although important in shaping stygobiotic spe-
cies distribution, appear not to have strongly affected
species richness. Only a few sites in the unsaturated
karst were covered by the Wurmian glaciers, and they
had high species richness. A similar situation has been
observed by Stoch (2000) for the vadose caves of
Trentino in northern Italy, by Rouch (1986) for different
karstic systems in southern France, and by Holsinger,
Mort & Recklies (1983) for groundwater systems in
Canada, all areas that were ice-covered during the
Pleistocene. Plausible explanations of high stygobiotic
species richness in the Lessinian Massif caves are their
marginal location with respect to the Wurmian glacier
limit and the highly fractured nature of the karst.
Extensive networks of fractures probably allowed
stygobionts to move deep down in the aquifers to seek
refuge during surface freezing and to recolonise the
ancestral habitats after the glaciers retreated.
Results of the present study suggest that the ancient
geological age of aquifers in the Lessinian Massif, high
habitat fragmentation, and isolation of microhabitats
may all have promoted speciation by vicariance,
especially in the vadose zone. In particular, the ancient
age of the Lessinian karst may have favoured persis-
tence of many endemics, most of which are phyloge-
netic relicts (i.e. unique remnants of formerly
diversified taxonomic groups) or distributional relicts
(i.e. taxa with close relatives traceable in disjunct
geographical areas) (Holsinger, 1988; Humphreys,
2000). This is the case for the four species of
Lessinocamptus, a harpacticoid genus known only from
unsaturated karstic sites in eastern Italy (Stoch, 2006),
and for some isopod and amphipod species of the
genera Monolistra and Niphargus. Conversely, high
species richness in the hyporheic habitat may be due
to spatial variability in environmental conditions and
speciation promoted by niche differentiation (Stoch,
1995; Galassi, Huys & Reid, 2009), as suggested by the
co-occurrence of several, closely related species in the
same habitat. This scenario could apply to several
copepod species of the genera Diacyclops and
Parastenocaris.
Acknowledgments
We thank Paola D’Ambrosio (L’Aquila), Gianfranco
Tomasin (Gorizia) and Enrico Mezzanotte (Verona)
who greatly contributed to the sampling. The Adige
River Basin Authority (Trento), the ARPA Verona, the
Museo Civico di Storia Naturale of Verona and the
speleological associations in Verona provided facili-
ties for the field work and hydrogeological maps. A.
Camacho (Syncarida), P. Marmonier (Ostracoda), B.
Sambugar (Oligochaeta) and A. Di Sabatino (Acari)
are greatly acknowledged for species identification.
We are also much indebted to J. Gibert, D. Culver and
M. Gessner for useful comments on the final draft of
Groundwater biodiversity in the Lessinian Massif 841
� 2009 Blackwell Publishing Ltd, Freshwater Biology, 54, 830–847

the manuscript. This study was supported by the
PASCALIS project funded by the European Commis-
sion (contract no. EVK2-CT-2001-00121).
References
Bakalowicz M. (1994) Water geochemistry: water quality
and dynamics. In: Groundwater Ecology (Eds J. Gibert,
D.L. Danielopol & J.A. Stanford), pp. 97–127. Aca-
demic Press, San Diego, CA.
Boccaletti M., Ciaranfi N., Cosentino D. et al. (1990)
Palinspastic restoration and paleogeographic recon-
struction of the peri-Tyrrhenian area during the Neo-
gene. Palaeogeography, Palaeoclimatology, Palaeoecology,
77, 41–50.
Botosaneanu L. (1986) Stygofauna Mundi – A Faunistic,
Distributional and Ecological Synthesis of the World Fauna
Inhabiting Subterranean Waters (Including the Marine
Interstitial). E.J. Brill, Leiden.
Bou C. & Rouch R. (1967) Un nouveau champ de
recherches sur la faune aquatique souterraine. Comptes
Rendus de l’Academie des Sciences de Paris, 265, 369–370.
Camacho A.I., Valdecasas A.G., Rodrıguez J., Cuezva S.,
Lario J. & Sanchez-Moral S. (2006) Habitat constraints
in epikarstic waters of an Iberian Peninsula cave
system. Annales de Limnologie, 42, 127–140.
Castellarini F., Dole-Olivier M.-J., Malard F. & Gibert J.
(2005) Improving the assessment of groundwater
biodiversity by exploring environmental heterogeneity
at a regional scale. In: Proceedings of an International
Symposium on World Subterranean Biodiversity (Ed. J.
Gibert), pp. 83–88. University Claude Bernard, Lyon.
CEC (1994) CORINE Land Cover. Technical Guide. Office
for Official Publications of European Communities,
Luxembourg.
Colwell R.K., Rahbek C. & Gotelli N.J. (2004) The
mid-domain effect and species richness patterns: what
have we learned so far? The American Naturalist, 163,
E1–E23.
Culver D.C. (2005) The struggle to measure subterranean
biodiversity. In: Proceedings of an International Sympo-
sium on World Subterranean Biodiversity (Ed. J. Gibert),
pp. 27–28. University Claude Bernard, Lyon.
Davids K., Di Sabatino A., Gerecke R., Gledhill T., Smit
H. & van der Hammen H. (2006) Acari: Hydrachnidia
I. In: Sußwasserfauna von Mitteleuropa, 7 ⁄ 2 – Acari I (Ed.
R. Gerecke), pp. 255–340. Spektrum, Heidelberg.
Doledec S., Chessel D. & Gimaret-Carpentier C. (2000)
Niche separation in community analysis: a new
method. Ecology, 81, 2914–2927.
Dole-Olivier M.-J., Castellarini F., Coineau N., Galassi
D.M.P., Martin P., Mori N., Valdecasas A. & Gibert J.
(2009a) Towards an optimal sampling strategy to
assess groundwater biodiversity: comparison across
six European regions. Freshwater Biology, 54, 777–
796.
Dole-Olivier M.-J., Malard F., Martin D., Lefebure T. &
Gibert J. (2009b) Relationships between environmental
variables and groundwater biodiversity at the regional
scale. Freshwater Biology, 54, 797–813.
Drake J.A., Hewitt C.L., Huxel G.R. & Kolasa J. (1996)
Diversity and higher levels of organization. In: Biodi-
versity. A Biology of Numbers and Difference (Ed. K.J.
Gaston), pp. 149–166. Blackwell Science, Oxford.
Ferreira D., Malard F., Dole-Olivier M.-J. & Gibert J.
(2005) Hierarchical patterns of obligate groundwater
biodiversity in France. In: Proceedings of an International
Symposium on World Subterranean Biodiversity (Ed.
J. Gibert), pp. 5–78. University Claude Bernard, Lyon.
Fetter C.W. (1994) Applied Hydrogeology, 3rd edn. Prentice
Hall, Englewoods Cliffs, NJ.
Fiers F. & Ghenne V. (2000) Cryptozoic copepods from
Belgium: diversity and biogeographic implication.
Belgian Journal of Zoology, 130, 11–19.
Galassi D.M.P. (2001) Groundwater copepods: diversity
patterns over ecological and evolutionary scales.
Hydrobiologia, 453 ⁄454, 227–253.
Galassi D.M.P., Huys R. & Reid J.W. (2009) Diversity,
ecology and evolution of groundwater copepods.
Freshwater Biology, 54, 691–708.
Gibert J. (2001) Protocols for the Assessment and Conserva-
tion of Aquatic Life in the Subsurface (PASCALIS): A
European Project. Proceedings of ‘‘Mapping Subterranean
Biodiversity’’. Special Publication, Karst Water Institute
& Laboratoire souterrain de Moulis, Moulis, pp. 19–21.
Gibert J. & Deharveng L. (2002) Subterranean ecosys-
tems: a truncated functional biodiversity. BioScience,
52, 473–481.
Gibert J., Stanford J.A., Dole-Olivier M.-J. & Ward J.V.
(1994a) Basic attributes of groundwater ecosystem and
prospects for research. In: Groundwater Ecology (Eds
J. Gibert, D.L. Danielopol & J.A. Stanford), pp. 7–40.
Academic Press, San Diego, CA.
Gibert J., Vervier P., Malard F., Laurent R. & Reygrobellet
J.-L. (1994b) Dynamics of communities and ecology of
karst ecosystems: example of three karsts in eastern
and southern France. In: Groundwater Ecology (Eds
J. Gibert, D.L. Danielopol & J.A. Stanford), pp. 425–450.
Academic Press, San Diego, CA.
Gibert J., Malard F., Turquin M.J. & Laurent R. (2000)
Karst ecosystems in the Rhone river basin. In: Ecosys-
tems of the World 30 – Subterranean Ecosystems (Eds
H. Wilkens, D.C. Culver & W.F. Humphreys), pp. 533–
558. Elsevier, Amsterdam.
842 D. M. P. Galassi et al.
� 2009 Blackwell Publishing Ltd, Freshwater Biology, 54, 830–847

Hahn H.-J. & Fuchs A. (2005) Mapping the stygofauna of
the state of Baden-Wurttemberg, southwest Germany.
In: Proceedings of an International Symposium on World
Subterranean Biodiversity (Ed. J. Gibert), pp. 89–94.
University Claude Bernard, Lyon.
Hancock P.J. (2002) Human impacts on the stream–
groundwater exchange zone. Environmental Manage-
ment, 29, 763–781.
Hancock P.J. & Boulton A.J. (2005) The effects of an
environmental flow release on water quality in the
hyporheic zone of the Hunter River, Australia. Hydro-
biologia, 552, 75–85.
Holsinger J.R. (1988) Troglobites: the evolution of cave-
dwelling organisms. American Scientist, 76, 147–153.
Holsinger J.R., Mort J.S. & Recklies A.D. (1983) The
subterranean crustacean fauna of Castleguard cave,
Columbia Icefields, Alberta, Canada, and its zoogeo-
graphic significance. Arctic and Alpine Research, 15,
543–549.
Humphreys W.F. (2000) Relict faunas and their deriva-
tion. In: Ecosystems of the World, 30. Subterranean
Ecosystems (Eds H.D. Wilkens, D.C. Culver & W.F.
Humphreys), pp. 417–432. Elsevier, Amsterdam.
Lafont M., Vivier A., Nogueira S., Namour P. & Breil P.
(2006) Surface and hyporheic oligochaete assemblages in
a French suburban stream. Hydrobiologia, 564, 183–193.
Malard F., Dole-Olivier M.-J., Mathieu J. & Stoch F. (2002)
Sampling Manual for the Assessment of Regional Ground-
water Biodiversity. PASCALIS European programme.
Available at: http://www.pascalis-project.com.
Martin P., De Broyer C., Fiers F., Michel G., Sablon R. &
Wouters K. (2005) Biodiversity of Belgian ground-
waters: the Meuse basin. In: Proceedings of an Inter-
national Symposium on World Subterranean Biodiversity
(Ed. J. Gibert), pp. 95–98. University Claude Bernard,
Lyon.
Martin P., De Broyer C., Fiers F., Michel G., Sablon R. &
Wouters K. (2009) Biodiversity of Belgian ground-
water fauna in relation to environmental conditions.
Freshwater Biology, 54, 814–829.
Moritz C. (2002) Strategies to protect biological diversity
and the evolutionary processes that sustain it. System-
atic Biology, 51, 238–254.
Moritz C., Richardson K.S., Ferrier S., Monteith G.B.,
Stanisic J., Williams S.E. & Whiffin T. (2001) Biogeo-
graphical concordance and efficiency of taxon indica-
tors for establishing conservation priority in a tropical
rainforest biota. Proceedings of the Royal Society of
London, Series B, 268, 1875–1881.
Paran F., Malard F., Mathieu J., Lafont M., Galassi D.M.P. &
Marmonier P. (2005) Distribution of groundwater inver-
tebrates along an environmental gradient in a shallow
water-table aquifer. In: World Subterranean Biodiversity,
Proceedings of an International Symposium (Ed. J. Gibert),
pp. 99–105. University Claude Bernard, Lyon.
Patrizi G., Lavagnoli M., Zuppi G. et al. (2001) Indagine
idrogeologica, geochimica e geochimico-isotopica sugli ac-
quiferi della Lessinia. Settore Ecologia, Provincia di
Verona, Verona.
Petkovski T.K. & Brancelj A. (1985) Zur Copepodenfauna
(Crustacea) der Grotten Skocjanske Jame in Slowenien.
Acta Musei Macedonici Scientiarum Naturalium, 18, 1–25.
Pipan T. & Culver D.C. (2005) Estimating biodiversity in
the epikarstic zone of a West Virginia cave. Journal of
Cave and Karst Studies, 67, 103–109.
Pipan T. & Culver D.C. (2007) Copepod distribution as
an indicator of epikarst system connectivity. Hydrog-
eology Journal, 15, 817–822.
Pipan T., Christman M.C. & Culver D.C. (2006) Dynam-
ics of epikarstic communities: microgeographic pattern
and environmental determinants of epikarstic cope-
pods in Organ Cave, West Virginia. American Midland
Naturalist, 156, 75–87.
Rouch R. (1986) Copepoda: les Harpacticoıdes souter-
rains des eaux douces continentales. In: Stygofauna
Mundi – A Faunistic, Distributional and Ecological Syn-
thesis of the World Fauna Inhabiting Subterranean Waters
(Including the Marine Interstitial) (Ed. L. Botosaneanu),
pp. 321–355. E.J. Brill, Leiden.
Ruffo S. & Stoch F. (2006) Crustacea Malacostraca
Amphipoda. In: Checklist and Distribution of the Italian
Fauna (Eds S. Ruffo & F. Stoch), pp. 109–111. Memorie
del Museo civico di Storia naturale di Verona, Sezione
Scienze della Vita, Verona.
Rundle S., Bilton D., Galassi D.M.P. & Shiozawa D. (2002)
The geographical ecology of freshwater meiofauna. In:
Freshwater Meiofauna: Biology and Ecology (Eds S.D.
Rundle, A.L. Robertson & J.M. Schmid-Araya), pp.
279–294. Backhuys Publishers, Leiden.
Sauro U. (1973) Il paesaggio degli alti Lessini. Studio
geomorfologico. Memorie del Museo civico di Storia
naturale di Verona, fuori serie, 6, 1–161.
Stoch F. (1995) The ecological and historical determinants
of crustacean diversity in groundwaters, or: why are
there so many species? Memoires de Biospeologie, 22,
139–160.
Stoch F. (2000) Indagini sulla fauna acquatica delle grotte
del Trentino (Italia Settentrionale). Studi Trentini di
Scienze Naturali, Acta Biologica, 74, 117–132.
Stoch F. (2006) Crustacea Copepoda Cyclopoida. In:
Checklist and Distribution of the Italian Fauna (Eds S.
Ruffo & F. Stoch), pp. 117–132. Memorie del Museo
civico di Storia naturale di Verona, Sezione Scienze
della Vita, Verona.
Groundwater biodiversity in the Lessinian Massif 843
� 2009 Blackwell Publishing Ltd, Freshwater Biology, 54, 830–847

Thioulouse J., Doledec S., Chessel D. & Olivier J.-M.
(1997) ADE-4: a multivariate analysis and graphical
display software. Statistics and Computing, 7, 75–83.
Whittaker R.J., Willis K.J. & Field R. (2001) Scale and
species richness: towards a general, hierarchical
theory of species diversity. Journal of Biogeography, 28,
453–470.
(Manuscript accepted 11 February 2009)
Appendix 1 List of stygobiotic species collected from ground water in the Lessinian Massif. Two asterisks (**)
indicate species strictly endemic to the Lessinian Massif; one asterisk (*) indicates species endemic to larger
areas of north-eastern Italy
Taxonomic group Endemism Species Identification Code
Polychaeta Troglochaetus beranecki Delachaux TroB
Oligochaeta Cernosvitoviella cf. parviseta Gadzinska Cv2P
** Gianius sp. I1 GiI1
** Gianius sp. I2 GiI2
Gianius cf. labouichensis (Rodriguez & Giani) Gi2L
Haber sp. Ha1
* Parvidrilus spelaeus Martınez-Ansemil, Sambugar & Giani PvSp
Phallodrilinae indet. Ph1
** Pristina sp. I1 PrI1
** Pristina sp. I2 PrI2
** Pristina sp. I3 PrI3
* Rhyacodrilus cf. dolcei Martınez-Ansemil, Sambugar & Giani, Rh2D
** Rhyacodrilus sp. I1 RhI1
** Rhyacodrilus sp. I2 RhI2
** Trichodrilus sp. I1 TrI1
Trichodrilus cf. pragensis Vejdovsky Tr2P
Gastropoda * Iglica concii (Allegretti) IgCo
* Paladilhiopsis virei (Locard) PlVi
Cyclopoida * Diacyclops cf. maggii Pesce & Galassi Di2M
Diacyclops cf. clandestinus (Kiefer) Di2C
Diacyclops italianus (Kiefer) DiIt
Diacyclops paolae Pesce & Galassi DiPa
* Diacyclops ruffoi Kiefer DiRu
* Diacyclops sp. I1 DiI1
* Diacyclops sp. I2 DiI2
* Diacyclops sp. I3 DiI3
** Diacyclops sp. I4 DiI4
Graeteriella (Graeteriella) unisetigera (Graeter) GrUn
* Speocyclops cf. infernus (Kiefer) Sp2I
** Speocyclops sp. I1 SpI1
Harpacticoida ** Bryocamptus sp. I1 BrI1
Ceuthonectes serbicus Chappuis CeSe
** Ectinosomatidae gen. I1 sp. I1 EcI1
Elaphoidella elaphoides (Chappuis) ElEl
Elaphoidella phreatica (Chappuis) ElPh
* Elaphoidella pseudophreatica (Chappuis) ElPs
* Elaphoidella sp. I1 ElI1
** pivai Lessinocamptus caoduroi Stoch LeCa
** Lessinocamptus insoletus (Chappuis) LeIn
** Lessinocamptus pivai Stoch LePi
** Lessinocamptus sp. I1 LeI1
** Lessinocamptus sp. I2 LeI2
* Moraria (Moraria) sp. I1 MMI1
Moraria (Moraria) stankovitchi Chappuis MMSt
* Nitocrella psammophila Chappuis NiPs
844 D. M. P. Galassi et al.
� 2009 Blackwell Publishing Ltd, Freshwater Biology, 54, 830–847

Appendix 1 (Continued)
Taxonomic group Endemism Species Identification Code
Parapseudoleptomesochra italica Pesce & Petkovski PpIt
** Paramorariopsis sp. I1 PmI1
** Paramorariopsis sp. I2 PmI2
* Parastenocaris gertrudae Kiefer PaGe
Parastenocaris italica Chappuis PaIt
** Parastenocaris sp. I1 PaI1
** Parastenocaris sp. I2 PaI2
** Parastenocaris sp. I3 PaI3
** Parastenocaris sp. I4 PaI4
Ostracoda ** Candoninae gen. I2 sp. I1 CnI1
** Candoninae gen. I2 sp. I2 CnI2
** Candoninae gen. I1 sp. I1 CnI3
** Candoninae gen. I1 sp. I2 CnI4
Cavernocypris subterranea (Wolf) CaSu
Fabaeformiscandona cf. wegelini Danielopol Fa2W
Pseudocandona cf. eremita (Vejdovsky) Ps2E
Isopoda * Monolistra (Typhlosphaeroma) berica (Fabiani) MTBe
** Monolistra (Monolistra) sp. I1 MM2C
Amphipoda * Niphargus sp. gr. aquilex Schiodte NpAq
* Niphargus bajuvaricus grandii Ruffo NpBG
** Niphargus cf. costozzae Schellenberg Np2C
Niphargus forelii Humbert NpFor
Niphargus cf. forelii Humbert Np2F
* Niphargus galvagnii Ruffo NpGa
** Niphargus lessiniensis Stoch NpLe
** Niphargus cf. lessiniensis Stoch Np2L
* Niphargus longidactylus Ruffo NpLo
* Niphargus similis G. Karaman & Ruffo NpSi
* Niphargus tamaninii Ruffo NpTa
* Niphargus transitivus Sket NpTr
Thermosbaenacea Limnosbaena sp. Th1
Bathynellacea Bathynella sp. Ba1
** Bathynella (Bathynella) sp. I1 BaBI1
** Bathynella (Bathynella) sp. I5 BaBI5
** Bathynella (Lombardobathynella) sp. I1 BaLI1
** Bathynella (Lombardobathynella) sp. I2 BaLI2
** Meridiobathynella sp. I1 MeI1
Acari Stygomomonia latipes Szalay SgLa
Kongsbergia dentata Walter KoDe
Kongsbergia sp. Ko1
Lobohalacarus weberi quadriporus (Walter) LoWQ
Soldanellonyx visurgis Vietz SoVi
Soldanellonyx chappuisi Walter SoCh
Halacarellus phreaticus Petrova HaPh
Groundwater biodiversity in the Lessinian Massif 845
� 2009 Blackwell Publishing Ltd, Freshwater Biology, 54, 830–847

Appendix 2 Results of the OMI analysis based on OMI index and its variance terms. OMI = Outlying Mean
Index (marginality); T = tolerance (outlying variance); RT = residual tolerance; P = probability value (significance
of the OMI index assessed using Monte-Carlo permutation test). Species are arranged in decreasing order of
marginality. Species with a statistically significant marginality are shown in bold. N = total number of sites where
a taxon occurred. The relative occurrence of species (%) is given within the four hydrogeological zones:
Ku = unsaturated (vadose) zone of karstic aquifers; Ks = saturated zone of karstic aquifers; Ph = hyporheic zone
of porous aquifers; Ps = saturated zone of porous aquifers)
Species OMI T RT P N Ku Ks Ph Ps
Bathynella (Bathynella) sp. I1 38.6 » 0 1.0 0.030 1 1 0 0 0
Lessinocamptus caoduroi 38.6 » 0 1.0 0.030 1 1 0 0 0
Limnosbaena sp. 25.9 0 0 0.054 1 0 0 0 1
Bathynella (Lombardobathynella) sp. I2 22.6 » 0 1.0 0.076 1 1 0 0 0
Bathynella (Bathynella) sp. I5 21.6 0 0 0.092 1 0 0 0 1
Elaphoidella phreatica 20.9 0 0 0.119 1 0 0 1 0
Pristina sp. I3 20.3 » 0 1.0 0.124 1 0 0 1 0
Bathynella sp. 19.8 1.1 5.8 0.020 2 1 0 0 0
Parastenocaris sp. I4 18.2 2.3 2.4 0.027 2 1 0 0 0
Troglochaetus beranecki 17.3 » 0 1.0 0.212 1 1 0 0 0
Niphargus forelii 17.1 » 0 3.8 0.001 4 1 0 0 0
Fabaeformiscandona cf. wegelini 15.9 0.1 1.1 0.013 3 0 0 1 0
Pristina sp. I2 15.5 0 0 0.276 1 1 0 0 0
Niphargus galvagnii 15.3 » 0 1.0 0.306 1 1 0 0 0
Bryocamptus sp. I1 14.5 » 0 1.0 0.316 1 0 0 1 0
Speocyclops sp. I1 12.6 » 0 1.0 0.415 1 0 0 1 0
Gianius sp. I2 12.4 0 0 0.379 1 1 0 0 0
Soldanellonyx visurgis 12.3 » 0 3.2 0.027 3 0 0 1 0
Gianius cf. labouichensis 11.9 0 0 0.411 1 0 0 1 0
Monolistra (Monolistra) sp. I1 11.9 0.3 3.1 0.090 2 0 0 0 1
Lessinocamptus sp. I1 11.8 0 0 0.447 1 1 0 0 0
Parastenocaris sp. I2 11.7 0.1 0.7 0.040 3 0 0 1 0
Niphargus transitivus 11.6 » 0 1.0 0.474 1 0 0 0 1
Bathynella (Lombardobathynella) sp. I1 11.5 0.3 3.4 0.108 2 0 0.5 0 0.5
Elaphoidella elaphoides 11.3 » 0 1.0 0.494 1 0 0 0 1
Candoninae gen. I1 sp. I2 11.1 0 0 0.521 1 0 0 1 0
Lessinocamptus pivai 11.0 0.9 15.9 <0.001 10 1 0 0 0
Rhyacodrilus sp. I1 10.8 » 0 1.0 0.540 1 1 0 0 0
Parapseudoleptomesochra italica 10.5 0.2 2.9 0.049 3 0 1 0 0
Kongsbergia dentata 10.3 » 0 0.8 0.146 2 0 0 1 0
Cavernocypris subterranea 10.2 » 0 2.5 0.167 2 0 0 1 0
Monolistra (Typhlosphaeroma) berica 10.2 0.7 2.5 0.008 5 1 0 0 0
Niphargus sp. gr. aquilex 10.1 0.2 2.2 0.163 2 1 0 0 0
Paramorariopsis sp. I1 10.0 0.1 2.0 0.185 2 1 0 0 0
Trichodrilus sp. I1 10.0 » 0 1.0 0.617 1 1 0 0 0
Moraria (Moraria) sp. I1 9.7 1.7 5.3 <0.001 14 1 0 0 0
Diacyclops ruffoi 9.5 1.4 8.9 <0.001 7 0 0 0 1
Elaphoidella pseudophreatica 9.5 0.6 3.2 0.065 3 1 0 0 0
Paramorariopsis sp. I2 9.5 0 2.0 0.190 2 0 0 1 0
Parastenocaris italica 9.4 1.1 3.9 0.001 7 0 0 1 0
Parastenocaris gertrudae 9.2 0.1 3.4 0.076 3 0 0 1 0
Niphargus cf. forelii 8.4 0 0 0.764 1 1 0 0 0
Niphargus similis 8.3 1.9 6.6 <0.001 8 0.63 0.38 0 0
Parastenocaris sp. I1 7.9 0.1 4.5 0.290 2 0 0 1 0
Halacarellus phreaticus 7.9 0.4 2.2 0.015 5 0 0.20 0.80 0
Rhyacodrilus cf. dolcei 7.9 0 0 0.784 1 0 0 1 0
Rhyacodrilus sp. I2 7.9 0 0 0.784 1 0 0 1 0
Trichodrilus cf. pragensis 7.7 0.7 3.7 0.006 6 1 0 0 0
846 D. M. P. Galassi et al.
� 2009 Blackwell Publishing Ltd, Freshwater Biology, 54, 830–847

Appendix 2 (Continued)
Species OMI T RT P N Ku Ks Ph Ps
Kongsbergia sp. 7.7 0.3 1.6 0.316 2 0 0 1 0
Lessinocamptus sp. I2 7.5 1.9 5.5 0.050 4 0.75 0.25 0 0
Niphargus cf. costozzae 7.4 0.2 4.0 0.005 7 1 0 0 0
Pristina sp. I1 7.2 0.1 1.2 0.342 2 0 0 1 0
Diacyclops sp. I4 7.0 » 0 1.0 0.886 1 1 0 0 0
Meridiobathynella sp. I1 6.9 4.1 10.5 0.021 6 0 0.33 0 0.67
Niphargus lessiniensis 6.8 0.8 5.3 <0.001 14 0.86 0.14 0 0
Niphargus cf. lessiniensis 6.8 0.1 3.4 0.066 4 1 0 0 0
Stygomomonia latipes 6.6 » 0 1.0 0.873 1 0 0 1 0
Haber sp. 6.6 1.7 2.9 0.049 5 0.2 0 0.8 0
Niphargus tamaninii 6.4 0 4.1 0.045 5 1 0 0 0
Iglica concii 5.8 0.6 4.4 0.001 13 0.85 0.15 0 0
Parastenocaris sp. I3 5.6 » 0 1.0 0.963 1 0 1 0 0
Soldanellonyx chappuisi 5.2 0.2 4.5 0.285 3 0 0.33 0.67 0
Gianius sp. I1 5.1 1.2 4.7 0.336 3 0.33 0 0.67 0
Lobohalacarus weberi quadriporus 5.1 1.7 4.6 <0.001 18 0 0.11 0.89 0
Pseudocandona cf. eremita 4.9 0.7 5.9 0.618 2 0 0.5 0 0.5
Diacyclops sp. I3 4.8 1.8 4.6 0.022 8 0 0.13 0.13 0.75
Ectinosomatidae gen. I1 sp. I1 4.8 1.8 7.2 0.005 11 0 0.18 0.18 0.64
Ceuthonectes serbicus 4.8 0.5 6.2 <0.001 16 0.63 0.06 0.31 0
Lessinocamptus insoletus 4.7 0.5 4.2 0.015 9 0.56 0.44 0 0
Parvidrilus spelaeus 4.6 1.7 7.8 0.008 9 0.78 0 0.22 0
Speocyclops cf. infernus 4.5 1.7 10.3 <0.001 54 0.63 0.04 0.33 0
Cernosvitoviella cf. parviseta 4.1 » 0 3.6 0.749 2 0 1 0 0
Niphargus bajuvaricus grandii 4.0 0.9 9.6 0.011 10 0 0.1 0.3 0.6
Candoninae gen. I2 sp. I1 4.0 » 0 1.00 0.989 1 0 1 0 0
Elaphoidella sp. I1 3.9 1.3 9.4 0.006 13 0.15 0.23 0.62 0
Candoninae gen. I1 sp. I1 3.8 1.3 7.2 0.313 4 0 0.25 0.5 0.25
Candoninae gen. I2 sp. I2 3.7 2.4 5.7 0.008 11 0.18 0.18 0.64 0
Diacyclops paolae 3.6 2.0 9.1 <0.001 21 0 0.10 0.24 0.67
Diacyclops sp. I2 3.5 1.4 4.7 0.244 5 0 0.2 0.8 0
Diacyclops sp. I1 3.4 1.3 8.5 0.001 20 0 0.3 0.2 0.5
Diacyclops cf. maggii 3.3 0.9 4.2 0.841 2 0 0.5 0 0.5
Diacyclops cf. clandestinus 2.8 1.6 8.4 0.023 12 0 0.08 0.67 0.25
Nitocrella psammophila 2.8 2.0 9.0 <0.001 54 0 0.28 0.24 0.48
Phallodrilinae indet. 2.3 2.3 14.0 0.015 16 0.56 0 0.438 0
Graeteriella (Graeteriella) unisetigera 2.1 3.9 6.9 0.040 15 0 0.27 0.73 0
Moraria (Moraria) stankovitchi 1.5 3.0 5.4 0.745 5 0.4 0.4 0.2 0
Paladilhliopsis virei 1.4 2.8 6.9 0.323 11 0.73 0 0.18 0.09
Niphargus longidactylus 1.1 0.9 9.2 0.945 4 0 0.25 0.5 0.25
Diacyclops italianus 0.6 1.5 12.7 0.369 22 0.45 0.14 0.14 0.27
Groundwater biodiversity in the Lessinian Massif 847
� 2009 Blackwell Publishing Ltd, Freshwater Biology, 54, 830–847