Embed Size (px)
Citation preview
Groundwater and Agricultural BioenergyFeedstock ProductionFeedstock Production
Noel GollehonNatural Resources Conservation Service, USDA
2011 Ground Water Protection Council Annual Forum Atlanta GA
S t b 26 2011September 26, 2011September 27,2011
Goal of presentation
• Provide a National perspective on i i t d i ltirrigated agriculture Acres Water use Crops
• What do trends and current conditions tell us about the water and land potentially used for biofuel production?biofuel production?
• What are the groundwater implications?
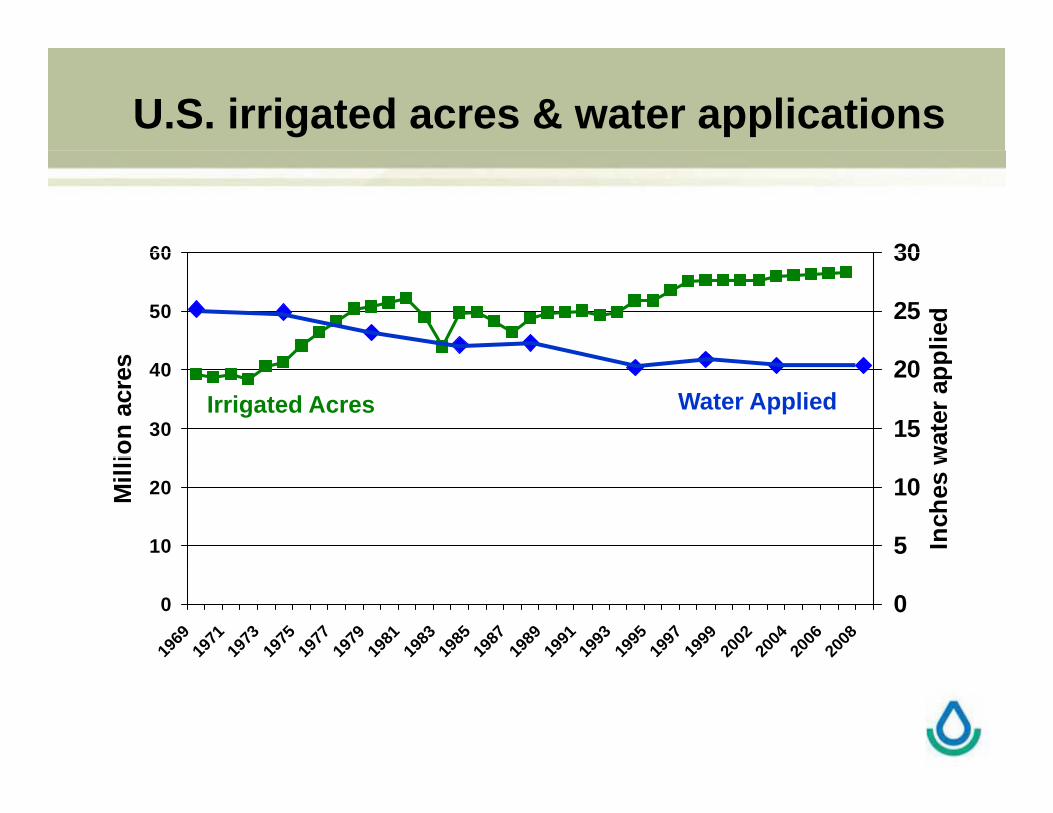
U.S. irrigated acres & water applications
60 30
50
60
s
25
30
plie
d
30
40
ion
acre
s
15
20
wat
er a
pp
Irrigated Acres Water Applied
10
20Mill
i
5
10
Inch
es w
0
1969
1971
1973
1975
1977
1979
1981
1983
1985
1987
1989
1991
1993
1995
1997
1999
2002
2004
2006
2008
0
Year
Source: NRCS, based Census of Agriculture Data and Farm and Ranch Irrigation Survey Data
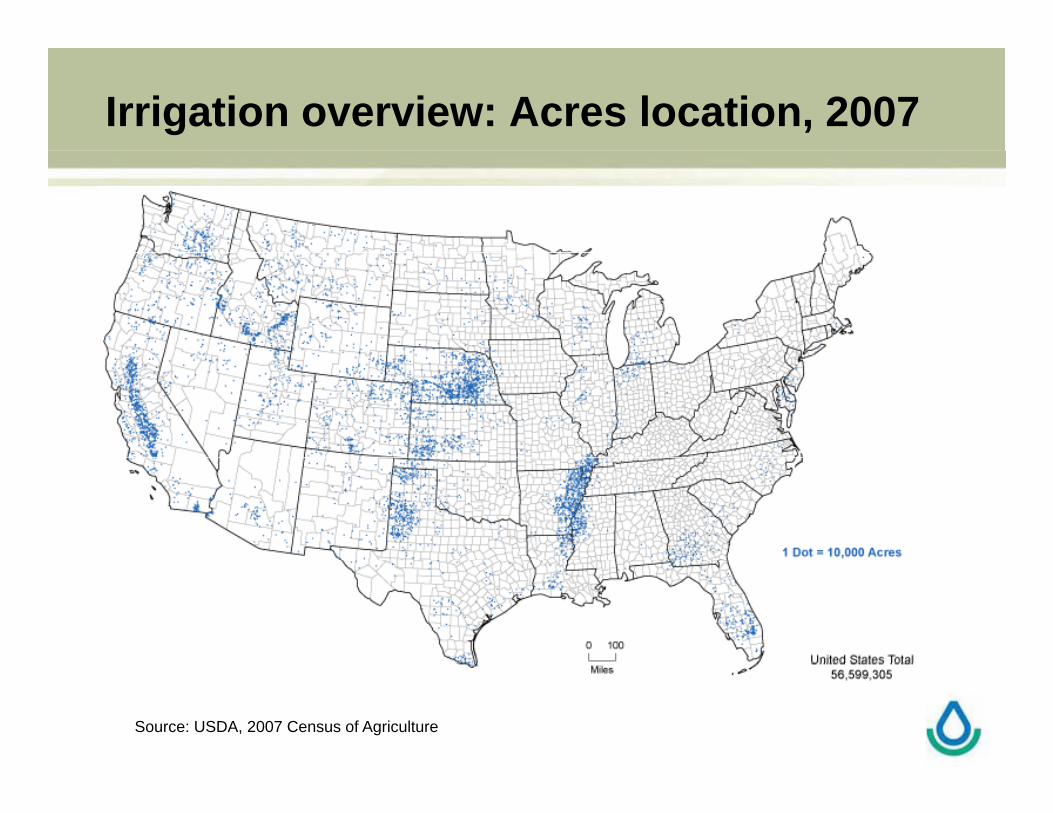
Irrigation overview: Acres location, 2007
Source: USDA, 2007 Census of Agriculture
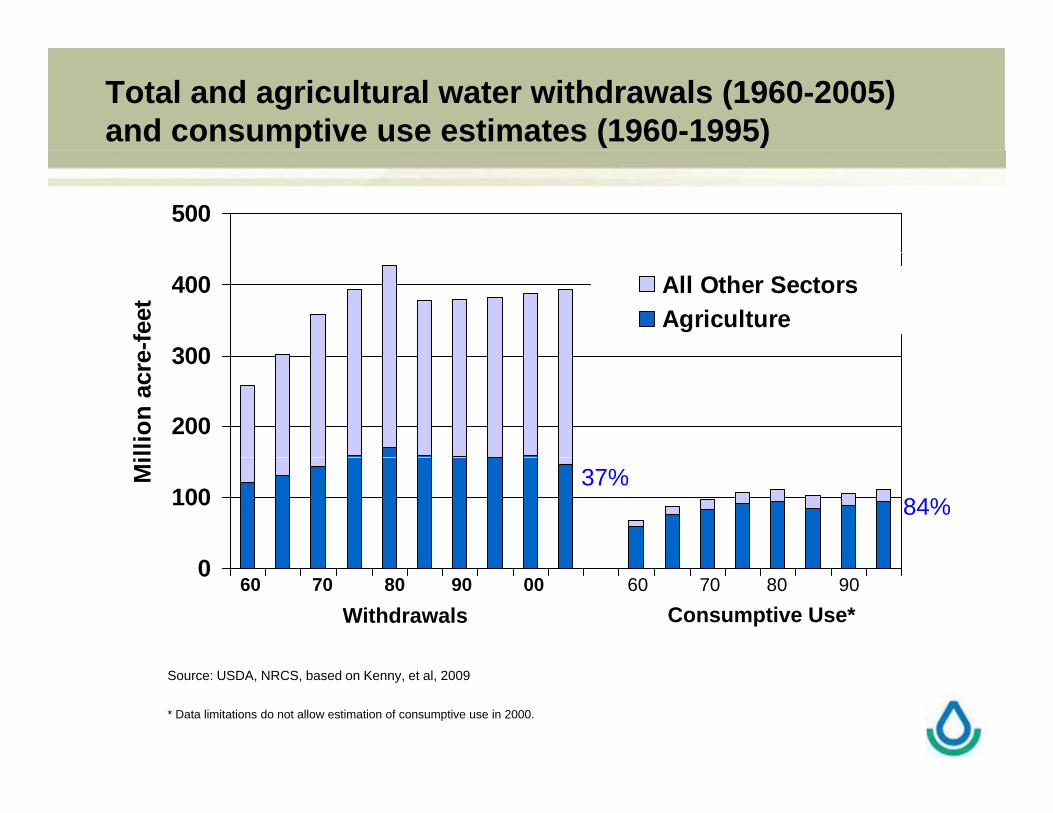
Total and agricultural water withdrawals (1960-2005) and consumptive use estimates (1960-1995)
500
300
400
e-fe
et
All Other SectorsAgriculture
200
300
llion
acr
e
0
100
Mi
37%84%
0
Withdrawals Consumptive Use*60 70 80 90 00 60 70 80 90
Source: USDA, NRCS, based on Kenny, et al, 2009
* Data limitations do not allow estimation of consumptive use in 2000.
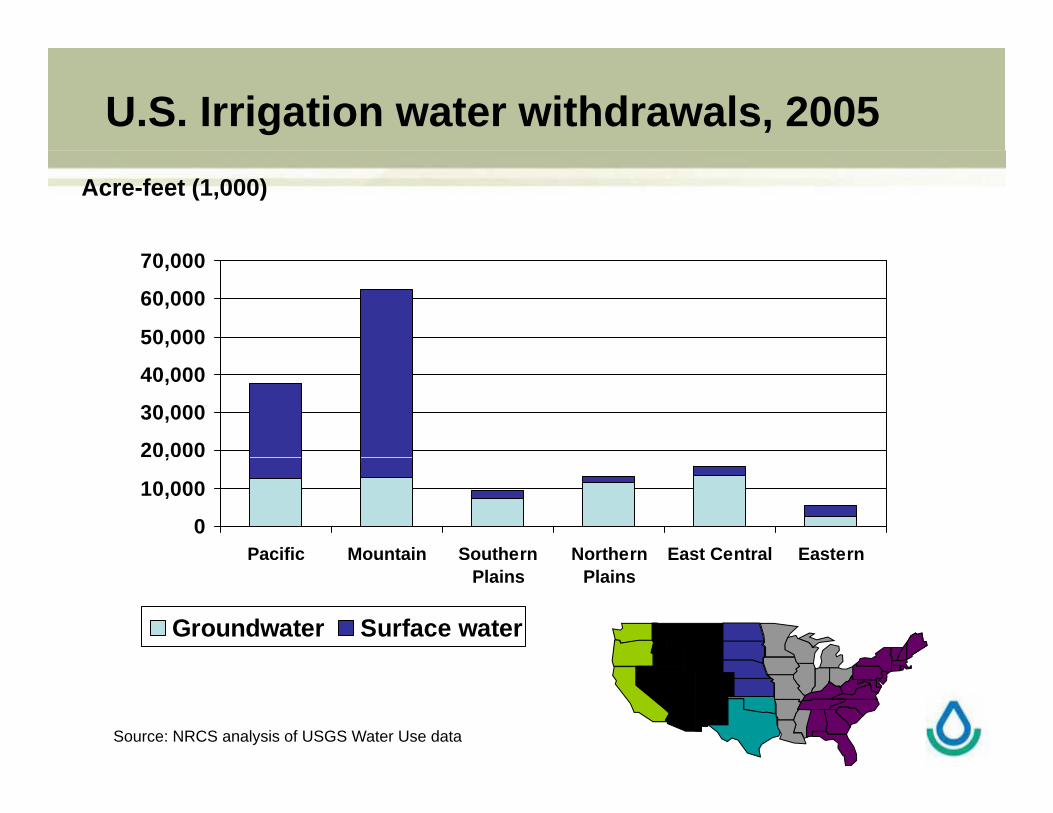
U.S. Irrigation water withdrawals, 2005Acre-feet (1,000)
0 000
50,000
60,000
70,000
20,000
30,000
40,000
0
10,000
,
Pacific Mountain Southern Northern East Central EasternPlains Plains
Groundwater Surface water
Source: NRCS analysis of USGS Water Use data
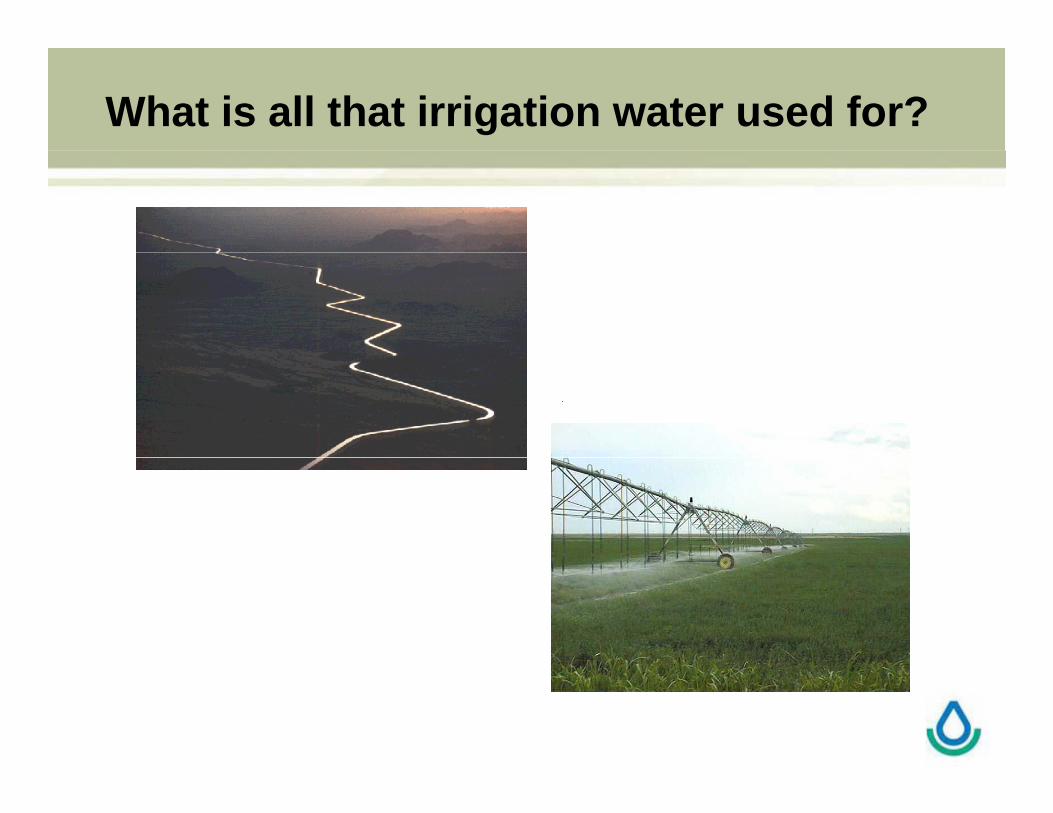
What is all that irrigation water used for?
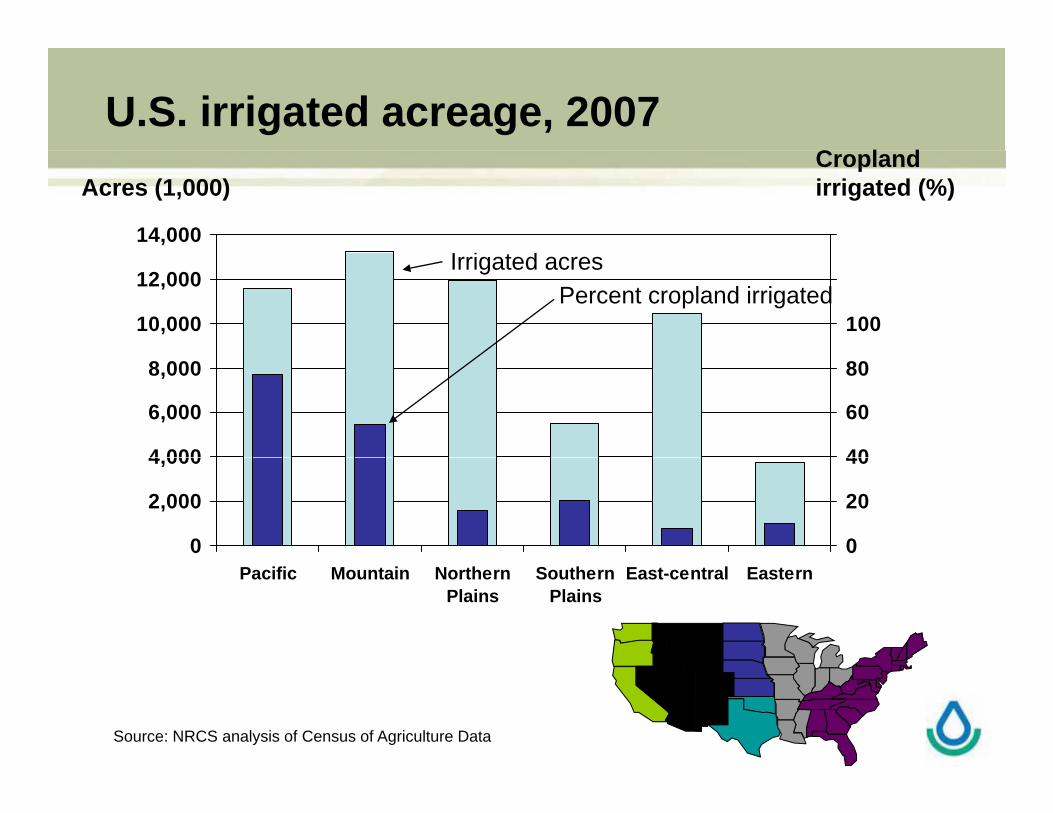
U.S. irrigated acreage, 2007C l d
14,000 140
Acres (1,000)Cropland irrigated (%)
I i t d
10,000
12,000
100
120Irrigated acres
Percent cropland irrigated
4 000
6,000
8,000
40
60
80
0
2,000
4,000
0
20
40
Pacific Mountain NorthernPlains
SouthernPlains
East-central Eastern
Source: NRCS analysis of Census of Agriculture Data
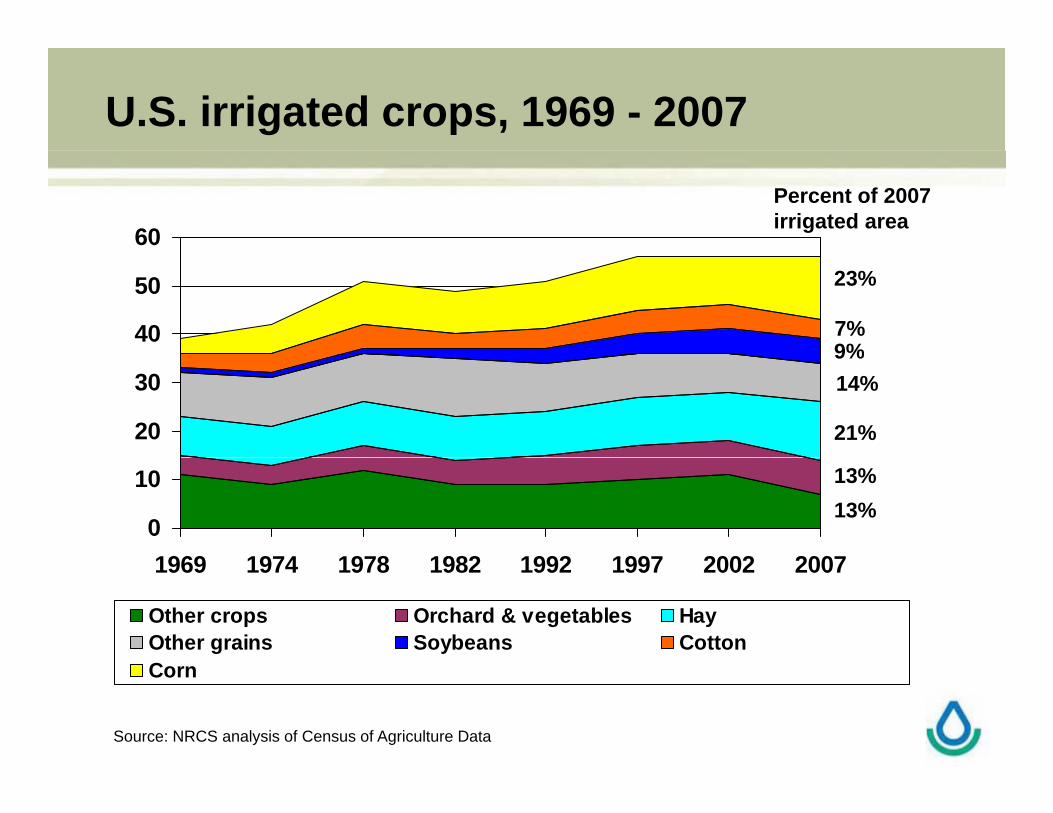
U.S. irrigated crops, 1969 - 2007
60
Percent of 2007 irrigated area
40
50 23%
9%7%
20
309%
21%
14%
0
10
1969 1974 1978 1982 1992 1997 2002 2007
13%13%
1969 1974 1978 1982 1992 1997 2002 2007
Other crops Orchard & vegetables HayOther grains Soybeans CottonCCorn
Source: NRCS analysis of Census of Agriculture Data
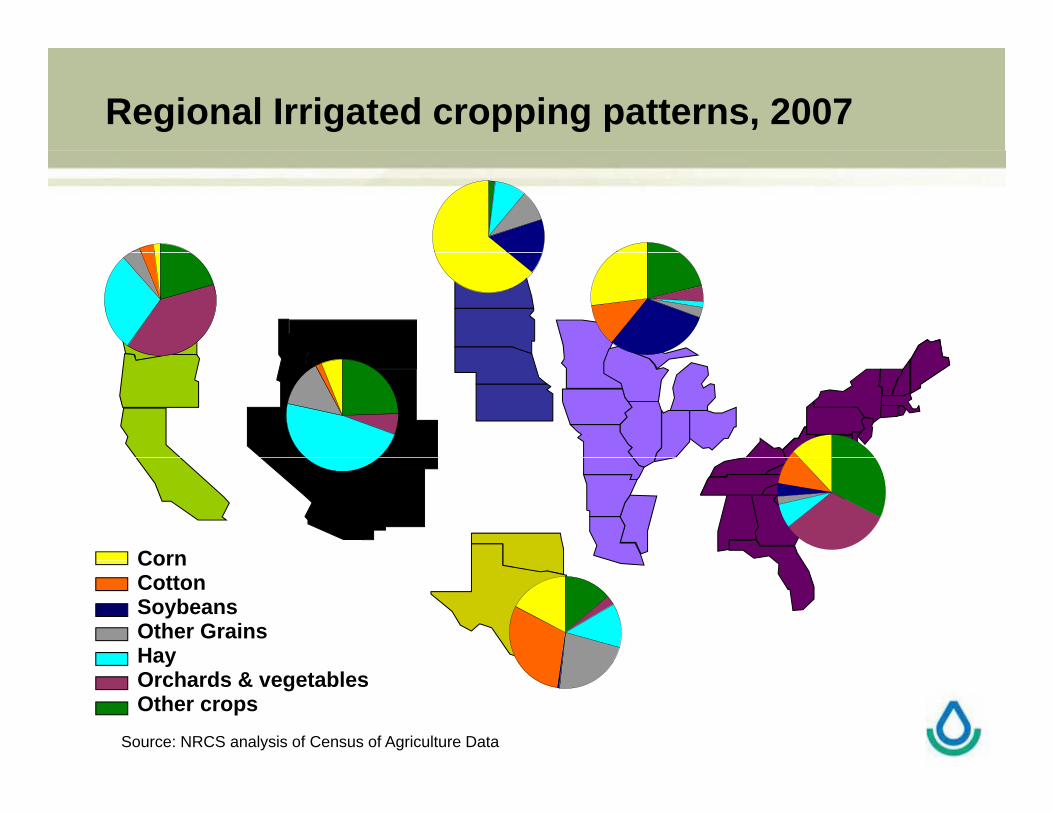
Regional Irrigated cropping patterns, 2007
CornCornCottonSoybeansOther GrainsHay
Source: NRCS analysis of Census of Agriculture Data
yOrchards & vegetablesOther crops
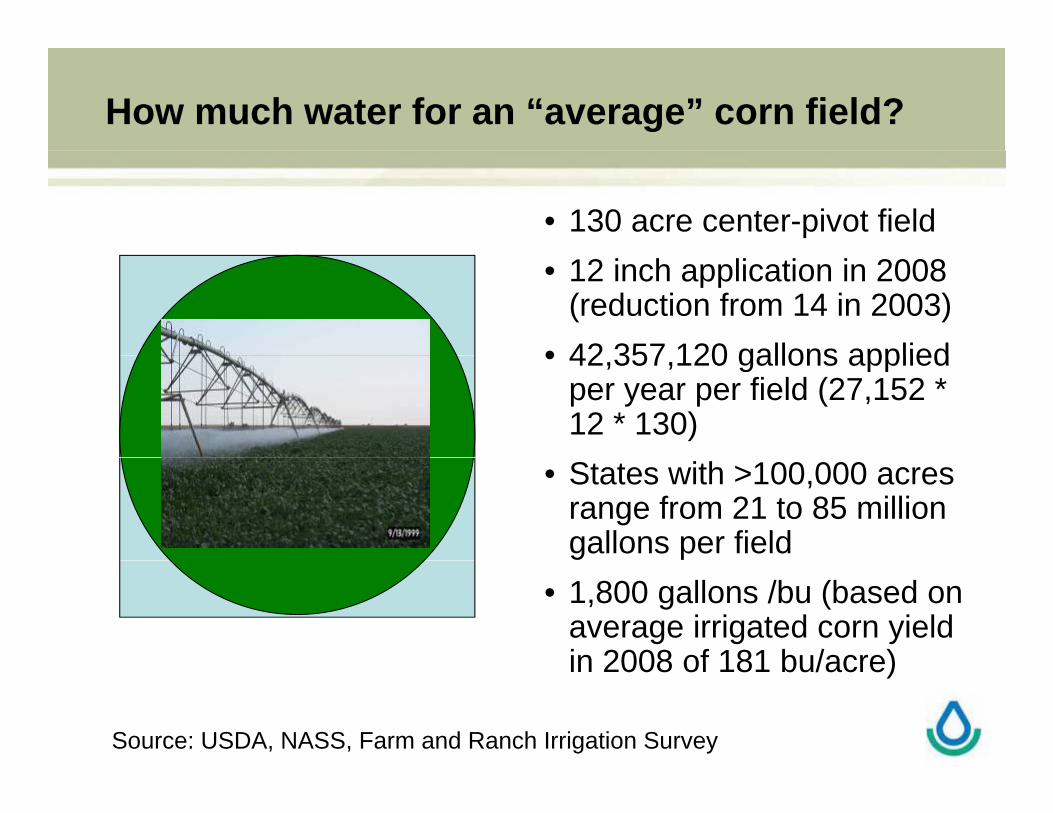
How much water for an “average” corn field?
• 130 acre center-pivot field• 12 inch application in 2008
(reduction from 14 in 2003)• 42 357 120 gallons applied• 42,357,120 gallons applied
per year per field (27,152 * 12 * 130)
• States with >100,000 acres range from 21 to 85 million gallons per field
• 1,800 gallons /bu (based on average irrigated corn yield in 2008 of 181 bu/acre)in 2008 of 181 bu/acre)
Source: USDA, NASS, Farm and Ranch Irrigation Survey
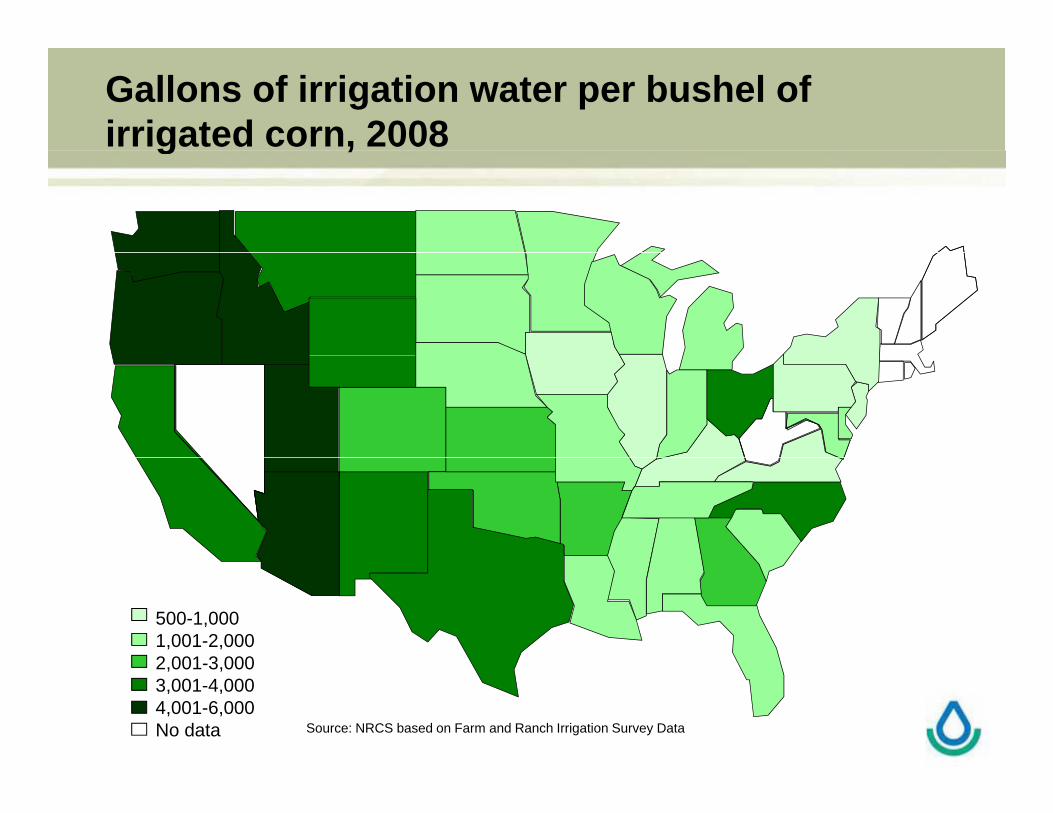
Gallons of irrigation water per bushel of irrigated corn, 2008g ,
500-1,0001,001-2,0002 001 3 0002,001-3,0003,001-4,0004,001-6,000No data Source: NRCS based on Farm and Ranch Irrigation Survey Data
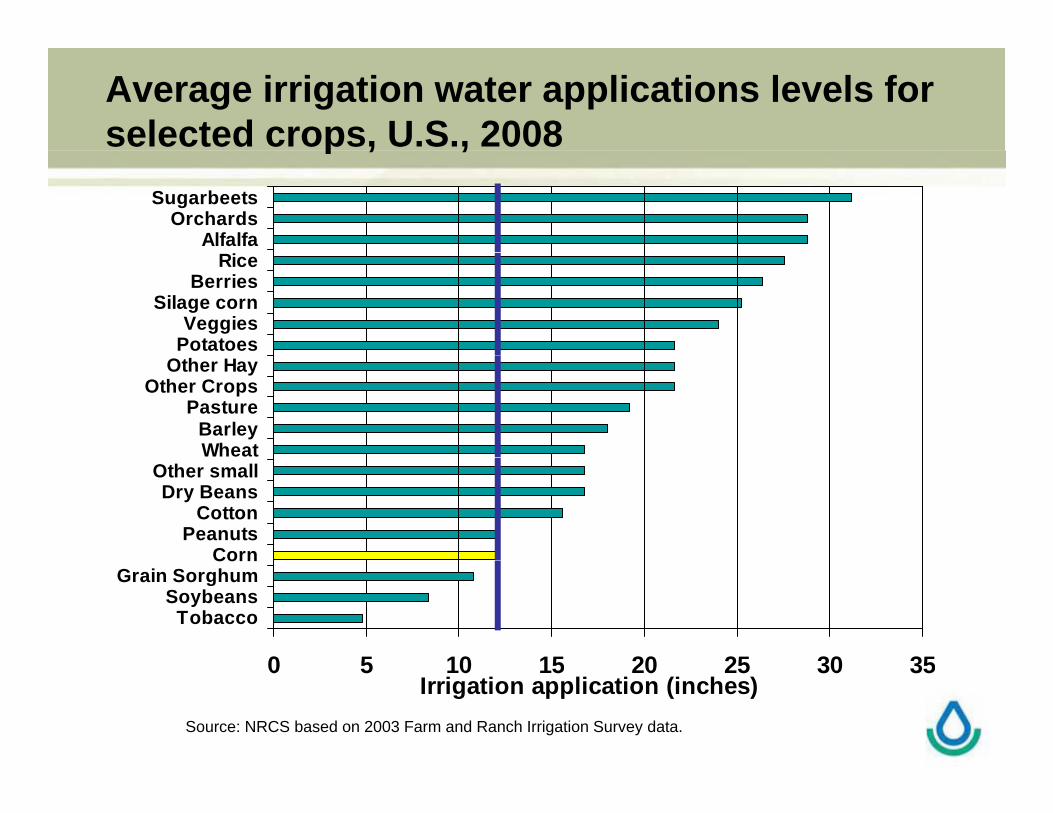
Average irrigation water applications levels for selected crops, U.S., 2008p , ,
AlfalfaOrchards
Sugarbeets
PotatoesVeggies
Silage cornBerries
Rice
WheatBarley
PastureOther Crops
Other Hay
CornPeanuts
CottonDry Beans
Other small
0 5 10 15 20 25 30 35
TobaccoSoybeans
Grain SorghumCorn
0 5 10 15 20 25 30 35Irrigation application (inches)
Source: NRCS based on 2003 Farm and Ranch Irrigation Survey data.
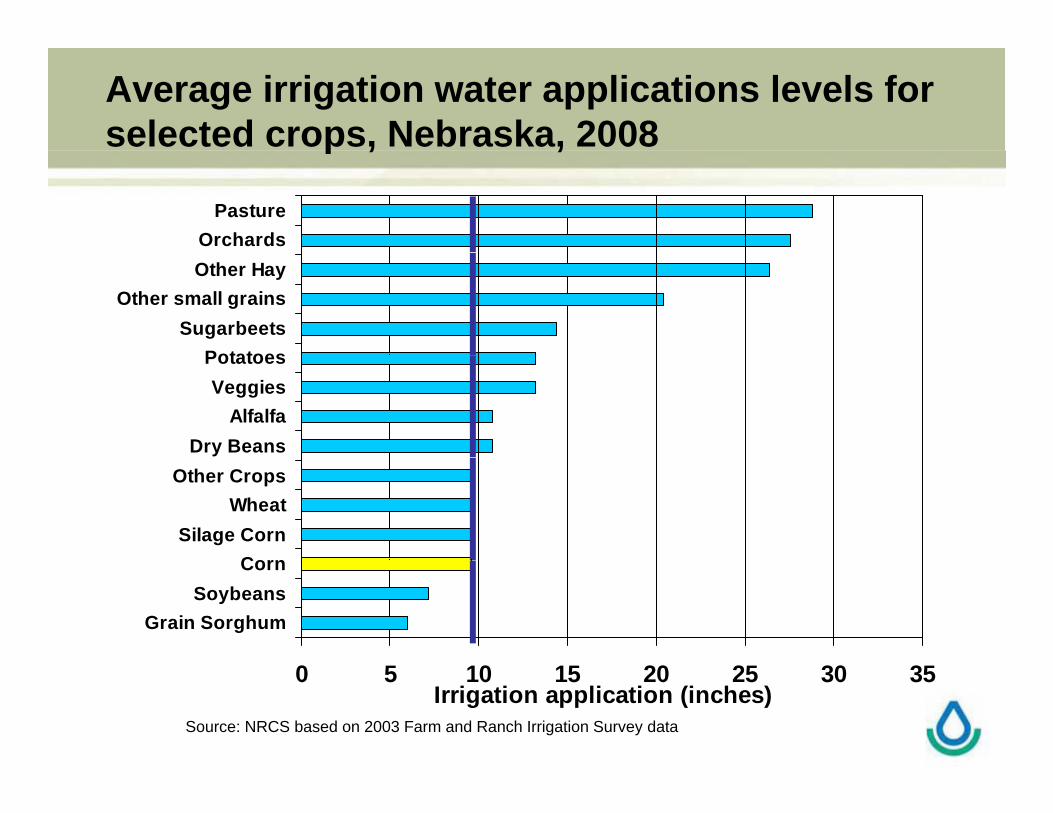
Average irrigation water applications levels for selected crops, Nebraska, 2008p , ,
OrchardsPasture
PotatoesSugarbeets
Other small grainsOther Hay
Dry BeansAlfalfa
VeggiesPotatoes
CornSilage Corn
WheatOther Crops
Grain SorghumSoybeans
Corn
0 5 10 15 20 25 30 35Irrigation application (inches)
Source: NRCS based on 2003 Farm and Ranch Irrigation Survey data
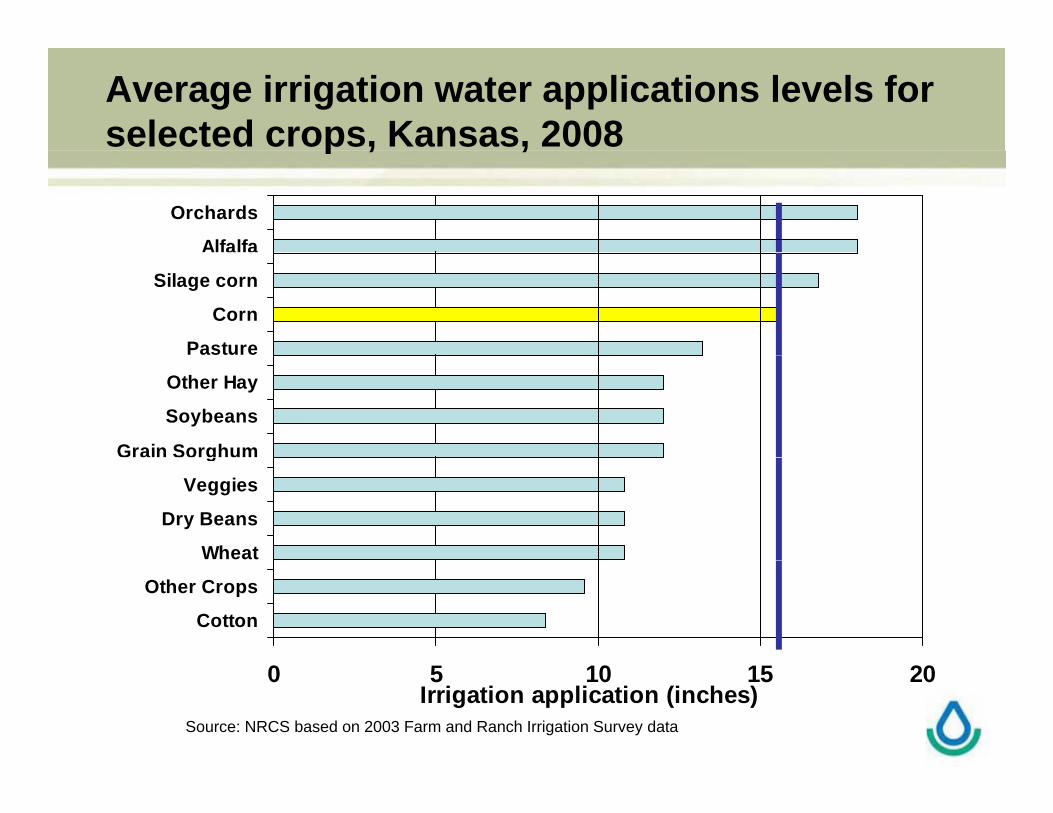
Average irrigation water applications levels for selected crops, Kansas, 2008p , ,
Alfalfa
Orchards
Pasture
Corn
Silage corn
Alfalfa
Grain Sorghum
Soybeans
Other Hay
Wheat
Dry Beans
Veggies
g
Cotton
Other Crops
0 5 10 15 20Irrigation application (inches)
Source: NRCS based on 2003 Farm and Ranch Irrigation Survey data
Biofuel feedstock production and potential irrigation water demandpotential irrigation water demand
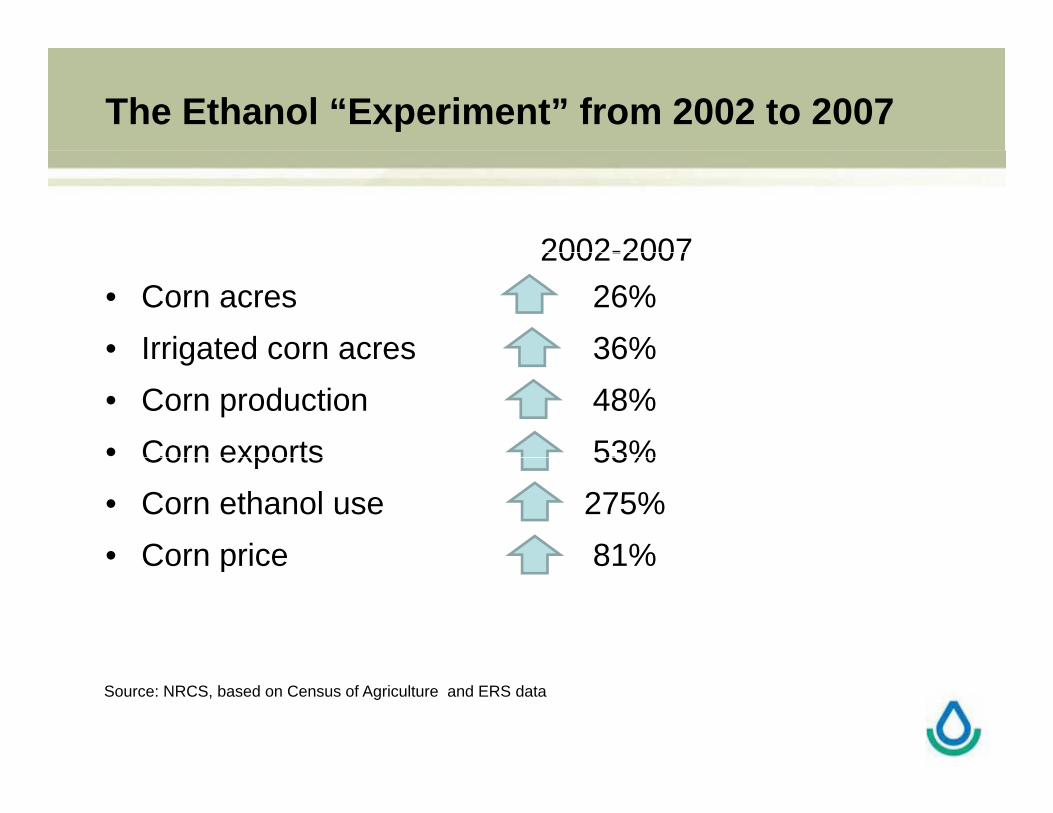
The Ethanol “Experiment” from 2002 to 2007
2002-2007• Corn acres 26%• Irrigated corn acres 36%
2002-2007
Irrigated corn acres 36%• Corn production 48%• Corn exports 53%Corn exports 53%• Corn ethanol use 275%• Corn price 81%Corn price 81%
Source: NRCS, based on Census of Agriculture and ERS data
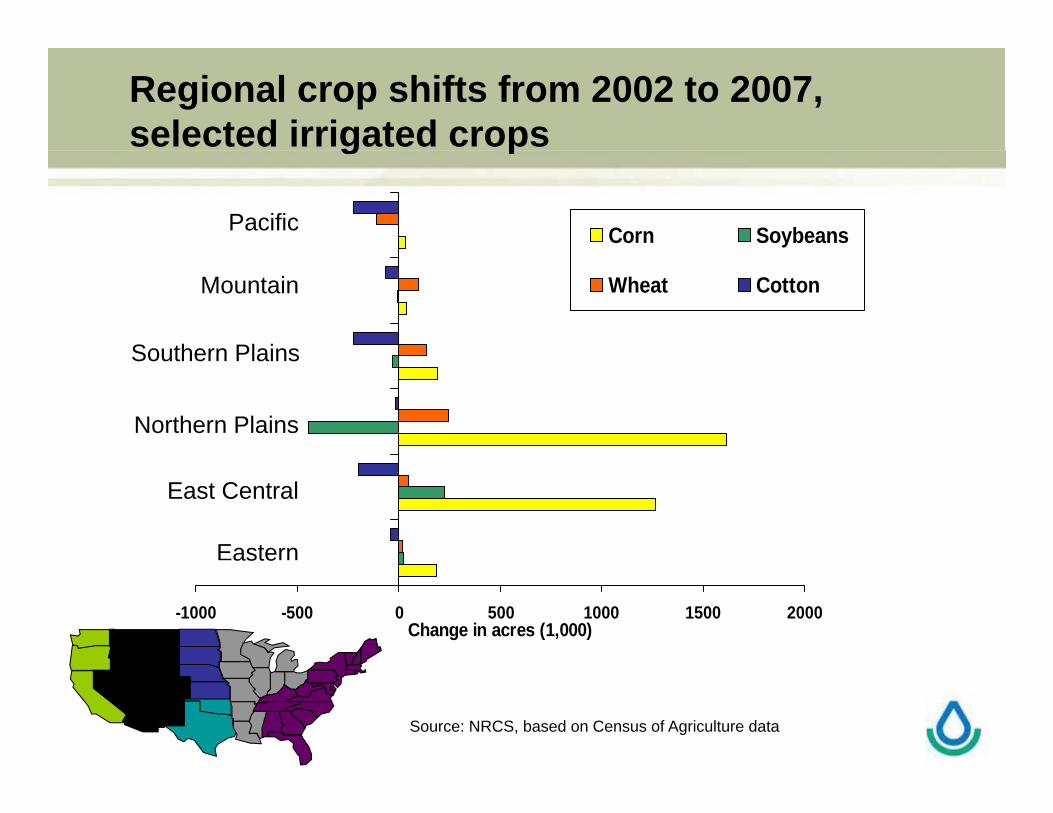
Regional crop shifts from 2002 to 2007, selected irrigated cropsg p
Corn SoybeansPacific
Wheat CottonMountain
Southern PlainsSouthern Plains
Northern Plains
Eastern
East Central
-1000 -500 0 500 1000 1500 2000Change in acres (1,000)
aste
Source: NRCS, based on Census of Agriculture data
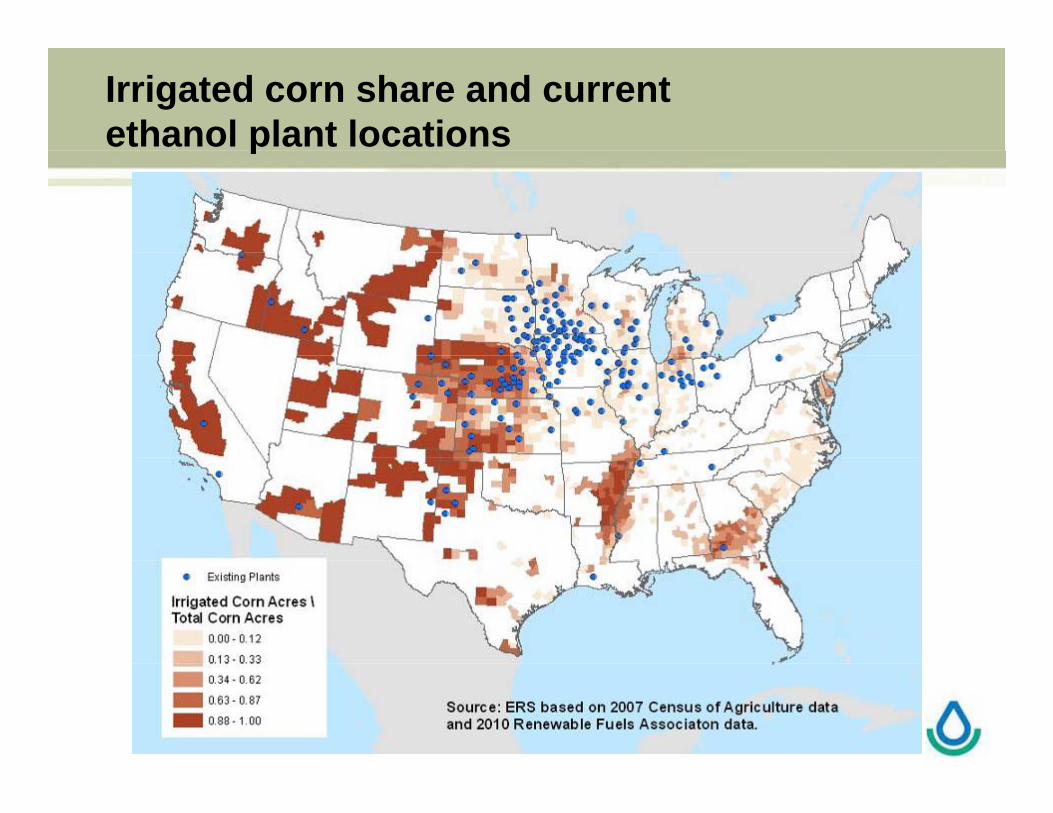
Irrigated corn share and current ethanol plant locations p
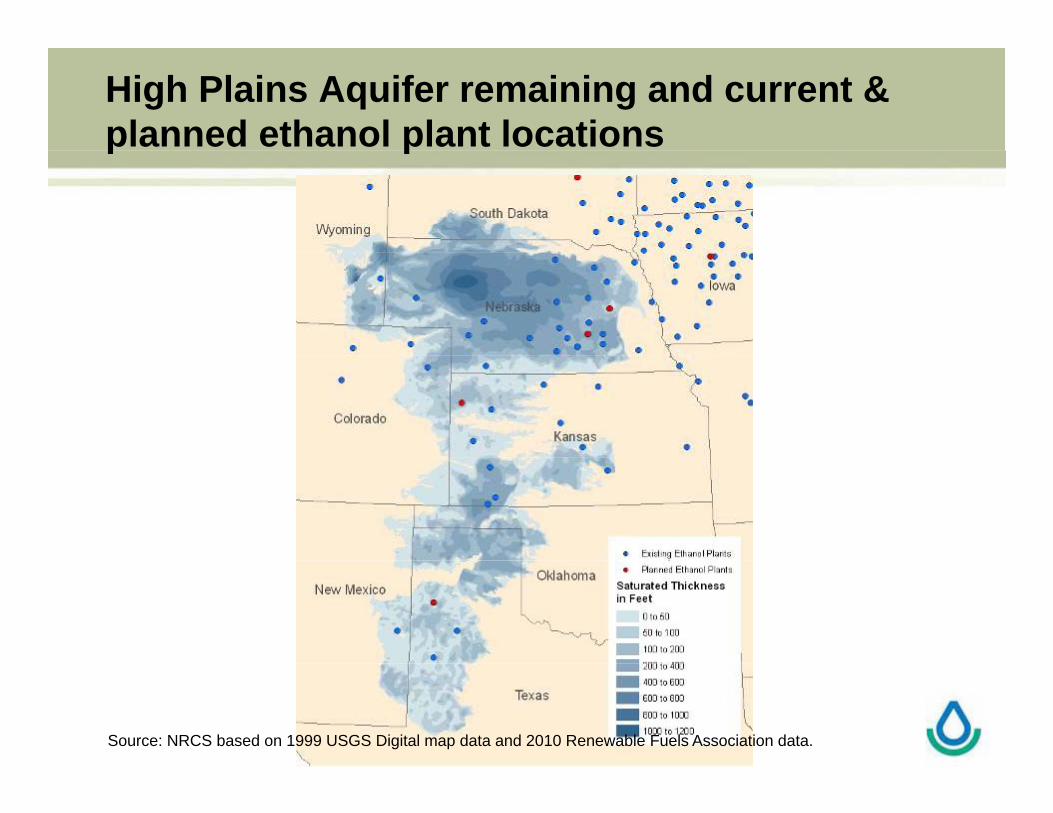
High Plains Aquifer remaining and current & planned ethanol plant locations p p
Source: NRCS based on 1999 USGS Digital map data and 2010 Renewable Fuels Association data.
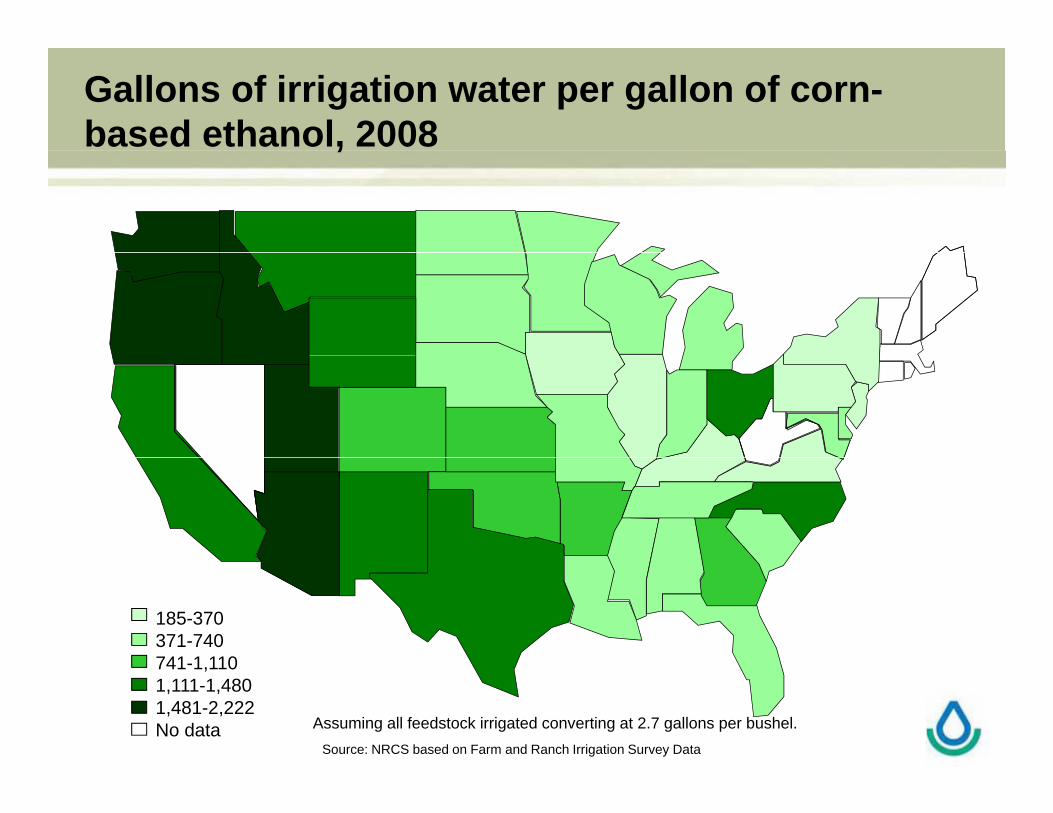
Gallons of irrigation water per gallon of corn-based ethanol, 2008,
185-370371-740741 1 110741-1,1101,111-1,4801,481-2,222No data Assuming all feedstock irrigated converting at 2.7 gallons per bushel.
Source: NRCS based on Farm and Ranch Irrigation Survey Data
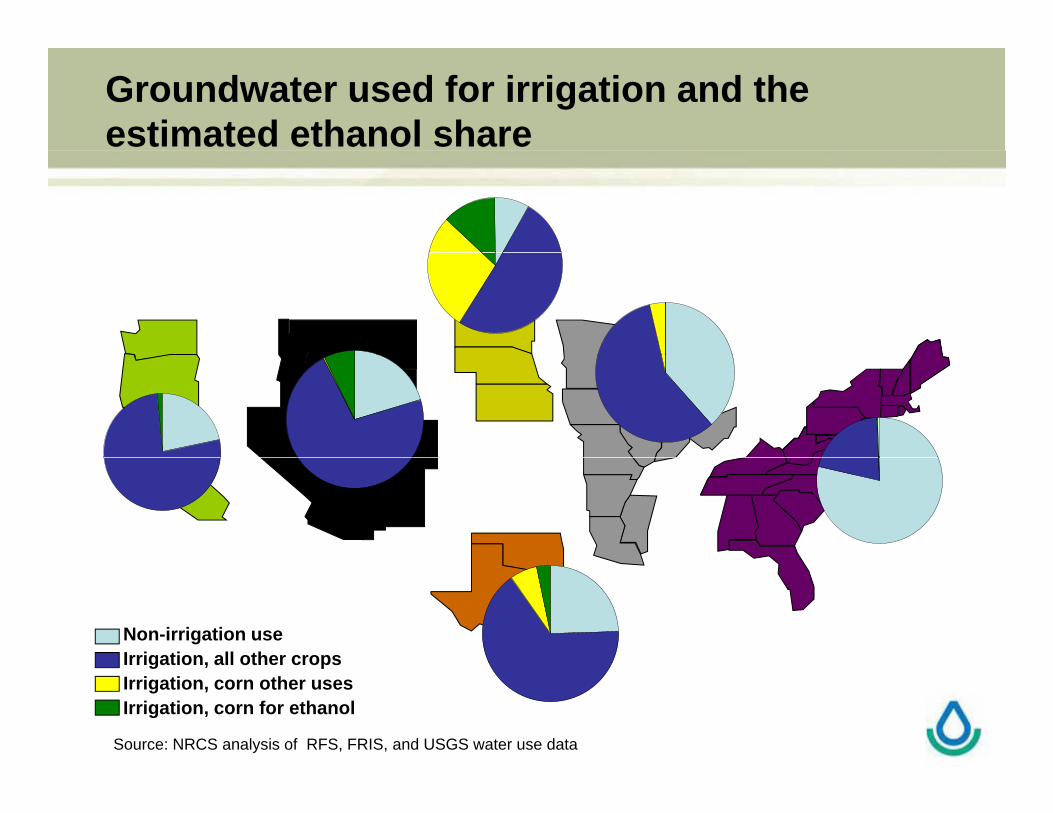
Groundwater used for irrigation and the estimated ethanol share
Non-irrigation useIrrigation, all other crops
Source: NRCS analysis of RFS, FRIS, and USGS water use data
Irrigation, all other cropsIrrigation, corn other usesIrrigation, corn for ethanol
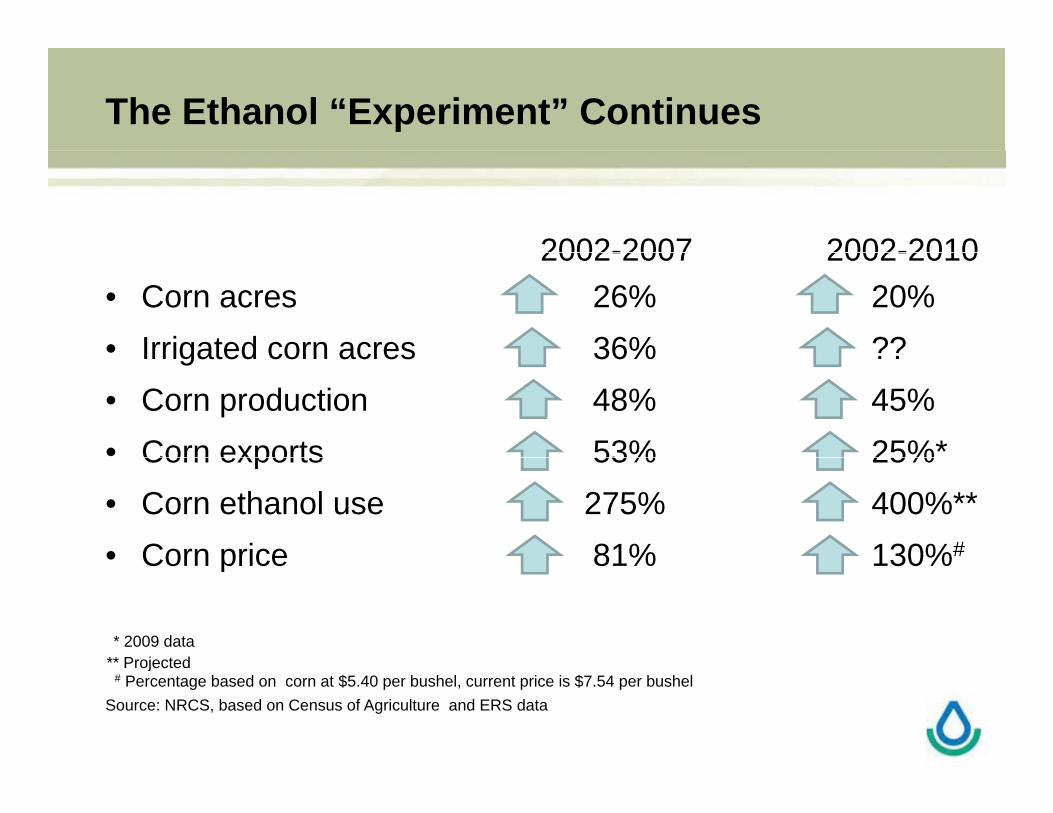
The Ethanol “Experiment” Continues
2002-2007 2002-2010• Corn acres 26% 20%• Irrigated corn acres 36% ??
2002-2007 2002-2010
Irrigated corn acres 36% ??• Corn production 48% 45%• Corn exports 53% 25%*Corn exports 53% 25%• Corn ethanol use 275% 400%**• Corn price 81% 130%#Corn price 81% 130%
* 2009 data ** Projected
Source: NRCS, based on Census of Agriculture and ERS data
Projected # Percentage based on corn at $5.40 per bushel, current price is $7.54 per bushel
Biofuel Feedstock Summary
• In the short run, increased agricultural production for biofuels has not dramaticallyproduction for biofuels has not dramatically altered the national view of water use.
• Growing crops for next generation of biofuelGrowing crops for next generation of biofuel production will have a more significant regional and local impact
I i i t In some cases an increase in water use In other cases a decrease, depending on the crops
being grown now and the biofuel crops producedg g p p In some cases an impact on groundwater by driving
demand for irrigation water
National Irrigation Overview Summary
• Irrigation is: A leading sector for water withdrawals; The dominant sector for consumptive water use;
Ch t i d b l l f li d t th t Characterized by large volumes of applied water that can vary greatly by crop and region; and
An important, widespread agricultural practice.p , p g p
• Irrigation with Groundwater is: Located in all regions; andg ; The major water source for agricultural production in
eastern 2/3 of the Nation.