Embed Size (px)
Citation preview
Repc)rt 297
GrcJund-Water' Res,ources ofRusk C:ourlty, ~reX.as
April 1987
TEXAS WATER DEVELOPMENT BOARD
REPORT 297
GROUND-WATER RESOURCES OF
RUSK COUNTY, TEXAS
By
W. M. SandeenU.S. Geological Survey
This report was prepared by theU.S. Geological Survey under cooperative agreement
with the Texas Water Development Board
April 1987
TEXAS WATER DEVELOPMENT BOARD
Charles E. NElmir. Executive Administrator
Thomas M. Dunning. ChairmanGlen E. RoneyCharles W. Jenness
Stuart S. Coleman, Vice ChairmanGeorge W. McCleskeyLouie Welch
A uthorization for use or reproduction ofany originalmaterial contained in thispublication. i. e.• not obtained from other sources, is freely granted. The Boardwould appreciate acknowledgement.
Published and distributedby the
Texas Water Development BoardPost Office Box 13231Austin, Texas 78711
FOREWORD
Effective Septembelr 1, 1985, the Texas Department of Water Resourceswas divided to form the Texas Water Commission and the Texas Water Development Board. A number of publications prepared under the auspices of theDepartment are being published by the Texas Water Commission. To minimizedelays in producing these publications, references to the Department willnot be altered except on their covers and title pages.
iii
ABSTRACT
Fresh to slightly saline water is available in most parts of Rusk County, which is located in thePiney Woods region of northeast Texas. The Wilcox aquifer, which underlies the entire county,was the source of most of the ground water withdrawn during 1980. Other units capable ofyielding fresh ground water are the Carrizo, Queen City, and Sparta aquifers and the ReklawFormation.
About 5.4 million gallons per day of ground water was used for all purposes during 1980. Ofthis amount, about 78 percent was used for public supply, 10 percent for mining, 8 percent forindustrial purposes, and 4 percent for rural domestic use. Water levels have declined extensivelyat the city of Henderson, which used about 38 percent of all ground water consumed in RuskCounty.
Generally, the ground water is of acceptable quality. Water in some of the near-surface bedsand some of the deeper sands in the Wilcox aquifer may have become mineralized because ofoilfield operations. Ground-water contamination by oilfield brines at Henderson Oil Field hasbeen documented. Two separate instances of streamflow contamination at Striker Creek andHenderson Oil Field have been documented.
Moderate amounts of ground water are available for development. The amount that isavailable perennially is not known, but it is greater than that being withdrawn. Assuming ahydraulic gradient of about 8 feet per mile, at least 12 million gallons per day of fresh groundwater is being transmitted throuHh the Wilcox and about 3 million gallons per day through theCarrizo. About 20 million acre-feet of fresh ground water is available from storage in the Wilcoxand about 4 million acre-feet from storage in the Carrizo. Additional amounts of slightly salinewater are available from the major aquifers. Smaller but undetermined amounts of fresh groundwater are available from the Sparta and Queen City aquifers and from the Reklaw Formation.Properly constructed wells in the Wilcox and Carrizo aquifers can be expected to yield more than500 gallons per minute if the wl:llls are properly spaced. Development of additional resourcesaround the city of Henderson and the Mount Enterprise Fault System should be consideredcautiously because of the probability of saltwater encroachment. Ground water in other parts ofthe county is practically undeveloped.
Some mineralization of ground water is due to natural causes. Other mineralization ofground water is due to contamination. A program needs to be initiated to determine the extent andcause of mineralization that has taken place in freshwater sands. Water-quality data are neededat Henderson in order to monitor saltwater encroachment.
v
TABLE OF CONTENTS
Page
ABSTRACT v
INTRODUCTION .
Location and Extent of Area ..
Purpose and Scope 1
Methods of Investigation " . . . . . . . . . . . . . . . . . . . . . . . . . . . . . . . . . . . . . . . . . . . . . . . . 2
Physiography, Drainage, and Climate 3
Economic Development 4
Population ., " " , 4
Previous Investigations 5
Acknowledgments . . . . . . . . . . . . . . . . . . . . . . . . . . . . . . . . . . . . . . . . . . . . . . . . . . . . . . . . . . . . . . . . . . . . . . 6
Well-numbering System 6
Definitions of Terms 7
Metric Conversions . . . . . . . . . . . . . . . . . . . . . . . . . . . . . . . . . . . . . . . . . . . . . . . . . . . . . . . . . . . . . . . . . . . . . 11
GEOLOGIC FRAMEWORK AND PHYSICAL CHARACTERISTICSOF THE GEOLOGIC UNITS 12
Midway Group 13
Wilcox Group .
Carrizo ·Sand .
21
21
Reklaw Formation 21
Queen City Sand 25
vii
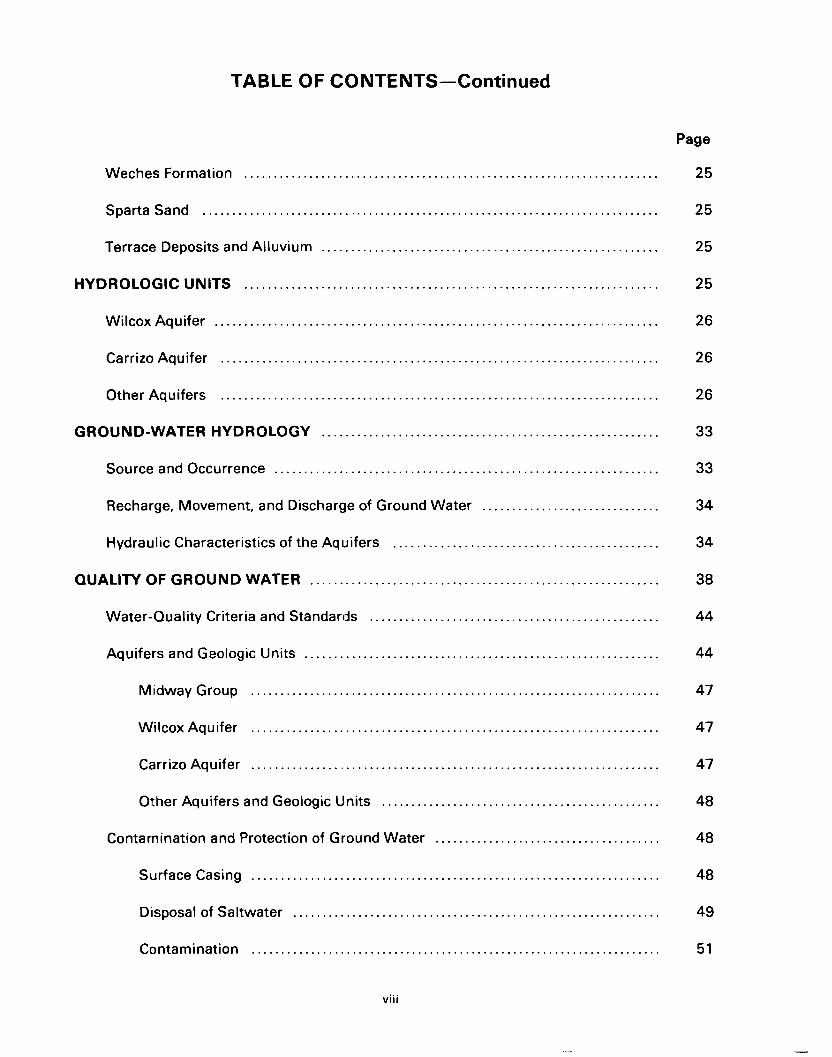
TABLE OF CONTENTS-Continued
Weches Formation .
Sparta Sand .., " " .
Terrace Deposits and Alluvium .
HYDROLOGIC UNITS .
Wilcox Aquifer .
Carrizo Aquifer
Other Aquifers
GROUND-WATER HYDROLOGY .
Source and Occurrence , .
Recharge, Movement. and Discharge of Ground Water .
Hydraulic Characteristics of the Aquifers ..
QUALITY OF GROUND WATER .
Water-Quality Criteria and Standards .
Aquifers and Geologic Units ..
Midway Group
Wilcox Aquifer
Carrizo Aquifer
Other Aquifers and Geologic Units .
Contamination and Protection of Ground Water .
Surface Casing .
Disposal of Saltwater .
Contamination .
viii
Page
25
25
25
25
26
26
26
33
33
34
34
38
44
44
47
47
47
48
48
48
49
51
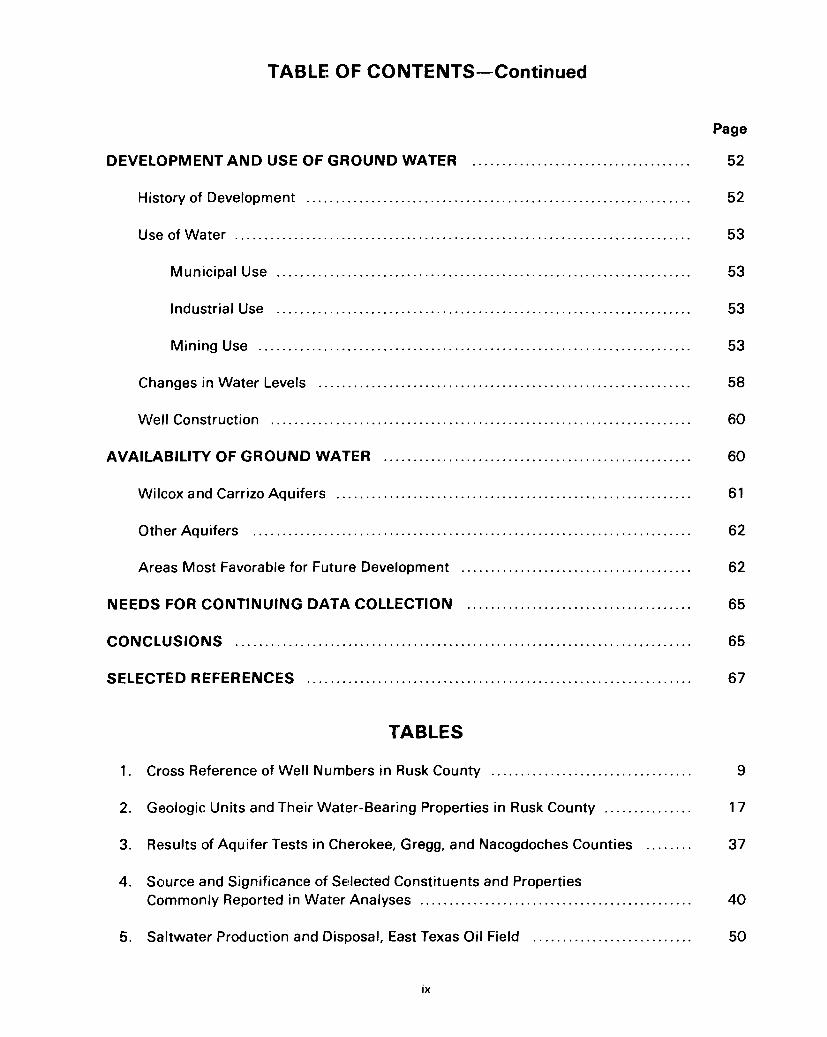
TABLE OF CONTENTS-Continued
Page
DEVELOPMENT AND USE OF GROUND WATER 52
History of Development 52
Use of Water 53
Municipal Use
Industrial Use
53
53
Mining Use 53
Changes in Water Levels 58
Well Construction .. , . . . . . . . . . . . . . . . . . . . . . . . . . . . . . . . . . . . . . . . . . . . . . . . . . . . . . . . . . . . . . . . . . . . . 60
AVAILABILITY OF GROUND WATER 60
Wilcox and Carrizo Aquifers 61
Other Aquifers ".. . . . . . . . . .. . . . .. . . . . . . . . .. . . .. . . . . . . . . . . . . . . . . . . . . . .. . . . .. 62
Areas Most Favorable for Future Development
NEEDS FOR CONT1NUING DATA COLLECTION
62
65
CONCLUSIONS 65
SELECTED REFERENCES 67
TABLES
1. Cross Reference of Well Numbers in Rusk County 9
2. Geologic Units and Their Water-Bearing Properties in Rusk County 17
3. Results of Aquifer Tests in Cherokee, Gregg, and Nacogdoches Counties 37
4. Source and Significance of Selected Constituents and PropertiesCommonly Reported in Water Analyses 40
5. Saltwater Production and Disposal, East Texas Oil Field 50
ix
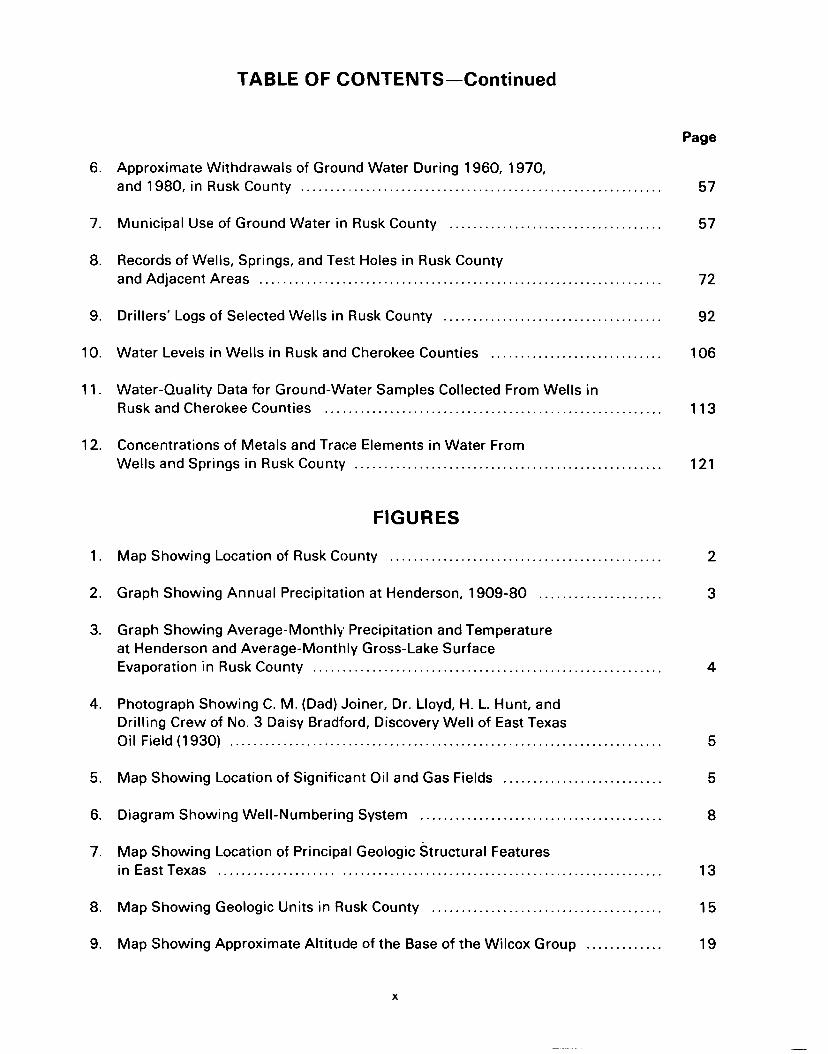
TABLE OF CONTENTS-Continued
Page
6. Approximate Withdrawals of Ground Water During 1960, 1970,and 1980, in Rusk County 57
7. Municipal Use of Ground Water in Rusk County 57
8. Records of Wells, Springs, and Test Holes in Rusk Countyand Adjacent Areas 72
9. Drillers' Logs of Selected Wells in Rusk County 92
10. Water Levels in Wells in Rusk and Cherokee Counties 106
11. Water-Quality Data for Ground-Water Samples Collected From Wells inRusk and Cherokee Counties 113
12. Concentrations of Metals and Trace Elements in Water FromWells and Springs in Rusk County.................................................... 121
FIGURES
1. Map Showing Location of Rusk County 2
2. Graph Showing Annual Precipitation at Henderson, 1909-80 3
3. Graph Showing Average-Monthly Precipitation and Temperatureat Henderson and Average-Monthly Gross-Lake SurfaceEvaporation in Rusk County 4
4. Photograph Showing C. M. (Dad) Joiner, Dr. Lloyd, H. L. Hunt, andDrilling Crew of No.3 Daisy Bradford, Discovery Well of East TexasOil Field (1930) 5
5. Map Showing Location of Significant Oil and Gas Fields 5
6. Diagram Showing Well-Numbering System 8
7. Map Showing Location of Principal Geologic Structural Featuresin East Texas 13
8. Map Showing Geologic Units in Husk County 15
9. Map Showing Approximate Altitude of the Base of the Wilcox Group 19
x
TABLE OF CONTENTS-Continued
Page
10. Map Showing Approximate Altitude of the Top of the Wilcox Group 23
11. Map Showing Approximate Thickness of Freshwater-Bearing Sandsin the Wilcox Aquifer, 1981 27
12. Map Showing Approximate Altitude of the Base of Freshwater, 1981 29
13. Map Showing Approximatl~Altitude of the Base of SlightlySaline Water, 1981 31
14. Photograph Showing Ground Water Seeping From Sand Layers in theCarrizo Aquifer at the Ross Clay Pit North of the City of Henderson 33
15. Map Showing Approximatl~Altitude of the Potentiometric Surfaceof the Wilcox Aquifer, 1979-81 ., . . . . . . . . . . . .. . . . . . . . .. . . . . . . . . . . . . . . . . . . . . . . .. . . . . . . . 35
16. Graph Showing Relationship of Drawdown to Transmissivityand Distance . . . . . . . . . . . . . . . . . . . . . . . . . . . . . . . . . . . . . . . . . . . . . . . . . . . . . . . . . . . . . . . . . . . . 39
17. Graph Showing Relationship of Drawdown to Time and Distanceas a Result of Pumping Under Artesian Conditions 39
18. Map Showing Total Dissolved-Solids Concentrations in Water FromSelected Wells Screened in the Wilcox, Carrizo, and Queen City Aquifersand in the Reklaw Formation, 1981 45
19. Graph Showing Relationship Between Surface-Casing Requirementsand the Base of Fresh to Slightly Saline Water, Rusk County 49
20. Map Showing ApproximatE! Areas Served by Rusk CountyPublic Water-Supply Systems 55
21. Photograph Showing Water-Storage Tank at Mobil's T. O. MasonPressure-Maintenance Project in East Texas Oil Field 58
22. Hydrographs Showing Fluctuations of Water Levels in Selected Wellsin Rusk and Cherokee Counties 59
23. Map Showing Locations of Areas Favorable for Future Developmentof Ground Water 63
24. Map Showing Location of Wells, Springs, and Selected Test Holes .. . . . . . . . . . . . . . 123
xi
TABLE OF CONTENTS-Continued
25. Geologic Section A-A'
26. Geologic Section 8-8'
27. Geologic Section C-C'
xii
Page
125
127
129
GROUND-WATER RESOURCES OF
RUSK COUNTY, TEXAS
ByW. M. Sandeen,
U.S. Geological Survey
INTRODUCTION
Location and Extent of Area
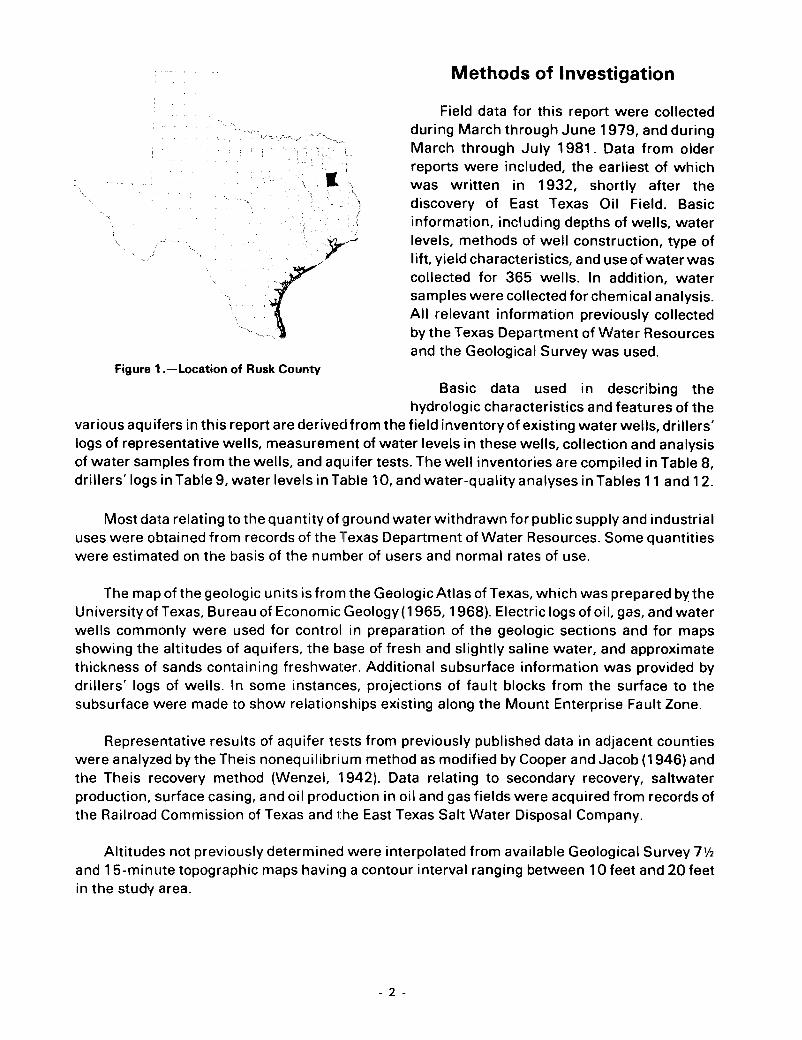
Rusk County, located in the Piney Woods region of northeast Texas, is bordered by Gregg andHarrison Counties on the north, Panola and Shelby Counties on the east, Nacogdoches County onthe south, and Cherokee and Smith Counties on the west (Figure 1). The city of Henderson, thecounty seat and largest city in thE! county, is about 135 miles east of Dallas and about 75 mileswest of Shreveport, Louisiana. Rusk County has an area of 939 square miles. Altitude ofthe landsurface ranges from 227 feet near the Sabine River to 709 feet near the town of Mount Enterprise.
Purpose and Scope
This is a report of a detailed investigation of the ground-water resources of Rusk Countybegun during 1979 by the U.S. Geological Survey in cooperation with the Texas Department ofWater Resources. After about 5 months of initial work, the project was deferred for lack of funds.Th'e project was resumed durin~1 1981, which made it necessary to update the 1979 data.The report now reflects 1981 water levels.
The purpose of the investigation was to determine the occurrence, availabil ity, dependabil ity,quality, and quantity of ground water present in the county. Special emphasis was placed upondescribing the quantity and quality of ground water suitable for public supply and industrial use.
The investigation included determining the extent of sands containing freshwater;documenting the chemical quality of the water; estimating the quantities of water beingwithdrawn; determining the effects of withdrawals on ground-water levels; estimating thehydraulic characteristics of the water-bearing sands; rating the area on the basis of ground-wateravailability; and determining the potential sources of contamination.
I.
Figure 1.-Location of Rusk County
Methods of Investigation
Field data for this report were collectedduring March through June 1979, and duringMarch through July 1981. Data from olderreports were included, the earliest of whichwas written in 1932, shortly after thediscovery of East Texas Oil Field. Basicinformation, including depths of wells, waterlevels, methods of well construction, type oflift, yield characteristics, and use of water wascollected for 365 wells. In addition, watersamples were collected for chemical analysis.All relevant information previously collectedby the Texas Department of Water Resourcesand the Geological Survey was used.
Basic data used in describing thehydrologic characteristics and features of the
various aquifers in this report are derived from the field inventory of existing water wells, drillers'logs of representative wells, measurement of water levels in these wells, collection and analysisof water samples from the wells, and aquifer tests. The well inventories are compiled in Table 8,drillers'logs in Table 9, water levels in Table 10, and water-quality analyses in Tables 11 and 12.
Most data relating to the quantity of ,ground water withdrawn for public supply and industrialuses were obtained from records of the Texas Department of Water Resources. Some quantitieswere estimated on the basis of the number of users and normal rates of use.
The map of the geologic units is from the GeologicAtlas of Texas, which was prepared by theUniversity of Texas, Bureau of Economic Geology(1965, 1968). Electric logs of oil, gas, and waterwells commonly were used for control in preparation of the geologic sections and for mapsshowing the altitudes of aquifers, the base of fresh and slightly saline water, and approximatethickness of sands containing freshwater. Additional subsurface information was provided bydrillers' logs of wells. In some instances, projections of fault blocks from the surface to thesubsurface were made to show relationships existing along the Mount Enterprise Fault Zone.
Representative results of aquifer tests from previously published data in adjacent countieswere analyzed by the Theis nonequilibrium method as modified by Cooper and Jacob (1946) andthe Theis recovery method (Wenzel, '1942). Data relating to secondary recovery, saltwaterproduction, surface casing, and oil production in oil and gas fields were acquired from records ofthe Railroad Commission of Texas and the East Texas Salt Water Disposal Company.
Altitudes not previously determined were interpolated from available Geological Survey 7V2and 15-minute topographic maps having a contour interval ranging between 10 feet and 20 feetin the study area.
- 2 -
Physiography, Drainage, and Climate
Rusk County is in the West Gulf Coastal Plain physiographic province (Fenneman, 1939) anda part of the Piney Woods region of East Texas. The most prominent physiographic feature is theMount Enterprise Fault System, which extends along aneast-west axis across the southern partof the county. The system forms a series of hills, some of which attain an altitude in excess of 600feet, extending from due east of Mount Enterprise to near Reklaw, where the system is somewhatoffset to the north. The land surface slopes away from these high ridges, generally to the northand to the south, interrupting a rElgional surface sloping in an easterly and southerly direction.Substantial growths of pine and hardwood occur throughout much of the county.
Springs commonly are found at higher and intermediate altitudes. Streams in thenortheastern part of the county drain to the Sabine River whereas those in the southwestern partdrain to the Neches River. Striker Creek and Bowles Creek drain into the Striker Creek Lake,Beaver Run and Tiawichi Creek into Lake Cherokee, and Martin Creek into Martin Lake.
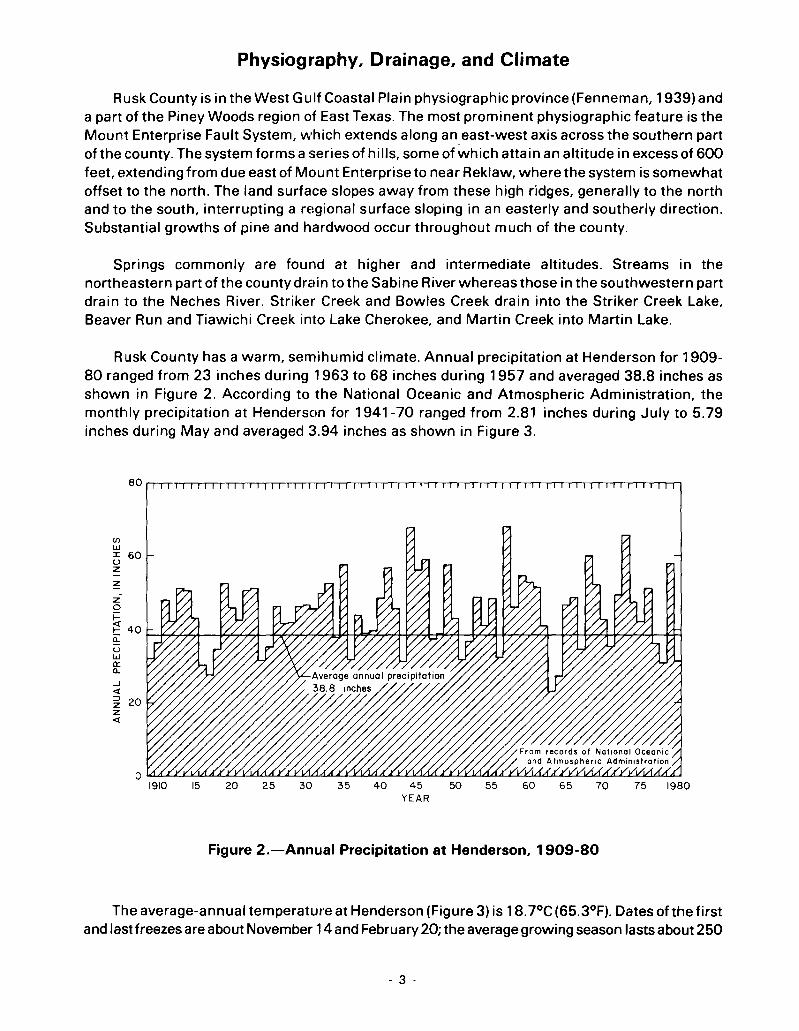
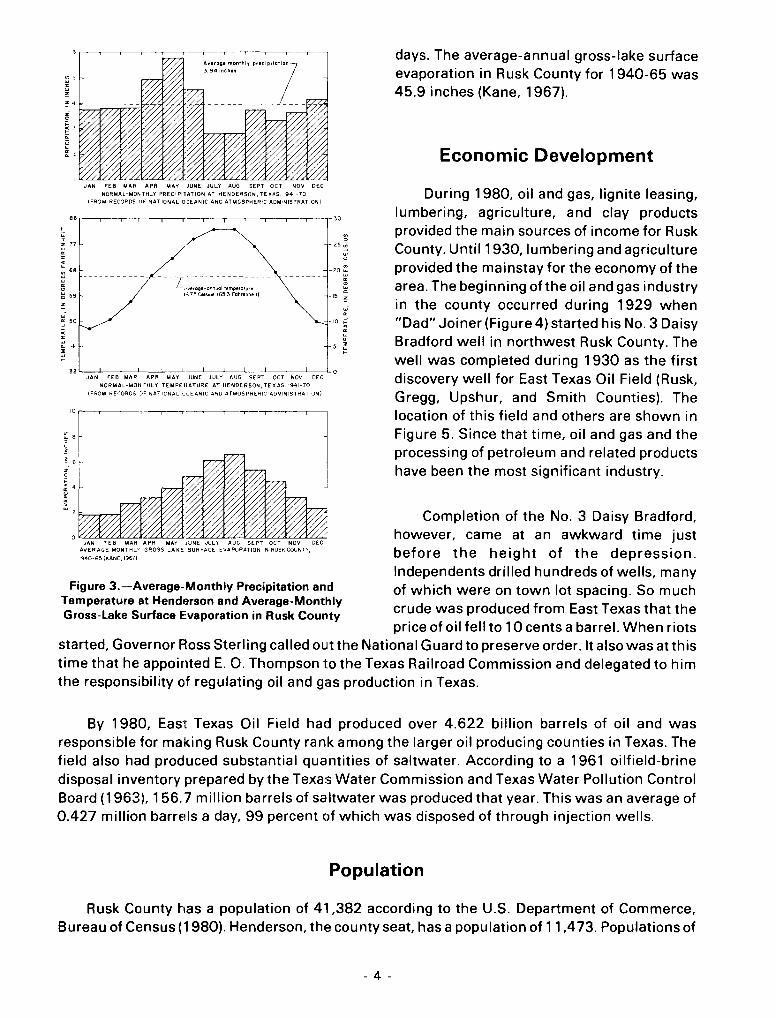
Rusk County has a warm, sernihumid climate. Annual precipitation at Henderson for 190980 ranged from 23 inches during 1963 to 68 inches during 1957 and averaged 38.8 inches asshown in Figure 2. According to the National Oceanic and Atmospheric Administration, themonthly precipitation at Henderson for 1941-70 ranged from 2.81 inches during July to 5.79inches during May and averaged 3:.94 inches as shown in Figure 3.
(f)lJJI 60uz
~
zof=~ 40a:: H~4L,+--¥'H-.~-*oI-T'-~7-Y~~~Y7q...j,o£.ht:-:rl'74--b,y.,,j-¥.,H-.H:>I--+4'lf-bo',,,,,*-¥7"Y7-::.,.r--#-I
ulJJQ:Q.
...J<l
~ 20z<l
1910 15 20 25 30 35 40 45 50 55YEAR
60 65 70 75 1980
Figure 2.-Annual Precipitation at Henderson, 1909-80
The average-annual temperature at Henderson (Figure 3) is 18.7°C (65.3°F). Dates ofthe firstand last freezes are about November 14and February 20; the average growing season lasts about 250
- 3 -
Averave-monlhly preCi Pita'7·"3.94Inene,
----------------
days. The average-annual gross-lake surfaceevaporation in Rusk County for 1940-65 was45.9 inches (Kane, 1967).
Economic Development
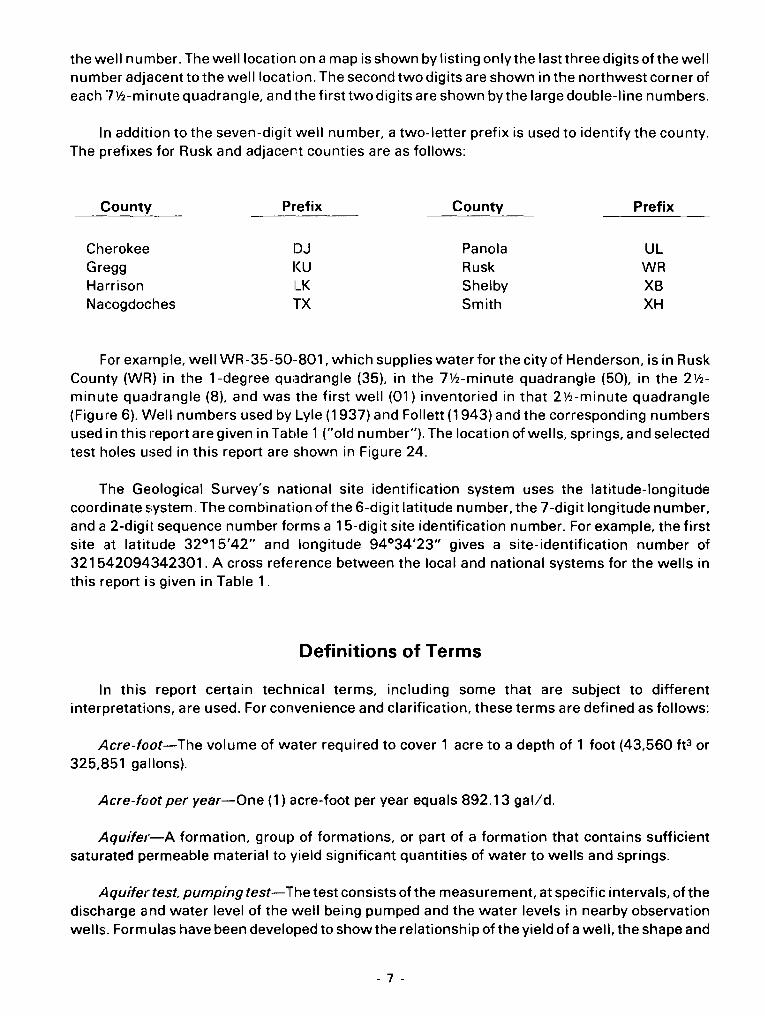
During 1980, oil and gas, lignite leasing,lumbering, agriculture, and clay productsprovided the main sources of income for RuskCounty. Until 1930, lumbering and agricultureprovided the mainstay for the economy of thearea. The beginning ofthe oil and gas industryin the county occurred during 1929 when"Dad" Joiner (Figure 4) started his No.3 DaisyBradford well in northwest Rusk County. Thewell was completed during 1930 as the firstdiscovery well for East Texas Oil Field (Rusk,Gregg, Upshur, and Smith Counties). Thelocation of this field and others are shown inFigure 5. Since that time, oil and gas and theprocessing of petroleum and related productshave been the most significant industry.
-5
- 10
JAN FEB MAR APR MAY JUNE JULY AUG SEPT OCT NOV DEC
NOAMAL-MO,.,THLY PRECIPITATION AT HENDE~SON, TEXAS, 1941-10
(FROM RECORDS OF NAT IONAL 0 :EANIC AND ATMOSPHERIC ADMINISTRAT ION)
32 ---.L....--J. - 0JAN FEB MAR APR MAY JUNE JULY AUG SEPT OCT NOV DEC
NQRMAL- MON fHLY TE MPE H ATURE AT HENOER SON I IE X AS, 1941-70
(FROM RECORDS )>= NATICNAL ceEANIC AND ATMOSPHERIC ADMINISTRATION)
Figure 3.-Average-Monthly Precipitation andTemperature at Henderson and Average-MonthlyGross-Lake Surface Evaporation in Rusk County
Completion of the No.3 Daisy Bradford,however, came at an awkward time justbefore the height of the depression.Independents drilled hundreds of wells, manyof which were on town lot spacing. So muchcrude was produced from East Texas that theprice of oil fell to 10 cents a barrel. When riots
started, Governor Ross Sterling called out the National Guard to preserve order. It also was at thistime that he appointed E. O. Thompson to the Texas Railroad Commission and delegated to himthe responsibility of regulating oil and gas production in Texas.
>~
z
!::/z---------------- -------- ~::~ / .""erQge-(Irlrl<JQllemp\l;ra1ur ,~ ~9 I ~ 7° CeI~1U5 (653 Fal'lrenl'\eoO -15
z
By 1980, East Texas Oil Field had produced over 4.622 billion barrels of oil and wasresponsible for making Rusk County rank among the larger oil producing counties in Texas. Thefield also had produced substantial quantities of saltwater. According to a 1961 oilfield-brinedisposal inventory prepared by the Texas Water Commission and Texas Water Pollution ControlBoard (1963), 156.7 million barrels of saltwater was produced that year. This was an average of0.427 million barrels a day, 99 percent of which was disposed of through injection wells.
Population
Rusk County has a population of 4'1,382 according to the U.S. Department of Commerce,Bureau of Census (1980). Henderson, thl~ county seat, has a population of 11 ,473. Populations of
- 4 -
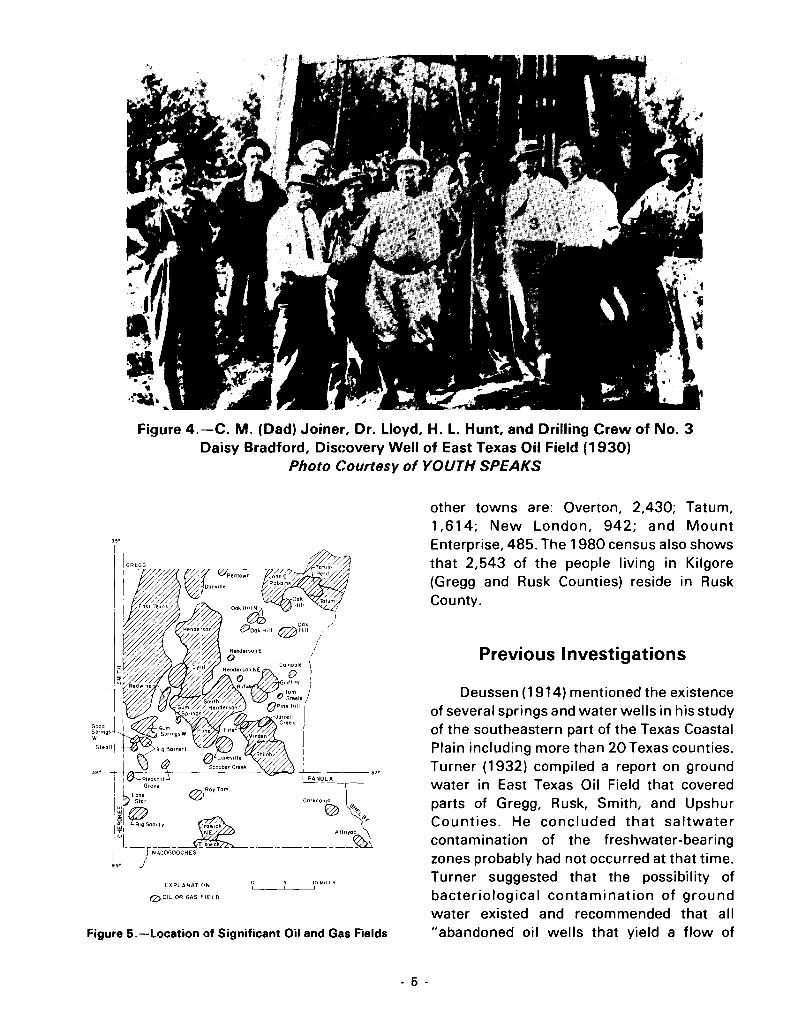
Figure 4.-C. M. (Dad) Joiner, Dr. Lloyd, H. L. Hunt, and Drilling Crew of No.3Daisy Bradford, Dis(:overy Well of East Texas Oil Field (1930)
Photo Courtesy of YOUTH SPEAKS
Figure 5.-Location of Significant Oil and Gas Fields
Deussen (1914) mentioned the existenceof several springs and water wells in his studyof the southeastern part of the Texas CoastalPlain including more than 20 Texas counties.Turner (1932) compiled a report on groundwater in East Texas Oil Field that coveredparts of Gregg, Rusk, Smith, and UpshurCounties. He concluded that saltwatercontamination of the freshwater-bearingzones probably had not occurred at that time.Turner suggested that the possibility ofbacteriological contamination of groundwater existed and recommended that all"abandoned oil wells that yield a flow of
Previous Investigations
other towns are: Overton, 2,430; Tatum,1.614; New London, 942; and MountEnterprise, 485. The 1980 census also showsthat 2,543 of the people living in Kilgore(Gregg and Rusk Counties) reside in RuskCounty.
o 5 10 MILESL __----.l.........
-'<:6..........L-J-_-~>2.I PANOLA---r-
Caledonlo I(7),. ,"'->'GO '-('(
"t~Atloyac \
""","L~_~_~ 0l
EXPLANATIC'N
(2) OIL OR GAS FIELD
.,.
- 5 -
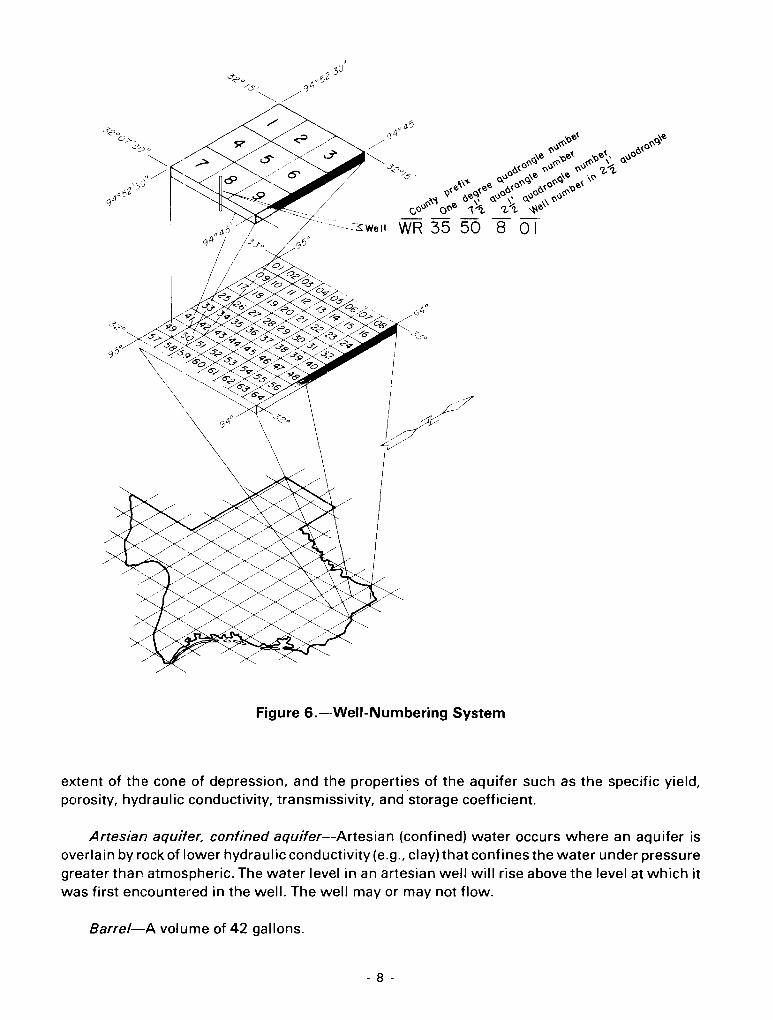
the well number. The well location on a map is shown by listing only the last three digitsofthe wellnumber adjacent to the well location. The second two digits are shown in the northwest corner ofeach 7V2-minute quadrangle, and the first two digits are shown by the large double-line numbers.
In addition to the seven-digit well number, a two-letter prefix is used to identify the county.The prefixes for Rusk and adjacent counties are as follows:
County Prefix County Prefix
Cherokee DJ Panola ULGregg KU Rusk WRHarrison ILK Shelby XBNacogdoches TX Smith XH
For example, well WR-35-50··801, which supplies water for the city of Henderson, is in RuskCounty (WR) in the 1-degree quadrangle (35), in the 7V2-minute quadrangle (50), in the 2V2minute quadrangle (8), and was the first well (01) inventoried in that 21h-minute quadrangle(Figure 6). Well numbers used by Lyle (1937) and Follett (1943) and the corresponding numbersused in this report are given in Table 1 ("old number"). The location of wells, springs, and selectedtest holes used in this report are shown in Figure 24.
The Geological Survey's national site identification system uses the latitude-longitudecoordinate system. The combination ofthe 6-digit latitude number, the 7-digit longitude number,and a 2-digil sequence number forms a 15-digit site identification number. For example, the firstsite at latitude 32°15'42" and longitude 94°34'23" gives a site-identification number of321542094342301. A cross reference between the local and national systems for the wells inthis report is given in Table 1.
Definitions of Terms
In this report certain technical terms, including some that are subject to differentinterpretations, are used. For convenience and clarification, these terms are defined as follows:
Acre-foot-The volume of water required to cover 1 acre to a depth of 1 foot (43,560 ft3 or325,851 gallons).
Acre-foot per year-One (1) acre-foot per year equals 892.13 gal/d.
Aquifer-A formation, group of formations, or part of a formation that contains sufficientsaturated permeable material to yield significant quantities of water to wells and springs.
Aquifer test, pumping test-The test consists of the measurement, at specific intervals, of thedischarge and water level of the well being pumped and the water levels in nearby observationwells. Formulas have been developed to show the relationship of the yield of a well, the shape and
- 7 -
.. -<:':3: Well WR 35 50 8 0 I
Figure 6.--Well-Numbering System
extent of the cone of depression, and the properties of the aquifer such as the specific yield,porosity, hydraulic conductivity, transmissivity, and storage coefficient.
Artesian aquifer, confined aquifer--Artesian (confined) water occurs where an aquifer isoverlain by rock of lower hydraulic conductivity (e.g., clay) that confines the water under pressuregreater than atmospheric. The water level in an artesian well will rise above the level at which itwas first encountered in the well. The well mayor may not flow.
Barrel-A volume of 42 gallons.
- 8 -
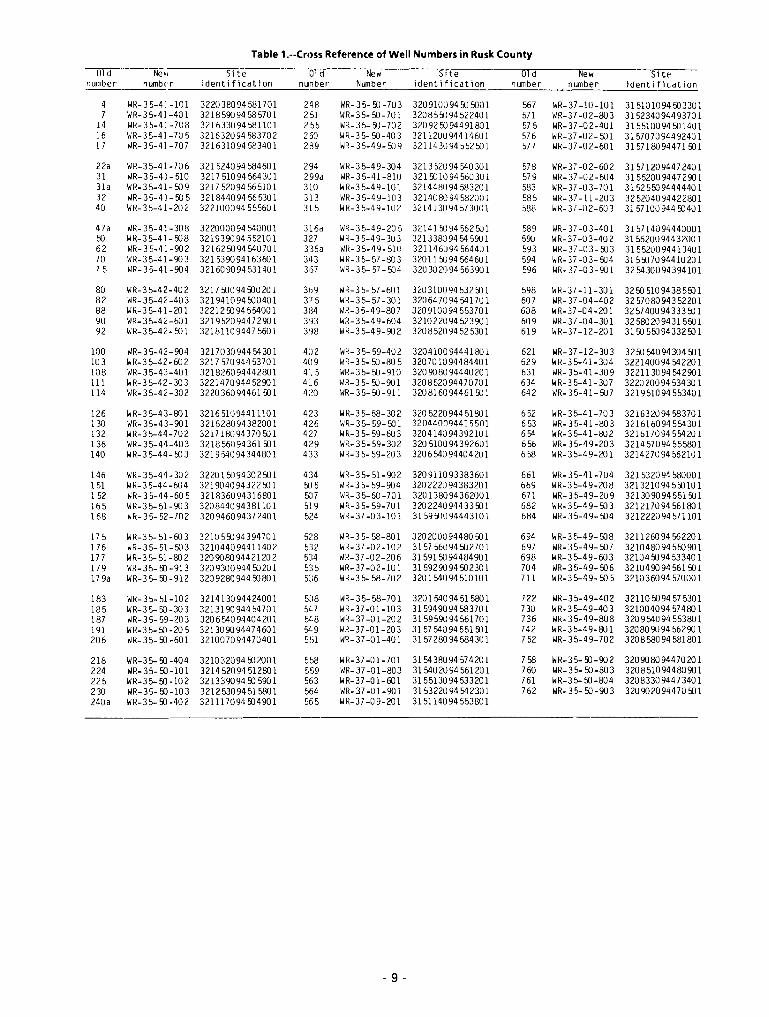
Table 1.--Cmss Reference of Well Numbers in Rusk County
Old Ne" Site old New Slte Old New Sitenumber numbE'r identification number Number identification number number identi ficat ion
4 WR-35-41-101 322038094581701 248 WR-35-:>l-703 32U91OU94:>l :>lUI 567 WR-37-1O-101 315101094 :>l33017 WR-35-41-401 3218590 94 5857U 1 251 WR-35-:>l-701 32085~J945224U 1 571 WR-37 -U2-803 315234U9449370 1
14 WR-35-41-708 321633U94581101 255 WR-35-:>l-702 32U92:>l94491801 575 WR-37-02-401 315510U94:>l140116 WR-35-41-7U 5 321632U94583702 260 WR-35-:>l-403 32112UU 944146Ul 576 WR-37-U2-:>l1 31570 7U 944 924U 117 WR-35-41-707 321631094583401 289 WR-35-49-:>l9 321143U94 552:>l 1 577 WR-37 -02-6Ul 315718094471 :>l1
22a WR-35-41-706 321524094584601 294 WR-35-49-304 32135209454U301 578 WR-37 -02-602 315712U944724Ul31 WR-35-4J -51U 3217510 94 564 3U 1 299a WR-35-41-81IJ 321:>l 10 94 5603U 1 579 WR-37 -02-604 31552009447290131a WR-3 5-41-:>l9 3217 52094 56 5101 310 WR-35-49-101 3214480945832Ul 583 WR-37-03-7Ul 3152 5:>l9444440 132 WR-35-4J-:>l5 32184409456 53U 1 313 WR-35-49-103 321408094 582IJO 1 585 WR-37-11-203 32520409442280140 ~IR-35-41-202 3221IJOIJ94555601 315 WR-3 5-4 9-lIJ 2 321413094573001 588 WR-37-02-603 31 5710U 944 :>l4U 1
47a WR-35-41-308 3220110094540001 3l6a WR-35-49-20 5 321415094562:>l1 589 WR- 37 -03-401 315714094440UOI50 WR-3 5-41- 508 321939094552101 3:27 WR-35-49-303 321338094545901 590 WR-37-03-402 31562009443200162 WR-35-41-902 321625094540701 336a WR-35-49-510 321146094 5644IJ 1 593 WR-37 -03-:>l3 31552009441340170 WR-35-41-903 321539094163601 343 WR-3 5- 57 -803 32011 :>l94 5646U 1 594 WR-37-03-504 315:>l709441020 17 5 WR- 3 5-41-904 3216IJ90945314IJI 367 WR-35-57-:>l4 320302094563901 596 WR-37-03-901 325430094394101
80 WR-35-42-4U2 321750094 5OIJ20 1 369 WR-35-57-601 3203l1J094532:>l1 598 WR-37-11-301 3250 510 94 38 550 182 WR-35-42-403 321941094500401 37 5 WR-35-57-301 320647094541701 607 WR- 37 -04 -40 2 32570809435220188 WR-35-41-201 322125094554001 3134 WR- 3 5-4 9-80 7 3209100945537IJI 608 WR-37 -04-201 325740094333:>l 190 WR-35-42-601 321952094472901 393 WR- 3 5-4 9- 604 32102209452390 1 609 WR-37-04-301 32580209431550192 WR-35-42-501 321811094475601 398 WR-35-49-902 320852094 52 530 1 619 WR-37-12-201 31:>l 5509433250 1
1110 WR-35-42-904 321703094454301 402 WR- 3 5- 59-402 320410094441801 621 WR-37 -12-3U3 3250 54094304:>l1103 IiR-3 5-42-60 2 321757094453701 409 WR-35- :>l-80 5 320701094484401 629 WR-35-41-304 322140094542201108 WR- 3 5-43-40 1 321826094442801 415 WR-35-5O-910 320908094440201 631 WR-35-41-309 322113094542901III IiR-3 5-42-30 3 322147094452901 4;.6 WR-35-:>l-901 320852094470701 634 WR-35-41-307 322020094534301114 WR- 3 5-4 2-30 2 32203609446150 1 420 WR-35- 50-911 320816094461501 642 WR-35-41-507 321951094553401
126 WR-3 5-43-80 1 3216510944111IJI 4n WR-3 5- 58-302 320522094451801 652 WR-35-41-703 321632094583701130 WR-35-43-901 321628094382001 4;'6 WR-35-59-501 320440094415501 653 WR-35-41-803 321616094554301132 WR-35-44-702 321718094370:>l1 4;>7 WR-3 5- 59-603 320414094392101 654 WR-35-41-802 321617094554201136 WR-35-44-403 321856094361501 4;'9 WR- 3 5- 59-302 320510094392601 656 WR-35-49-203 321457094555801140 WR-3 5-44 -:>l 3 321954094344801 433 WR-3 5- 59-203 320654094404201 658 WR-35-49-201 321427094562101
146 IiR-35-44-302 322015094302501 434 WR-35-51-902 320911093383601 661 WR-35-41-704 321 532094580001151 WR-35-44-604 321904IJ94322501 ~15 WR-35-59-904 320222094383201 669 WR-35-49-208 321321094550 lIJ 1152 IiR- 3 5-44 -60 5 321836094316801 ~17 WR-35-60-701 320138094362001 671 WR- 3 5-4 9- 20 9 321309094551 :>l1165 WR-35-51-903 320844IJ943811O 1 519 WR-35-59-701 320224094433501 682 WR-35-49-503 321217094561801168 WR-35-52-702 320946094372401 5;~4 WR-37-03-101 315950094443101 684 WR- 3 5-4 9-:>l4 321222094571101
175 WR-35-51-603 3210 5509439470 1 51'8 WR-35-58-801 320200094480501 694 WR-35-49-508 321126094562201176 WR-35-51-503 321044094411402 532 WR-37-02-102 315756(949)2701 697 WR- 3 5-4 9- 50 7 3210480945:>l901177 WR-35- 51-802 320908094421202 534 WR-37 -02-206 315915094484901 698 WR-35-49-603 32104 :>l94 53340 1179 WR-35-5O-913 320930IJ944 :>l201 535 WR-37-02-101 315929(949)2301 704 WR-35-49-506 321049094561501179a WR-35- 50-912 320928094450801 536 WR-35-58-702 320154094510101 711 WR-3 5-49- 50 5 321036094570001
183 WR-35-51-102 321413094424001 538 WR-35-58-701 320154094515801 722 WR-35-49-402 321109)94575301185 WR-3 5- 50 -30 3 321319094454701 547 WR-37-01-103 315949094583701 730 WR-35-49-403 321004094574801187 WR-35-59-203 320654094404201 51:8 WR-37-01-202 315959094561701 736 WR-35-49-808 320954094553801I'll WR-3 5- 50 -20 5 321309094474601 549 WR-37-01-203 315754094551:>l1 742 WR-35-49-801 32080909456290 1206 WR-35-5O-601 321007094470401 5!,1 WR-37-01-401 315728094584301 752 WR-35-49-702 320858094581801
218 WR-3 5- 9) -404 321032094 :>l2001 5!,8 WR-37-01-701 315438094574201 758 WR-35-5O-902 320908094470201224 WR-35-5O-101 321452094512801 5!,9 WR-37-01-803 315402094561201 760 WR-35-:>l-803 320851094480901225 WR-3 5- 50 -10 2 32133909450 590 1 563 WR-37-01-601 315513094533201 761 WR-35-5O-804 320833094473401230 WR-35-:>l-103 321253094515801 564 WR-37-01-901 31532209454 230 1 762 WR-35- :>l-903 320902094470501240a WR-3 5- 50 -40 2 321117094:>l4901 565 WR-37 -0 9-20 1 315114094553801
- 9 -
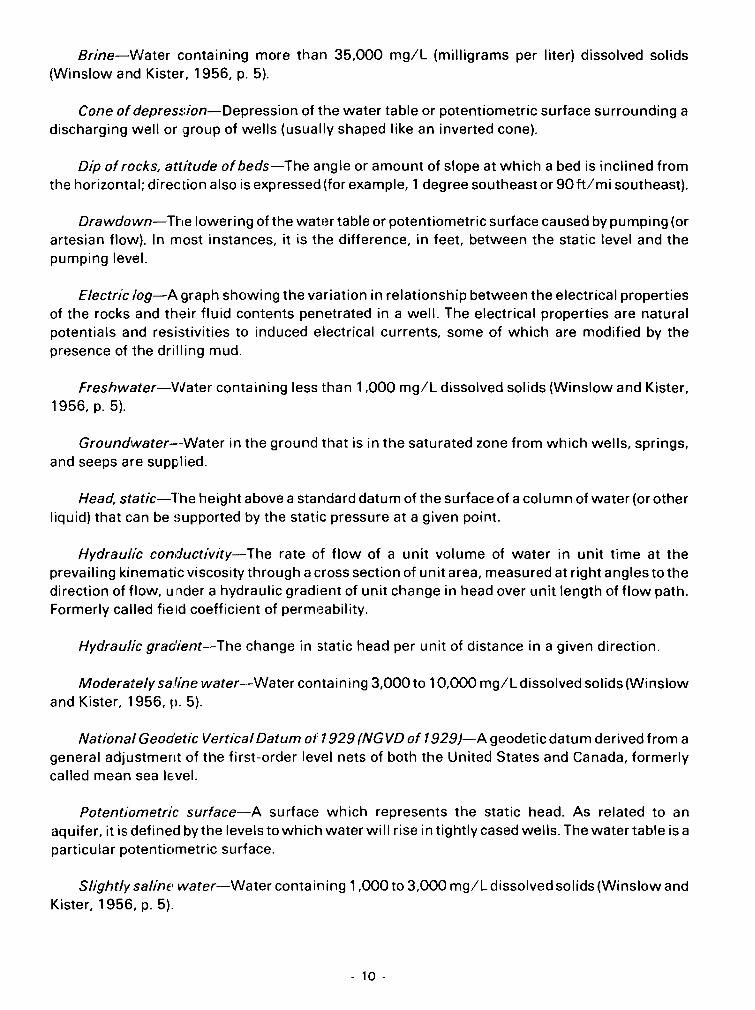
Brine-Water containing more than 35,000 mg/L (milligrams per liter) dissolved solids(Winslow and Kister, 1956, p. 5).
Cone of depression-Depression of the water table or potentiometric surface surrounding adischarging well or group of wells (usually shaped like an inverted cone).
Dip of rocks, attitude ofbeds-The angle or amount of slope at which a bed is inclined fromthe horizontal; direction also is expressed (for example, 1 degree southeast or 90ft/mi southeast).
Drawdown-The loweri ng of the water table or potentiometric surface ca used by pu mping (orartesian flow). In most instances, it is the difference, in feet, between the static level and thepumping level.
Electric /og-A graph showing the variation in relationship between the electrical propertiesof the rocks and their fluid contents penetrated in a well. The electrical properties are naturalpotentials and resistivities to induced electrical currents, some of which are modified by thepresence of the drilling mud.
Freshwater-Water containing less than 1,000 mg/L dissolved solids (Winslow and Kister,1956, p. 5).
Groundwater--Water in the ground that is in the saturated zone from which wells, springs,and seeps are supplied.
Head, static-The height above a standard datum of the surface of a column of water (or otherliquid) that can be supported by the static pressure at a given point.
Hydraulic conductivity-The rate of flow of a unit volume of water in unit time at theprevailing kinematic viscosity through a cross section of unit area, measured at right angles to thedirection of flow, under a hydraulic gradient of unit change in head over unit length of flow path.Formerly called field coefficient of permeability.
Hydraulic gradient-The change in static head per unit of distance in a given direction.
Moderately saline water-Water containing 3,000 to 10,000 mg/Ldissolved solids(Winslowand Kister, 1956, p. 5).
National Geodetic Vertical Datum 01'1929 (NGVD of 1929)-Ageodetic datum derived from ageneral adjustment of the first-order level nets of both the United States and Canada, formerlycalled mean sea level.
Potentiometric surface-A surface which represents the static head. As related to anaquifer, it is defined by the levels to which water will rise in tightly cased wells. The water table is aparticular potentiometric surface.
Slightly saline water-Water containing 1,000 to 3,000 mg/Ldissolved solids(Winslow andKister, 1956, p. 5).
- 10 -
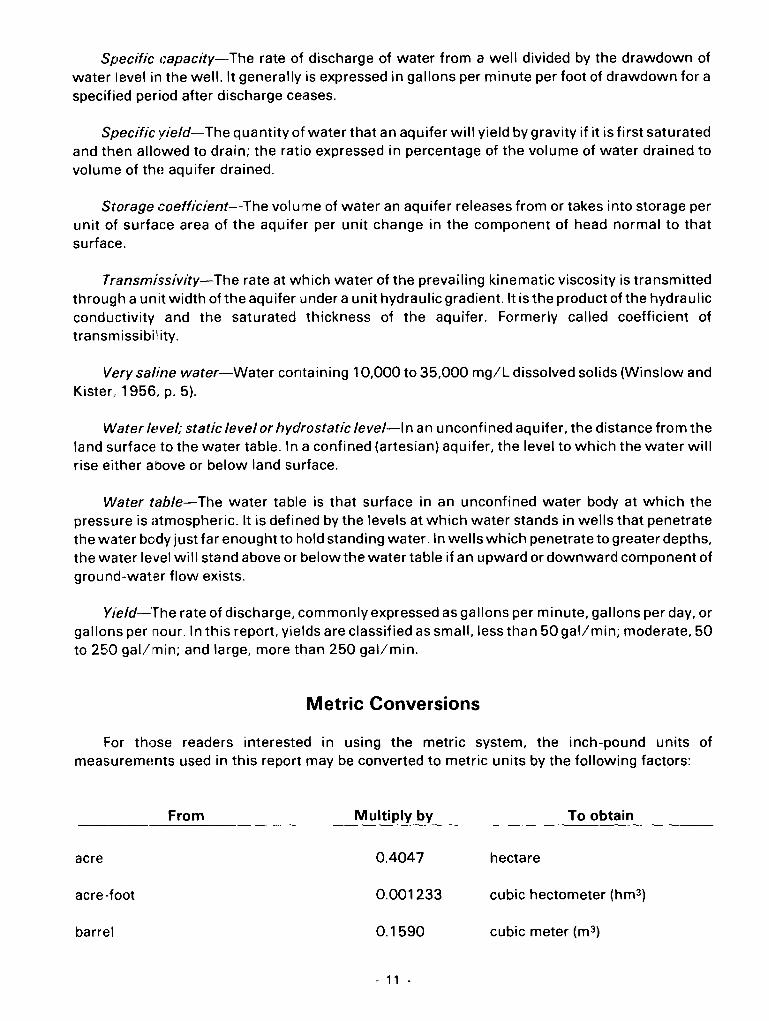
Specific capacity-The rate of discharge of water from a well divided by the drawdown ofwater level in the well. It generally is expressed in gallons per minute per foot of drawdown for aspecified period after discharge ceases.
Specific yield-The quantity of water that an aquifer will yield by gravity if it is first saturatedand then allowed to drain; the ratio expressed in percentage of the volume of water drained tovolume of thH aquifer drained.
Storage coefficient-The volume of water an aquifer releases from or takes into storage perunit of surface area of the aquifer per unit change in the component of head normal to thatsurface.
Transmissivity-The rate at which water of the prevailing kinematic viscosity is transmittedthrough a unit width of the aquifer under a unit hydraulic gradient. It is the product of the hydraulicconductivity and the saturated thickness of the aquifer. Formerly called coefficient oftransmissibil ity.
Very saline water-Water containing 10,000 to 35,000 mg/L dissolved solids (Winslow andKister, 1956, p. 5).
Water Ifwel; static level or hydrostatic level-In an unconfined aquifer, the distance from theland surface to the water table. In a confined (artesian) aquifer, the level to which the water willrise either above or below land surface.
Water table-The water table is that surface in an unconfined water body at which thepressure is atmospheric. It is defined by the levels at which water stands in wells that penetratethe water body just far enought to hold standing water. In wells which penetrate to greater depths,the water level will stand above or below the water table if an upward or downward component ofground-water flow exists.
Yield-The rate of discharge, commonly expressed as gallons per minute, gallons per day, orgallons per hour. In this report, yields are classified as small, less than 50 gal/min; moderate, 50to 250 gal/min; and large, more than 250 gal/min.
Metric Conversions
For those readers interested in using the metric system, the inch-pound units ofmeasuremHnts used in this report may be converted to metric units by the following factors:
acre
acre-foot
barrel
From Multiply by
0.4047
0.001233
0.1590
- 11 -
To obtain
hectare
cubic hectometer (hm3)
cubic meter (m3)
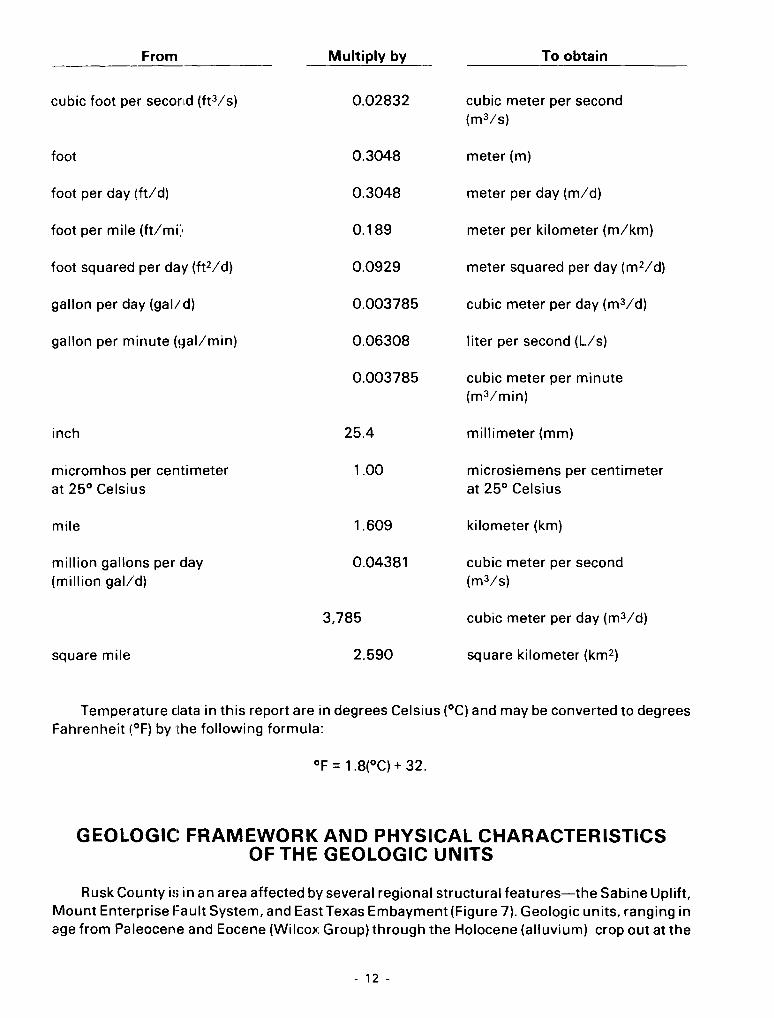
From Multiply by To obtain
cubic foot per second (ft3/s) 0.02832 cubic meter per second(m3/s)
foot 0.3048 meter (m)
foot per day (ft/d) 0.3048 meter per day (m/d)
foot per mile (ft/mi:' 0.189 meter per kilometer (m/km)
foot squared per day (ft2/d) 0.0929 meter squared per day (m 2/d)
gallon per day (gal/d) 0.003785 cubic meter per day (m3/d)
gallon per minute (!~al/min) 0.06308 liter per second (L/s)
0.003785 cubic meter per minute(m 3/min)
inch 25.4 millimeter (mm)
micromhos per centimeter 1.00 microsiemens per centimeterat 25° Celsius at 25° Celsius
mile 1.609 kilometer (km)
million gallons per day 0.04381 cubic meter per second(million gal/d) (m3/s)
3,785 cubic meter per day (m3/d)
square mile 2.590 square kilometer (km 2)
Temperature data in this report are in degrees Celsius (OC) and may be converted to degreesFahrenheit (OF) by the following formula:
OF = 1.8(°C) + 32.
GEOLOGIC FRAMEWORK AND PHYSICAL CHARACTERISTICSOF THE GEOLOGIC UNITS
Rusk County is in an area affected by several regional structural features-the Sabine Uplift,Mount Enterprise Fault System, and EastTexas Embayment (Figure 7). Geologic units, ranging inage from Paleocene and Eocene (Wilcox Group) through the Holocene (alluvium) crop out at the
- 12 -
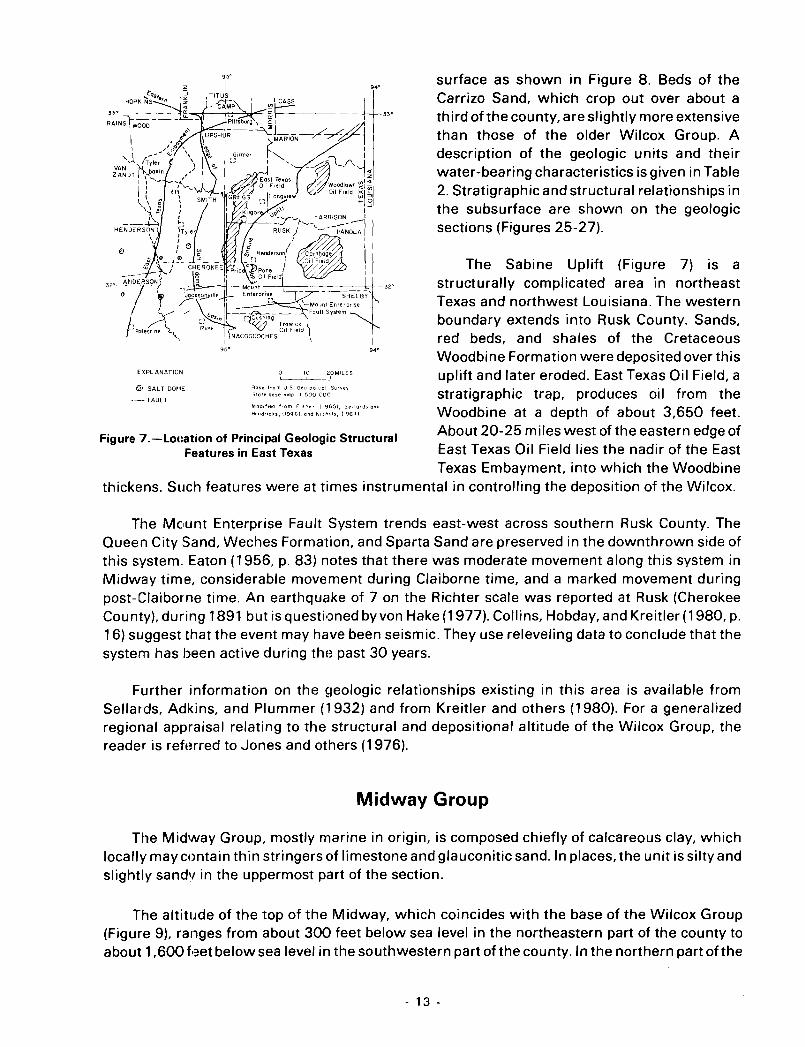
surface as shown in Figure 8. Beds of theCarrizo Sand, which crop out over about athird of the county, are slightly more extensivethan those of the older Wilcox Group. Adescription of the geologic units and theirwater-bearing characteristics is given in Table2. Stratigraphic and structural relationships inthe subsurface are shown on the geologicsections (Figures 25-27).
94'
I94"
o 10 20MlLESL--.......-.L_~I
Modified I'om F,s1er, (1965), Sellon!s ond
Hendricks, (I946), cnd N,;hols, (1964)
,;jose from 'J 5 GeuloQlccl Sur~e~
Store bose mop, 1'500,(00
35"
EXPLANATfCN
WI SALT DmlE
---- FAULT
The Sabine Uplift (Figure 7) is astructurally complicated area in northeastTexas and northwest Louisiana. The westernboundary extends into Rusk County. Sands,red beds, and shales of the CretaceousWoodbine Formation were deposited over thisuplift and later eroded. East Texas Oil Field, astratigraphic trap, produces oil from theWoodbine at a depth of about 3,650 feet.About 20-25 miles west of the eastern edge ofEast Texas Oil Field lies the nadir of the EastTexas Embayment, into which the Woodbine
thickens. Such features were at times instrumental in controlling the deposition of the Wilcox.
Figure 7.-LOl:ation of Principal Geolo{lic StructuralFeatures in East Texas
The Mount Enterprise Fault System trends east-west across southern Rusk County. TheQueen City Sand, Weches Formation, and Sparta Sand are preserved in the downthrown side ofthis system. Eaton (1956, p. 83) notes that there was moderate movement along this system inMidway time, considerable movement during Claiborne time, and a marked movement duringpost-Claiborne time. An earthquake of 7 on the Richter scale was reported at Rusk (CherokeeCounty), during 1891 but is questioned byvon Hake (1977). Collins, Hobday, and Kreitler (1980, p.16) suggest that the event may have been seismic. They use releveling data to conclude that thesystem has been active during the past 30 years.
Further information on the geologic relationships existing in this area is available fromSellards, Adkins, and Plummer (1932) and from Kreitler and others (1980). For a generalizedregional appraisal relating to the structural and depositional altitude of the Wilcox Group, thereader is referred to Jones and others (1976).
Midway Group
The Midway Group, mostly marine in origin, is composed chiefly of calcareous clay, whichlocally may contain thin stringers of limestone and glauconitic sand. In places, the unit is silty andslightly sand'! in the uppermost part of the section.
The altitude of the top of the Midway, which coincides with the base of the Wilcox Group(Figure 9), ranges from about 300 feet below sea level in the northeastern part of the county toabout 1,600 feet below sea level in the southwestern part of the county. In the northern part of the
- 13 -
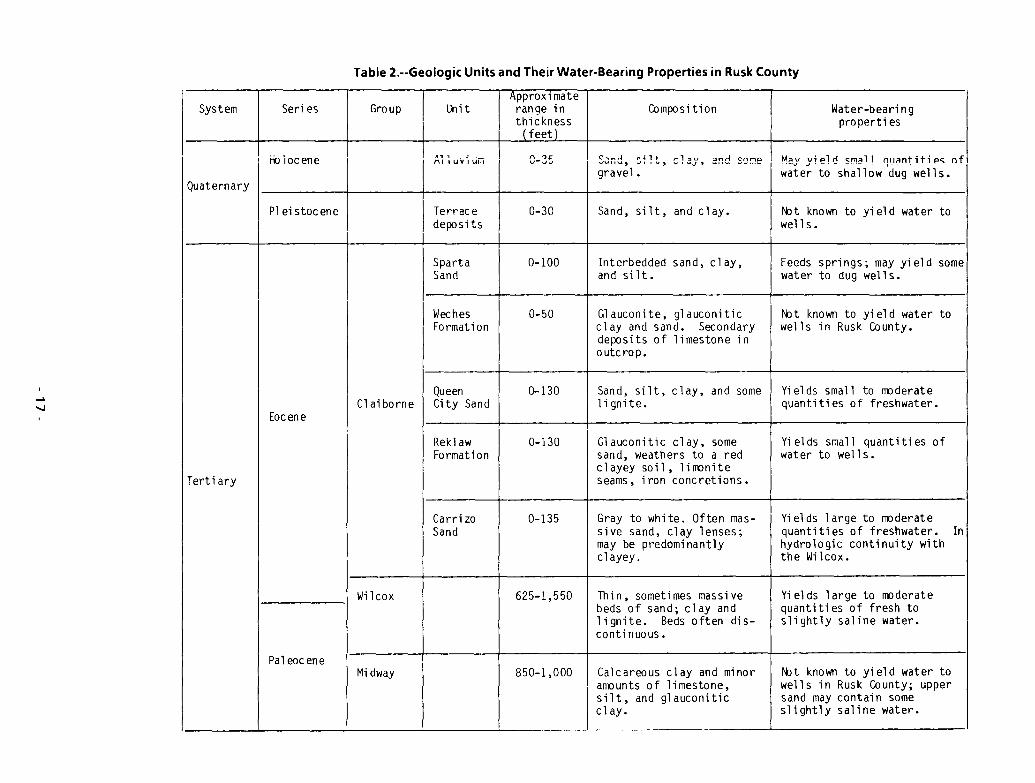
Table 2.--Geologic Units and Their Water-Bearing Properties in Rusk County
System
Quaternary
Series
tbiocene
Pl ei stocene
Group Unit
"" .. ".: .0-I111UV1Ulll
Terracedeposi ts
SpartaSand
WechesFormation
Approximateranqe inthickness
(feet)
" ..,,,V-..J.,J
0-30
0-100
0-50
Composi tion
c,"~ ~~,+ ~l~\J ~n~ cnmQ-Ju, , J I I ' ""', J' _
gravel.
Sand, silt, and clay.
Interbedded sand, clay,and silt.
Gl auconite, gl auconiticcl ay and sand. Secondarydeposits of limestone inoutcrop.
Water-beari ngproperti es
M"v vi<>lrl ~m"ll oll"ntitip" of~~te~ .t~ -sh~llow'd~g well s.
rtJt known to yield water towell s.
Feeds springs; may yield somewater to dug wells.
rtJt known to yi el d water towells in Rusk County.
-..J
Tertiary
Eocene
Pal eocene
QueenCl ai borne I Ci ty Sand
ReklawFormation
Carri zoSand
Wi 1cox
Midway
0-130
0-130
0-135
625-1,550
850-1,000
Sand, silt, clay, and some1ignite.
Gl auconitic cl ay, somesand, weathers to a redclayey soil, limoniteseams, i ron concretions.
Gray to white. Often massive sand, clay lenses;may be predominantlyclayey.
Thin, sometimes massivebeds of sand; clay andlignite. Beds often discontinuous.
Calcareous cl ay and minoramounts of limestone,silt, and glauconiticclay.
Yields small to moderatequantities of freshwater.
~elds small quantities ofwater to well s.
Yields large to moderatequantities of freshwater. Inhydrologic continuity withthe Wilcox.
Yields large to moderatequantities of fresh toslightly saline water.
rtJt known to yield water towells in Rusk County; uppersand may contain someslightly saline water.
I I __ I.. I I
county, the beds dip at a rate of about 30 ft/mi to the west. In the southern part of the county, theydip about 50 ftlmi to the southwest.
The Midway Group is not known to yield water to wells in the area. Nevertheless, the unit ishydrologically significant because the Midway Group forms the basal confining unit for theoverlying Wilcox Group. There is also a sand body about 30 feet thick within the uppermost 200feet that may contain small amounts of slightly saline water. In a few instances, the base ofslightly saline water has been picked at the base of this sand bed from electric logs.
Wilcox Group
The Wilcox Group is exposed on the surface in northeastern and east-central Rusk Countyand comformably overlies the Midway. It consists mainly of thin, but sometimes massive beds ofsand, silt, and clay with minor amounts of lignite and secondary deposits of limonite. Typically, thesands are gray, fine-grained and silty. Often the beds are fluvial and deltaic in nature. Due tofacies changes, individual beds often are difficult to correlate from well to well. However, somebeds of coarse-grained sand attain a thickness of nearly 200 feet (well WR-35-59-901). Otherbeds cannot be correlated from well to well as is clearly shown in the geologic sections (Figures25-27).
The altitude of the top of the Wilcox Group is depicted in Figure 10. Except where interruptedby the Mount Enterprise Fault System, these beds dip at the rate of about 30 ft/mi in a directionaway from the Sabine Uplift.
Carrizo Sand
The Carrizo Sand uncomformably overlies the Wilcox Group and crops out more extensivelythan any other geologic unit in the county. It attains a maximum thickness of about 135 feet.Surface exposures usually are reddish in color and often cross-bedded. In the subsurface, theCarrizo is a massive, fine- to medium-grained white quartz sand. It also contains a few clay lenses,but rarely is predominantly clay. In electrical logs, the Carrizo is distinguished from the overlyingReklaw and underlying Wilcox by a markedly higher resistivity. In places, however, the contactsare difficult to pick. As does the Wilcox Group, the Carrizo Sand dips away from the Sabine Upliftintothe East Texas Embayment at a rate of about 30ft/mi except where interrupted by the MountEnterprise Fault System.
Reklaw Formation
The Reklaw Formation conformably overlies the Carrizo Sand. The Reklaw attains amaximum thickness of about 130 feet and is exposed primarily in the northern part of the countyand north of the Mount Enterprise Fault System. The formation consists of glauconitic clay andminor amounts of sand and lignite. The basal part of the Reklaw contains a silty, glauconiticfine-grained quartz sand that is often difficult to distinguish from the underlying Carrizo usingelectric logs. In the outcrop, the Reklawforms a red clay soil characterized by limonite seams andiron concretions, easily distinguished from the underlying gray sandy soil of the Carrizo.
- 21 -
Queen City Sand
The Queen City Sand, which overlies the Reklaw Formation, consists mostly of alternatingbeds of very fine- to fine-grained quartz sand and clay. The Queen City Sand crops out over an areaof about 100 square miles and attains a maximum thickness of about 130 feet where overlain bythe Weches Formation. The maximum thickness occurs mainly in the downdropped blocksassociated with the Mount Enterprise Fault System. Elsewhere, the Queen City is eroded andrelatively thin There is not enough control to adequately map the Queen City Sand.
Weches Formation
The Weches Formation, consisting of interbedded glauconitic clay and sand, crops out asscattered outliers in the Mount Enterprise Fault System area. The Weches attains a maximumthickness of about 50 feet, but is not known to yield water to wells in Rusk County.
Sparta Sand
The Sparta Sand consists of fine sand and sandy clay and silt, attains a thickness of about 100feet, and is exposed only in the area of the Mount Enterprise Fault System. Numerous springsissue from the contact of the Sparta with the underlying Weches. The formation yields smallquantities of freshwater to wells in adjacent counties. Springs issuing from the Sparta yieldmoderate quantities of ground water to the base flow of small streams in southern Rusk County.
Terrace Deposits and Alluvium
Terrace deposits, probably of Pleistocene age, are present at several places along the Sabineand Angelina Rivers. These beds are remnants of a formerly more extensive surface that has beenlargely removed by erosion. The terrace deposits are in continuity with the underlying Eocenebeds but are considered hydrologically insignificant.
Alluvium is present in and around the flood plains of the principal streams (Figure 8). Thesedeposits, consisting of fine sand, silt, clay, and possibly gravel, have an estimated maximumthickness of about 35 feet. Alluvial deposits are capable of yielding at least small amounts ofwater to wells. At least one well in Rusk County is completed in the alluvium.
HYDROLOGIC UNITS
In order to simplify the discuSSiion of hydrology in the area, the following previously describedgeologic units are designated as aquifers in Rusk County: Wilcox Group, Carrizo Sand, Queen CitySand, and Sparta Sand. The other geologic units are designated as confining beds and are:Midway Group, Reklaw Formation, and Weches Formation. A number of dug wells tap the thinbasal sand of the Reklaw.
- 25 -
Wilcox Aquifer
Broom (1969) noted that the Carrizo and Wilcox have similar hydrologic properties and are inhydrologic continuity in Gregg County. Consequently, he considered them to function as a singleaquifer. W. F. Guyton and Associates (1970, 1972) considered the two aquifers to be separateunits in Cherokee and Nacogdoches Counties. In this report, the Carrizo and Wilcox are treated astwo distinct aquifers.
The Wilcox aquifer is present throughout Rusk County and is the most significant hydrologicunit. Substantial withdrawals occur from the middle and lower sands at Henderson and in thearea of East Texas Oil Field. Many of the upper sands in the Wilcox are thin, fine-grained and silty.By contrast, the lower beds are sometimes massive and coarse-grained. Often individual beds arediscontinuous.
The quaHty of water in the Wilcox varies both vertically and laterally from fresh to slightlysaline. In rare instances, the water may be moderately saline. In places, the shallower sands maynot necessarily contain the best quality water.
The thickness of freshwater-bearing sands in the Wilcox is shown in Figure 11. The thicknessof sands containinq freshwater are based on the interpretation of electric logs. The thicknessranges from about ~ 70 feet to about 400 feet. The altitude of the freshwater is shown in Figure 12and the base of the slightly saline water is shown in Figure 13.
Carrizo Aquifer
Another significant water-bearing unit is the Carrizo aquifer, which is present in about 70percent of the county. In places, however, the Carrizo sands may be interbedded with clay asshown in Figure 14, which shows ground water seeping from the Carrizo sands at the Ross claypit of Henderson Clay Products north of the city of Henderson.
The Carrizo aquifer has an average sand thickness of about 80 feet in the subsurface and 50feet in the outcrop area. However, a sand thickness map was not constructed because data wereinadequate.
Other Aquifers
Only a few small-capacity wells draw water from the Queen City aquifer because of its nearsurface occurrenCH and small aerial extent. Except for a few isolated exposures in thenorthwestern part of Rusk County, the Queen City is present only in downdropped blocksassociated with the Mount Enterprise Fault System. The Sparta is present only in the area alongthe Mount Enterprise Fault System. The Sparta is not an important aquifer in Rusk County. Boththe Queen City and Sparta feed numerous small springs in Rusk County.
- 26 -
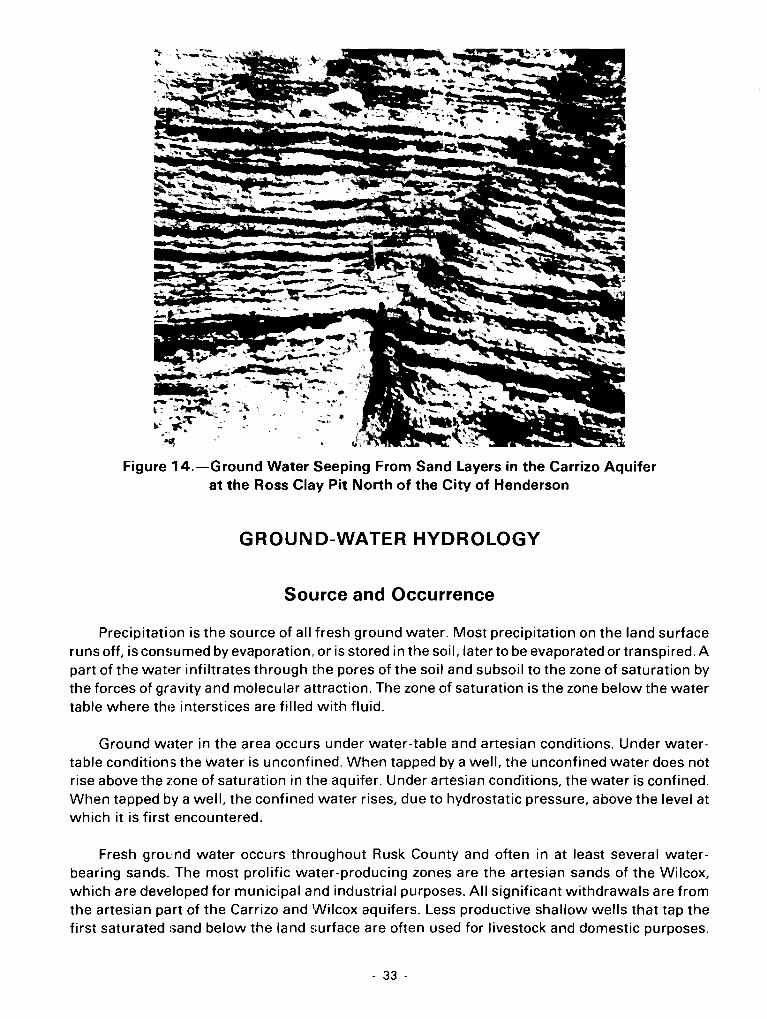
Figure 14.-Ground Water Seeping From Sand Layers in the Carrizo Aquiferat the Ross Clay Pit North of the City of Henderson
GROUND-WATER HYDROLOGY
Source and Occurrence
Precipitation is the source of all fresh ground water. Most precipitation on the land surfaceruns off, is consumed by evaporation, or is stored in the soil, later to be evaporated or transpired. Apart of the water infiltrates through the pores of the soil and subsoil to the zone of saturation bythe forces of gravity and molecular attraction. The zone of saturation is the zone below the watertable where the interstices are filled with fluid.
Ground water in the area occurs under water-table and artesian conditions. Under watertable conditions the water is unconfined. When tapped by a well, the unconfined water does notrise above the lone of saturation in the aquifer. Under artesian conditions, the water is confined.When tapped by a well, the confined water rises, due to hydrostatic pressure, above the level atwhich it is first encountered.
Fresh ground water occurs throughout Rusk County and often in at least several waterbearing sands. The most prolific water-producing zones are the artesian sands of the Wilcox,which are developed for municipal and industrial purposes. All significant withdrawals are fromthe artesian part of the Carrizo and Wilcox aquifers. Less productive shallow wells that tap thefirst saturated :;and below the land surface are often used for livestock and domestic purposes.
- 33 -
Water in these beds usually occurs under water-table conditions at a depth of less than 50 feetbelow land surface. Detailed information on individual wells is given in Table 8.
Recharge, Movement, and Discharge of Ground Water
Recharge, the addition of water to an aquifer by natural or artificial processes, occurs mainlyfrom the infiltration of rainfall into the outcrop. Recharge also may occur by percolation of waterfrom streams and ponded areas. There is a large potential for recharge in Rusk County becausethe Wilcox and Carrizo crop out in about 60 percent of the area. Although the actual rate ofrecharge is not known, it is probably less than 1 inch per year.
Ground water moves slowly throu~~h the aquifers under the force of gravity from areas ofrecharge to areas of discharge. The movement under water-table conditions is lateral todischarge areas which, under natural conditions, are topographically lower than the rechargearea. The movement under artesian conditions is toward areas of lower pressure head, normallydowndip in the aquifer. Water then moves vertically upward into the lower pressured shallowmaterial. Natural discharge also may occur through a seep or spring; artificial discharge mayoccur through a well. The rate of movement in the aquifers, either laterally or vertically, isdependent on the hydraulic gradient and conductivity of the material. Rates of movementprobably are a few hundred feet per year.
The direction of movement in Rusk County in the water-table parts ofthe aquifers generally istoward the streams. The direction of movement in the artesian parts of the principal aquifers, theCarrizo and Wilco>:, is from the outcrop toward the southeast and locally, toward the cones ofdepression at Henderson, East Texas Oil Field, and Tatum as shown in the potentiometric-surfacemap for the Wilcox (Figure 15).
Hydraulic Characteristics of the Aquifers
The importance of an aquifer as a source of water depends upon "its ability to store andtransmit water" according to Ferris and others (1962, p. 70). These characteristics are expressedin terms of storage coefficient and transmissivity.
No aquifer tests were conducted in Rusk County because of a lack of controlled conditions.Aquifer tests, however, have been performed using wells completed in the Wilcox, Carrizo, andQueen City aquifers in Cherokee County (W. F. Guyton and Associates, 1972), Gregg County(Broom, 1969), and Nacogdoches County(W. F. Guyton and Associates, 1970). The test data wereanalyzed either by tile Theis nonequilibrium method (Theis, 1935) or the modified Theis recoverymethod (Wenzel, 1H42, p. 95). The results are given in Table 3.
To estimate the expected range of transmissivities of the Wilcox and Carrizo aquifers in RuskCounty, the following assumptions were made:
1. The hydraulic conductivities of the sands in the three adjacent counties (Table 3) arerepresentative of the sands in these same aquifers in Rusk County;
- 34 -
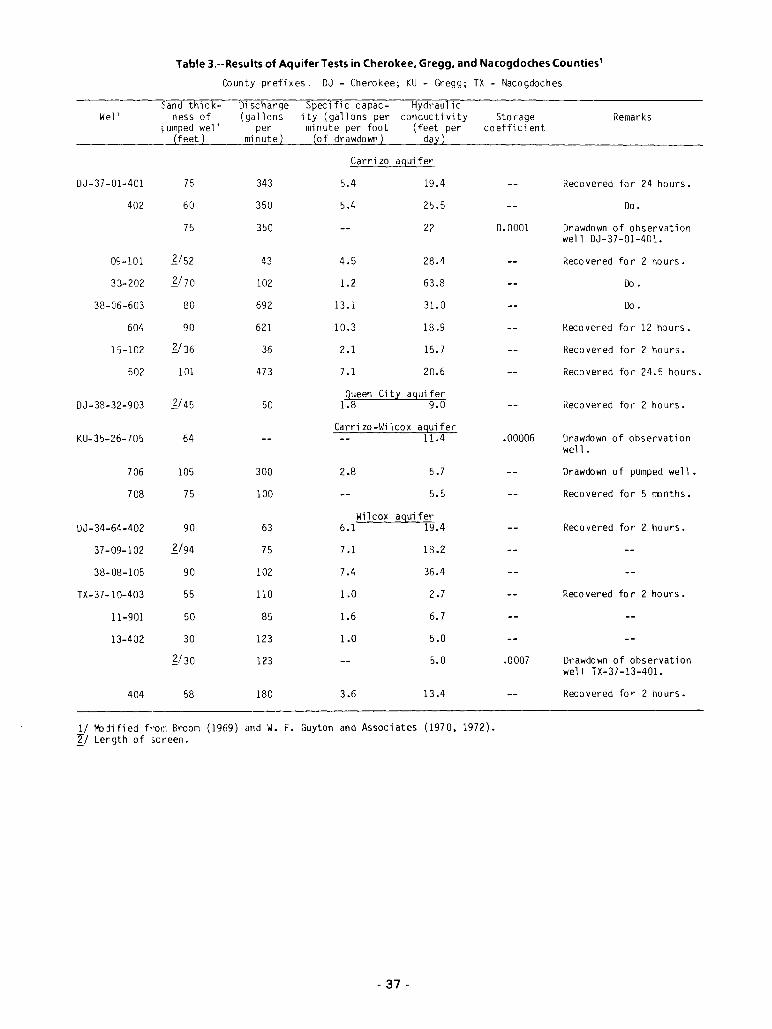
Table 3.·-Results of Aquifer Tests in Cherokee. Gregg. and Nacogdoches Counties'
County prefi xes: DJ - Cherokee; KU - Gregg; TX - Naco gdoc hes
Sand thick- Discharge :;pecific capac- HydraulicWel' ness of (gallons ity (gallons per conduc t i vi ty Storage Remarks
rumped well per minute per foot (feet per coeffici ent(feet) minute) (of drawdown) day)
Carri zo agui fer
DJ-37-01-401 75 343 5.4 19.4 Recovered for 24 hours.
402 60 350 5.4 25.5 Do.
75 350 22 0.0001 Drawdown of observationwell DJ-37-01-401.
09-101 ])52 43 4.5 28.4 Recovered for 2 hours.
33-202 ])]0 102 1.2 63.8 Do.
38-06-603 80 692 13.1 31.0 Do.
604 90 621 10.3 18.9 Reco vered for 12 hours.
15-102 2:./36 36 2.1 15.7 Reco vered for 2 hours.
502 101 473 7.1 20.6 Recovered for 24.5 hours.
2:./45Queen City agui fer
DJ-38-32-903 50 1.8 9.0 Recovered for 2 hours.
Carri zo -Wi 1cox agui ferKU-35-26-705 64 11.4 .00006 Drawdown of observation
well.
706 105 300 2.8 5.7 Drawdown of pumped well.
708 75 100 5.5 Recovered for 5 rronths.
Wilcox agui ferDJ-34-6'l-402 90 63 6.1 19.4 Recovered for 2, hours.
37-09-102 ll94 75 7.1 18.2
38-08-105 90 102 7.4 36.4
TX-37 -1 0-403 55 110 1.0 2.7 Reco vered for 2 hours.
11-901 50 85 1.6 6.7
13-402 30 123 1.0 5.0
2:./30 123 5.0 .0007 Drawdown of observationwell TX-37-13-401.
404 58 180 3.6 13.4 Recovered for 2 hours.
11 t-'o ji fi ed fl'OI7l Broom (1969) and W. F. Guyton and Associates (1970, 1972).II Length of icreen.
. 37 -
2. The sands opposite the screen are similar to the unscreened sands; and
3. The thickness of sands containing freshwater ranges from about 100 to 370 feet for theWilcox aquifer. '
Based on these assumptions, the transmissivities of the Wilcox aquifer would range from 270 to13,500 ft2/d; and based on a maximum sand thickness of 100 feet in the Carrizo aquifer, theestimated maximum transmissivity is 6,400 ft2/d.
Downdip from the outcrops where the Wilcox and Carrizo aquifers are under artesianconditions, the storage coefficients range from about 0.00006 to 0.0007, as indicated in Table 3.Although no data are available for the area, the storage coefficients for the aquifers underwater-table conditions would be expected to range from 0.1 to 0.2
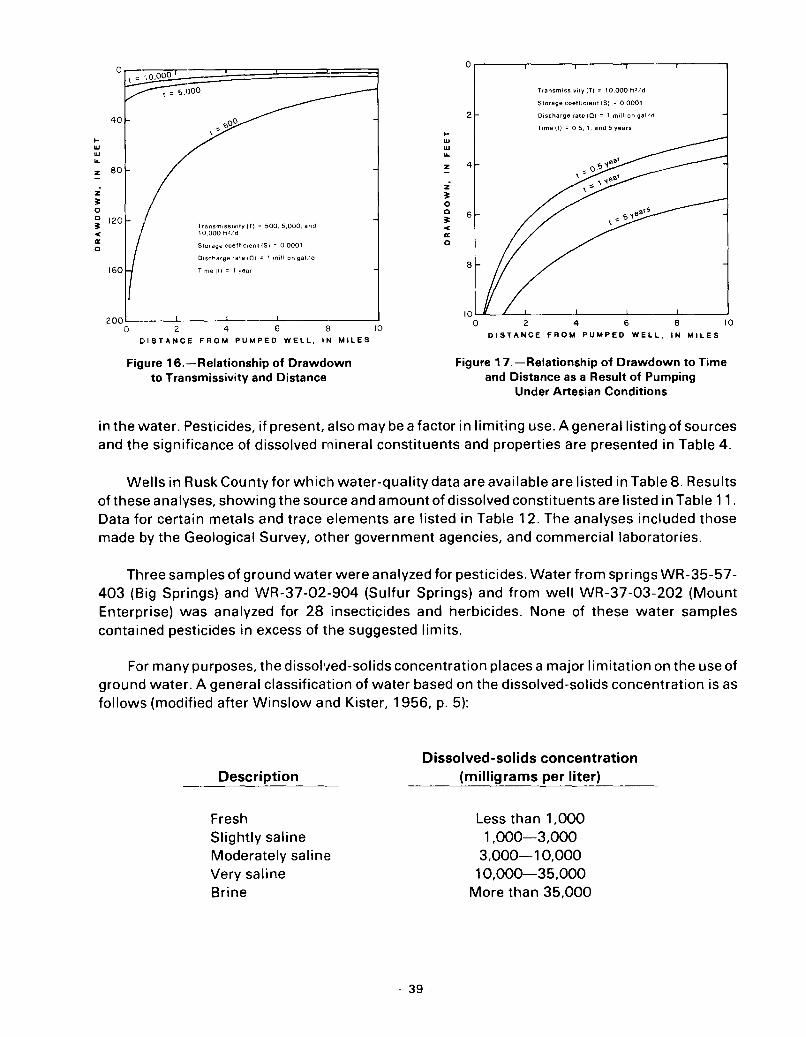
The transmissivities and storage coefficients must be known to predict the drawdown ofwater levels caused by pumping a well or ~Iroup of wells. The theoretical relationship of drawdownto transmissivity and distance is shown in Figure 16. Calculations of drawdown are made on thebasis of a group of wells pumping 1 miUion gal/d continuously for 1 year from an extensiveaquifer.
The relationship of drawdown to time and distance caused by a well or group of wellspumping 1 million gal/d from an artesian aquifer of infinite extent having a storage coefficient of0.0001 and a transmissivity of 10,000 ft 2/d is shown in Figure 17. The rate of drawdowndecreases with time, but the water level declines indefinitely until a source of recharge isintercepted to offset the withdrawal and establish equilibrium in the aquifer. Because thedrawdown is directly proportiona I to the rate of withdrawal, the drawdown for other than 1 mill iongal/d can be determined by multiplying the drawdown value shown in Figure 17 by the propermultiple or fraction of 1,000,000.
Notethat Figures 16 and 17 showthatthe drawdown caused by the pumping well is greatestnear the well and decreases as distance from the pumping well increases. This is the practicalreason for properly spacing wells; mutual interference is decreased and, consequently, pumpingcosts are reduced.
QUALITY OF GROUND WATER
Chemical constituents found in ground water originate principally from the soil and rocksthrough which the water has passed. Consequently, the chemical character of the water reflects,in a general way, the nature of the geologic formations that have been in contact with the water.Usually ground water in confined aquifers is free 'from contamination by organic matter.Sometimes, however, ground water in unconfined aquifers may become contaminated whencontaminated water percolates from the land surface.
Those factors determining the suitability of water for a particular use are the quality of thewater and the limitations imposed by the use. Important criteria used in establishing limitationsare bacterial contBnt, temperature, color, taste, odor, and concentration of chemical constituents
- 38 -
200L.---...L---~------'---~----'
o 2 4 6 B 10DISTANCE FROM PUMPED WELL, IN MILES
Transmissi\lily (T) ::: 10.000 ft 2 /d
Storage coefficient IS} ::: 00001
Discharge rate lQl ::: 1 million gat/d
Time (tl ::: 05,1, and 5 years
2 4 6 8 10DISTANCE FROM PUMPED WELL, IN MILES
6
8
2
0.----,-----,----,---,----,
z;too;t<a:o
..WWLL
Z 4
Discharge rate (Q) ::: , million gal/d
Time (II ::: , year
Transmissivity (T) :: 500. 5.000. and10,000 ft 2 1d
Siorage coefficient (5) ::: 00001
o 0t = 10,00
40
z;to~ 120
<a:o
..WWLL
:!: 80
Figure 16.-Relationship of Drawdownto Transmissivity and Distance
Figure 17,-Relationship of Drawdown to Timeand Distance as a Result of Pumping
Under Artesian Conditions
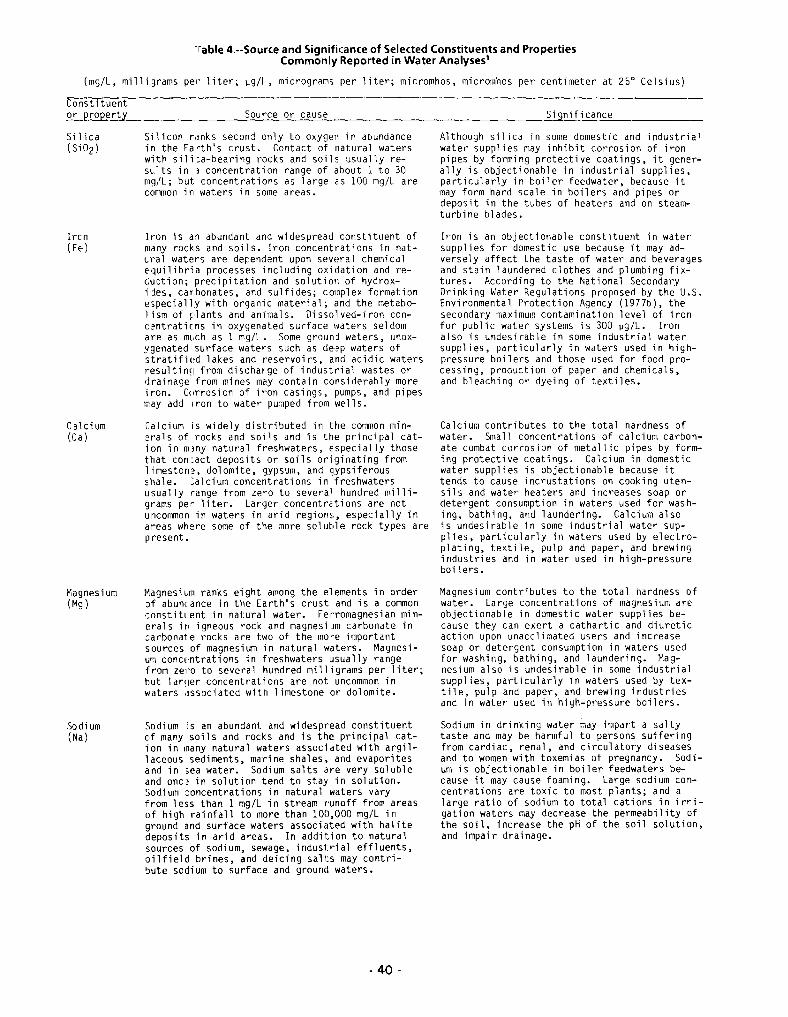
in the water. Pesticides, if present, also may be a factor in limiting use. A general listing of sourcesand the significance of dissolved mineral constituents and properties are presented in Table 4.
Wells in Rusk County for which water-quality data are available are listed in Table 8. Resultsof these analyses, showing the source and amount of dissolved constituents are listed in Table 11.Data for certain metals and trace elements are listed in Table 12. The analyses included thosemade by the Geological Survey, other government agencies, and commercial laboratories.
Three samples of ground water were analyzed for pesticides. Water from springs WR-35-57403 (Big Springs) and WR-37-02-904 (Sulfur Springs) and from well WR-37-03-202 (MountEnterprise) was analyzed for 28 insecticides and herbicides. None of these water samplescontained pesticides in excess of the suggested limits.
For many purposes, the dissolved-solids concentration places a major limitation on the use ofground water. A general classification of water based on the dissolved-solids concentration is asfollows (modified after Winslow and Kister, 1956, p. 5):
DescriptionDissolved-solids concentration
(milligrams per liter)
FreshSlightly salineModerately salin,eVery salineBrine
Less than 1,0001,000-3,000
3,000-10,00010,000-35,000
More than 35.000
- 39 -
"rable 4.--Source and Signifit:ance of Selected Constituents and PropertiesCommonly Reported in Water Analyses1
(mg/l, milli~rams pel' liter; ~g/l, micrograms per liter; micromhos, micromhos per centimeter at 25° Celsius)
Constituentor property
Si 1ica(Si02)
Iron(Fe)
Cal ci urn(Ca)
Magnesium(Mg)
Sodium(Na)
Source or cause
Si 1icon r.ink s second onl y to oxygen in abundancein the Earth's crust. Contact of natural waterswith sili:a-bearing rocks and soils usually results in l concentration range of about 1 to 30mg/l; but concentrations as large as 100 mg/l arecommon in waters in some areas.
Iron is an abundant and widespread constituent ofmany rocks and soils. Iron concentrations in natLral waters are dependent upon several chemicalequilibria processes including oxidation and recuction; precipitation and solution of hydroxides, carbonates, and sulfides; complex formationespecially with organic material; dnd the metabolism of f·lants and animals. Oissolved-iron conc:ntraticns in oxygenated surface \~aters seldomare as much as 1 mg/l. Some ground waters, unoxygenated surface waters such as deep waters of5 t rat ifi l~d 1akes and reservoi rs, and ac i di c watersresultin~1 from discharge of industrial wastes ordrainage from mines may contain considerably moreiron. Corrosion of iron casings, pumps, and pipesmay add I ron to water pumped from wells.
Calcium is widely distributed in the common miner'als of rocks and soils and is the principal cation in mlny natural freshwaters, especially thosethat con:act deposits or soils originating fromlimestone, dolomite, gypsum, and gypsiferousshale. :alcium concentrations in freshwatersusually range from zero to several hundred milligrams per liter. larger concentrations are notuncommon in waters in arid region~;, especially inareas where some of the more soluble rock types arepresent.
MagnesiLm ranks eight among the elements in orderJf abuncance in the Earth's crust and is a commonconstitLent in natural water. Ferromagnesian minerals irl igneous rock and magnesiJm carbonate incarbonate rocks are two of the more importantsources of magnesium in natural waters. Magnesium concl,ntrations in freshwaters Jsually rangefrom zel'o to severa 1 hundred mill i grams per 1iter;but lar<jer concentrations are not uncommon inwaters .Issociated with 1imestone or dolomite.
Sodium is an abundant and widespread constituentof many soils and rocks and is the principal cation in many natural waters associated with argillaceous sediments, marine shales, and evaporitesand in ;ea water. Sodium salts are very solubleand once in solution tend to stay in solution.Sodium concentrations in natural waters varyfrom le;s than 1 mg/l in stream runoff from areasof high rainfall to more than 100,000 mg/l inground and surface waters associated with halitedeposits in arid areas. In addition to naturalsources of sodium, sewage, industrial effluents,oilfield brines, and deicing salts may contribute sodium to surface and ground waters.
- 40 -
Significance
Although silica in some domestic and industrialwater supplies may inhibit corrosion of ironpipes by forming protective coatings, it generally is objectionable in industrial supplies,particularly in boiler feedwater, because itmay form hard scale in boilers and pipes ordeposit in the tubes of heaters and on steamturbine blades.
Iron is an objectionable constituent in watersupplies for domestic use because it may adversely affect the taste of water and beveragesand stain laundered clothes and plumbing fixtures. According to the National SecondaryDrinking Water Regulations proposed by the U.S.Environmental Protection Agency (1977b), thesecondary maximum contamination level of ironfor public water systems is 300 ~g/l. Ironalso is undesirable in some industrial watersupplies, particularly in waters used in highpressure boilers and those used for food processing, production of paper and chemicals,and bleaching or dyeing of textiles.
Calcium contributes to the total hardness ofwater. Small concentrations of calcium carbonate combat corrosion of metallic pipes by forming protective coatings. Calcium in domesticwater supplies is objectionable because ittends to cause incrustations on cooking utensils and water heaters and increases soap ordetergent consumption in waters used for washing, bathing, and laundering. Calcium alsois undesirable in some industrial water supplies, particularly in waters used by electroplating, textile, pulp and paper, and brewingindustries and in water used in high-pressureboilers.
Magnesium contributes to the total hardness ofwater. Large concentrations of magnesium areobjectionable in domestic water supplies because they can exert a cathartic and diureticaction upon unacclimated users and increasesoap or detergent consumption in waters usedfor washing, bathing, and laundering. Magnesium also is undesirable in some industrialsupplies, particularly in waters used by textile, pulp and paper, and brewing industriesand in water used in high-pressure boilers.
Sodium in drinking water may impart a saltytaste and may be harmful to persons sufferingfrom cardiac, renal, and circulatory diseasesand to women with toxemias of pregnancy. Sodium is objectionable in boiler feedwaters because it may cause foaming. large sodium concentrations are toxic to most plants; and alarge ratio of sodium to total cations in irrigation waters may decrease the permeability ofthe soil, increase the pH of the soil solution,and impair drainage.
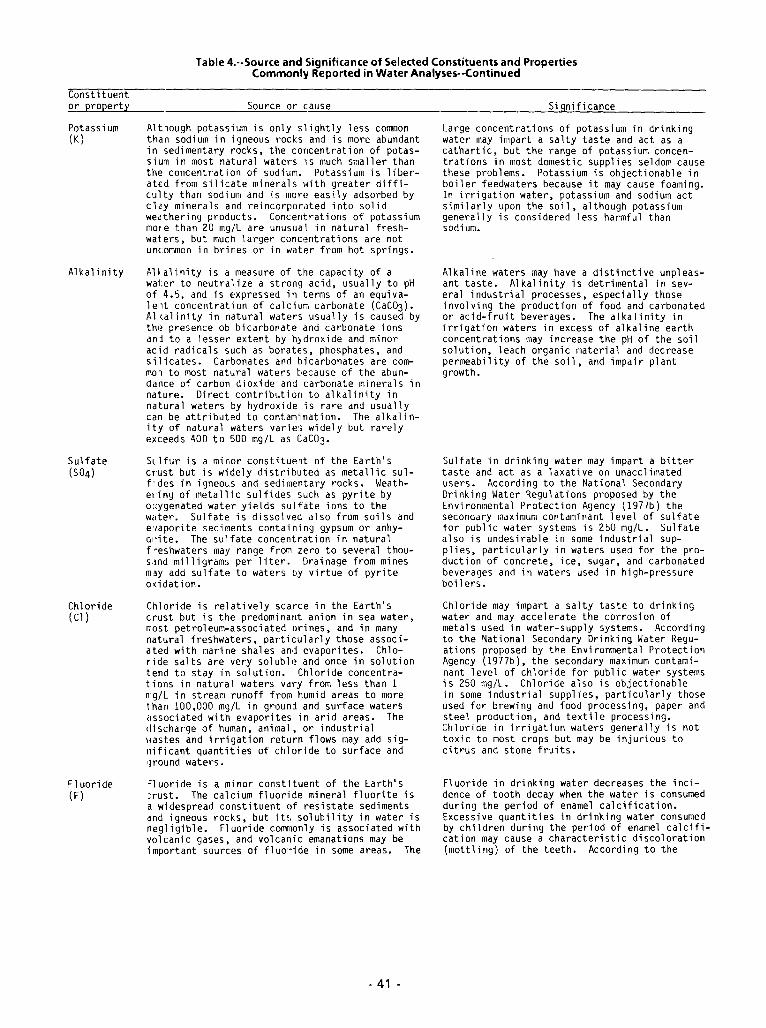
Table 4.--Source and Significance of Selected Constituents and PropertiesCommonly Reported in Water Analyses--Continued
Constituentor property
Potassium(K)
Al kal i nity
Sulfate(S04)
Chloride(Cl)
Fluoride(F)
Source or cause
Altl0Ugh potassium is only slightly less commonthan sodium in igneous rocks and is more abundantin sedimentary rocks, the concentration of potassium in most natural waters is much smaller thanthe concentration of sodium. Potassium is liberated from silicate minerals with greater difficulty than sodium and is more easily adsorbed byclay minerals and reincorporated into solidweathering products. Concentrations of potassiummor~ than 20 mg/L are unusual in natural freshwaters, but much larger concentrations are notuncommon in brines or in water from hot springs.
Allalinity is a measure of the capacity of awater to neutralize a strong acid, usually to pHof 4.5, and is expressed in terms of an equivalellt concentration of calcium carbonate (CaC03)'Al (al inity in natural waters usually is caused byth,~ presence ob bi carbonate and carbonate ionsanj to a lesser extent by hydroxide and minoracid radicals such as borates, phosphates, andsilicates. Carbonates and bicarbonates are commOl to most natural waters because of the abundance of carbon dioxide and carbonate minerals innature. Direct contribution to alkalinity innatural waters by hydroxide is rare and usuallycan be attributed to contamination. The alkalinity of natural waters varies widely but rarelyexceeds 400 to 500 mg/L as CaC03'
Sllfur is a minor constituelt of the Earth'scrust but is widely distributed as metallic sulf-des in igneous and sedimentary rocks. Weathel'i ng of meta 11 i c sulfi des such as pyri te byo~ygenated water yields sulfate ions to thewilter. Sulfate is dissolved also from soils ande'lapori te sedirlents contai ni ng gypsum or anhydrite. The sulfate concentration in naturalf-eshwaters may range from zero to several thousand milligrams per liter. Drainage from minesm3Y add sulfate to waters by vi rtue of pyriteoddation.
Chloride is relatively scarce in the Earth'scrust but is the predominant anion in sea water,rrost petroleum-associated brines, and in manynatural freshwaters, particularly those associated with rlarine shales and evaporites. Chloride salts are very soluble and once in solutiontend to stay in solution. Chloride concentra-t ions in natural waters vary from less than 1n1g/L in stream runoff from humid areas to morethan 100,000 mg/L in ground and surface waters<lssociated with evaporites in arid areas. Thedischarge of human, animal, or industrialwastes and irrigation return flows may add significant quantities of chloride to surface and'I round waters.
=luoride is a minor constituent of the Earth's:rust. The calcium fluoride mineral fluorite isa widespread constituent of resistate sedimentsand igneous rocks, but it~; solubility in water isnegligible. Fluoride co~nonly is associated withvolcanic gases, and volcanic emanations may beimportant sources of fl uol"i de in some areas. The
- 41 -
Significance
Large concentrations of potassium in drinkingwater may impart a salty taste and act as acathartic, but the range of potassium concentrations in most domestic supplies seldom causethese problems. Potassium is objectionable inboiler feedwaters because it may cause foaming.In irrigation water, potassium and sodium actsimilarly upon the so;l, although potassiumgenerally is considered less harmful thansodium.
Alkaline waters may have a distinctive unpleasant taste. Alkalinity is detrimental in several industrial processes, especially thoseinvolving the production of food and carbonatedor acid-fruit beverages. The alkalinity inirrigation waters in excess of alkaline earthconcentrations may increase the pH of the soilsolution, leach organic material and decreasepermeability of the soil, and impair plantgrowth.
Sulfate in drinking water may impart a bittertaste and act as a laxative on unacclimatedusers. According to the National SecondaryDrinking Water Regulations proposed by theEnvironmental Protection Agency (1977b) thesecondary maximum contaminant level of sulfatefor public water systems is 250 mg/L. Sulfatealso is undesirable in some industrial supplies, particularly in waters used for the production of concrete, ice, sugar, and carbonatedbeverages and in waters used in high-pressureboil ers.
Chloride may impart a salty taste to drinkingwater and may accelerate the corrosion ofmetals used in water-supply systems. Accordingto the National Secondary Drinking Water Reguations proposed by the Environmental ProtectionAgency (1977b), the secondary maximum contaminant level of chloride for public water systemsis 250 mg/L. Chloride also is objectionablein some industrial supplies, particularly thoseused for breWing and food processing, paper andsteel production, and textile processing.Chloride in irrigation waters generally is nottoxic to most crops but may be injurious tocitrus and stone fruits.
Fluoride in drinking water decreases the incidence of tooth decay when the water is consumedduring the period of enamel calcification.Excessive quantities in drinking water consumedby children during the period of enamel calcification may cause a characteristic discoloration(mottling) of the teeth. According to the
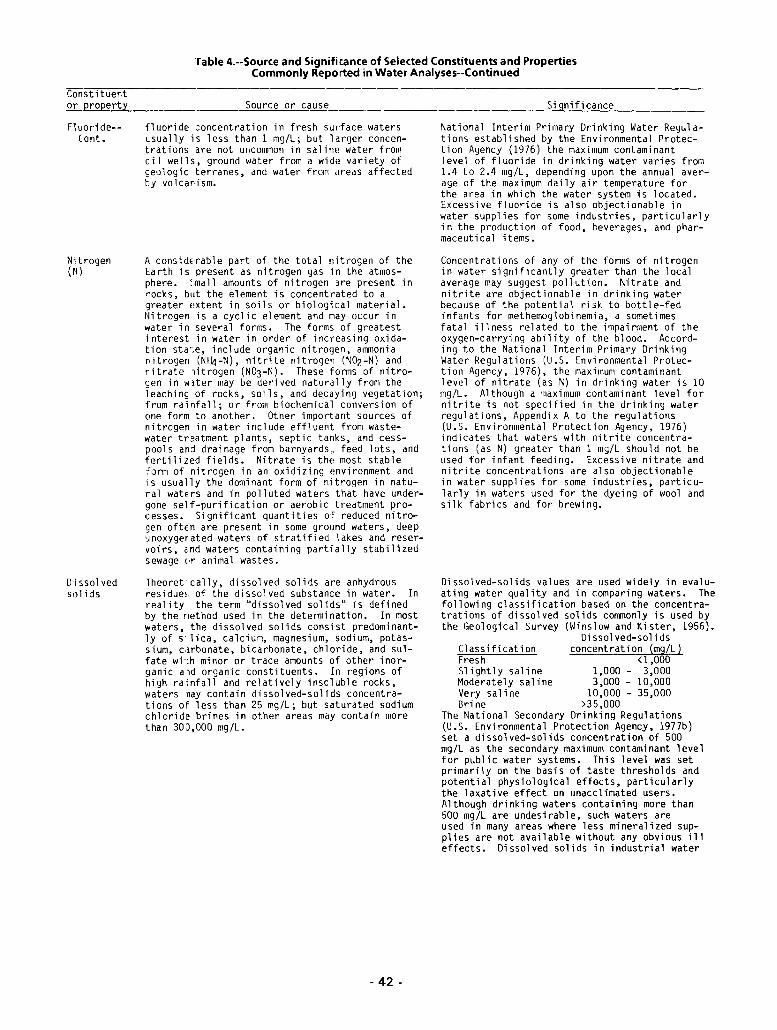
Table 4.--Source and Significance of Selected Constituents and PropertiesCommonly Reported in Water Analyses--Continued
Constituentor property
FI uori de-Cont.
Nitrogen(N)
Dissolvedsol ids
Source or cause
fluoride concentration in fresh surface waters~sually is less than 1 mg/L; but larger concentrations are not uncommon in saline water fromcil wells, ground water from a wide variety ofseologic terranes, and water from areas affectedby volcar·ism.
A considE'rable part of the total nitrogen of theEarth is present as nitrogen gas in the atmosphere. ~;mall amounts of nitrogen are present inrocks, but the element is concentrated to agreater pxtent in soils or biological material.Nitrogen is a cyclic element and may occur inwater in several forms. The forms of greatestinterest in water in order of increasing oxidation state, include organic nitrogen, ammonianitrogen (Nf4-N), nitrite nitrogen (N02-N) andritrate nitrogen (N03-N). These forms of nitrosen in w3ter may be derived naturally from theleaching of rocks, soils, and decaying vegetation;from rainfall; or from biochemical conversion ofone form to another. Other important sources ofnitrogen in water include effluent from wastewater treatment plants, septic tanks, and cesspools and drainage from barnyards" feed lots, andfertilized fields. Nitrate is the most stable"'orm of nitrogen in an oxidizing l!nvironment and'is usually the dominant form of nltrogen in natural watErs and in polluted waters that have undergone self-purification or aerobic treatment processes. Significant quantities of reduced nitro'~en oftEn are present in some ground waters, deep~noxygerated waters of stratified lakes and reservoirs, and waters containing partially stabilizedsewage (Ir animal wastes.
Theoret'cally, dissolved solids are anhydrousresidue! of the dissolved substance in water. Inreality, the term "dissolved solids" is definedby the rlethod used in the determination. In mostwaters, the dissolved solids consist predominantly of s' lica, calcium, magnesium, sodium, potassium, c,irbonate, bicarbonate, chloride, and sulfate wLh minor or trace amounts of other inorganic and organic constituents. In regions ofhigh rainfall and relatively insoluble rocks,waters nay contain dissolved-solids concentrations of less than 25 mg/L; but saturated sodiumchloride brines in other areas may contain morethan 300,000 mg/L.
- 42 -
Si gnifi cance
National Interim Primary Drinking Water Regulations established by the Environmental Protection Agency (1976) the maximum contaminantlevel of fluoride in drinking water varies from1.4 to 2.4 mg/L, depending upon the annual average of the maximum daily air temperature forthe area in which the water system is located.Excessive fluoride is also objectionable inwater supplies for some industries, particularlyin the production of food, beverages, and pharmaceutical items.
Concentrations of any of the forms of nitrogenin water significantly greater than the localaverage may suggest pollution. Nitrate andnitrite are objectionable in drinking waterbecause of the potential risk to bottle-fedinfants for methem09lobinemia, a sometimesfatal illness related to the impairment of theoxygen-carrying ability of the blood. According to the National Interim Primary DrinkingWater Regulations (U.S. Environmental Protection Agency, 1976), the maximum contaminantlevel of nitrate (as N) in drinking water is 10mg/L. Although a maximum contaminant level fornitrite is not specified in the drinking waterregulations, Appendix A to the regulations(U.S. Environmental Protection Agency, 1976)indicates that waters with nitrite concentrations (as N) greater than 1 mg/L should not beused for infant feeding. Excessive nitrate andnitrite concentrations are also objectionablein water supplies for some industries, particularly in waters used for the dyeing of wool andsilk fabrics and for brewing.
Dissolved-solids values are used widely in evaluating water quality and in comparing waters. Thefollowing classification based on the concentratrations of dissolved solids commonly is used bythe Geological Survey (Winslow and Kister, 1956).
Dissolved-solidsClassification concentration (mg/L)Fresh <1,000Slightly saline 1,000 - 3,000Moderately saline 3,000 - 10,000Very saline 10,000 - 35,000Bri ne >35,000
The National Secondary Drinking Regulations(U.S. Environmental Protection Agency, 1977b)set a dissolved-solids concentration of 500mg/L as the secondary maximum contaminant levelfor public water systems. This level was setprimarily on the basis of taste thresholds andpotential physiological effects, particularlythe laxative effect on unacclimated users.Although drinking waters containing more than500 mg/L are undesirable, such waters areused in many areas where less mineralized supplies are not available without any obvious illeffects. Dissolved solids in industrial water
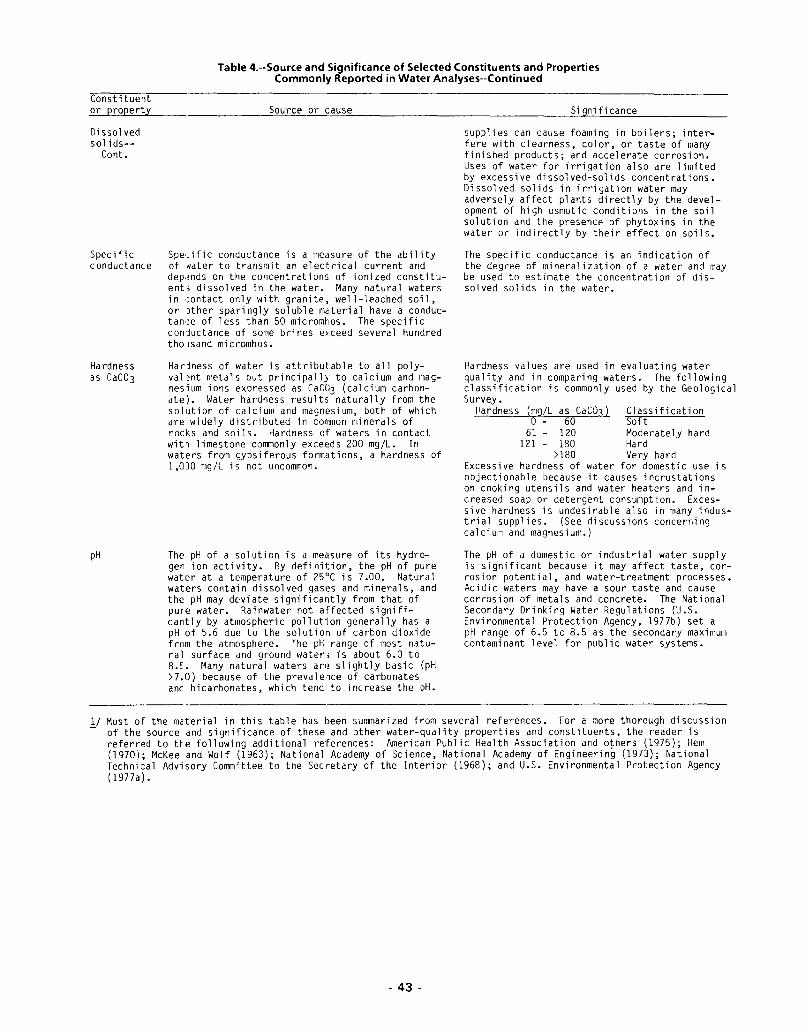
Table 4.--Source and Significance of Selected Constituents and PropertiesCommonl~' Reported in Water Analyses--Continued
Constituentor property
Dissolvedsolids-
Cont.
Specificconductance
Ha rdnessas CaC03
pH
Source or cause
Spe,;ific conductance is a f;leasure of the abil ityof 1ater to transmit an electrical current anddep,~nds on the concentrat ions of i oni zed const ituent; dissolved in the water. Many natural watersin ,;ontact only with granite, well-leached soil,or Jther sparingly soluble material have a conductan,;e of less than 50 micromhos. The specificconjuctance of some brines exceed several hundredthoJsand micromhos.
Harjness of water is attributable to all polyval ~nt metals but principally to calcium and magnesium ions expressed as CaC03 (calcium carbonate). Water hardness results naturally frof;l thesolution of calcium and magnesium, both of whichare widely distributed in coomon minerals ofrocks and soils. Hardness of waters in contactwitn 1imestone commonly exceE!ds 200 mg/L. Inwaters from gypsiferous formCitions, a hardness of1,0)0 mg/L is not uncommon.
The pH of a solution is a meCisure of its hydrogen ion activity. By definition, the pH of purewater at a temperature of 25"C is 7.00. Naturalwaters contain dissolved gases and minerals, andthe pH may deviate significantly from that ofpure water. Rainwater not affected significantly by atmospheric pollution generally has apH of 5.6 due to the solution of carbon dioxidefrom the atmosphere. The pH range of most natural surface and ground waters is about 6.0 to8.~. Many natural waters are sl ightly basic (pH>7.0) because of the prevalence of carbonatesand bicarbonCites, which tend to increase the pH.
Si gnifi cance
supplies can cause foaming in boilers; interfere with clearness, color, or taste of manyfinished products; and accelerate corrosion.Uses of water for irrigation also are limitedby excessive dissolved-solids concentrations.Dissolved solids in irrigation water mayadversely affect plants directly by the development of high osmotic conditions in the soilsolution and the presence of phytoxins in thewater or indirectly by their effect on soils.
The specific conductance is an indication ofthe degree of mineralization of a water and maybe used to estimate the concentration of dissolved solids in the water.
Hardness values are used in evaluating waterquality and in comparing waters. The followingclassification is commonly used by the GeologicalSurvey.
Hardness (mg/L as CaC031 Classification'---"-'-==~*O""'_'-=---'="6;:"'0""::"::=..J Soft
61 - 120 Moderately hard121 - 180 Hard
>180 Very hardExcessive hardness of water for domestic use isobjectionable because it causes incrustationson cooking utensils and water heaters and increased soap or detergent consumption. Excessive hardness is undesirable also in many industrial supplies. (See discussions concerningcalcium and magnesium.)
The pH of a domestic or industrial water supplyis significant because it may affect taste, corrosion potential, and water-treatment processes.Acidic waters may have a sour taste and causecorrosion of metals and concrete. The NationalSecondary Drinking Water Regulations (U.S.Environmental Protection Agency, 1977b) set apH range of 6.5 to 8.5 as the secondary maximumcontaminant level for public water systems.
)j Most of the mcterial in this table has been summarized from several references. For a more thorough discussionof the source and significance of these and other water-quality properties and constituents, the reader isreferred to t~e following additional references: American Public Health Association and others (1975); Hem(1970); McKee and Wolf (1963); National Academy of Science, National Academy of Engineering (1973); NationalTechn,cal Advisory Committee to the Secretary of the Interior (1968); and U.S. Environmental Protection Agency(1977a).
- 43 -
Water-Quality Criteria and Standards
The Federal Water Pollution Control Act Amendment of 1972 requires that the U.S.Environmental Protection Agency (EPAl publish criteria accurately reflecting the latest scientificknowledge. The law requires that these criteria consider the kind and extent of all identifiableeffects upon health and welfare that may result from the presence of any pollutants. Moreover,these criteria should be set forth for all bodies of water including ground water. During 1973, theEnvironmental Protection Agency published criteria relating to the protection of human healthand desired species of aquatic plants (National Academy of Sciences, National Academy ofEngineering,. 1973l. During 1976, the Environmental Protection Agency revised the earlier rules(U.S. Environmental Protection Agency, '1977a).
The Environmental Protection Agency's "Quality Criteria for Water, 1976," discusses morethan 50 constituents commonly occurring in water. It sets the recommended limits, presents thereason for selecting a given criteria, and cites references relating to these standards. Rules for theprimary drinking w3ter regulations were published in the Federal Register (U.S. EnvironmentalProtection Agency, 1976) and became effective July 3, 1979. Rules for the National secondarydrinking water regulations were published in the Federal Register (U.S. Environmental ProtectionAgency, 1979) and became effective January 19, 1981. Although concentrations of chemicalconstituents exceeding the recommended limits are objectionable, these limits may sometimesbe changed in areas where suitable water is not otherwise available, provided that health andpublic welfare are adequately protected (U.S. Environmental Protection Agency, 1979).
Aquifers and Geologic Units
Chemical anal'lses showing the concentrations of dissolved constituents in water from 158wells and 2 springs are listed in Table 11 .About 68 percent of these wells tap the Wilcox aquifer,18 percent the Carrizo aquifer, and 1 percent the combined Carrizo and Wilcox aquifers. Another13 percent tap the tasal sands of the Reklaw Formation, which are hydraulically connected to theunderlying Carrizo Electric logs are available for many additional wells and are useful indelineating variation in water salinity.
The dissolved-solids concentrations of water from representative wells from the variousunits are shown in Figure 18. Some of the wells inventoried in previous investigations could berelocated only approximately.
Chemical quality of ground water based on electric logs indicates that sand containingslightly saline watHr sometimes overlies freshwater sands. In places, even the shallow sandsyield slightly mineralized water. Water from 28 shallow wells, less than 75 feet deep, hadconcentrations of more than 1,000 mg/L (milligrams per literl dissolved solids according to Lyle(1937, p. 72-86). Water from nine of these wells had dissolved-solids concentrations exceeding3,000 mg/L. Partial analyses of water from two of these wells, WR-35-57-803 and WR-35-60701, are listed in Table 11.
- 44 -
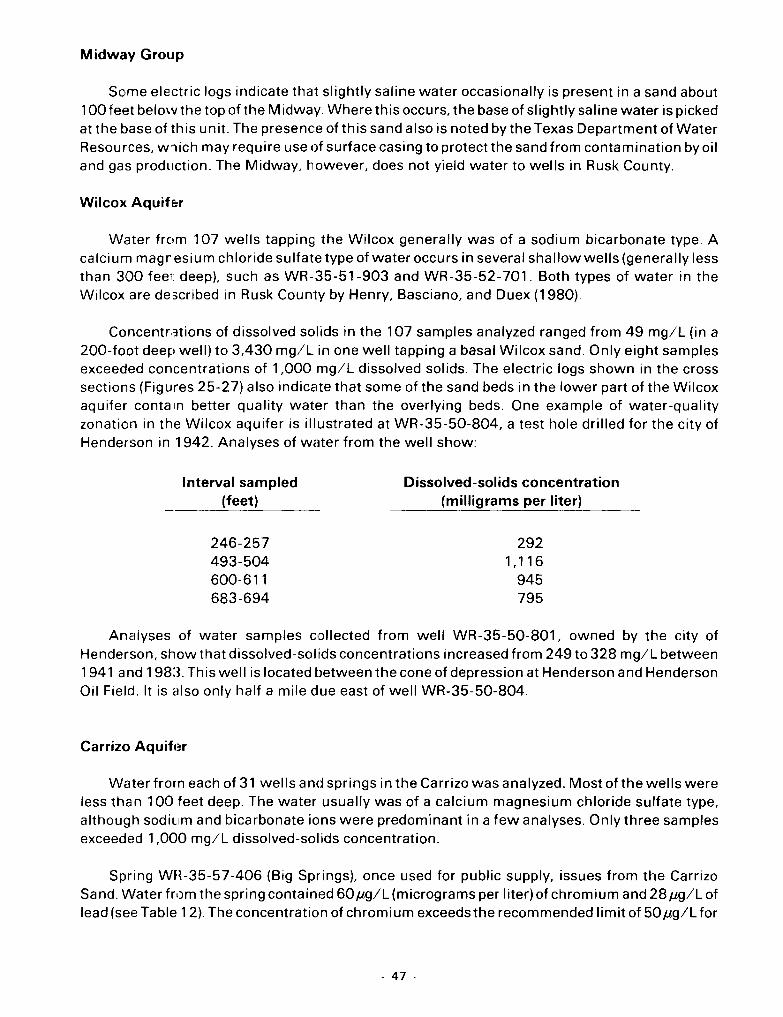
Midway Group
Some electric logs indicate that slightly saline water occasionally is present in a sand about100 feet below the top of the Midway. Where this occurs, the base of slightly saline water is pickedat the base of this unit. The presence ofthis sand also is noted by the Texas Department of WaterResources, w1ich may require use of surface casing to protect the sand from contamination by oiland gas production. The Midway, however, does not yield water to wells in Rusk County.
Wilcox Aquif&r
Water from 107 wells tapping the Wilcox generally was of a sodium bicarbonate type. Acalcium magr esium chloride sulfate type of water occurs in several shallow wells (generally lessthan 300 feer deep), such as WR-35-51-903 and WR-35-52-701. Both types of water in theWilcox are described in Rusk County by Henry, Basciano, and Duex (1980).
Concentrations of dissolved solids in the 107 samples analyzed ranged from 49 mg/L (in a200-foot deep well) to 3,430 mg/L in one well tapping a basal Wilcox sand. Only eight samplesexceeded concentrations of 1,000 mg/L dissolved solids. The electric logs shown in the crosssections (Figures 25-27) also indicate that some of the sand beds in the lower part of the Wilcoxaquifer contain better quality water than the overlying beds. One example of water-qualityzonation in the Wilcox aquifer is illustrated at WR-35-50-804, a test hole drilled for the city ofHenderson in 1942. Analyses of water from the well show:
Interval sampled(feet)
------'-- -'----
246-257493-504600-611683-694
Dissolved-solids concentration(milligrams per liter)
----
2921,116
945795
Analyses of water samples collected from well WR-35-50-801, owned by the city ofHenderson, show that dissolved-sol ids concentrations increased from 249 to 328 mg/L between1941 and 198:3. This well is located between the cone of depression at Henderson and HendersonOil Field. It is also only half a mile due east of well WR-35-50-804.
Carrizo Aquif(~r
Water from each of 31 wells and springs in the Carrizo was analyzed. Most of the wells wereless than 100 feet deep. The water usually was of a calcium magnesium chloride sulfate type,although sodium and bicarbonate ions were predominant in a few analyses. Only three samplesexceeded 1,000 mg/L dissolved-solids concentration.
Spring WH-35-57-406 (Big Springs), once used for public supply, issues from the CarrizoSand. Waterfrom the spring contained 60j.tg/L (micrograms per liter) of chromium and 28j.tg/L oflead (see Table 12). The concentration of chromium exceeds the recommended limit of 50j.tg/L for
- 47 -
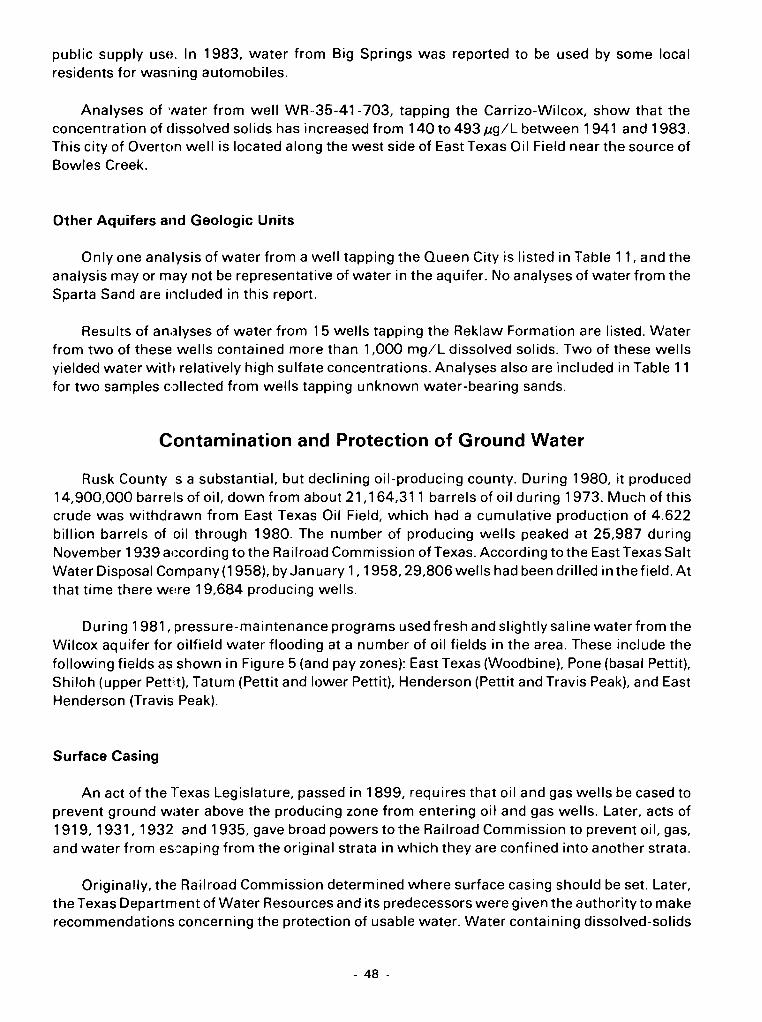
public supply USH. In 1983, water from Big Springs was reported to be used by some localresidents for wasning automobiles.
Analyses of water from well WR··35-41-703, tapping the Carrizo-Wilcox, show that theconcentration of dissolved solids has increased from 140 to 493 J-lg/L between 1941 and 1983.This city of Overton well is located along the west side of East Texas Oil Field near the source ofBowles Creek.
Other Aquifers and Geologic Units
Only one analysis of water from a well tapping the Queen City is listed in Table 11, and theanalysis mayor may not be representative of water in the aquifer. No analyses of water from theSparta Sand are included in this report.
Results of analyses of water from 15 wells tapping the Reklaw Formation are listed. Waterfrom two of these wells contained more than 1,000 mg/L dissolved solids. Two of these wellsyielded water with relatively high sulfate concentrations. Analyses also are included in Table 11for two samples c:>llected from wells tapping unknown water-bearing sands.
Contamination and Protection of Ground Water
Rusk Countys a substantial, but declining oil-producing county. During 1980, it produced14,900,000 barrels of oil, down from about 21,164,311 barrels of oil during 1973. Much of thiscrude was withdrawn from East Texas Oil Field, which had a cumulative production of 4.622billion barrels of oil through 1980. The number of producing wells peaked at 25,987 duringNovember 1939 according to the Railroad Commission of Texas. According to the East Texas SaltWater Disposal Company(1958). byJanuary 1,1958,29,806 wells had been drilled in the field. Atthat time there wme 19,684 producing wells.
During 1981, pressure-maintenance programs used fresh and slightly saline water from theWilcox aquifer for oilfield water flooding at a number of oil fields in the area. These include thefollowing fields as shown in Figure 5 (and pay zones): East Texas (Woodbine), Pone (basal Pettit),Shiloh (upper Pettit). Tatum (Pettit and lower Pettit), Henderson (Pettit and Travis Peak), and EastHenderson (Travis Peak).
Surface Casing
An act of the Texas Legislature, passed in 1899, requires that oil and gas wells be cased toprevent ground water above the producing zone from entering oil and gas wells. Later, acts of1919, 1931, 1932 and 1935, gave broad powers to the Railroad Commission to prevent oil, gas,and water from es:aping from the original strata in which they are confined into another strata.
Originally, the Railroad Commission determined where surface casing should be set. Later,the Texas Department of Water Resources and its predecessors were given the authority to makerecommendations concerning the protection of usable water. Water containing dissolved-solids
- 48 -
200
t:; 400
w"-z 600
concentrations of less than 3,000 mg/L isrecommended for protection by use of surfacecasing or cement. Recommendation forprotection of more highly mineralized watermay be made if the water is being used forbeneficial purposes.
Figure 19.-Relationship Between Surface-CasingRequirements clnd the Base of Fresh to Slightly
Salin.~ Water, Rusk County
1•
DEPTH ,)FCEMENTED CASING--Asspecified in field ru les -01 the TexasRadrooc Commission
1800 (I BASE O~ SLIGHTLY SALINE WATER-\J DioQonol line indicates ranQe of depfh
2000~
The depth to the base of sands containingfresh to slightly saline water (in those fieldsfor which field rules exist) and the amount ofrequired cemented surface casing, accordingto published rules of the Railroad Commissionof Texas are shown in Figure 19. A recentstatewide regulation of the Railroad Commission of Texas (1979) relating to the drilling,producing, and plugging of any oil, gas, orgeothermal well requires the protection ofusable water both above and below thesurface. Also, the Texas Department of WaterResources requires that all fresh and slightlysaline water sands be protected. However,
according to the original field rules in 1932 for East Texas (Woodbine) Oil Field, the base of usablewater is not adequately protected.
wu~ BOO<rco~
3 1200
w<D
J: 1400>-QW
Cl 1600
CI 1000z..~
Disposal of Saltwater
Considera:>le amounts of brine are produced in Rusk County in connection with theproduction of oil. If mishandled in improperly cased or plugged oil wells or tests holes, thesebrines can mO\le upward from the underlying higher pressured saltwater-bearing formations intozones of fresh 3nd slightly saline water. To prevent this, the Railroad Commission requires thatbrine be dispo~,ed of in ways that will not contaminate freshwater.
Between January 1,1969, (when the Railroad Commission established a rule prohibiting theuse of open pits for disposal of oilfield brine) and 1981, nearly all of the brine produced in RuskCounty was disposed of through injection wells. Currently (1982), this is particularly true in thearea around East Texas Oil Field where the additional water is needed to maintain reservoirpressure for secondary recovery.
Large quantities of saltwater have been produced from East Texas Oil Field. During someyears, the production of saltwater almost equaled the production of oil. The amounts (dailyaverage) of saltwater that were produced, injected, and otherwise diverted for selected years areshown in Table 5.
- 49 -
Table 5.--Saltwater Production and Disposal, East Texas Oil Field
(Fi gures ITO di fi ed fro IT! East Texas Sal t Water Oi sposal Co., 1958, andTexas \~ater Cor:lfnission and Texas Water Po 11 ution Control Board, 1963)
Saltwater produced Sa1t\~ater injected Saltwater otherwise divertedYear (daily average) ~li1y average) (dail y average)
Barrel s Mi 11 ion Ban~els Million Barrels Mill iongallons gallons gallons
1935 15,000 0.63 0 0 15,000 0.63
1938 100 ,000 4.20 610 .03 100,000 4.17
1942 439,000 18.44 81,000 3.40 358,000 15.04
1950 643,000 27.00 466,000 19.57 177,000 7.43
1961 433,000 18.19 429,000 18.02 4,000 0.17
NOTE : Fi gures may vary slightly due to round; ng proc edures •
- 50 -
A study of saltwater disposal (Rai Iroad Commission of Texas, 1952, p. 91) showed that duringOctober 1935, East Texas Oil Field had been producing about 15,000 barrels of saltwater per day.By 1938, water production had incrE!ased to about 100,000 barrels per day. During this period,saltwater was pumped into natural drainage systems. Saltwater was first reinjected into thesubsurface during June 1938. By 1942, saltwater production had increased to 439,000 barrelsper day. This was equivalent to about 18.44 million gal/d, of which 18.4 percent was beingreinjected into the producing Woodbine sands. About 15 million gal/d was being otherwisediverted, probably into surface pits and into the natural drainage system.
During 1961, the total brine production for East Texas Oil Field was estimated to be155,193,391 barrels. About 99 percent was disposed of through injection wells. About 0.2percent, 0.4 million gal/d was disposed of through open surface pits, while another 0.7 percent,0.12 million gal/d was disposed of by unknown methods. (See Texas Water Commission and theTexas Water Pollution Control Board, 1963.)
Contamination
One case of oilfield brine contamination has been documented at Henderson Field in RuskCounty by Burnitt (1963). Contamination was found in an 85-foot deep water well (WR-35-50204) and at three stream sites along the Beaver Run and Cherokee Bayou drainage areas.Leakage occurred from unlined surface pits, formerly used for storing oilfield brines. Analyses ofwater collected from the contaminated well show relatively high amounts of calcium, sodium,chloride, and total dissolved solids, and a relatively low pH. The first sample was collected after 1minute of pumping; the second sample after 5 hours of pumping. During this period, the totaldissolved solids increased from 1,870 to 2,475 mg/L; the pH declined from 6.5 to 5.6. Watercollected from one stream site contamed 50 mg/L of dissolved solids. Water collected from thethree contaminated stream sites had dissolved-solids concentrations of 116,880, 6,684, and6,609 mg/L.
Hughes and Leifeste (1967) completed a reconnaissance of water quality of surface water inthe Neches River basin. Their study includes data on Striker Creek Lake and the Striker Creekdrainage basin, which also includes the Bowles Creek watershed. Water samples were collectedduring low flows from 24 sites in the Striker Creek basin during March and June 1964. Hughesand Leifeste (1967, p. A21) reported that some earthen pits were still used to store oil-field brine.They also observed oil wastes along the banks of water courses, which indicated that there hadbeen brine spills. "In addition to deliberate dumping," reported Hughes and Leifeste, "brine alsoreaches streams as a result of leaks in collection systems, breaks in pipelines, overflow of storagetanks, and other accidents incidental to the handling of large volumes of waste water." Thefollowing are conclusions they reached:
1. Bowles Creek and its tributaries are the source of most of the salinity;
2. Many streams carry acid water with the pH as low as 3.2;
3. Sodium and chloride are the principal dissolved constituents;
- 5 t -
4. Sulfate concentrations generally are low throughout the area;
5 Where acid water occurs outside the oilfield area, sulfate is the principal anion; and
6. High chloride water was not found outside the oilfield area.
DEVELOPMENT AND USE OF GROUND WATER
History of Development
Prior to about 1920, nearly all the water used in Rusk County came from shallow wells duinto the Wilcox and Carrizo aquifers. Numerous springs (there may be as many as severehundred) also provic1e water throughout much of the area. Brune (1981, p. 390-394) in "Springof Texas" lists 43 springs of historical interest. Many of these are located along the MounEnterprise Fault Zone. Stockman Springs (WR-37-03-403), west of Mount Enterprise, is locate,along the East Fork cf the Angelina River. Brune reports that in 1833, Henry Stockman received,land grant which included the springs now named after him. He also relates that Stockman, alon!with a yoke of oxen, drowned in the springs. Other springs such as Sulphur Springs (WR-37-02904) are of similar extent.
The discovery 0': East Texas Oil Field in 1930 created an immediate demand for water to bEused for industrial purposes. Almost all of this withdrawal was from the Carrizo and WilcOJaquifers. Turner (1932, p. 6) estimated that about 16.2 million galld was being withdrawn fOIoilfield operations in Rusk and Gregg Counties. The cities of Kilgore (Gregg and Rusk Countiesand Longview (Greg!) County) at first used water from the Sabine River. By 1934, concentratiomof oilfield brines and industrial wastes became so high during low flow in the Sabine River tha1these cities located other sources of dri nki ng water. For a while Longview diverted creek water fOIdrinking, but now (1982) uses water from Lake Cherokee (Rusk and Gregg Counties). Kilgorewithdraws ground water from well fields in Smith County.
When Lyle (1937) inventoried 406 wells in Rusk County, only 15 were classified as industrial.8 as public supply, and 16 as "oilfield" use. Most of the larger-capacity wells were concentratedaround East Texas Oil Field and the city of Henderson. Elsewhere, shallow-dug wells were usedfor domestic and livestock purposes.
Much of the industrial use of ground water is related to the production of oil and gas withmost of the withdrawals concentrated in East Texas Oil Field. Follett (1943) inventoried thoseindustrial wel~s in thE! northwestern part of the county. During 1981, water levels were measuredin some of the same wells he visited.
Shallow wells continued to be used rather extensively in the area until the late 1960's andearly 1970's. By then, a number of rural water-supply corporations were organized under theauspices of the Farmers Home Administration. During 1981, there were 24 active water-supplycorporations serving residents of Rusk County. These systems, together with the municipalities ofHenderson, Overton, New London, and Tatum, supply about 90 percent of the water used fordomestic and livestock purposes.
- 52 -
Use of Water
Withdrawals of ground water during 1960, 1970, and 1980 are summarized by use in Table6. During 1980, all significant withdrawals of ground water, about 4.6 million gal/d, were fromthe Wilcox aquifer. Ofthis amount, about 94 percent was freshwater. Numerous springs, creeks,and ponds supply the water needs jfor livestock. Surface water is used for some public supply andindustrial purposes. The Elderville Water-Supply Corporation obtains water from Lake Cherokeethrough the city of Longview; Texas Utilities Generating Company uses Martin Lake as a source ofcooling water at their generating plant.
Municipal Use
Estimates of municipal use of ground water are listed in Table 7. Of the 4.20 million gal/d ofground water used for public supply, 3.23 million gal/d of water was used by the fivemunicipalities listed in Table 7. The city of Henderson, the largest single user, pumped 2.05million gal/d of ground water from the Wilcox during 1980. The average per capita consumptionof ground water from the five lar!~est communities was 190 gal/d. The 24 rural water-supplycorporations serving the smaller communities furnished about 0.97 million gal/d or about 23percent of the water used for public supply during 1980. The approximate area served by all 29public water-supply systems in Husk County is shown in Figure 20. Elderville Water SupplyCorporation, which uses surface water from Lake Cherokee, is the only public supply system thatdoes not use ground water.
Industrial Use
Industrial use during 1980 was estimated to be about 0.50 million gal/d, a decline of morethan 50 percent from 1970. Nearly all of the industrial use is for cooling at gasoline plants andrefineries. Increased energy costs have caused some operators to replace ground water withmore economical sources of cooling, such as air and liquid hydrocarbons. Other industrial usershave abandoned their wells and now obtain water from public-supply sources.
Mining Use
Withdrawalsofwaterfor mining(fuels)are reported to the Railroad Commission ofTexas. During1980, about 0.550 million gal/d of water was withdrawn from the Wilcox aquifer for pressuremaintenance. One example of such a project, Mobil's T.O. Mason lease, is pictured in Figure 21.Here, slightly saline water from the Wilcox is treated and mixed with produced brine from theWoodbine. This fluid is then injected underground in secondary recovery of oil at East Texas OilField. Pressure maintenance operations (water flooding) are or have been underway at eightoil-field sites in East Texas, two in Tatum, one in Henderson, one in South Henderson, one inPone, and one in Shiloh.
- 53 -
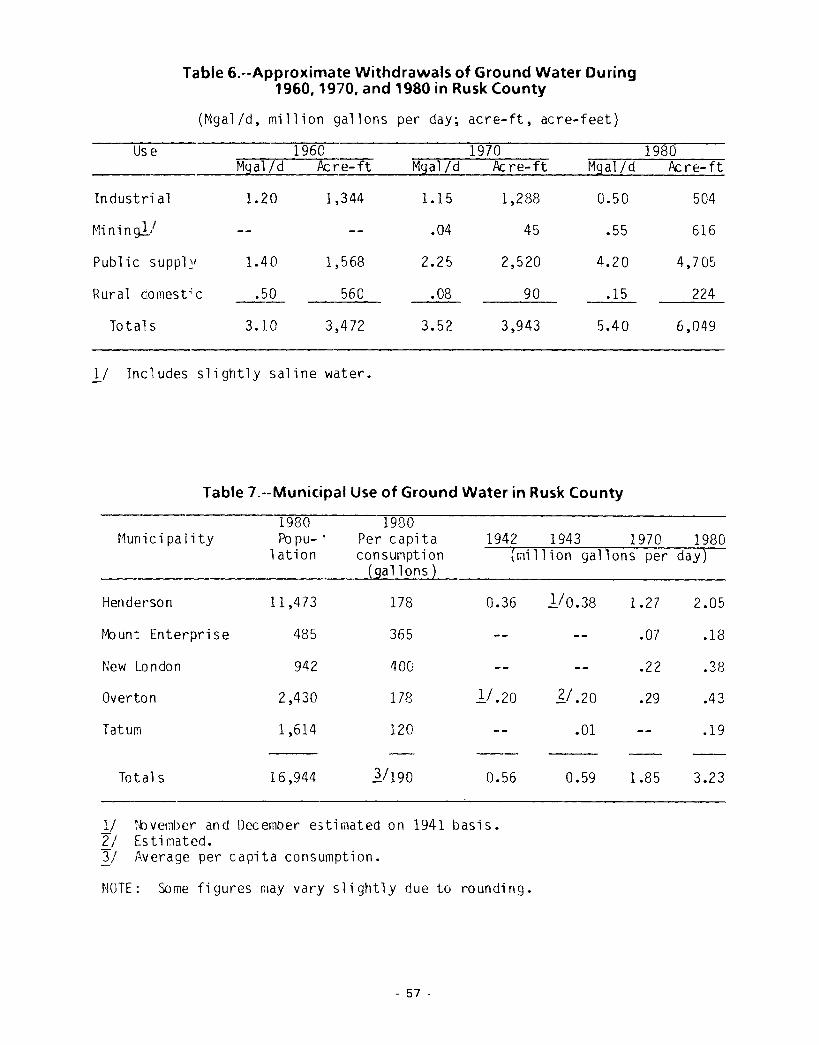
Table 6.--Approximate Withdrawals of Ground Water During1960,1970, and 1980 in Rusk County
(Mgal/d, million gallons per day; acre-ft, acre-feet)
Use 1960 1970 1980Mgal/d kre-ft Mgal/d kre-ft Mgal/d Ac re-ft
Industri al 1.20 1,344 1.15 1,288 0.50 504
M" . }/ .04 45 .55 616" n1 n 9-=-'
Public suppl~' 1.40 1,568 2.25 2,520 4.20 4,705
Rural Gomest; c .50 560 .08 90 .15 224
Tota1s 3.10 3,472 3.52 3,943 5.40 6,049
II Inc 1udes slightly saline water.
Table 7.--Munitipal Use of Ground Water in Rusk County
1980 1980~~un i c i pal i ty Po pu- . Per capita 1942 1943 1970 1980
lation consurlption (~illion gallons per day)(gallons)
Henderson 11,473 178 0.36 1/0.38 1.27 2.05
rlloun: Enterprise 485 365 .07 .18
New London 942 400 .22 .38
Overton 2,430 178 1/ .20 ]j .20 .29 .43
Tatum 1,614 120 .01 .19
Totals 16,944 1/190 0.56 0.59 1.85 3.23
II tbvernber and December estifilated on 1941 basis.21 Estirlated.11 Average per capita consumption.
NOTE: Some figures may vary slightly due to rounding.
- 57 -
Figure 21.-Water-Storage Tank at Mobil's T.O. MasonPressure-Maintenance Project in East Texas Oil Field
Changes in Water Levels
Most water levels in Rusk CountV were measured during three periods: during 1936,between 1937 and 1940, and from about 1972 through 1981. Most of the observation wellsbefore 1972 were concentrated near the city of Henderson. During 1972, the Texas Departmentof Water Resources initiated a network of observation wells that included the entire county.Practically no water-level data are available prior to the discovery of East Texas Oil Field in 1930.
Water-level measurements (three or less) are listed in the records of wells, springs, and testholes (Table 8). Other measurements (four or more) are tabulated in the list of water levels in wells(Table 10). Hydrographs depicting water-level fluctuations in selected wells are shown in Figure22.
Many of the water levels measured are in wells that show no particular change. These waterlevels rise and fall due to changes in season and variations in rainfall. Sustained long-termdeclines in water levels are evident in two places, near the city of Henderson and in the area ofEast Texas Oil Field. In both areas there is a concentration of wells producing an average of over amillion gallons per day. Most of the wells withdraw water from the middle and lower Wilcoxsands.
At the city of Henderson, a modelrate cone of depression (Figure 15) has resulted fromground-water withdrawals of about 2.0 million gal/d. The water level in well WR-35-50-901,near Henderson, declined about 134 feet between 1935 and 1981 (Figure 22).
- 58 -
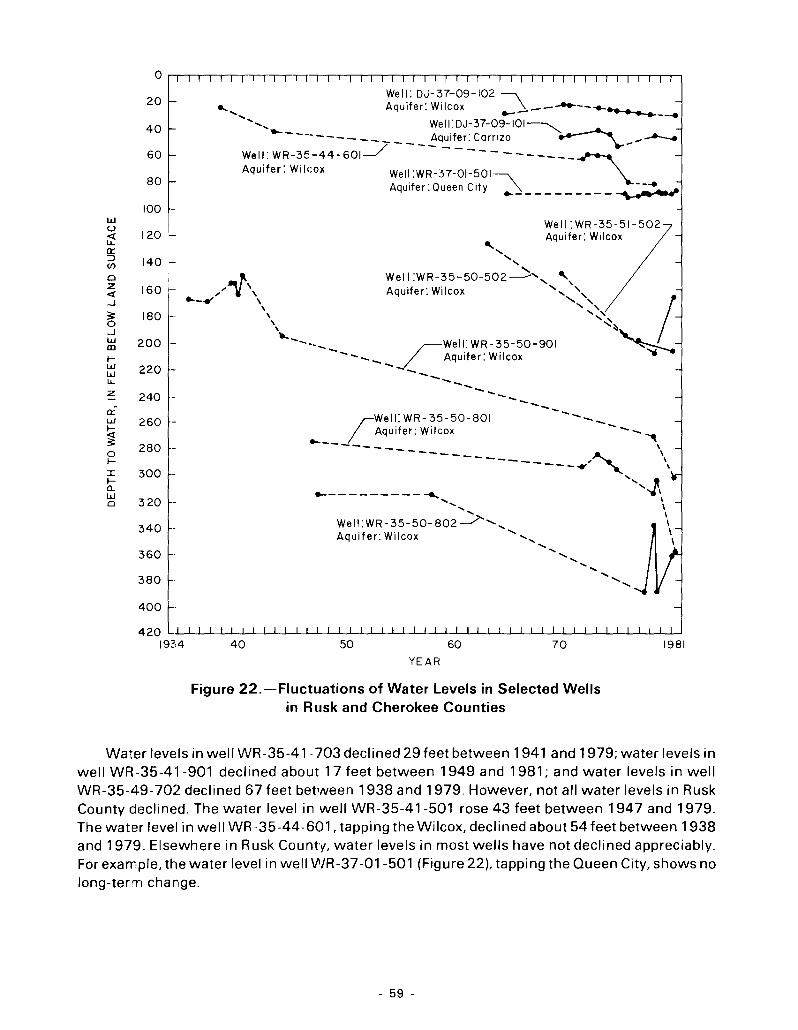
20
40
60
80
Well: DJ-37-09-102 ~.... Aquifer: Wilcox \ __ ......---.............-
............. ......- ... ---.-.-----........... Well:DJ-37-09-101~
--------- ~quifer:Carrizo ~ __ ..-....-
Well: WR-35-44-60I J ----- ----- __~Aquifer: Wi Icox Well :WR-3 7-01-501 '\..
Aquifer:Queen City~ ~
100
320 -
340
360
380
400
420 I I I I
19:,4 40 1981
""'"\ ,\
\
70
Well :WR-35-51-502Aquifer: Wilcox
6050
---------- ...... ...... ........Well: WR-35-50-802-?...........Aquifer: Wilcox ...............
..... ....."-
...............
rWelJ: WR- 35-50-801/ Aquifer: Wilcox
.------------- ,------ 11----- ...
........'.}II\I\\\
.... ,"
"-.,; Well :WR-35-50-502----', "
~_.-/ \\ ."if,,:Wil,., "<'~~~, /'-..- """-._-_ Fwell:WR-35-50-901 ~
--_ Aquifer: Wilcox-- --------------------
140 -
180 -
120 \-
160 1-
260 -
220 -
280 -
240 -
300 -
200 -
W<J
~a::::J(f)
Clz<X:...J
~o...JWmIwWLL
Z
a::w
~ol-IIa..wCl
YEAR
Figure 22.-Fluctuations of Water Levels in Selected Wellsin Rusk and Cherokee Counties
Water levels in well WR-35-41-703 declined 29 feet between 1941 and 1979; water levels inwell WR-35-41-901 declined about 17 feet between 1949 and 1981; and water levels in wellWR-35-49-702 declined 67 feet between 1938 and 1979. However, not all water levels in RuskCounty declined. The water level in well WR-35-41-501 rose 43 feet between 1947 and 1979.The water level in well WR-35-44-601, tapping the Wilcox, declined about 54 feet between 1938and 1979. Elsewhere in Rusk County, water levels in most wells have not declined appreciably.For example, the water level in well \/VR-37-01-501 (Figure 22), tapping the Queen City, shows nolong-term change.
- 59 -
Well Construction
Well construction depends on several factors such as the desired capacity of the well,intended use, allowable cost, methods of drilling, and quality of the water desired. Someinformation on the well construction used in the county is tabulated in Table 8. Except forshallow-dug wells, wells are cased and have slotted screen opposite water-bearing sands.
Large-capacity wells such as thosl3 used for industrial and municipal supply are drilled byhydraulic rotary methods. First, a test hole (usually 6 inches in diameter) is drilled to total depthand logged for thickness of sand interva Is. Water samples are collected to determine water qualityin the different sands. If the data indicate that sufficient quantities of suitable quality water can bedeveloped, a well is constructed. Test drilling is necessary in much of Rusk County, butparticularly in the Mount Enterprise Fault Zone or in areas where the Wilcox sands contain waterthat varies in quality.
In a typical large-capacity well, the upper part of the test hole usually is reamed to 14 to 20inches in diameter. A slightly smaller surface casing is set and cemented in place to form thepump pit or housing. The remaining part ofthe test hole is then reamed to a diameter slightly lessthan that of the surface casing. The interval to be screened is then underreamed as desired,usually to 30 inches in diameter, and B- to 12-inch diameter wire-wrapped screens and blankcasing are installed. Next, the annular space between the screen or casing and the wall of the holeis filled with sorted gravel. This gravel pack stabilizes the hole and effectively increases thediameter of the well. Large-capacity wells are developed and tested with large-capacity pumps.The wells then are fitted with deep-well turbine pumps, usually powered by electric motors.Properly constructed wells in the Wilcox or Carrizo aquifers yield about 500 gal/min.
Most of the drilled wells used for livestock and domestic purposes in Rusk County have 2- to4-inch casing. Generally, jet pumps are used for the smaller-diameter wells if the water level isnear the surface, and submersible pumps are used in the deeper 4-inch wells. Plastic (PVC) casingis often used due to its lower cost and ability to resist corrosion from water having a low pH or highiron content. Often the 4-inch wells are completed with a smaller-diameter single screen placedat the bottom of the well. Sometimes a wire-wrapped screen is used. More frequently, however,the last joint of pipe is slotted or perforated and possibly gravel packed.
AVAILABILITY OF GROUND WATER
Some freshwater is available from every formation above the Midway Group. Only theCarrizo and Wilcox aquifers, however, are capable of producing substantial quantities of water.The Sparta and Queen City Sands, as previously mentioned, are limited in thickness and extentand only rarely are tapped by large wells in Rusk County. Although basal sands of the Reklawfurnish some water, they are hydraulically connected with the underlying Carrizo and should notbe considered a source of water apart from the Carrizo. Moreover, the Reklaw, Queen City,Weches, and Sparta also overlie the Carrizo and Wilcox aquifers. Consequently, there is almostalways a higher-yielding, but deeper, source of ground water available from the Carrizo andWilcox sands.
- 60 -
It is not known if the current level of freshwater withdrawal will be maintained for theforeseeable future. If it is. a continued but moderate lowering of the potentometric surface isexpected. With withdrawal of ground water, the lowering of water levels continues until the areaof influence from the well fields becomes large enough so that the recharge equals the discharge.While water levels are lowered, water is taken from storage. The potentiometric surface of theWilcox aquifer (Figure 15) indicatl9s that the area of influence already extends past the RuskCounty line. There are not sufficient withdrawal or water-level data to determine if the generalwater-level declines shown in Figure 22 will continue permanently because of continuedincreases in pumpage or only be temporary because of recent increases in pumpage. Data areinsufficient to construct a water-level decline map for Rusk County.
In the case of the Wilcox and Carrizo aquifers in Rusk County, the recharge may be effectivelyincreasing as the water levels are drawn down. Additional drawdown causes an increase in thehead differences between the water table, which is expected to remain reasonably stable, and thepotentiometric surface of the major water-bearing zones. Thus, the vertical hydraulic gradient isincreased, thereby proportionally increasing the vertical leakage or movement of water.
One unknown aspect of continuing or increasing the ground-water withdrawals from theWilcox is the possibility of increasing the water's salinity. As the water levels are lowered, watermovement from nearby zones occurs. If these zones contain water of a higher salinity, thedissolved-solids concentrations in the major freshwater zones would be expected to eventuallyincrease.
Wilcox and Carrizo Aquifers
Fresh to slightly saline water is available from the Wilcox aquifer throughout the entire 939square miles of Rusk County. The average thickness of sand in the Wilcox containing freshwaterin Rusk County is about 245 feet. Based upon a porosity of 30 percent, the Wilcox contains about40 million acre-feet of water; however, it is economically impractical to recover more than a smallpercentage of this water. Assuming a specific yield of 0.15, about 20 million acre-feet of water isavailable from storage. Water in storage is not a good measure of availability in Rusk Countybecause it is not economically practical to recover more than a moderate amount of the total waterstored in the aquifer system. Also, because the slightly saline water-bearing sands areinterbedded with the freshwater-bearing sands, chemical quality may be a deterrent todevelopment.
Freshwater is available from the Carrizo wherever it is present in Rusk County. Based on anarea of 656 square miles, a porosity of 30 percent, and an average sand thickness of 70 feet, theaquifer contains about 8 million acre-feet of water. Assuming a specific yield of 0.15 and anoverall average sand thickness of 70 feet, about 4 million acre··feet of water is available fromstorage in the Carrizo. The Carrizo is in hydraulic continuity with and serves as an avenue ofrecharge to the Wilcox throughout much of Rusk County.
Moderate amounts of ground water are available for development. The amount that isavailable perennially is not known, but is greater than that being withdrawn. Assuming apre-development hydraulic gradient of about 8 ft/mi, a hydraulic conductivity of 14 ft/d and anaverage freshwater sand thickness of 245 feet, at least 12 million galld of fresh ground water isbeing transmittE!d through the Wilcox and about 3 million galld through the Carrizo.
- 61 -
Other Aquifers
The Queen City aquifer, present in about 10 percent of the county, is practically undeveloped.Maximum thickness of the Queen City is about 132 feet. The aquifer is capable of producingample supplies of qround water for livestock and domestic use. The Sparta Sand aquifer, whichonly occurs locally in the vicinity ohhe Mount Enterprise Fault system, is practically undeveloped.Because of their limited extent and near··surface occurrence, neither the Sparta nor Queen City isan important aquifer in Rusk County.
A.reas Most Favorable for Future Development
Areas most fallorable for future devl910pment of ground water are shown in Figure 23. Theseareas have been designated as follows: I, most favorable; II, favorable; III, moderately favorable;IV, moderately unfavorable; and V, most unfavorable.
Representative criteria useful in classifying the favorability of areas for additional freshwaterdevelopment include: 1, hydraulic conductivity; 2, average thickness of freshwater-bearingsands; 3, amount of ground water being withdrawn; 4, thickness or amount of slightly salinewater-bearing sa rids interbedded with freshwater sands; 5, possible effects of faulting; and 6,possibility of freshwater sands being m,ineralized by oilfield brines.
The most favorable region for future development, shown as area I in Figure 23, is located insouthwestern Rusk County. The area has one of the thicker sections offreshwater-bearing Wilcoxsands, and the Carrizo is present in about 95 percent of the area. Also no significant ground-waterwithdrawals OCCUI in the area.
Two favorablE' areas, shown as area II, are present. One lies in the east-central part of thecounty east of Henderson and another is present south of the Mount Enterprise Fault System.Although some Carrizo crops out on the surface in both areas, the largest ground-water suppliescould be developed from the Wilcox aquifer.
Three modercltely favorable areas, shown as area III, are present. Two of these areas arelocated in the southern section of the county and are associated with the Mount Enterprise FaultSystem. Outliers (If both the Queen City and Sparta are preserved in the downdropped blocks ofthe system. Consequently, these are the places where the most complete geologic section isdeveloped. Although there could be considerable amounts of available freshwater in this area,development of individual wells should be considered carefully because faulting may haveinterrupted the lateral continuity of a producing zone. The other moderately favorable area islocated in the nonh-central part of the county where the freshwater-bearing Wilcox sands arerelatively thin.
The moderately unfavorable area, shown as area IV, extends from about the city ofHenderson northwestward to the county line. The area has experienced a substantial decline inwater levels and ~as encountered some brine pollution.
Three most u 1favorable areas, shown as area V, are present. One of the areas, about 30square miles nea' the city of Henderson, accounts for about 40 percent of all ground water
- 62 -
withdrawn in the county and may be considered moderately developed. Two other areas arelocated between Overton and New London and at Price in the area of East Texas Oil Field. This isan area where there are two cones of depression and considerable interfingering of slightly salinewater-bearing sands with freshwater sands.
NEEDS FOR CONTINUING DATA COLLECTION
Collection of withdrawal, water-level, and water-quality data in Rusk County should becontinued and expanded. During about 1972, the Texas Department of Water Resources initiateda program of measuring water levels and collecting water-quality data in the area. The datacollection program should be continued and could be expanded to include a few wells that tap thedeeper Wilcox sands outside of the more heavily pumped areas. Water-quality data also could becollected at Henderson to monitor saltwater encroachment.
A ground-water program to investigate contamination of freshwater sands by oilfield brinescould be initiated in the East Texas and Henderson Oil Fields. Emphasis of such a program shouldbe placed on investigating the deeper sands of the Wilcox as weI! as the shallow sands in areas ofrecharge.
CONCLUSIONS
The Wilcox aquifer is the major source of ground water in Rusk County. It yields both freshand slightly saline water. Water can also be obtained from the Carrizo, Queen City,and Spartaaquifers and from the Reklaw Formation. The Carrizo, the most extensive of the other sources, isin hydrologic continuity with the underlying Wilcox.
Numerous facies changes are present within the Wilcox, which consists of thin butsometimes massive beds of fine-to coarse-grained sand, silt, and clay. The aquifer ranges inthickness from about 750 feet to more than 1,200 feet. The Wilcox is the only freshwater-bearingunit that is present throughout all of Rusk County. No freshwater occurs below the base of theWilcox. In places, however, slightly saline water-bearing beds are interbedded with andsometimes overlie freshwater-bearing sands. Although some of these relationships are natural,others may result from the mineralization of water by oilfield brines.
Daily withdrawal of ground water for all purposes increased from 3.1 million gal/d during1960 to 5.4 million gal/d during 1980. Daily withdrawal for municipal purposes has increasedfrom 1.4 million gal/d during 1960 to 4.2 million gal/d during 1980. About half of the municipaland about 38 percent of the total ground-water withdrawal (1980) is from a small area around thecity of Henderson. Consequently, water levels at Henderson have declined about 135 feet or anaverage of about 2.9 feet per year between 1935 and 1981.
Additional supplies of fresh ground water can be developed throughout nearly all of RuskCounty. About 20 million acre-feet of freshwater is available from storage, and a total of 12 milliongal/d is being transmitted through the Wilcox aquifer. Slightly saline water also is available fromthe Wilcox aquifer. About 4 million acre-feet of freshwater is available from storage, and a total ofabout 3 million gal/d is being transmitted through the Carrizo aquifer. Wells that are properly
- 65 -
constructed should yield about 500 gal/min from the Wilcox and possibly the Carrizo aquifers; afew wells have been constructed that yield as much as 1,000 gal/min.
Much of the variation in the quality of the ground water in the Wilcox aquifer is natural. Threeareas in which variations are likely to occur are near the city of Henderson, in the East Texas OilField, and along the Mount Enterprise Fault System. Because drastic water-quality changes occurbetween zones, it is essential that the water from each sand be analyzed during a test-drillingoperation to make certain that it is of acceptable quality.
Poorer-quality ground water occurs in the vicinity of the city of Henderson. The withdrawal of2.05 million gal/d of ground waterfrom the Wilcox during 1980created a cone of depression intowhich the poor-quality water could migrate.
Ground water has been contaminated by oilfield brine at Henderson field. In addition, oilfieldbrine has contaminated Bowles Creek and Beaver Run Creek in two separate instances.
- 66 -
SELECTED REFERENCES
American Public Health Associaltion and others, 1975, Standard methods for the examination ofwater and wastewater (14th ed.): Washington, D.C., Am. Public Health Assoc., 1193 p.
Baker, B. B., Dillard, J. W., Souders, V. L., and Peckham, R. C., 1963, Reconnaissanceinvestigation of the ground-water resources of the Sabine River basin, Texas: Texas WaterComm. Bull. 6307, 63 p.
Baker, B. B., Peckham, R. C., Dillard, J. W., and Souders, V. L., 1963, Reconnaissanceinvestigation of the ground-water resources of the Neches River basin, Texas: Texas WaterComm. Bull. 6308, 67 p.
Broadhurst, W. L., 1945, Records of wells, drillers' logs, water analyses, and map showinglocations of wells in Gregg County, Texas: Texas Board Water Engineers duplicated rept.,35 p.
Broom, M. E., 1969, Ground-watE!r resources of Gregg and Upshur Counties, Texas: Texas WaterDevel. Board Rept. 101,83 p.
Brune, Gunnar, 1981, Springs of Texas, volume 1: Fort Worth, Branch-Smith, Inc., 566 p.
Bureau of Economic Geology, 1965, Geologic atlas of Texas, Tyler sheet: Univ. Texas, Bur. Econ.Geology map.
____ 1968, Geologic atlas of Texas, Palestine sheet: Univ. Texas, Bur. Econ. Geology map.
Burnitt, S. C., 1963, Henderson Oi,! Field area, Rusk County, Texas; Investigation of ground-watercontamination: Texas Water Comm. rept., LD-0262-MR, 13 p.
California State Water Quality Control Board, 1963, Water-quality criteria: California State WaterQuality Control Board Pub. ~I-A.
Collins, E. W., Hobday, D. K., and Kreitler, C. W., 1980, Quaternary faulting in East Texas: Univ.Texas, Bureau Econ. Geology Geol. Cir. 80-1,30 p.
Cooper, H. H., and Jacob, C. E., 1946, A generalized graphical method for evaluating formationconstants and summarizing well-field history: Am. Geophys. Union Trans., v. 27, no. IV,p.526-534.
Dean, H. T., and others, 1941, Domestic water and dental caries: U.S. Public Health Service,Public Health Repts., v. 56, p. 761-792.
Deussen, Alexander, 1914, Geology and underground waters of the southeastern part of theTexas Coastal Plain: U.S. Geol. Survey Water-Supply Paper 335, 365 p.
Dillard, J. W., 1963, Availability anal qualityof ground water in Smith County, Texas: Texas WaterComm. Bull. 6302, 116 p.
- 67 -
East Texas Salt Water Disposal Company, 1958, Salt-water disposal, East Texas Oil Field: 131 p.
Eaton, R. R., 195Ei, Resume of subsurface geology of northeast Texas with emphasis on saltstructures: Gulf Coast Geol. Societies Trans., p. 79-84.
Fenneman, N. M., 1939, Physiography of eastern United States: New York, McGraw-Hili, 714 p.
Ferris, J. G., Knowles, D. B., Brown, R. H., and Stallman, R. W., 1962, Theory of aquifer tests: U.S.Geol. Survey Water-Supply Paper 1536-E, 173 p.
Fisher, W. L., 1965, Rock and mineral resources of east Texas: Univ. Texas, Bur. Econ. GeologyRept. Inv. 54, 439 p.
Fisher, W. L., and McGowen, J. H., 1967, Depositional systems in the Wilcox Group of Texas andtheir relationship to occurrence of oil and gas: Gulf Coast Assoc. Geol. Soc. Trans. of 17thannual mee1:ing, p. 105-125.
Follett, C. R., 1943, Records of wells, drillers' logs, water analyses, and map showing locations ofwells in Rusk County, Texas: Texas Board Water Engineers duplicated rept., 56 p.
Hem, J. D., 1959, Study and interpretation of the chemical characteristies of natural water: U.S.Geol. Survey Water-Supply Paper 1473,269 p.
___1970, Study and interpretation of the chemical characteristics of natural water: U.S.GeoL Survey Water-Supply Paper 1473, 363 p.
Henry, C. D., Basciano, J. M., and Duex, T. W., 1980, Hydrology and water quality of the EoceneWilcox Group; Significance for lignite development in East Texas: Univ. Texas, Bur. Econ.Geology Geol. Circ. 80-3, 9 p.
Hughes, L. 5., and Leifeste, D. L., 1967, Reconnaissance of the chemical quality of surface watersof the Nechl~s River basin, Texas: U.S. Geol. Survey Water-Supply Paper 1839-A, 63 p.
Jones, P. H., Stevens, P. R., Wesselman, J. B., and Wallace, R. H., Jr., 1976, Regional appraisal ofthe Wilcox Group in Texas for subsurface storage of fluid wastes: Part I-Geology: U.S.Geol. Survey Open-File Rept. 76-394, 107 p.
Kaiser, W. R., Ayers, W. B., Jr., and La Brie, L. W., 1980, Lignite resources in Texas: Univ. Texas,Bur. Econ. GeologyandTexas Energyand Natural Resources Advisory Council Rept.lnv. No.104,52 p.
Kane, J. W., 1967, Monthly resevoir evaporation rates for Texas, 1940 through 1965: TexasWater Devel. Board Rept. 64, 111 p.
Kreitler, C. W., and others, 1980, Geology and geohydrology ofthe East Texas basin: Univ. Texas,Bur. Econ. Geology Geol. Cir. 80-12, 112 p.
- 68 -
Lockhart, E. E., Tucker, C. L., and Merritt, M. C., 1955, The effect of water. impurities on the flavorof brewed coffee: Food Research 20, 598 p.
Lyle, W. M., 1937, Records of wells, drillers' logs, water analyses, and map showing location ofwells in Rusk County, Texas: Texas Board Water Engineers duplicated rept., 87 p.
Maxcy. K. F., 1950, Report on the relation of nitrate concentrations in well waters to theoccurrence of methemoglobinemia: Natl. Research Council Bull., Sanitary Eng., App. D, p.265-271.
McKee, J. E., and Wolf, H. W., 1963, Water quality criteria (2d ed.): California State Water QualityBoard Pub. No.3-A, 548 p.
Meinzer, O. E., and Wenzel, L. K., 1942, Movement of ground water and its relation to head,permeability and storage, in Physics ofthe earth, Part 9, Hydrology: New York, McGraw-Hili,p.444-478.
Morton, R. B., 1981, Effects of petroleum associated brine on the water resource ofthe VamoosaAda aquifer, east-central Oklahoma: U.S. Geol. Survey Open-File Rept. 81, 60 p.
National Academy of Sciences, National Academy of Engineering, 1973 [1974], Water qualitycriteria, 1972: Washington, D.C., Rept. of the Comm. on Water Quality Criteria, 594 p.
National Technical Advisory Committee to the Secretary of the Interior, 1968, Water qualitycriteria: U.S. Govt. Printing Office, 234 p.
Nichols, P. H., 1964, The remaining frontiers for exploration in northeast Texas: Trans. Gulf CoastAssoc. Petroleum Geologists, v. 14, p. 7-22.
Railroad COl1mission of Texas, 1952, Saltwater injection in the East Texas Field in A survey ofsecondary recovery and pressure maintenance operations in Texas to 1952: RailroadComm. Texas Eng. Dept. rept., p. 91-96.
___ 1981, A survey of secondary and enhanced recovery operations to 1980: RailroadComm. Texas Bull. 80, 544 p.
____ 1981, Oil and gas annual production by active fields, 1980: Railroad Comm. Texas Oiland Gas Div. rept., 666 p.
Sellards, E. H., Adkins, W. S., and Plummer, F. B., 1932, The geology of Texas, Volume 1,Strat.graphy: Univ. Texas, Bur. Econ. Geology Bull. 3232,1007 p.
Sellards, E. H., and Hendricks, L., 1946, Structural map of Texas, third edition: Univ. Texas, Bur. ofEcon. Geology map.
Stenzel, H. B., 1953, The geology of Henrys Chapel quadrangle, northeastern Cherokee County,Texas: Univ. Texas, Bur. Econ. Geology Pub. 5305.
- 69 -
Sundstrom, R. W, Hastings, W. W., and Broadhurst, W. L., 1948, Public water supplies in easternTexas: U.S. Geol. Survey Water-Supply Paper 1047, 285 p.
Swenson, H. A., and Baldwin, H. L., 1965, A primer on water quality: Washington, D.C., U.S. Gov.Printing Office, 27 p.
Texas Water Commission and Texas Water Pollution Control Board, 1963, A statistical analysis ofdata on oil-field brine production and disposal in Texas for the year 1961 ,from An inventoryconducted by the Railroad Commission of Texas: Railroad Comm. Texas Distrib. 6, v. 1,327 p.
Theis, C. V., 1935, The relation between the lowering of the piezometric surface and the rate andduration of discharge of a well using ground-water storage: Am. Geophys. Union, Trans. of16th annual meeting, pt. 2, p. 519-!524.
Turner, S. F., 1932, Ground-water conditions in East Texas Oil Field: U.S. Geol. Survey open-filerept., 18 p.
U.S. Department of Commerce, Bureau of Census, 1980, United States census of population,1980; characteristics of the population, Texas: v. 1, pt. 45.
U.S. Environmental Protection Agency, 1976, National interim primary drinking waterregulations: Office of Water Supply, EPA-570/9-76-003, 159 p.
___ 1977a, Quality criteria for water, 1976: U.S. Gov. Printing Office, 256 p.
___1977b, National secondary drinking water regulations: Federal Register, v. 42, no. 62,pt. I, p. 17143-17147.
___ 1979, National secondary drinking water regulations: Federal Register, v. 44, no. 140, p.421 96-42202.
U.S. Public Health Service, 1962, Public Health Service drinking-water standards: Public HealthService Pub. 956, 61 p.
U.S. Salinity Laboratory Staff, 1954, Diagnosis and improvement of saline and alkaline soils: U.S.Dept. of Agriculture Handb. 60, 160 p.
von Hake, C. A., 1977, Earthquake history of Texas: U.S. Geol. Survey Earthquake InformationBull., v. 9, no. 3, p. 30-32.
Wenzel, L. K., 1942, Methods for determining permeability of water-bearing material with specialreference to discharging-well methods: U.S. Geol. Survey Water-Supply Paper 887, 192 p.
W. F. Guyton and Associates, 1970, Ground-water conditions in Angelina and NacogdochesCounties, Texas: Texas Water Devel. Board Rept. 110. 167 p.
- 70 -
W. F. Guyton and Associates, 1972, Ground-water conditions in Anderson, Cherokee, Freestone, andHenderson Counties, Texas: Texas Water Devel. Board Rept. 150,335 p.
Wilcox, L. V., 1955, Classification and use of irrigation waters: U.S. Dept. Agriculture Circ. 969,19 p.
Wilcox, L. V., Blair, G. Y., and Bowl3r, C. A., 1954, Effect of bicarbonate on suitability of water forirrigation: Soil Science, v. 77, no. 4, p. 259-266.
Winslow, A. G., and Kister, L. R., Jr., 1956, Saline water resources of Texas: U.S. Geol. SurveyWater-Supply Paper 1365, 105 p.
- 71 -
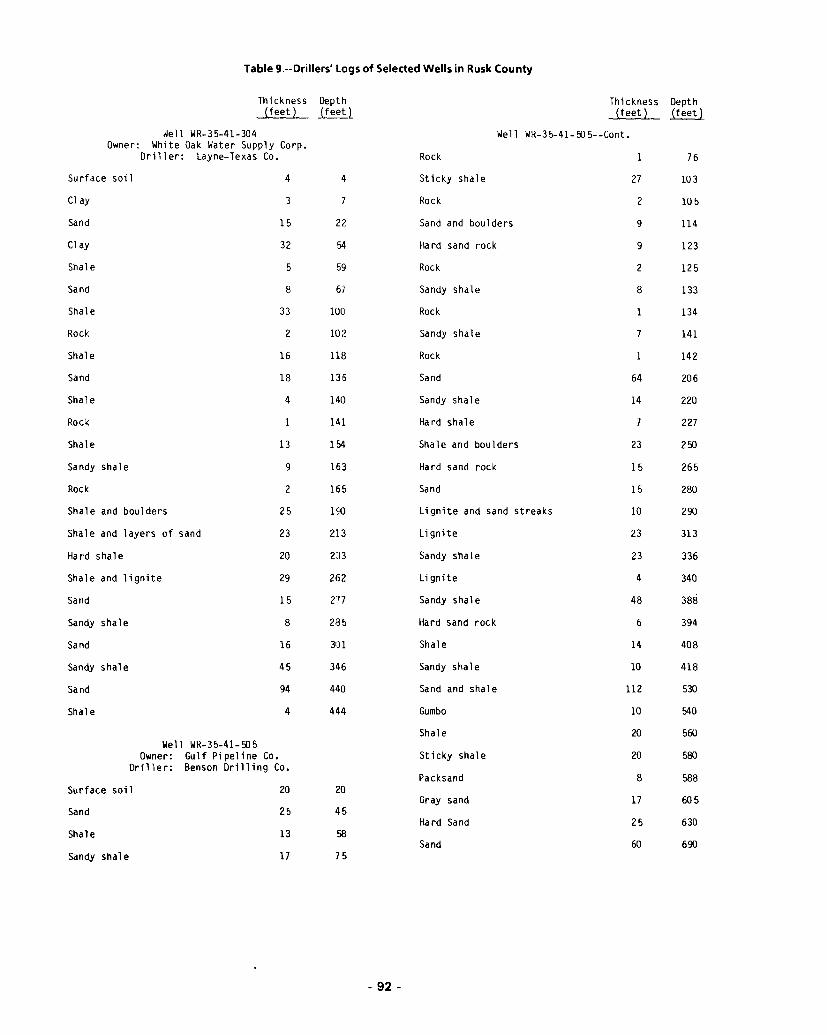
Table 9.··Drillers· Logs of Sele(ted Wells in Rusk County
Thickness Depth Thickness Depth(feet ) (feet L (feet) (feet)
~ell WR-35-41-304 Well WR-3 5-41- fiJ 5- -Cont.Owner: White Oak Water Supply Corp.
Driller: Layne-Texas Co. Rock 76
Surface soil 4 4 St icky shale 27 103
Clay 3 7 Rock 2 105
Sand 15 22 Sand and boulders 9 114
Clay 32 54 Hard sand rock 9 123
Shale 5 59 Rock 2 125
Sand 8 67 Sandy shale 8 133
Shale 33 100 Rock 134
Rock 2 1O;! Sandy shale 7 141
Shale 16 118 Rock 142
Sand 18 136 Sand 64 206
Shal e 4 140 Sandy shale 14 220
Rock 141 Hard shale 7 227
Shale 13 154 Shale and boul ders 23 250
Sandy shale 9 163 Hard sand rock 15 265
Rock 2 165 Sand 15 280
Shale and boulders 25 ISO Li gnite and sand streaks 10 290
Shale and layers of sand 23 213 Lignite 23 313
Hard shale 20 233 Sandy shal e 23 336
Shale and 1ignite 29 262 Li gnite 4 340
Sand 15 277 Sandy shale 48 388
Sandy shale 8 2135 Hard sand rock 6 394
Sand 16 301 Shale 14 408
Sandy shale 45 346 Sandy shale 10 418
Sand 94 440 Sand and shale 112 530
Shale 4 444 Gumbo 10 540
Shale 20 560Well WR-35-41-fiJ5
Owner: Gulf Pipeline Co. Sticky shale 20 580Driller: Benson Dri 11 i ng Co.
Packsand 8 588Surface soil 20 20
Gray sand 17 605Sand 25 45
Hard Sand 25 630Shale 13 58
Sand 60 690Sandy shale 17 75
·92 -
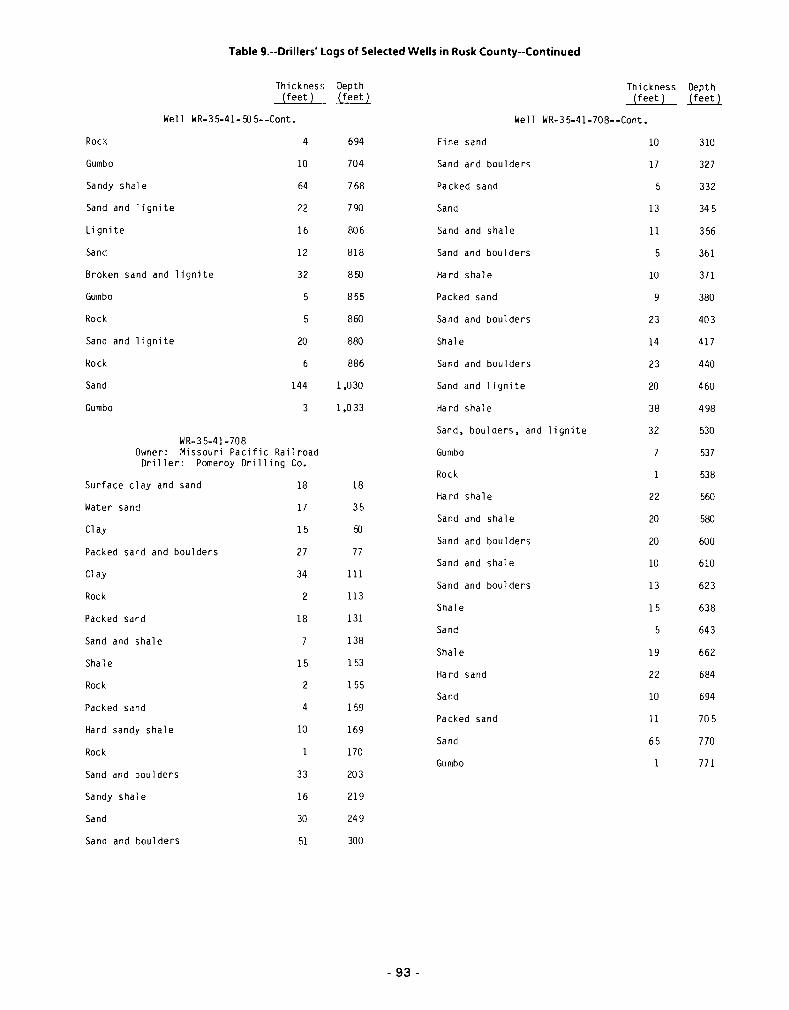
Table 9.--Drillers' Logs of Selected Wells in Rusk County--Continued
Thickness Depth Thickness Depth(feet) -~ (feet) ~
Well WR-3 5-41- ffi 5- -Cant. Well WR-35-41-708--Cont.
Rock 4 694 Fine sand 10 310
Gumbo 10 704 Sand and boulders 17 327
Sandy shale 64 768 Packed sand 5 332
Sand and . ignite 22 790 Sand 13 345
Lignite 16 806 Sand and shale 11 356
Sand 12 818 Sand and boulders 5 361
Broken sand and lignite 32 8ffi Hard shale 10 371
Gumbo 5 855 Packed sand 9 380
Rock 5 860 Sa nd and boulders 23 403
Sand and lignite 20 880 Shal e 14 417
Rock 6 886 Sa nd and boulders 23 440
Sand 144 1,030 Sand and 1ignite 20 460
Gumbo 3 1.033 Ha rd shale 38 498
Sand. boulders, and lignite 32 530WR-35-41-708
Owner: Missouri Pacific Railroad Gumbo 537Driller: Pomeroy Drilling Co.
Rock 538Surface clay and sand 18 18
Ha rd shale 22 560Water sand 17 35
Sand and shale 20 580Clay 15 ffi
Sand and boulders 20 600Packed sard and boulders 27 77
Sand and shale 10 610Clay 34 111
Sand and boulders 13 623Rock 2 113
Shale 15 638Packed sard 18 131
Sand 5 643Sand and shale 138
Shale 19 662Shale 15 153
Hard sand 22 684Rock 2 155
Sand 10 694Packed sand 4 159
Packed sand 11 705Hard sandy shale 10 169
Sand 65 770Rock 170
Gumbo 771Sand and Doulders 33 203
Sandy shale 16 219
Sand 30 249
Sand and boulders 51 300
- 93 -
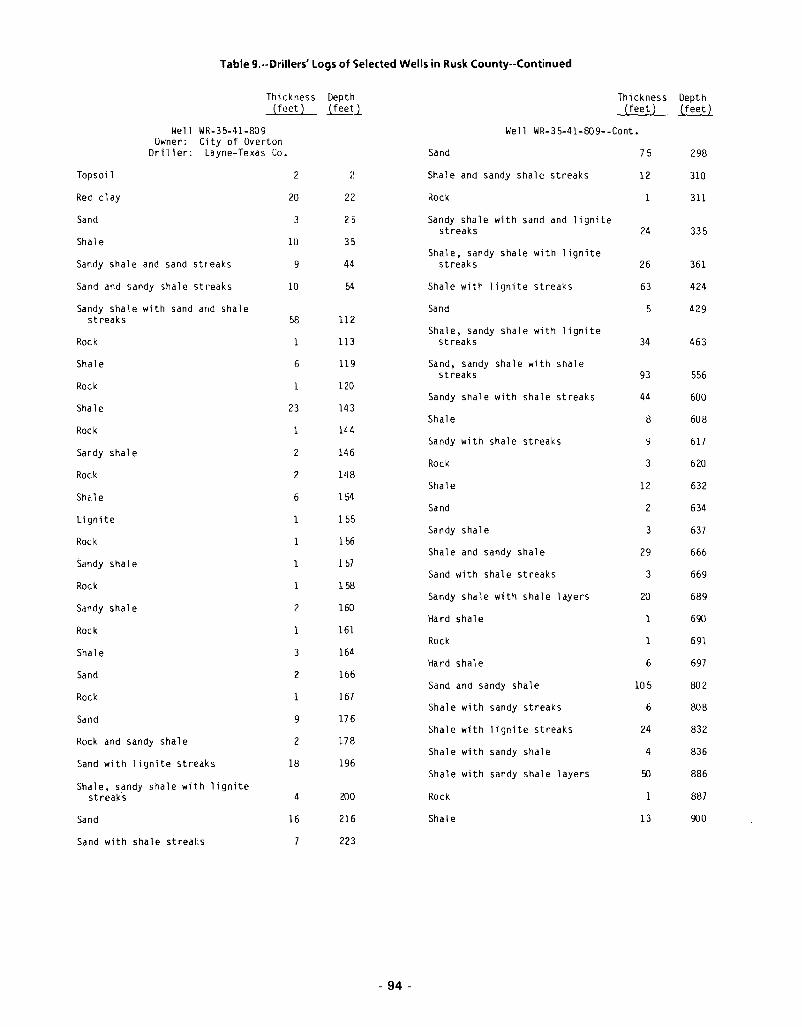
Table 9.--Drillers' Logs of Selected Wells in Rusk County--Continued
Thickness Depth Thickness Depth(feet) (feetl (feet) ~
Well WR-35-41-809 Well WR-3 5-41-80 9- -Cont.Owner: Ci ty of Overton
Oriller: Layne-Texas Co. Sand 75 298
Topsoi 1 2 .) Shal e and sandy shale streaks 12 310..Red clay 20 2" Rock 311.-Sand 3 25 Sandy shale with sand and lignite
streaks 24 335Shal e 10 35
Shale, sandy shale wi th 1igniteSandy shale and sand streaks 9 4,~ streaks 26 361
Sand and sandy shale streaks 10 54 Shale with 1ignite streaks 63 424
Sandy shale with sand arid shal e Sand 5 429streaks 58 112
Shale, sandy shale with ligniteRock 113 streaks 34 463
Shale 6 119 Sand, sandy shale with shalestreaks 93 556
Rock 120Sandy shale with shale streaks 44 600
Shale 23 143Shale 8 608
Rock 144Sandy with shale streaks 9 617
Sandy shale 2 11,6Rock 3 620
Rock 2 148Shale 12 632
Shal e 6 154Sand 2 634
Lignite 155Sandy shale 3 637
Rock 156Shale and sandy shale 29 666
Sandy shale 157Sand with shale streaks 3 669
Rock 158Sandy shale with shale layers 20 689
Sandy shale 2 160Hard shale 690
Rock 161Rock 691
Shale 3 164Hard shale 6 697
Sand 2 166Sand and sandy shale 105 802
Rock 167Shale with sandy streaks 6 808
Sand 9 176Shal e with 1ignite streaks 24 832
Rock and sandy shale 2 178Shale with sandy shale 4 836
Sand with lignite streaks 18 196Shale with sandy shale 1ayers !:() 886
Shale, sandy shale with lignitestreaks 4 200 Rock 887
Sand 16 216 Shal e 13 900
Sand with shale strea~s 7 223
- 94 -
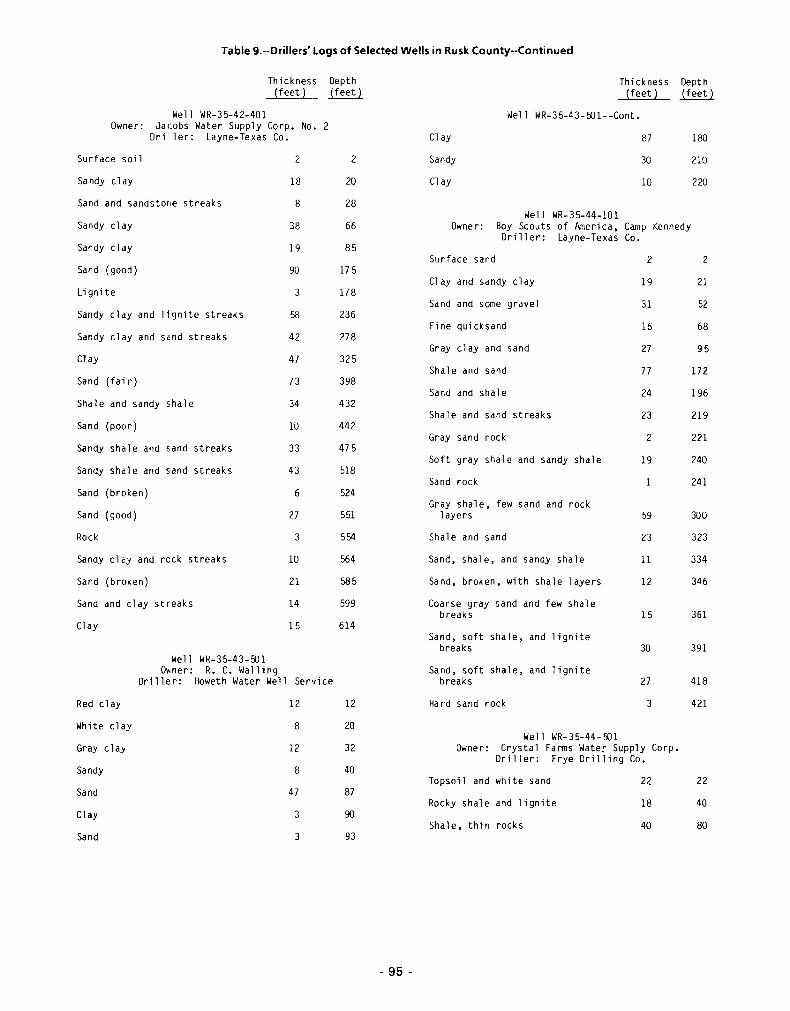
Table 9.··Drillers· Logs of Selected Wells in Rusk County··Continued
Well WR-35-42-401Owner: Jacobs Water Supply Corp. No.2
Dri ler: Layne-Texas Co.
Thickness(feet)
Depth~
Clay
Thickness(feet)
Well WR-35-43-ffJI--Cont.
87
Depth~
180
Well WR-35-43-ffJlO~ner: R. C. Walling
Driller: Howeth Water Well Service
Well WR-35-44-101Owner: Boy Scouts of America, Camp Kennedy
Driller: Layne-Texas Co.
Well WR-35-44-ffJlOwner: Crystal Farms Water Supply Corp.
Driller: Frye Drilling Co.
Surface soil
Sa ndy cl ay
Sand and sandstor,e streaks
Sandy clay
Sandy clay
Sand (good)
Lignite
Sandy clay and lignite streaks
Sandy clay and Send streaks
Clay
Sand (fair)
Shale and sandy shale
Sand (poor)
Sandy shale and sand streaks
Sandy shale and sand streaks
Sand (broken)
Sand (good)
Rock
Sandy cley and reck streaks
Sand (broken)
Sand and clay streaks
Clay
Red clay
White clay
Gray c1a}
Sandy
Sand
Clay
Sand
2
18
8
38
19
90
3
58
42
47
73
34
10
33
43
6
27
3
10
21
14
15
12
8
12
8
47
3
3
2
20
28
66
85
175
178
236
278
325
398
432
442
475
518
524
551
554
564
585
599
614
12
20
32
40
87
90
93
- 95 -
Sandy
Clay
Surface sand
Clay and sandy clay
Sand and some gravel
Fine quicksand
Gray clay and sand
Shale and sand
Sand and shale
Shale and sand streaks
Gray sand rock
Soft gray shale and sandy shale
Sand rock
Gray shale, few sand and rock1ayers
Shale and sand
Sand, shale, and sandy shale
Sand, broken, with shale layers
Coarse gray sand and few shalebreaks
Sand, soft shale, and lignitebreaks
Sand, soft shale, and li9nitebreaks
Ha rd sand rock
Topsoil and white sand
Rocky shale and lignite
Shale, thin rocks
30
10
2
19
31
16
27
77
24
23
2
19
59
23
11
12
15
30
27
3
22
18
40
210
220
2
21
52
68
95
172
196
219
221
240
241
300
323
334
346
361
391
418
421
22
40
80
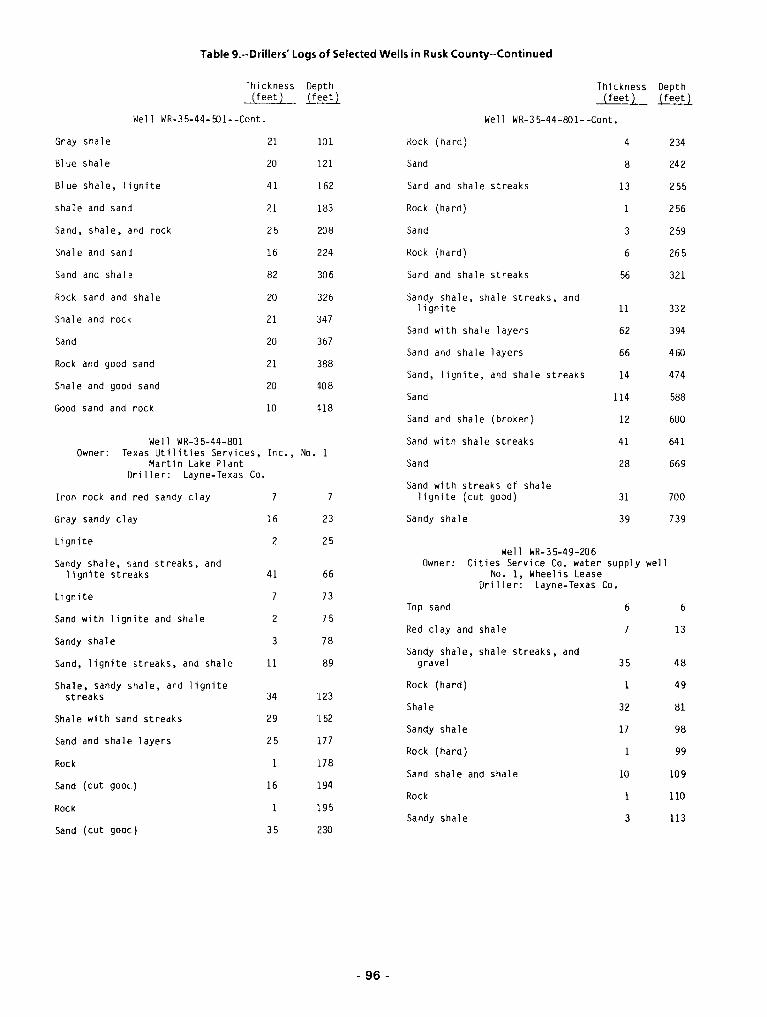
Table 9.--Drillers' Logs of Selected Wells in Rusk County--Continued
Thickness(feet)
Well WR-35-44-9D1--Cont.
Depthl!eet)
Thickness(feet)
Well WR-35-44-801--Cont.
Depth~
Well WR-35-44-801Owner: Texas Utilities Services, Inc., No.1
Martin Lake PlantDriller: Layne-Texas Co.
Well WR-35-49-206Owner: Cities Service Co. water supply well
No.1, Wheelis LeaseDriller: Layne-Texas Co.
Gray shale
Blue shale
B1 ue shale, 1ignite
shale and sand
Sand, shale, and rock
Shale and sand
Sand and sha1~
Rock sand and shale
Shale and rock
Sand
Rock and good sand
Shale and good sand
Good sand and rock
Iron rock and red sandy clay
Gray sandy clay
Lignite
Sandy shale, sand streaks, and1ignite streaks
Li gnite
Sand with lignite and shale
Sandy shale
Sand, lignite 5treaks, and shale
Shale, sandy snale, and lignitestreaks
Shale with sand streaks
Sand and shale layers
Rock
Sand (cut good)
Rock
Sand (cut gooe)
21
20
41
21
25
16
82
20
21
20
21
20
10
16
2
41
7
2
3
11
34
29
25
16
35
101
121
162
183
208
224
306
326
347
367
388
q08
H8
23
25
66
73
75
78
89
123
152
177
178
194
:,95
- 96 -
Rock (hard)
Sand
Sand and shale streaks
Rock (hard)
Sand
Rock (hard)
Sand and shale streaks
Sandy shale, shale streaks, and1i gni te
Sand with shale layers
Sand and shale layers
Sand, lignite, and shale streaks
Sand
Sand and shale (broken)
Sand with shale streaks
Sand
Sand with streaks of shale1i gn ite (cut good)
Sandy shale
Top sand
Red clay and shale
Sandy shale, shale streaks, andgravel
Rock (hard)
Shale
Sandy shale
Rock (hard)
Sand shale and shale
Rock
Sandy shale
4
8
13
3
6
56
11
62
66
14
114
12
41
28
31
39
6
7
35
32
17
10
3
234
242
255
256
259
265
321
332
394
460
474
588
600
641
669
700
739
6
13
48
49
81
98
99
109
110
113
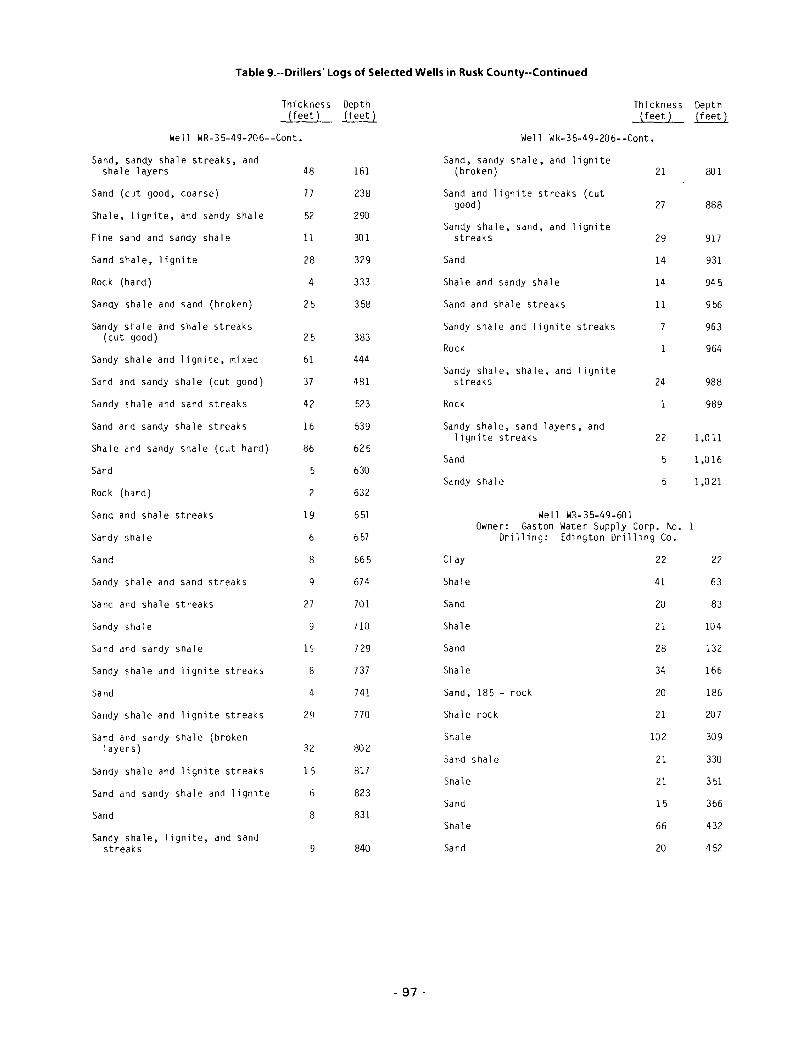
Table 9.--Drillers' Logs of Selected Wells in Rusk County--Continued
Thickness(feet)
Well WR-35-49-206--Cont.
Depth~
Thickness(feet)
Well WR-35-49-206--Cont.
Depth~
Well WR-35-49-601Owner: Gaston Water Supply Corp. No.
Drilling: Edington Drilling Co.
Sand, sandy shale streaks, andshale layers
Sand (c~t good, coarse)
Shale, lignite, and sandy shale
Fine sald and sandy shale
Sand Shale, lignite
Rock (hard)
Sandy shale and sand (broken)
Sandy shale and shale streaks(cut good)
Sandy shale and lignite, mixed
Sand and sandy shale (cut good)
Sandy shale and sand streaks
Sand ard sandy shale streaks
Shale end sandy shale (cut hard)
Sand
Rock (h~rd)
Sand and shale streaks
Sandy shale
Sand
Sandy shale and sand streaks
Sand and shale streaks
Sandy shale
Sand and sandy shale
Sandy shale and lignite streaks
Sand
Sandy shale and lignite streaks
Sand and sandy shale (brokenlayers)
Sandy shale and lignite streaks
Sand and sandy shale and lignite
Sand
Sandy shale, lignite, and sandstreaks
48
77
52
11
28
4
25
25
61
37
42
16
86
5
2
19
6
8
9
27
9
19
4
29
3 '),-
1')
I)
9
161
238
290
301
329
333
358
383
444
481
523
539
625
630
632
651
657
665
674
701
710
729
737
741
770
802
817
823
831
840
- 97 -
Sand, sandy shale, and lignite(broken)
Sand and lignite streaks (cutgood)
Sandy shale, sand, and lignitestreaks
Sand
Shale and sandy shale
Sand and shale streaks
Sandy shale and lignite streaks
Rock
Sandy shale, shale, and lignitestreaks
Rock
Sandy shale, sand layers, and1ignite streaks
Sand
Sandy shale
Clay
Shal e
Sand
Shale
Sand
Shale
Sand, 185 - rock
Shale rock
Shale
Sand shale
Shale
Sand
Shale
Sand
21
27
29
14
14
11
7
24
22
5
5
22
41
20
21
28
34
20
21
102
21
21
15
66
20
/:lU1
888
917
931
945
956
963
964
988
989
1,011
1,016
1,021
22
63
83
104
132
166
186
207
309
330
351
366
432
452
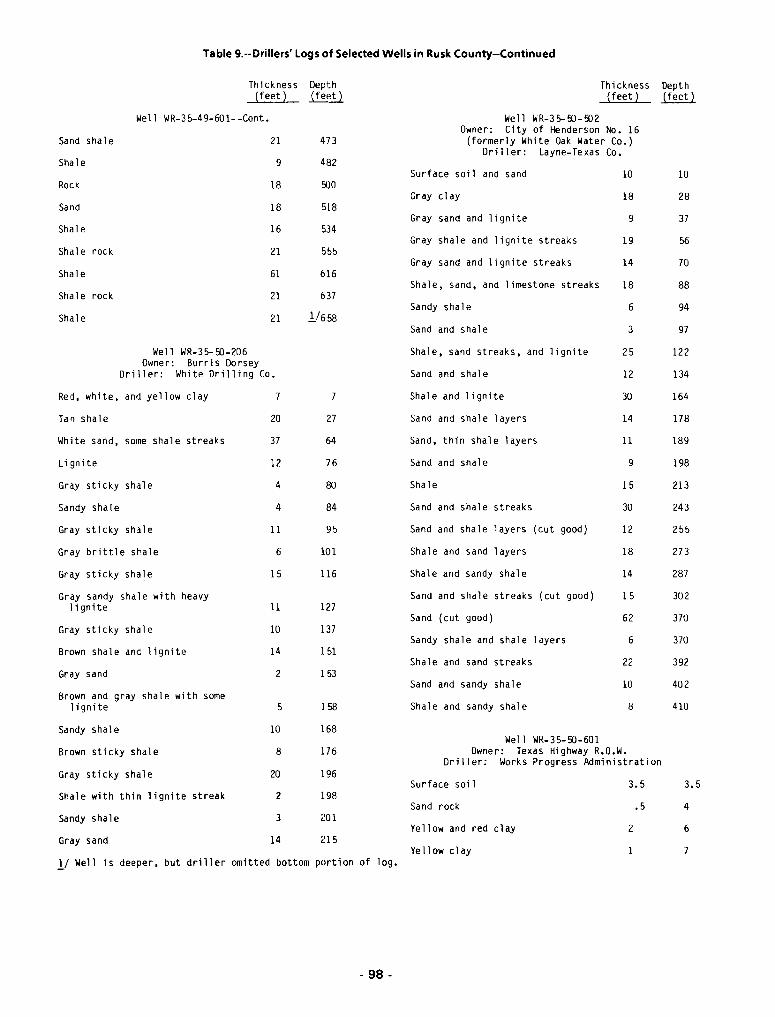
Table 9.--Drillers· Logs of Selected Wells in Rusk County--Continued
Thickness(feet)
Well WR-35-riJ-riJ2Owner: City of Henderson No. 16
(formerly White Oak Water Co.)Driller: Layne-Texas Co.
Sand shale
Shale
Rock
Sand
Shale
Shale rock
Shal e
Shale rock
Shale
Thickness(feet)
Well WR-35-49-601--Cont.
21
9
18
18
16
21
61
21
21
Depth~~
473
4132
!:J:)O
518
534
555
616
637
1/658
Surface soil and sand
Gray cl ay
Gray sand and lignite
Gray shale and lignite streaks
Gray sand and lignite streaks
Shale, sand, and limestone streaks
Sandy shale
Sand and shale
10
18
9
19
14
18
6
3
Depth~
10
28
37
56
70
88
94
97
Well WR-35- riJ-206Owner: Burris Dorsey
Driller: White Drilling Co.
.!/ Well is deeper, but driller omitted bottom portion of log.
Well WR-35-riJ-601Owner: Texas Highway R.O.W.
Driller: Works Progress Administration
Red, white, and yellow clay
Tan shale
White sand, some shale streaks
Lignite
Gray sticky shale
Sandy shale
Gray sticky sh31e
Gray brittle shale
Gray sticky shale
Gray sandy shale with heavy1ignite
Gray sticky shale
Brown shale and lignite
Gray sand
Brown and gray shale with somelignite
Sandy shale
Brown sticky shale
Gray sticky shale
Shale with thin lignite streak
Sandy shale
Gray sand
7
20
37
12
4
4
11
6
15
11
10
14
2
5
10
8
20
2
3
14
27
64
76
80
84
95
101
116
127
137
151
153
158
168
176
196
198
,~O 1
,~ 15
Shale, sand streaks, and lignite
Sand and shale
Shale and lignite
Sand and shale layers
Sand, thin shale layers
Sand and shale
Shale
Sand and shale streaks
Sand and shale layers (cut good)
Shale and sand layers
Shale and sandy shale
Sand and shale streaks (cut good)
Sand (cut good)
Sandy shale and shale layers
Shale and sand streaks
Sand and sandy shale
Shale and sandy shale
Surface soi 1
Sand rock
Yellow and red clay
Ye 11 ow cl ay
25
12
30
14
11
9
15
30
12
18
14
15
62
6
22
10
8
3.5
.5
2
122
134
164
178
189
198
213
243
255
273
287
302
370
370
392
402
410
3.5
4
6
7
- 98 -
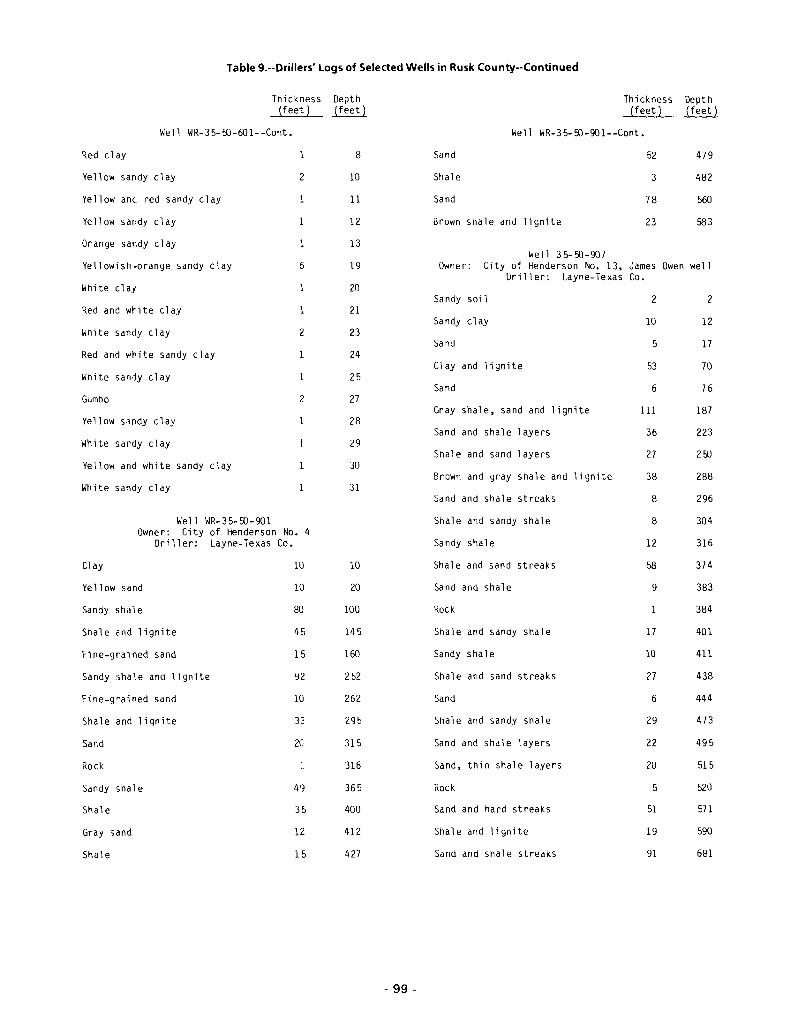
Table 9.--Drillers· Logs of Selected Wells in Rusk County--Continued
Thickness(feet)
Well WR-35-f()-601--Cont.
Depth~
Thickness(feet)
Well WR-35-f()-901--Cont.
Depth~
Well WR-35-f()-901Owner: City of Henderson No.4
Driller: Layne-Texas Co.
Well 35-50-907Owner: City of Henderson No. 13, James Owen well
Driller: Layne-Texas Co.
Red clay
Yellow sandy clay
Yellow anc red sandy clay
Yellow sandy clay
Orange sandy clay
Yellowish-orange sandy clay
White clay
Red and white clay
White sandy clay
Red and white sandy clay
White sandy clay
Gumbo
Yellow s~ndy clay
White sandy clay
Yellow and white sandy clay
White sandy clay
Clay
Yellow sand
Sandy shal e
Shale and lignite
Fine-grained sand
Sandy shale and lignite
Fine-grained sand
Shale and lignite
Sand
Rock
Sandy shale
Shale
Gray sand
Shale
2
6
2
1
2
1U
10
80
45
15
92
10
33
20
49
35
12
15
8
10
11
12
13
19
20
21
23
24
25
27
28
29
30
31
10
20
100
145
160
252
262
295
315
316
365
400
412
427
- 99 -
Sand
Shale
Sand
Brown shale and lignite
Sa ndy soil
Sandy cl ay
Sand
Clay and lignite
Sand
Gray shale, sand and lignite
Sand and shale layers
Shale and sand layers
Brown and gray shale and lignite
Sand and shale streaks
Shale and sandy shale
Sandy shale
Shale and sand streaks
Sand and shale
Rock
Shale and sandy shale
Sandy shale
Shale and sand streaks
Sand
Shale and sandy shale
Sand and shale layers
Sand, thin shale layers
Rock
Sand and hard streaks
Shale and lignite
Sand and shale streaks
52
3
78
23
2
10
5
53
6
111
36
27
38
8
8
12
58
9
17
10
27
6
29
22
20
5
51
19
91
479
482
560
583
2
12
17
70
76
187
223
250
288
296
304
316
374
383
384
401
411
438
444
473
495
515
520
571
590
681
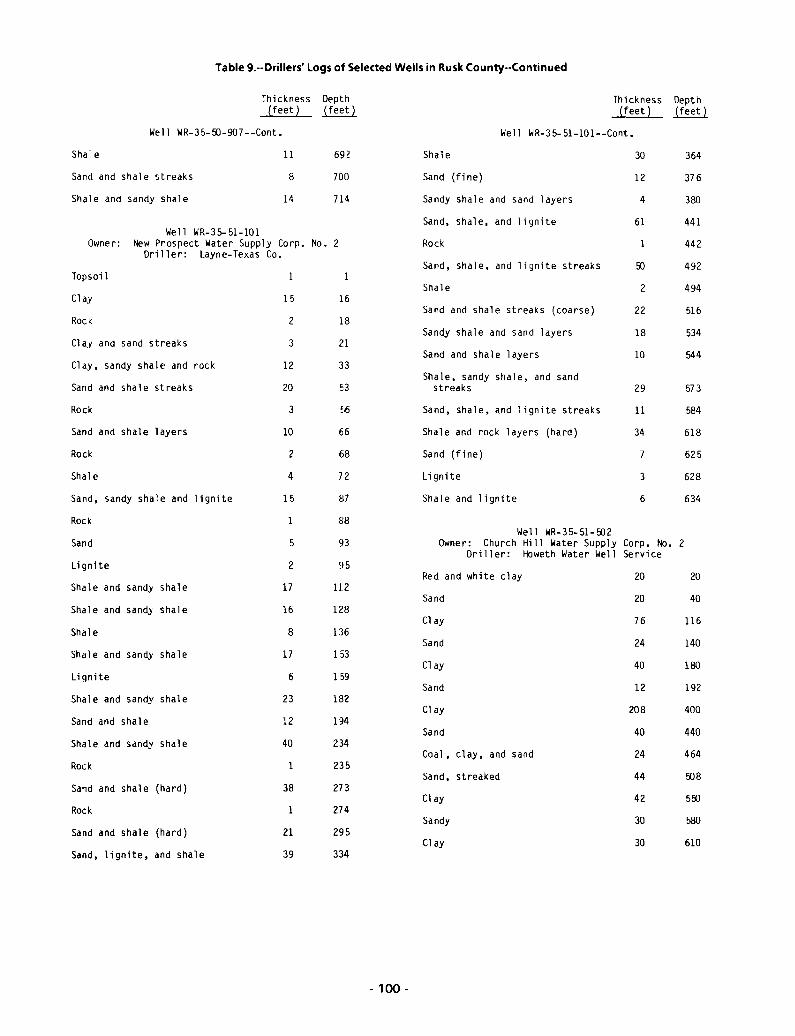
Table 9.--Drillers· Logs of Selected Wells in Rusk County--Continued
Thickness(feet)
We 11 WR-3 5- ~-907 --Cant.
Thickness(feet)
Well WR-35-51-101--Cont.
Depth(feet)
Well WR-35-51-101Owner: New Prospect Water Supply Corp. No.2
Driller: Layne-Texas Co.
Well WR-35-51-~2
Owner: Church Hill Water Supply Corp. No. 2Driller: Howeth Water Well Service
Shale
Sand and shale streaks
Shale and sandy shale
Topsoil
Cl ay
Rock
Clay and sand streaks
Clay, sandy shale and rock
Sand and shale streaks
Rock
Sand and shale layers
Rock
Shal e
Sand, sandy shale and lignite
Rock
Sand
Li gni te
Shale and sandy shale
Shale and sandy shale
Shale
Shale and sandy shale
Lignite
Shale and sandy shale
Sand and shale
Shale and sandy shale
Rock
Sand and shale (hard)
Rock
Sand and shale (hard)
Sand, lignite, and shale
11
8
14
15
2
3
12
20
3
10
2
4
15
5
2
17
16
8
17
6
23
12
40
1
38
21
39
700
714
16
18
21
33
53
b6
66
68
72
87
88
93
95
112
1;~8
l:l6
1 '53
159
182
194
234
235
273
274
295
334
- 100 -
Shale
Sand (fine)
Sandy shale and sand layers
Sand, shale, and lignite
Rock
Sand, shale, and lignite streaks
Shale
Sand and shale streaks (coarse)
Sandy shale and sand layers
Sand and shale layers
Shale, sandy shale, and sandstreaks
Sand, shale, and lignite streaks
Shale and rock layers (hard)
Sand (fine)
Lignite
Shale and lignite
Red and white clay
Sand
Cl ay
Sand
Cl ay
Sand
Clay
Sand
Coal, clay, and sand
Sa nd, streaked
C1 ay
Sandy
Cl ay
30
12
4
61
~
2
22
18
10
29
11
34
7
3
6
20
20
76
24
40
12
208
40
24
44
42
30
30
364
376
380
441
442
492
494
516
534
544
573
584
618
625
628
634
20
40
116
140
180
192
400
440
464
~8
5~
580
610
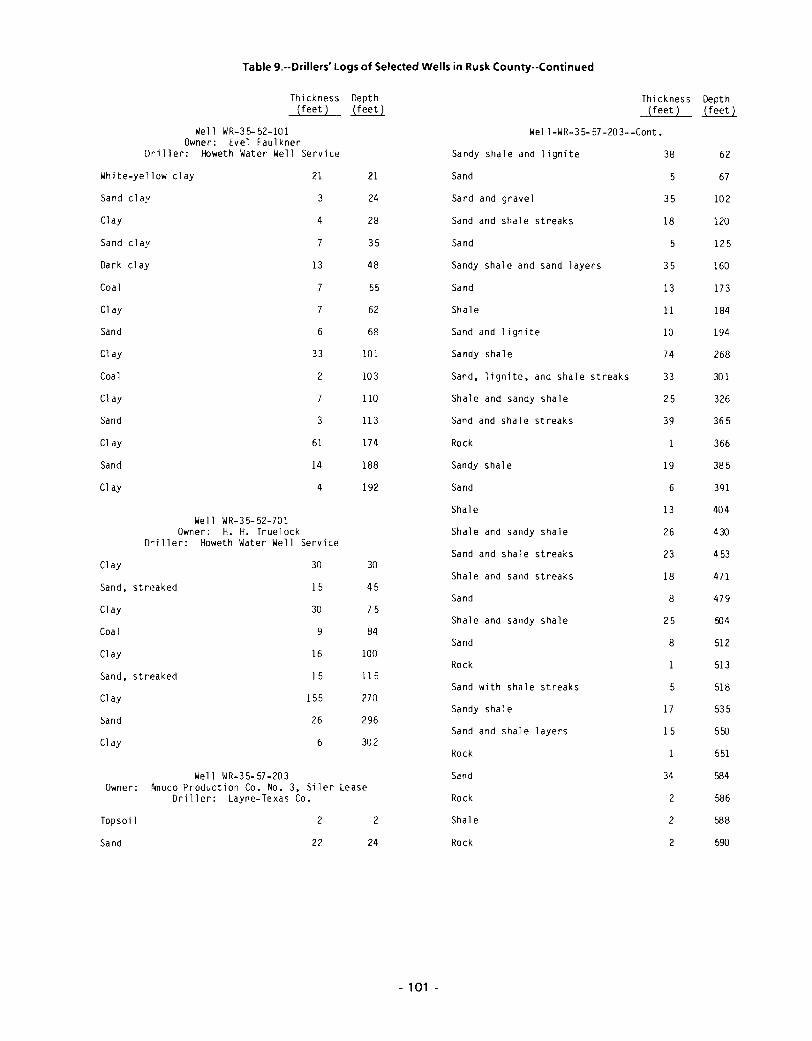
Table 9.--Drillers· Logs of Selected Wells in Rusk County--Continued
Thickness Depth Thickness Depth(feet ) ~ (feet) ~
Well WR-3 5- 52-10 1 We11-WR-35-57-203--Cont.Owner: Evel Faul kner
Driller: Howeth Water Well Servi ce Sandy shale and 1ignite 38 62
White-yellow clay 21 21 Sand 5 67
Sand clay 3 24 Sand and gravel 35 102
Clay 4 28 Sand and shale streaks 18 120
Sand clay 7 35 Sand 5 125
Dark clay 13 48 Sandy shale and sand layers 35 160
Coal 55 Sand 13 173
Clay 7 62 Shale 11 184
Sand 6 68 Sand and 1ignite 10 194
Clay 33 101 Sandy shale 74 268
Coal 2 103 Sand, lignite, and shale streaks 33 301
C1 ay 110 Shal e and sandy shale 25 326
Sand 3 113 Sand and shale streaks 39 365
Clay 61 174 Rock 366
Sand 14 188 Sandy shale 19 385
Clay 4 192 Sand 6 391
Shale 13 404Well WR-35-52-701
Owner: H. H. Truelock Shale and sandy shale 26 430Driller: Howeth Water Well Service
Sand and shale streaks 23 453Clay 30 30
Shale and sand streaks 18 471Sand, streaked 15 45
Sand 8 479Clay 30 75
Shal e and sandy shale 25 504Coal 9 84
Sand 8 512Clay 16 100
Rock 513Sand, streaked 15 115
Sand with shale streaks 5 518Clay 155 270
Sandy shale 17 535Sand 26 296
Sand and shale 1ayers 15 550Clay 6 302
Rock 551
We 11 WR-3 5- 57 -20 3 Sand 34 584Owner: .~oco Production Co. No.3, Siler Lease
Driller: Layne-Texas Co. Rock 2 586
Topsoi 1 2 2 Shale 2 588
Sand 22 24 Rock 2 590
- 101 -
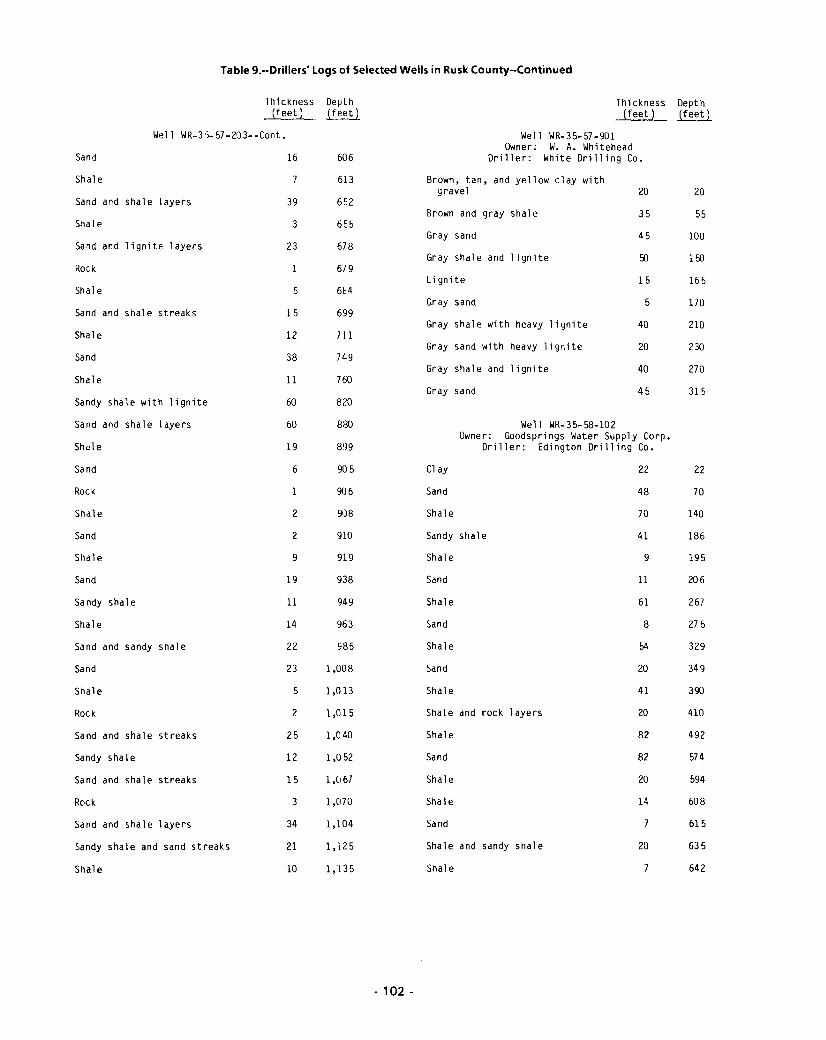
Table 9.--Drillers' Logs of Selected Wells in Rusk County--Continued
Sand and shale streaks
Sand and shale layers
Sand and shale layers
Sa1d and lignite layers100
20
22
Iffi
55
230
165
170
210
270
315
Depth~
20
20
35
45
ffi
15
5
40
45
40
Well WR-35-58-102Owner: Goodsprings Water Supply Corp.
Driller: Edington Drilling Co.
22
Brown, tan, and yellow clay withgravel
Brown and gray shale
Well WR-35-57-901Owner: W. A. Whitehead
Driller: White Drilling Co.
Thickness(feet)
Gray sand
Gray sand
Lignite
Cl ay
Gray sand
Gray shale with heavy lignite
Gray shale and lignite
Gray shale and lignite
Gray sand with heavy lignite
905
8;~0
711
678
679
6EA
606
613
652
760
749
880
899
699
Depth(feeU
39
3
23
19
6
11
38
5
15
12
60
60
16
Thickness(feet)
Well WR-3'>-57-203--Cont.
Rock
Sand
Shal e
Shale
Shal e
Sand
Sandy shale with lignite
Shal e
Shal e
Sand
Shale
Rock
Shale
Sand
Shale
Sand
Sandy shale
Shal e
Sand and sandy shale
Sand
Shale
Rock
Sand and shale streaks
Sandy shale
2
2
9
19
11
14
22
23
5
2
25
12
906
908
910
919
938
949
963
985
1,008
1,013
1,015
1,040
1,052
Sand
Shale
Sandy shale
Shale
Sand
Shale
Sand
Shal e
Sand
Shale
Shale and rock layers
Shale
Sand
48
70
41
9
11
61
8
54
20
41
20
82
82
70
140
186
195
206
267
275
329
349
390
410
492
574
Sand and shale streaks
Rock
Sand and shale layers
Sandy shale and sand streaks
Shale
15
3
34
21
10
1,067
1,070
1,104
1,125
1,135
Shale
Shal e
Sand
Shale and sandy shale
Shale
20
14
20
7
594
608
615
635
642
- 102 -
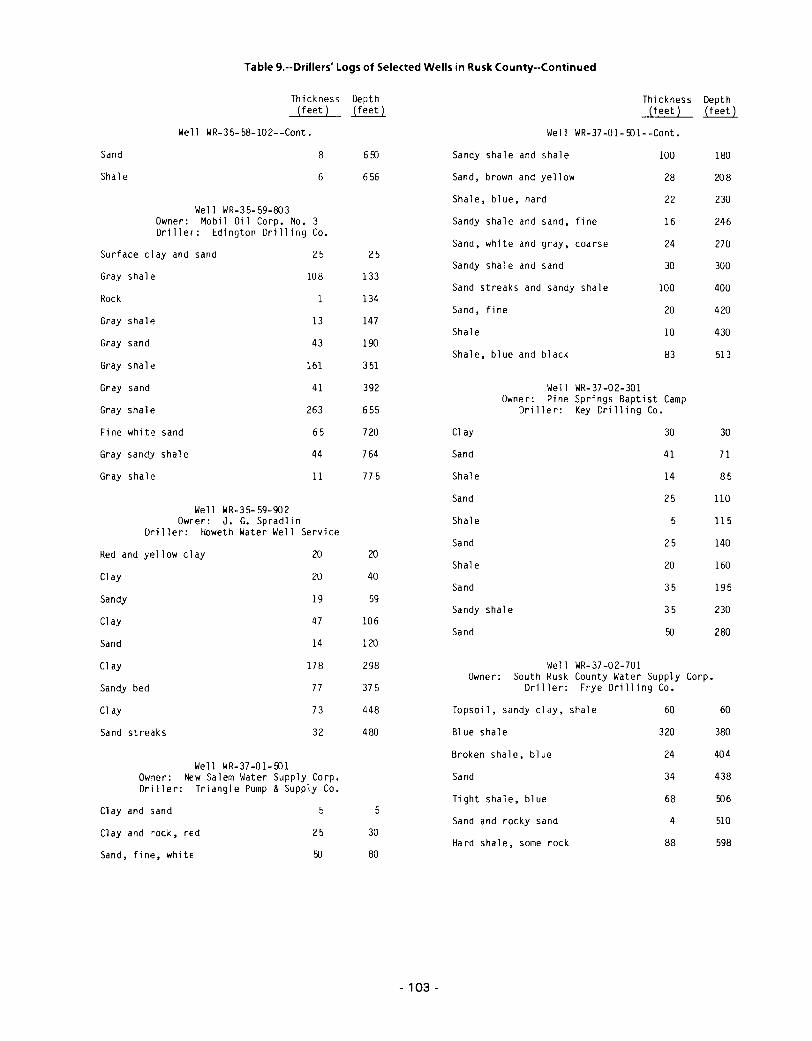
Table 9.--Drillers· Logs of Selected Wells in Rusk County--Continued
Thickness(feet)
Well WR-35- 58-102--Cont.
Depth~
Thickness(feet)
Well WR-37-01-501--Cont.
Depth~
Well WR-35-59-902Owrer: J. G. Spradl in
Dri ller: Howeth Water Well Service
Fi ne white sand
Gray sandy shale
Red and yellow clay
230
270
300
30
71
85
110
115
180
208
230
246
400
140
160
195
280
430
513
420
35
35
25
20
30
14
25
5
41
30
24
100
20
10
83
100
28
22
16
Well WR-37-02-301Owner: Pine Springs Baptist Camp
Driller: Key Drilling Co.
Sandy shale and sand, fine
Sandy shale and shale
Shale, blue, hard
Cl ay
Sand, white and gray, coarse
Sandy shale and sand
Sand, brown and yellow
Sand
Shale
Shale
Sand
Shale
Sand streaks and sandy shale
Sand, fine
Shale, blue and black
Shale
Sandy shale
Sand
Sand
Sand
20
40
650
656
59
106
120
25
133
134
147
190
351
392
655
720
764
775
25
13
43
20
19
47
14
20
65
44
11
108
161
41
263
8
6
We 11 WR-3 5- 59-80 3Owner: Mobil Oi 1 Corp. No.3Driller: Edin9ton Drilling Co.
Rock
Gray shale
Gray shale
Gray shale
Gray sand
Clay
Sand
Gray shale
Gray sand
Shale
Surface clay and sand
Sandy
Sand
Clay
Gray shale
Well WR-37-02-701Owner: South Rusk County Water Supply Corp.
Driller: Frye Drilling Co.
Clay
Sandy bed
Cl ay
Sand streaks
178
77
73
32
298
375
448
480
Topsoil, sandy clay, shale
Bl ue shal e
60
320
60
380
Well WR-37-01-501OW1er: New Salem Water Supply Corp.Driller: Triangle Pump &Supply Co.
Clay and sand
Clay and rock, rEd
Sand, fine, whitE
5
25
50
5
30
80
Broken shale, blue
Sand
Tight shale, blue
Sand and rocky sand
Hard shale, some rock
24
34
68
4
88
404
438
506
510
598
- 103 -
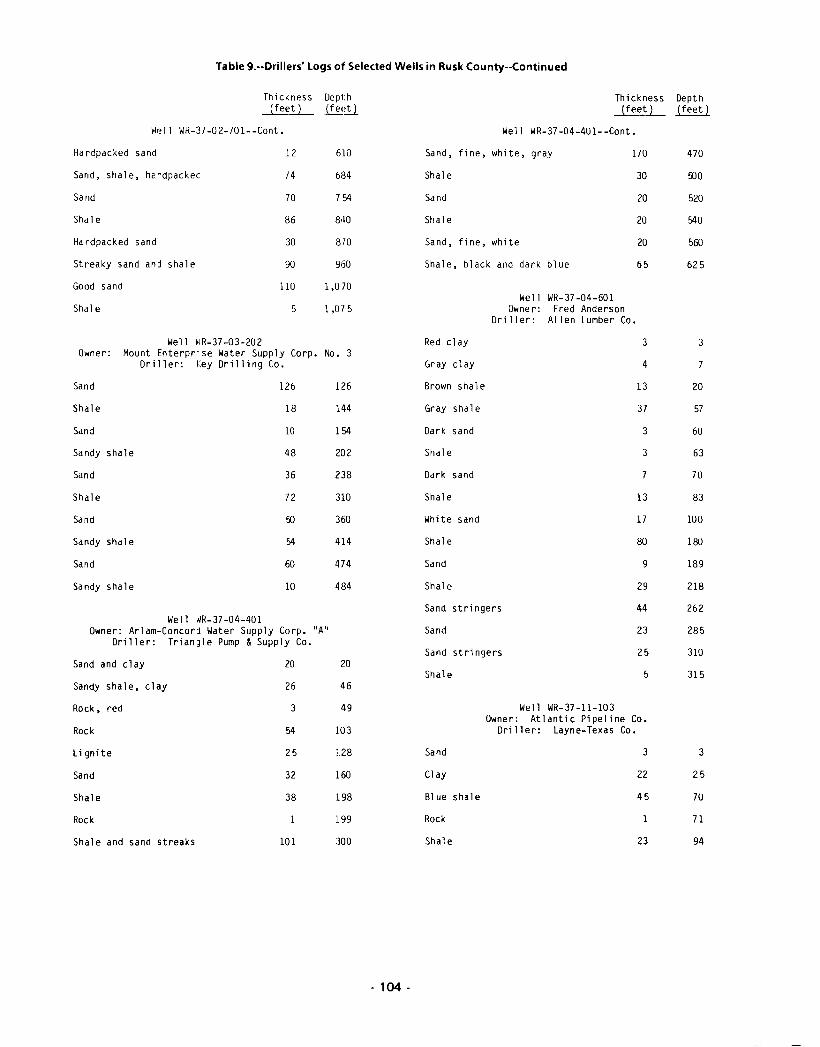
Table 9.--Drillers' Logs of Selected Wells in Rusk County-·Continued
Thickness Depth Thickness Depth(feet) ~:!l (feet) ~
Well WR-37-02-701--Cont. Well WR-37-04-401--Cont.
Ha rdpacked sand 12 610 Sand, fi ne, white, gray 170 470
Sand, shale, ha-dpackec 74 6B4 Shal e 30 !DO
Sand 70 754 Sand 20 520
Shale 86 8'lO Shal e 20 540
Ha rdpacked sand 30 810 Sand, fine, white 20 560
Streaky sand anj shale 90 960 Shale, black and dark blue 65 625
Good sand 110 1,070Well WR-37-04-601
Shal e 5 1,015 Owne r: Fred AndersonDriller: Al len Lumber Co.
Well rlR-31-03-202 Red clay 3 3Owner: Mount Enterpr"se Water Supply Corp. No. 3
Dr i 11 er: f:ey Drilling Co. Gray clay 4 7
Sand 126 126 Brown shale 13 20
Shale 18 144 Gray shale 37 57
Sand 10 154 Dark sand 3 60
Sandy shale 48 202 Shale 3 63
Sand 36 238 Da rk sand I 70
Shale 72 310 Shale 13 83
Sand !D 360 White sand 17 100
Sandy shale 54 414 Shal e 80 180
Sand 60 414 Sand 9 189
Sandy shale 10 484 Shale 29 218
Sand stri ngers 44 262Well ~R- 37 -04-40 1
Owner: Arlam-Concorj Water Supply Corp. "AN Sand 23 285Dri ller: Trianjle Pump &Supply Co.
Sand stri ngers 25 310Sand and clay 20 20
Shale 5 315Sandy shale, clay 26 46
Rock, red 3 49 Well WR-37 -11-103Owner: Atlantic Pipeline Co.
Rock 54 103 Dri ller: Layne-Texas Co.
Li gnite 25 J.28 Sand 3 3
Sand 32 160 Clay 22 25
Shale 38 198 Bl ue shale 45 70
Rock J.99 Rock 71
Shale and sand streaks 101 300 Shale 23 94
- 104 -
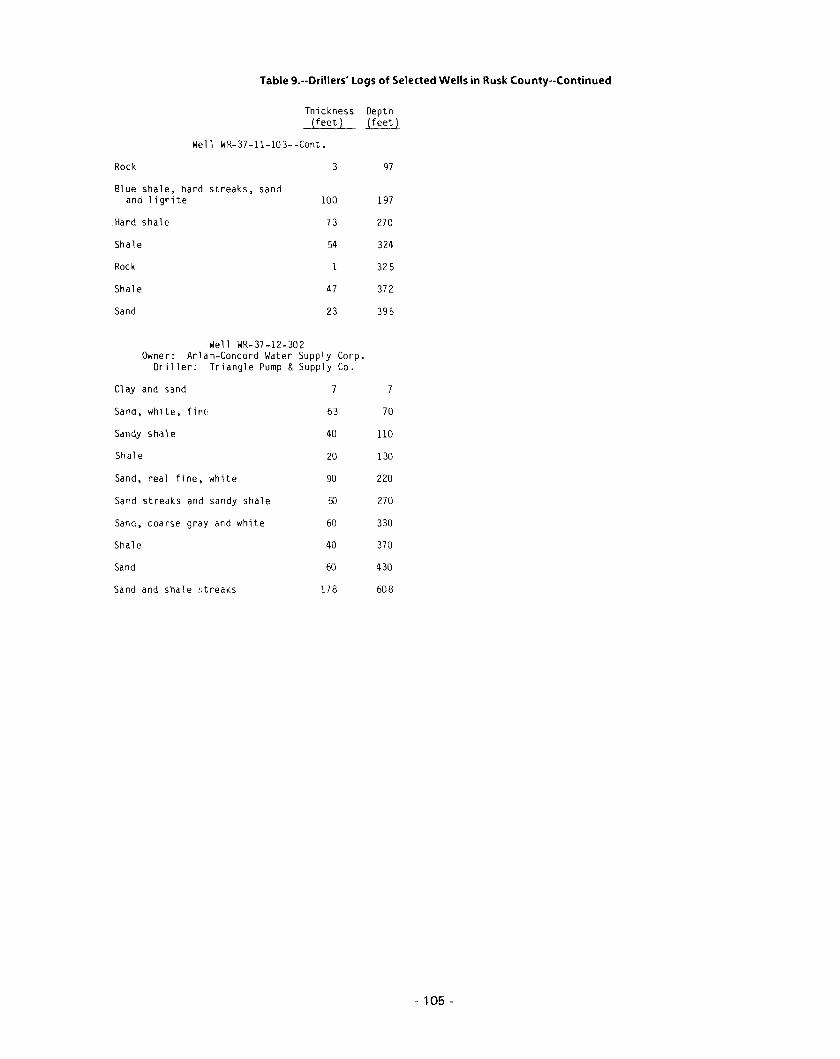
Table 9.--Drillers' Logs of Selected Wells in Rusk County--Continued
Thickness(feet)
Well WR-37-11-103--Cont.
Depth~
Rock 3 97
Blue shale, hard streaks, sandand ligrite 100 197
Hard shale 73 270
Shale 54 324
Rock 1 325
Shale 47 372
Sand 23 395
Well WR-37-12-302Owner: Arlam-Concord Water Supply Corp.
Driller: Triangle Pump &Supply Co.
Clay and sand
Sand, white, finE' 63 70
Sandy sh,~l e 40 110
Shal e 20 130
Sand, real fi ne, white 90 220
Sand streaks and sandy shale 50 270
Sand, Cad rse gray and white 60 330
Shale 40 370
Sand 60 430
Sand and shale ~treaks 178 608
- 105 -
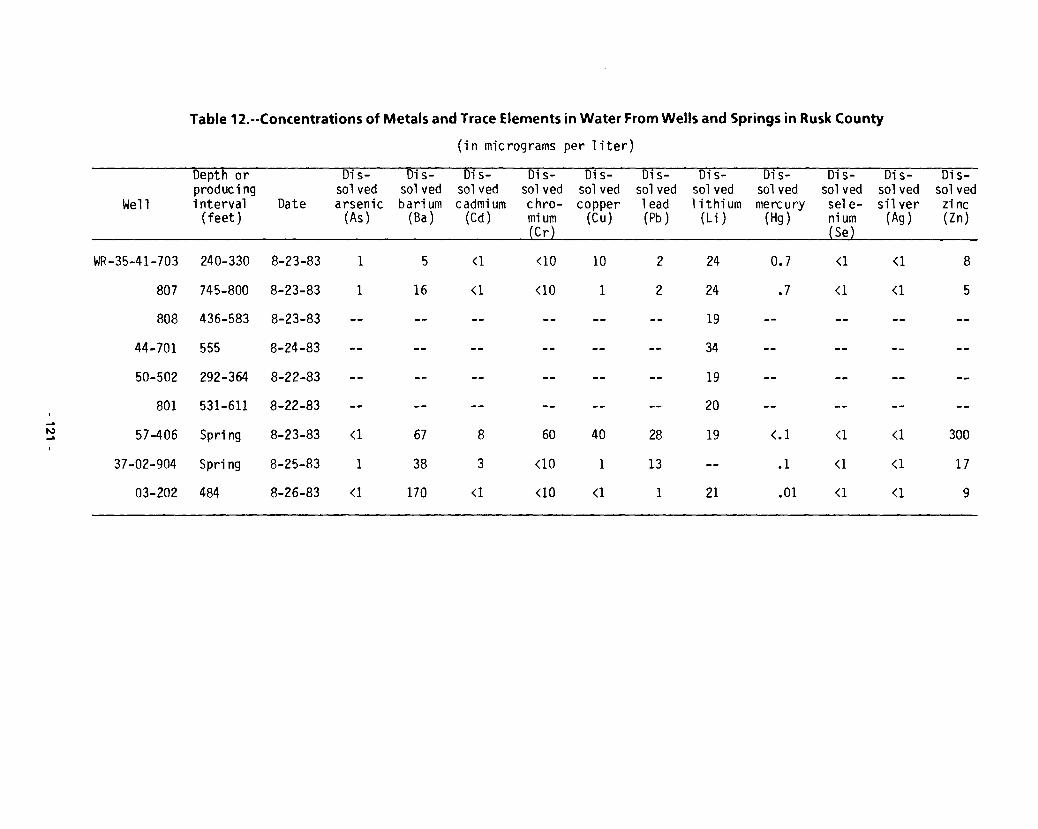
Table 12.--Concentrations of Metals and Trace Elements in Water From Wells and Springs in Rusk County
(in micrograms per liter)
Depth or Dis- Dis- Di 5- Dis- Dis- Dis- Di 5- Dis- Dis- Di s- OlS-produci ng sol ved 501 ved 501 ved 501 ved so1 ved sol ved sol ved 501 ved sol ved sol ved sol ved
Well interval Date arsenic bari um cadmium chro- copper 1 ead 1i thi um mercury se1 e- sil ver zi nc(feet) (As) (Sa) (Cd) mium (Cu) (Pb) (Li ) (Hg) nium (Ag) (Zn)~---_._- --~-~~~----~-_._-~~-
(C r) (Se)
WR -35-41-703 240-330 8-23-83 1 5 <1 <10 10 2 24 0.7 <1 <1 8
807 745-800 8-23-83 1 16 <1 <10 1 2 24 .7 <1 <1 5
808 436-583 8-23-83 -- -- -- -- -- -- 19
44-701 555 8-24-83 -- -- -- -- -- -- 34
50-502 292-364 8-22-83 -- -- -- -- -- -- 19
801 531-611 8-22-83 -- -- -- -- -- -- 20,~....,
57-406 Spring 8-23-83 <1 67 8 60 40 28 19 <.1 <1 <1 300~
37-02-904 Spring 8-25-83 1 38 3 <10 1 13 -- .1 <1 <1 17
03-202 484 8-26-83 <1 170 <1 <10 <1 1 21 .01 <1 <1 9