Embed Size (px)
Citation preview
GROUND-WATER RESOURCES
of
GRANT AND SIOUX COUNTIE SNORTH DAKOT A
by
P. G. Randic h
U.S. Geological Surve y
COUNTY GROUND-WATER STUDIES 24 — PART II INorth Dakota State Water CommissionVernon Fahy, State Engineer
BULLETIN 67 — PART II INorth Dakota Geological SurveyLee Gerhard, State Geologist
Prepared by the U .S . Geological Surveyin cooperation with the North Dakota Geological Survey ,
North Dakota State Water Commission ,
Grant County Water Management District, and
Sioux County Water Management District
1979

GROUND-WATER RESOURCES
of
GRANT AND SIOUX COUNTIE SNORTH DAKOT A
by
P. G. Randich
U .S. Geological Survey
COUNTY GROUND-WATER STUDIES 24 — PART II INorth Dakota State Water Commissio nVernon Fahy, State Engineer
BULLETIN 67 — PART II INorth Dakota Geological Surve y
Lee Gerhard, State Geologist
Prepared by the U .S . Geological Survey
in cooperation with the North Dakota Geological Survey,North Dakota State Water Commission ,
Grant County Water Management District, an d
Sioux County Water Management District
1979
Bismarck, North Dakota

CONTENTSPage
Abstract 1Introduction 1
Objectives and scope 3Previous investigations 3Acknowledgments 3Location-numbering system 4Geography 4Geohydrologic setting 6
Availability and quality of ground water 6General concepts 6Ground water in rocks of Late Cretaceous age 1 2
Fox Hills aquifer 1 2Hell Creek aquifers 1 7
Ground water in rocks of Tertiary age 1 9Cannonball and Ludlow aquifer, undifferentiated 1 9Tongue River aquifer 23Sentinel Butte aquifers 26
Ground water in glacial deposits of Pleistocene age 26Shields aquifer 28Elm Creek aquifer 3 0St . James aquifer 34Beaver Creek aquifer 34Battle Creek aquifer 35
Ground water in alluvial deposits of Holocene age 36Heart River Valley aquifer 36Cannonball River Valley aquifer 36Cedar Creek Valley aquifer 37
Regional ground-water flow system and geochemical relationships 37Ground-water utilization 39
Rural domestic and livestock use 39Public supplies 40
Carson 40Elgin 40Leith 41New Leipzig 41Fort Yates 41Selfridge 41Solen 4 1
Summary and conclusions 42Selected references 45Definitions of selected terms 49
iii
ILLUSTRATION SPlate
Page1. Map showing availability of ground wate r
in glacial-drift and alluvial aquifers (in pocket)2. Geohydrologic section A-A' showing bedrock
aquifers (in pocket)3. Geohydrologic section B-B' showing bedrock
aquifers (in pocket )4. Geohydrologic section C-C ' showing synclinal
structure and bedrock aquifers (in pocket )5. Geohydrologic sections showing aquifers i n
glacial buried-valley deposits (in pocket )
Figure1. Map showing physiographic divisions in North Dakota and locatio n
of study area 22. Diagram showing locating-numbering system 53. Map showing generalized surficial geology 74. Map showing structure contours of the base of the Fox Hill s
Formation 95. Diagram showing classifications of selected water sample s
for irrigation purposes 1 36. Hydrograph showing water-level fluctuations in the Fo x
Hills aquifer 1 47. Hydrographs showing water-level fluctuations in the Fo x
Hills aquifer, stage changes in the Cannonball River, an dprecipitation at Breien, Sioux County 1 5
8. Map showing the potentiometric surface of the Fox Hill saquifer, December 1973 1 6
9. Hydrographs showing water-level fluctuations in the middl eHell Creek aquifer in Grant County 1 9
10. Map showing the potentiometric surface of the upper Hel lCreek aquifer, 1973 2 0
11. Hydrographs showing water-level fluctuations in the Cannonbal land Ludlow aquifer, Grant County 21
12. Map showing potentiometric surface of the Cannonball an dLudlow aquifer, 1973 22
13. Diagram showing selected analyses of water from the CannonballRiver at Breien, and from major aquifers underlying the rive rupstream from the Breien station 2 4
iv

Figure
Page14. Hydrographs showing water-level fluctuations in the Tongu e
River aquifer, Grant County 2515. Map showing potentiometric surface of the Tongue Rive r
aquifer, December 1973 2 716. Hydrographs showing water-level fluctuations in the Shields aquifer ,
stage changes in Lake Oahe, and precipitation at Fort Yates ,Sioux County 29
17. Hydrog raphs showing water-level fluctuations in the Shield saquifer and precipitation at Shields 3 1
18. Hydrog raphs showing water-level fluctuations in the Elm Cree kaquifer, stage changes in the Heart River, and precipitationat Carson, Grant County 3 3
19. Diagram showing major constituents in water from major aquifer sand from streams 3 8
TABLE STable1. Stratigraphy of geologic formations in Grant and Siou x
Counties 82. Major chemical constituents in water — their sources, effects
upon usability, and recommended concentration limits 1 13. Summary of data for glacial-drift and alluvial aquifers 43
v

SELECTED FACTORS FOR CONVERTING U .S. CUSTOMARY UNITSTO THE INTERNATIONAL SYSTEM (SI) OF METRIC UNIT S
A dual system of measurements — U.S. customary units and the Interna-tional System (SI) of metric units — is given in this report . SI is an organize dsystem of units adopted by the 11th General Conference of Weights and Meas-ures in 1960 . Selected factors for converting U .S . customary units to SI unit sare given below .
MultiplyU.S . customary units ByAcre 0.404 7Acre-foot (acre-ft) .001233Cubic foot per second (ft 3/s) .02832
Foot .304 8Foot per day (ft/d) .304 8Foot per mile (ft/mi) .18943Foot squared per day (ft2/d) .0929
Gallon 3.785Gallon per day (gal/d) 3.785x10⁻³Gallon per minute (gal/min) .06309Inch 25 . 4Mile 1 .609Million gallons (Mgal)
3,785Square mile (mi l)
2.590
To obtain SI unitshectare (ha)cubic hectometer (hm 3 )cubic meter per second
(m3/s)meter (m )meter per day (m/d)meter per kilometer (m/km)meter squared per day
( m2/d)liter (L)cubic meter per day (m 3 /d)liter per second (L/s )millimeter (mm)kilometer (km )cubic meter (m 3 )square kilometer (km 2 )
vi

GROUND-WATER RESOURCES O FGRANT AND SIOUX COUNTIES, NORTH DAKOT A
By
P. G. Randich
ABSTRAC T
Ground water in Grant and Sioux Counties is obtainable from aquifers ofLate Cretaceous, Tertiary, Pleistocene, and Holocene age . Aquifers of Cre-taceous and Tertiary age are larger in areal extent, but those of Pleistocene ag eprovide larger yields of better quality water to individual wells .
The major bedrock aquifers in Grant and Sioux Counties are the Fox Hill sand Hell Creek aquifers of Late Cretaceous age and the Cannonball and Lud-low, undifferentiated, and Tongue River aquifers of Tertiary age . Potentialyields to individual wells range from about 5 to 150 gallons per minute (0 .3 to9 .5 liters per second) . Water in these aquifers becomes increasingly saline as i tmoves from topographically high recharge areas toward low-lying dischargeareas, As the ground water moves downward through the aquifers it change sfrom sodium and calcium bicarbonate-sulfate types to a sodium bicarbonate -chloride type. The water generally is soft and high in dissolved solids .
Aquifers of Pleistocene age — the Shields, Elm Creek, St . James, BeaverCreek, and Battle Creek aquifers — underlie about 48 square miles (120 squarekilometers) in Grant and Sioux Counties and contain approximately 355,00 0acre-feet (438 cubic hectometers) of available ground water . Well yields of asmuch as 1,000 gallons per minute (63 liters per second) are obtainable in a fe wplaces along the central axes of these aquifers . The major dissolved constituent sin water from these aquifers are calcium, magnesium, sodium, bicarbonate, andsulfate . Dissolved solids in samples collected from the aquifers ranged from 32 1to 1,870 milligrams per liter .
Aquifers of Holocene age are located in the alluvial deposits in the Cannon-ball River, Heart River, and Cedar Creek valleys . These aquifers contain about70,000 acre-feet (86 cubic hectometers) of available ground water in Grant andSioux Counties . Potential well yields generally are less than 50 gallons pe rminute (3 .2 liters per second) .
INTRODUCTIO N
The investigation of the ground-water resources of Grant and Sioux Coun-ties (fig . 1) was made cooperatively by the U .S. Geological Survey, NorthDakota State Water Commission, North Dakota Geological Survey, and Gran tand Sioux Counties Water Management Districts . The results of the investiga-tion are published in three parts . Part I is an interpretive report describing thegeology of the study area. Part II (Randich, 1975) is a compilation of the
1

''2110j
BILLINGS
/SSOUR1
\
O L I V E RRBR_
I G
< \Yq r DUNN '
STARK
_jORTON
j
r,
_ ykAr r
SLO P ,H ETTINGER
~ "ti.,,TM1!LA
98 °
FDDY RIGG S
1 15HERICAN SWELL SBURLEIGH1KIDDE R
\
_LSTUTSMA NEM ONS
\sOVn
h
ILOGAN
'r
AMOUR'_rC INTOSH
DICKE Y
L -00°
TSTEELE1
TRAIL
IIA N DI\
crass)PLAI N
(RID RIV E
I-l'$ARG EN T•RANSOM
--VALLEY)
iRICH LA N
98° MODIFIED FROM FENNEMAN (19A6 1
300 °BOTTINEAUl ROLETTE 1TOWNER l CAVALIER
LAK E
~PEM BIN A
J
RAMSEY
WALS HTPIERCE
-~-~
~eENSO CENTRAL ,_[N ELSON GRAND FORK S
1;DRIFT PRAIRIE~L ,
J
1.~,
I o
MC HENRY_
EYENN(
1-~-i
1 \
•
–
AGASSI Z
ro
50 0
0
q 0 25I
ti
,
'
4
q 10 50
100 MILE S150 KILOMETER S
FIGURE 1 .-Physiographic divisions in North Dakota and location of study area .

geologic and hydrologic data collected during the investigation, and is a refer-ence for the other two parts . Part III is this interpretive report describin gground-water resources . The reports are prepared and written to assist Stat eand County water managers, consultants to water users, and water users in th edevelopment of ground-water supplies for municipal, domestic, livestock, irri-gation, industrial, and other uses .
Objectives and Scope
The objectives of the investigation in Grant and Sioux Counties were to : (1 )determine the location, extent, and characteristics of the aquifers ; (2) evaluatethe occurrence, movement, recharge, and discharge of ground water ; (3) esti-mate the quantities of water stored in the glacial and alluvial aquifers ; (4)estimate potential yields to wells penetrating major aquifers ; and (5) describethe chemical quality of the ground water .
Interpretations contained in this report are based on data from 1,610 wellsand test holes . These data include lithologic and geophysical logs of 257 tes tholes and wells ; water-level measurement in 77 observation wells ; chemicalanalyses of 135 samples of ground water; 13 chemical analyses of minor ele-ments in water from wells ; 30 laboratory tests of core samples to determin ehydrologic properties, particle sizes, and heavy minerals ; and 24 flow- or slug-tests to determine aquifer characteristics . Also used were chemical analyses of15 water samples from streams during periods of low flow and 15 stream dis-charge measurements during periods of low flow .
Previous Investigation s
The first geologic or hydrologic studies that included Grant and Sioux Coun -ties were made by Lloyd (1914), who investigated the lignite deposits in theCannonball Formation, and by Calvert and others (1914), who investigated thegeology of the Standing Rock and Cheyenne River Indian Reservations .Simpson (1929) included a brief description of the geology and ground-wate rresources of Grant and Sioux Counties in his report on the geology an dground-water resources of North Dakota. Denson (1950) studied the usablelignite deposits on the Cheyenne River and Standing Rock Reservations, an dMaclay (1952) discussed the occurrence of ground water on the reservations .The geology in two topographic quadrangles in the Heart Butte area have bee nmapped by Stephens (1970) .
Acknowledgment s
Collection of the data on which this report is based was made possible b ythe cooperation of residents and officials of Grant and Sioux Counties, the U .S .Public Health Service, the U .S. Bureau of Indian Affairs, and council member sof the Standing Rock Indian Reservation . M . O. Lindvig, L. L. Froelich, andC . E. Naplin of the North Dakota State Water Commission contributed to th e
3

interpretation of the geohydrology of the area . Special recognition is given to C .C. Carlson of the North Dakota Geological Survey for his contribution to theunderstanding of the surface geology and subsurface stratigraphy .
Location-numbering Syste m
The location-numbering system (fig . 2) used in this report is based on thesystem of land survey used by the U .S. Bureau of Land Management and theNorth Dakota district of the U.S. Geological Survey . The first numeral denotesthe township north of a base line, the second numeral denotes the range west ofthe fifth principal meridian, and the third numeral denotes the section in whic hthe well is located . The letters A, B, C, and D designate, respectively, th enortheast, northwest, southwest, and southeast quarter section, quarter -quarter section, and quarter-quarter-quarter section (10-acre or 4-ha tract) . Forexample, well 129-090-15ADC is in the S Wl/4SE 1/4N E 1/4 sec 15, T . 129 N ., R .090 W. Consecutive final numerals are added if more than one well is recorde dwithin a 10-acre (4-ha) tract .
Geography
Grant and Sioux Counties are in the glaciated and unglaciated section of th eGreat Plains physiographic province (fig . 1) . The counties have an area of abou t2,769 mi2 (7,172 km 2) in south-central North Dakota — Grant County has anarea of about 1,666 m i 2 (4,315 k m 2 ) and Sioux County has an area of about 1,103mi 2 (2,857 km 2) . All of Sioux County lies within the Standing Rock India nReservation .
The counties are in the Missouri River drainage basin . The principalstreams, Cedar Creek, the Cannonball River, and the Heart River, are east -flowing drainages to Lake Oahe . Lake Oahe, formed behind Oahe Dam, bor-ders Sioux County on the east .
The topography ranges from rolling prairie in Grant County to large areas o fbadlands in Sioux County . The maximum relief is about 1,200 feet (370 m). Thehighest point (Pretty Rock Butte) is 2,823 feet (860 m) above sea level i nsouthwestern Grant County .
The climate is semiarid ; mean annual precipitation is 15 to 16 inches (381 to406 mm). Most precipitation is received during the growing season, which i sthe period April through September . The mean annual temperature range sfrom 41.4°F (5 .2°C) at Carson to 43.2°F (6 .2°C) at Fort Yates . The averagenumber of days in the growing season (above 32°F or 0°C) ranges from 110 to129 days per year .
Grant County has a population of 5,009 and Sioux County has a populatio nof 3,632 (U.S. Bureau of the Census, 1971) .
Dry-land farming and stock raising are the two primary industries . Theprincipal crops are wheat, hay, oats, corn, and barley . Livestock productio nincludes cattle, chickens, hogs, and sheep . In general, farming is carried on i nthe rolling uplands near the stream divides and in the stream valleys, and stoc k
4

FIGURE Z—Location-numbering system .
5

raising in the badlands and hilly terrain adjoining the main drainage courses .Some lignite is mined commercially in western Grant County .
Geohydrologic Setting
The generalized surficial geology of Grant and Sioux Counties is shown i nfigure 3 . Rocks of Late Cretaceous and Tertiary age crop out across the two -county area . Most of the usable ground water in Grant and Sioux Counties is i nthese rocks and in unconsolidated deposits of Quaternary age ; thus they arestudied in detail with special reference to their water-bearing properties . Tabl e1 summarizes the stratigraphy of the geologic units overlying the Pierre Forma -tion' . For practical purposes the Pierre Formation forms the base of th efreshwater-bearing units in the study area, and test drilling stopped when thi sformation was reached . Water-bearing rocks older than the Pierre generally ar eat depths greater than 2,500 feet (760 m) and they contain brackish or salin ewater .
The structure-contour map (fig . 4) of the base of the Fox Hills Formatio nshows that the Fox Hills dips about 5 to 18 ft/mi (0 .9 to 3 .4 m/km) northwesttoward the center of the Williston basin . The Cretaceous rocks exposed in theeastern part of the area lie several hundred feet below land surface in th enorthwestern part of the area .
About two-thirds of the area was glaciated during Pleistocene time . Most ofthe glacial drift (Coleharbor Formation) has been eroded away, leaving onl yisolated remnants randomly scattered in parts of the area (fig . 3) . The thickes tdrift deposits are located in buried valleys, which at one time contained glacialice-front streams . The buried valleys now contain the major glacial-drift aqui-fers in Grant and Sioux Counties (pl . 1, in pocket) .
The flood plains of the major rivers and creeks contain alluvial deposit s(Walsh Formation) of Holocene age . Saturated sand and gravel intervals inthese deposits form productive aquifers in Grant and Sioux Counties (p . 1) .
AVAILABILITY AND QUALITY OF GROUND WATE R
General Concepts
All ground water is derived from precipitation . After precipitation falls onthe earth ' s surface, part is returned to the atmosphere by evaporation, part run soff into streams, and the remainder infiltrates into the ground . Some of thewater that enters the ground is held by capillarity and evaporates or is trans-pired. The water in excess of the moisture-holding capacity of the soil infiltrate sdownward to the water table and becomes available to wells .
Ground water moves under the influence of gravity from areas of recharg eto areas of discharge . Ground-water movement generally is very slow and ma ybe only a few feet per year . The rate of the ground-water movement is gov-erned by the hydraulic conductivity of the material through which it moves an d
'The stratigraphic nomenclature used in this report is that of the North Dakota Geological Survey and does no tnecessarily follow the usage of the U .S . Geological Survey .
6

E%PU.TIO M
C~l9w so
On,
iGY,O.MnTOw
~cin c
R .90 W.
R .89 W .
R .88W .
R .87W .
R .86W .
R .85 W .
R .84 W.
R .83 W.
R .82 W.
R .8 W.
R .90 W .
R .79 W .
2
;0 MILO S
10
15
20
25 KILOMETER S
FIGURE 3.-Generalized surficial geology .
? iJ0
5

TABLE I . — Stratigraphy of geologic formations that crop out in Grant and Sioux Counties
System SeriesGeologic
formations
Averagethickness
(feet)
Range inthickness
(feet) Occurrence and lithology
Walsh 35 0-117 Occurs in the flood plains of the Heart and Cannonball Rivers, Cedar Creek ,
s Formation and their tributaries. It is composed of stratified gravel, sand, silt, and clay . Thei (alluvium) materials appear to be randomly interfingered and mixed . The thickest sections
of sand and gravel occur in the channel terraces . The present channels containmostly sand, silt, and clay . Origin of the materials varies from western siliceou srocks to redeposited glaciofluvial or bedrock material .
Coleharbor 220 0-338 Mantles parts of the surface in the northeastern and eastern parts of the area. I tFormation consists of till, clay; silt, sand, gravel, cobbles, and boulders . In many places
(glacial the fine materials have been eroded so that only a boulder pavement remains .drift) The thickest accumulation of drift is in buried valleys. The coarsest sand and
gravel generally is located at the bottom and along the northern flanks of th eburied valleys . About 90 percent of the drift in these valleys is a mixture of sand ,silt, and clay.
Sentinel 100 0-185 Present in a small area in the northwestern part of Grant County . It consists of
Butte interbedded very fine to fine sandstone, siltstone, claystone, shale, and lignite .Formation A sandstone interbedded with siltstone generally occurs near the base of th e
formation. The basal unit contains carbonaceous streaks . Interbedded siltstone,claystone, shale and lignite make up about 90 percent of the formation . Ironstonenodules and petrified wood fragments are often concentrated along beddin gplanes .
Tongue River 250 0-358 Well exposed in the northwestern one-third of the area in Grant County . It
Formation consists of interbedded very fine to medium sandstone, siltstone, claystone ,shale, lignite, and limestone. Persistent sandstone beds generally occur at twostratigraphic horizons . The most extensive is the basal sandstone, which contain sabundant petrified wood and, locally, carbonaceous plant fragments or seams o f
r
r lignite . Interbedded shale, claystone, and siltstone make up about 70 percent o fthe formation . Extensive thick lignite beds are rare, but locally may be severa lfeet thick . Thin lenses of limestone, usually less than 4 inches thick, occur in th esiltstone and claystone beds .
Cannonball 395 0-465 Widely exposed in the central part of the area . It consists of interbedded very
and fine to medium sandstone, siltstone, claystone, and shale . Persistent sandstoneLudlow beds generally occur at three stratigraphic horizons . The most extensive is th e
Formations, middle bed, which contains large circular concretions . The sandstones areundifferen- generally friable, glauconitic, and noncalcareous, except that the large concre -
tiated lions have a matrix of calcium carbonate cement . About two-thirds of the forma-tion consists of siltstone, claystone, and shale . The siltstone and claystone ar enoncalcareous and contain abundant macerated plant and carbonaceous mate -rial, mica flakes, and iron concretions . The shales are carbonaceous and, locally ,quite oily.
Hell Creek 294 0-325 Extensively exposed in the east-central part of the area . It consists of very fineFormation to medium quartzose sandstone, siltstone, shale, and very thin beds of lignite .
Lensing sandstone beds occur at about three stratigraphic horizons . Thesandstone is characterized by a "salt and pepper" appearance because it containsmany magnetite grains and manganese minerals . The most extensive is the upperbed, which contains thin lenses of bentonitic siltstone and siderite nodules . Thebasal sandstone is lignitic and grades into lignitic and bentonitic shale containin gpetrified wood.
Fox Hills 297 0-396 Exposed in the eastern part of Sioux County . It consists of very fine to medium
i Fonnation sandstone, siltstone, and shale . A persistent sandstone bed occurs at or near th e
5top of the formation. It is very fossiliferous in places, and often forms broa dresistant benches or hilltops capped by resistant flaggy sandstone . Thi sstandstone is occasionally interbedded with thin lenses of siltstone and shale an d
U ), comprises about one-third of the formation thickness in this area. The remainin gtwo-thirds of the formation consists of interbedded siltstone and shale containin goccasional fossil zones and limonitic concretions. In places, the basal part con-tains a volcanic ash bed associated with a very dense bentonitic shale .
Pierre 1,100 Exposed in a very small part of the area in southeastern Sioux County alon g
Formation Lake Oahe. The contact between the Pierre and the overlying Fox Hills i sgradational for about 80 feet of the stratigraphic section in most places an dconsists of a bentonitic shale . The Pierre Formation consists predominantly ofdark-grayish-black bentonitic shale with occasional fossils . Only the upper part ofthe formation was examined during this study.
8

EXPLANATIO N
- -/500— STRUCTURE CONTOUR—Shows altitudeof base of Fox Hills Formation . Dashedwhere inferred. Contour interval 10 0feet (30.5 meters) . Datum is mean sealevel
•1166 HYDROLOGIC TEST HOLE—Number i saltitude at base of Fox Hills Formatio n
0 1407 OIL-TEST HOLE—Number is altitude atbase of Fox Hills Formation
\
116 6
RALE H
1368 J
I
^^'p0'
L
I 159 0
is°
SEL FRI 0• 1526 1542
1
q
1535 '60
66 4
1
1
\1 00 172.
-1---L--i—~
I
LR .90 W.
,400
0 143 3
RIVER 14 5 1
1500
142 3
R .89 W .
R .88W.
R.87W.
R .86W .
R .85W .
R .84W.
R .83W .
R.82W .
R .81W .
R .80W.
0
3
6
12
18 MILE S
0
5
10
15
20
25 KILOMETER S
FIGURE 4.-Structure contours of the base of the Fox Hills Formation .
R .79 W.

by the hydraulic gradient. Gravel, well-sorted sand, and fractured rocks gener-ally are highly conductive . Deposits of these materials form aquifers .Cemented deposits and fine-grained materials such as silt, clay, and shal eusually have a low conductivity and restrict ground-water movement.
The water level in an aquifer fluctuates in response to recharge to anddischarge from the aquifer, usually indicating a change in the amount of waterstored in the aquifer . In confined aquifers, however, changes in atmospheri cpressure and in surface load also cause fluctuations in water level . In the repor tarea, aquifers exposed at land surface are recharged each spring, summer, an dearly fall by direct infiltration of precipitation . Aquifers that are confined bythick deposits of fine-grained materials are recharged by seepage from thefine-grained materials or by lateral movement downgradient from a recharg earea exposed at land surface . The rate of recharge may increase as water levelsin the aquifer are lowered by pumping . However, water levels may decline fo rseveral years before sufficient recharge is induced to balance the rate of with-drawal . In some places this balance may never be achieved without curtailmentof withdrawal .
In parts of Grant and Sioux Counties, surface-water sources, such as Lak eOahe, the Heart and Cannonball Rivers, and other smaller sources, are inhydraulic connection with aquifers . The aquifer may either receive recharg efrom the surface-water sources or discharge ground water into them, depend-ing on head relationships, which generally vary both in time and space .
The ground water in Grant and Sioux Counties contains varying concentra-tions of dissolved mineral matter . Rainfall begins to dissolve mineral matter a sit falls and continues to dissolve mineral matter as the water infiltrates throughthe soil . The amount and kind of dissolved mineral matter in water depend supon the kinds and proportions of minerals that make up the soil and rocks, thepressure and temperature of the water and rock formations, and the concentra-tion of carbon dioxide and soil acids in the water . Ground water that has been intransient storage a long time, or has moved a long distance from a recharg earea, generally is more highly mineralized than water that has been in transitonly a short time .
The suitability of water for various uses usually is determined by the kindand amount of dissolved mineral matter . The chemical constituents, physicalproperties, and indices most likely to be of concern are : iron, sulfate, nitrate ,fluoride, boron, chloride, dissolved solids, hardness, temperature, odor, taste ,specific conductance, sodium-adsorption ratio (SAR), and percent sodium . Thesources of the major chemical constituents, their effects on usability, and therecommended limits are given in table 2 . Additional information regardingdrinking-water standards may be found in "Water-Quality Criteria, 1972, " pub-lished by the U .S . Environmental Protection Agency (National Academy ofSciences-National Academy of Engineering, 1972) .
In this report numerous references are made to ground-water types, such a ssodium bicarbonate type and calcium bicarbonate type . These types are de -rived from inspection of the water analyses and represent the predominantcation (sodium, calcium, or magnesium) and anion (bicarbonate, sulfate, o rchloride), as expressed in milliequivalents per liter .
10

TABLE 2.—Major chemical constituents in water — their sources, effects upon usability, and recommended concentration limit s
(Modified from Durfor and Becker, 1964, table 2 )
Constituents Major source Effects upon usability
National Academ yof Sciences —National Academy o fEngineering (1972)recommended limitsfor drinking water Constituents Major source Effects upon usability
National Academyof Sciences —National Academy ofEngineering (1972)recommended limitsfor drinking wate r
Silica(SiOs)
Bicarbonate(HCOn )Carbonate(COs)
Limestone and dolomite .
Iron(Fe)
0.3 mg/LSulfate(SO.)
Gypsum, anhydrite, andoxidation of sulfide min-erals .
Chloride(CI)
Halite and sylvite .
Manganese(Mn)
0.05 mg/L
Fluoride(F)
Amphiboles, apatite ,fluorite, and mica.
Calcium(Ca)
Magnesiu m(Mg)
Nitrate(NOs)
Organic matter, fertiliz-ers, and sewage .
Sodium(Na)Potassiu m(K)
Dissolvedsolids
Anything that is soluble .
Boron(B)
Feldspars, quartz, ferro-magnesian and clay min-erals
Natural sources: amphi-boles, ferromagnesianminerals, ferrous andferric sulfides, oxides ,carbonates, and clay min-erals . Manmade sources:well casings, pumps, andstorage tanks .
Soils, micas, amphiboles,and hornblende .
Amphiboles, feldspars ,gypsum, pyroxenes, an-hydrite, calcite, aragon-ite, limestone, dolomiteand clay minerals .Amphiboles, olivine, py-roxenes, magnesite, dolo-mite, and clay minerals.
Feldspars . clay minerals ,and evaporites .Feldspars, feldspathoids ,some micas, and cla yminerals .
Tourmaline, biotite, andamphiboles.
In presence of calcium and magnesium ,silica forms a scale in boilers and onsteam turbines that retards hea ttransfer .
If more than 0.1 mg/L' is present ,it will precipitate when exposed to air :causes turbidity, stains plumbing fu-tures, laundry, and cooking utensils ,and imparts tastes and colors to foodand drinks . More than 0 .2 mg/L isobjectionable for most industrial uses .
More than 0.2 mg/L precipitates uponoxidation . Causes undesirable taste anddark-brown or black stains o nfabrics and porcelain fixtures. Mos tindustrial uses require water con-taining less than 0 .2 mg/L .
Calcium and magnesium combine wit hbicarbonate, carbonate, sulfate, an dsilica to form scale in heating equip-ment. Calcium and magnesium retardthe suds-forming action of soap anddetergent . High concentrations ofmagnesium have a laxative effect.
More than 50 mg/L sodium and potas-sium with suspended matter causesfoaming, which accelerates scale forma -tion and corrosion in boilers .
Essential to plant nutrition . Morethan 2 mg/L may damage some plants .
Heating water dissociates bicarbonat eto carbonate and(or) carbon dioxide .The carbonate can combine withalkaline earths (principally calciu mand magnesium) to form scale .
Combines with calcium to form scale .More than 500 ssg/L tastes bitter andmay be a laxative .
In excess of 250 mg/L may impart saltytaste, greatly in excess may causephysiological distress . Food processingindustries usually require less tha n250 mg/L.
Optimum concentration in drinkin gwater has a beneficial effect on th estructure and resistance to decay ofchildren' s teeth . Concentrations i nexcess of optimum may cause mottlingof children's teeth. Maximum limit forGrant and Sioux Counties is 2 .4 mg/L.
More than 100 mg/L may cause a bittertaste and may cause physiological dis-tress . Concentrations in exces sof 45 mg/L have been reported to caus emethemoglobinemia in infants .
Less than 300 mg/L is desirable forsome manufacturing processes . Exces-sive dissolved solids restrict theuse of water for irrigation.
250 mg/ L
250 mg/ L
Recommended max-imum limits dependon average of maxi-mum daily air tem-peratures . Maximumlimits range from 1. 4mg/L at 32°C to 2 .4mg/L at 10°C .
45 mg/L
Because of the widerange of mineraliza-tion, it is not pos-sible to establish alimiting value.
'Milligrams per liter .

The quality of water used for irrigation is an important factor in productivit yand in quality of the irrigated crops . Irrigation classifications were determine dfor selected water samples from aquifers in Grant and Sioux Counties (fig . 5) ,using a classification system developed by the U.S. Salinity Laboratory Staff(1954) .
Ground Water in the Rocks of Late Cretaceous Age
Fox Hills aquifer
The Fox Hills Formation crops out in most of eastern Sioux County (fig . 3) .Extensive beds of sandstone occur in the upper part of the formation . Thesesandstone beds form a major aquifer (pls . 2-4, in pocket), underlying all ofGrant County and all but the extreme southeastern part of Sioux County .
The Fox Hills aquifer is the largest and most extensive aquifer studied in th etwo-county area . Depth to the top of the aquifer ranges from land surface i neastern Sioux County to about 900 feet (270 m) below land surface in north -western Grant County . Thickness of the aquifer measured in 18 test holesranged from 39 to 170 feet (12 to 52 m) ; mean thickness was about 100 feet (30m) .
Sediment-size classifications of six core samples show the aquifer material sconsist predominantly of sand, but include 5 to 30 percent silt and 5 to 1 4percent clay . Size analyses of material from the core samples show that themedian particle diameter ranges from 0.08 to 0.15 mm, and the uniformitycoefficient ranges from 9 .9 to 150 . The high values for the uniformity coefficien tindicate that the sandstone is poorly sorted .
Laboratory tests on the core samples indicated that vertical hydraulic con-ductivities ranged from 11 .8x10 -5 ft/d (3 .6x10-5 m/d) to 108 ft/d (33 m/d) and hada mean of 1 .9 ft/d (5 .7x10-1 m/d) . Total porosity ranged from 39 .3 to 53 . 2percent and had a mean of 44 .3 percent .
Slug tests were made on 15 observation wells . Transmissivities calculate dfrom the slug tests ranged from 18 to 135 ft2/d (1 .7 to 12 .5 m 2/d) and had a meanof 56 ft2 /d (5.2 m2 /d) .
Potential yields of wells penetrating the aquifer range from 5 to 100 gal/mi n(0 .3 to 6 .3 L/s) .
Water-level fluctuations shown in figure 6 reflect seasonal variations ofwater in storage and regional water-level trends in different parts of the FoxHills aquifer . The seasonal variations are very small and are representative o fconditions when withdrawal from the aquifer by wells is negligible . Figure 7shows water-level fluctuations in well 134-082-36DCD, stage changes in theCannonball River, and precipitation in an area where ground-water discharge i soccurring. Water levels in this area fluctuate with stage changes in the rive rrather than with local precipitation. The hydrographs indicate an areal declin eof water in storage — probably resulting from the decrease in precipitatio nduring 1973-74 .
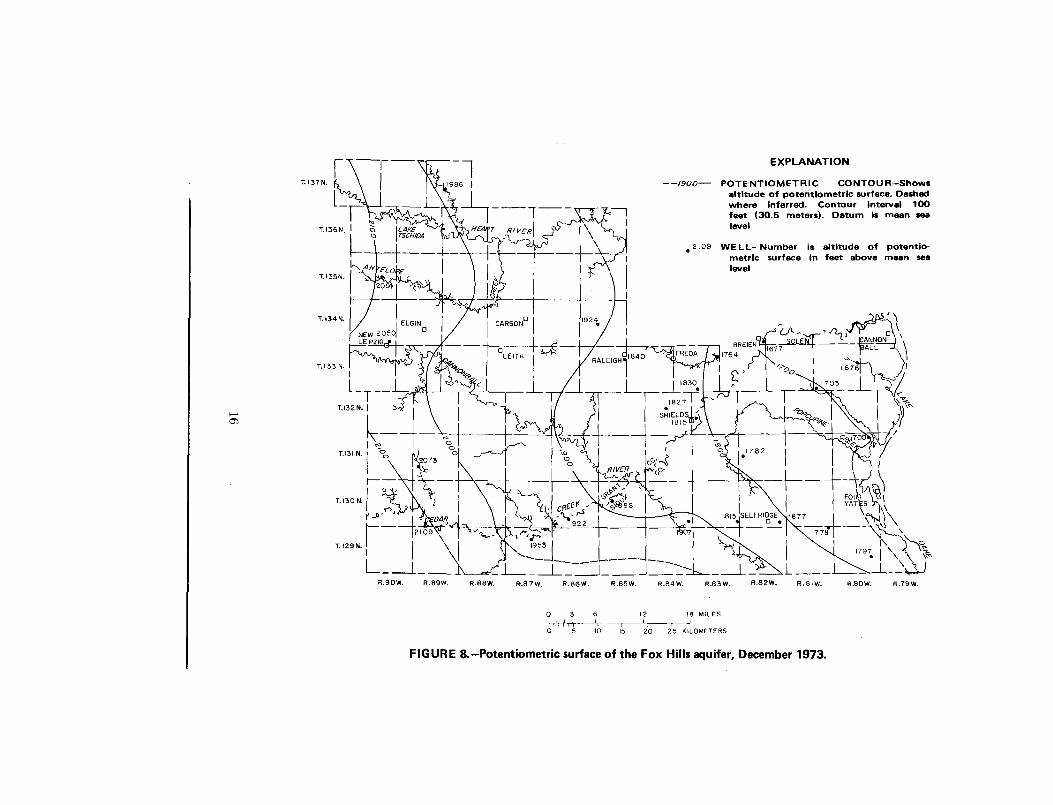
The potentiometric surface of the Fox Hills aquifer in December 1973 i sshown in figure 8 . Ground water in the aquifer generally moves easterly t o
12

100
2
3
4 5 6 7 8 9 1000
2
3
4 5
30 -
28- CI-S4 -
26 C2-S4 _
24 - C3-S4 -•
22 - C4-S4
_
20-CI-S3
0 e -820
1 8a C2-S 3z0
6-O O
_a00
4 _
2
CI-S 2
-
C3-S3
p0
\C 2-S2 C4-S 310 -
C3-S 2
6- C4-S2
-
I 8 -4-CI-SI
C 2-S I
A A-
2 -
C3-SI
C4-SI
-
DC
I 1100
250
750
225 0C~\ CONDUCTIVITY-MICROMH OS/CM (ECX10 6) AT 25° C
I 2 3 4
LOW MEDIUM HIGH VERY HIGH
SALINITY HAZARD
EXPLANATION
OIAORA T VS AF SALINIT YtABORATORV STgic 119•.JI
GROUND WATE R
O TONGUE RIVER AQUIFER
C SHIELDS AQUIFE R
o CANNONBALL-LUDLOW AQUIFER
0 ELM CREEK AQUIFE R
HELL CREEK AQUIFERS ( >C4-S4)
ST . JAMES AQUIFE R
FOX HILLS AQUIFER ( >C4-S4)
G BEAVER CREEK AQUIFE R
SURFACE WATE R
0 CEDAR CREEK (NEAR PRETTY ROCK )
A CANNONBALL RIVER (AT BREIEN )
L HEART RIVER (NEAR LARK )
FIGURE 5, .—Classifications of selected water samples for irrigation purposes.
1 3

55
IIIIIIIIIII
IIIIIIIIIII
1111111111 1
1 30-089-32D D ALAND SURFACE ALTITUD E
2,165 FEE TSCREENED 525-543 FEET
133-085-12AA DLAND SURFACE ALTITUD E
2,020 FEE TSCREENED 510-522 FEET
—'--.
137-088-2 1LAND SURFAC E
2,110 FEETSCREENED 905-92 3
D D CALTITUDE
FEET
~ r \1
`
1
\. ~
J
DJ DJ D
1972 1973 1974
FIGURE 6.-Water-level fluctuations in the Fox Hills aquifer.
northeasterly under a hydraulic gradient ranging from 7 to 12 ft/mi (1 .3 to 2 . 3
m/km) . Local deviations to the general gradient due to a synclinal structure (pl .4) occur in the central part of the area. Water is discharged where the aquife rcrops out (fig . 3) along the Cannonball River and Lake Oahe in eastern Siou xCounty . In much of the study area the head in the Fox Hills aquifer is 50 to 10 0feet (15 to 30 m) lower than the head in the overlying Hell Creek aquifers —indicating that the Hell Creek aquifers probably contribute some recharge t othe Fox Hills aquifer .
Thirty-two water samples were collected for chemical analysis from 28 well sdeveloped in the Fox Hills aquifer . Examination of the analyses indicates tha tthe water generally is soft and is a sodium bicarbonate type . Dissolved-solid s
14
w 56U4wCCD
Z 5 7Q 17 9J
0Jwco_ 18 0
wwLLZ
Jw 18 1
w 122
CCw
Q
12 3
12 4
125
17 .00
0J54.75 w
m
38 .0
v)

1 1
1 0
9
IF
I
I
I
I
I
I
I
I
1
I
I
I
I
I
I
I
I
I
I
I
CANNONBALL RIVERAT 134-082-36CA D
DATUM AT GAGE 1,676.5 FEE TABOVE MEAN SEA LEVE L
8
11111
I
I
3
2
1
- 3
- 2
1111111111 1
JW
033
365
0
4
3
2
134-082-36DC DLAND SURFACE ALTITUD E
1,711 FEE TSCREENED 145-157 FEET
–L._
- U
-
~J- - - -
J DJ DJ I
D
1971 1972 1973 1974
- 10. 5
- 1 1- 12 5
- 100 Z ¢O w
0
0
WV) Z Www 4 UJ F J 4
W LL
w2O I4- w3 0°
J
FIGURE 7.-Water-level fluctuations in the Fox Hills aquifer, stage changes in th eCannonball River, and precipitation at Breien, Sioux County .
15
R .90W .
R .89W .
R .88W.
R.87W,
R.86W .
R .85W .
R .84W.
R.83W.
R .82W.
R .81W.
R .80 W .
R .79 W.
0
3
6
12
IS MILE S16?, S0
5
10
15
20
25 KILOMETER S
FIGURE 8 .-Potentiometric surface of the Fox Hills aquifer, December 1973 .
EXPLANATION
--/900— POTENTIOMETRIC CONTOUR—Showsaltitude of potentlometric surface . Dashedwhere inferred . Contour interval 100feet (30.5 meters). Datum is mean sealeve l
.2109 WELL- Number is altitude of potentio-metric surface in feet above mean se alevel
2073
OFI ,l1_.t~~~.Kt 1922T21
`i
/"•1T,129N.
I
\ I
k\
1953 I

concentrations in the samples ranged from 296 to 2,020 mg/L and had a mean of1,300 mg/L . Dissolved sodium ranged from 65 mg/L in the eastern outcrop are ato 690 mg/L in northwestern Grant County where the aquifer is about 900 fee t(270 rn) below land surface . The sodium-adsorption ratio ranged from 1 .7 to 87 ;the lower ratios were in the eastern part of the area and the higher ratios wer ein the northwestern part . Dissolved sulfate ranged from 1 .6 in samples from thenorthwestern part of the area to 670 in samples from the eastern outcrop area .Sulfate concentrations exceeded the suggested limit (250 mg/L) in 11 of the 32samples . Dissolved sodium and chloride concentrations increased and dis-solved sulfate concentration decreased with increased depth below land surfac e— suggesting that sulfate sorption and chloride desorption are occurring, o rthat sulfate-reducing bacteria may be present in the aquifer or in the overlyin gsediments . There also is a possibility that some upward leakage is occurringalong the flanks of the synclinal structure (pl . 4), as there are higher-than-average concentrations of chloride in ground water sampled along the sides ofthis structure .
Four water samples from the Fox Hills aquifer were analyzed for mino relements . The most abundant constituents found in all samples were strontium ,which ranged from 0.09 to 0.17 mg/L; lithium ; zinc; molybdenum ; selenium ;copper ; and lead .
The water is suitable for livestock, most domestic, and some industrial uses .The salinity and sodium hazards for all the water except that near the outcro pare high to very high for irrigation .
Hell Creek aquifers
The Hell Creek Formation crops out in eastern Grant County and Centra lSioux County (fig . 3) . Beds of sandstone form aquifers in the upper, middle ,and, in some places, the lower part of the formation . Only the upper sandston ebeds appear to be continuous and areally extensive . The middle and lowe rsandstone beds vary considerably in stratigraphic position and thickness and ar ediscontinuous in many places .
The Hell Creek aquifers (pls . 2-4) underlie all of Grant County and th ewestern part of Sioux County . Measured thicknesses of the aquifers in 13 tes tholes are as follow: (1) the lower aquifer ranged from 10 to 55 feet (3 to 17 m )and had a mean of 23 feet (7 m); (2) the middle aquifer ranged from 6 to 60 feet(2 to 18 m) and had a mean of 34 feet (10 m); and (3) the upper aquifer range dfrom 15 to 159 feet (4 .6 to 48 .5 m) and had a mean of 70 feet (21 m) .
Sediment-size classifications of 12 core samples show that the aquifer mate -rials consist of fine-grained sand, but include 9 to 43 percent silt and 5 to 23percent clay. Size analyses of material from these samples show that the media nparticle diameter ranges from 0.03 to 0.20 mm, and the uniformity coefficien tranges from 14 to 380 .
Laboratory tests on the core samples indicated that vertical hydraulic con-ductivities ranged from 28x10-6 ft/d (8 .5x10-6 m/d) to 15x10-2 ft/d (4 .6x10-2 m/d)and had a mean of 18x10-3 ft/d (5 .5x10-3 mid) . Total porosity ranged from 28 . 1to 47 .0 percent and had a mean of 37 .3 percent .
17

Slug tests were made on 11 observation wells developed in the Hell Creekaquifers . Transmissivities calculated from the slug tests ranged from 15 to 7 9ft2/d (1 .4 to 7 .3 m 2/d) and had a mean of 34 ft2 /d (3 .2 m2/d) .
Potential yields to wells penetrating aquifers in the Hell Creek Formatio nrange from 1 to 5 gal/min (0 .06 to 0.3 Us) for each 10 feet (3 m) of aquiferthickness .
The water levels plotted in figure 9 reflect seasonal variations in storage inthe middle Hell Creek aquifer . They generally show seasonal fluctuations re-gardless of their depth below land surface . Where the lower Hell Creek aquiferis separated from the underlying Fox Hills aquifer by a confining bed of shale o rsiltstone generally less than 20 feet (6 m) thick, the water levels are only abou t10 feet (3 m) higher than those in the Fox Hills aquifer .
The potentiometric surface of the upper Hell Creek aquifer in Decembe r1973, is shown in figure 10 . The regional direction of water movement is towardthe northeast . However, in the outcrop area the potentiometric surface gener-ally is a subdued reflection of the topographic surface . The hydraulic gradient inthe discharge area is about 20 ft/mi (4 m/km); the regional gradient is muchmore gradual at about 5 to 10 ft/mi (0 .9 to 2 m/km) .
Thirty-six water samples were collected for chemical analysis from 29 wellsdeveloped in the Hell Creek aquifers . Examination of the analyses indicate sthat the water generally is soft and is a sodium bicarbonate type . Dissolved -solids concentrations in the samples ranged from 483 to 3,320 mg/L and had amean of 1,280 mg/L. Dissolved sodium ranged from 170 to 900 mg/L. Thesodium-adsorption ratio ranged from 6 .5 in the outcrop area to 91 in northwest -ern Grant County. Dissolved sulfate ranged from 1 .2 mg/L in north-centralGrant County to 1,900 mg/L near the Cannonball River . Samples from th ewestern and northwestern parts of the area contained less dissolved sulfate an dmore dissolved chloride than the samples from the outcrop area — suggestingthat possibly sulfate sorption and chloride desorption are occurring, or tha tsulfate-reducing bacteria are present in the aquifer or in the overlying sedi-ments .
Six water samples from the Hell Creek aquifers were analyzed for minorelements . The most abundant dissolved constituent found in all samples wa sstrontium, which ranged from 0 .10 to 0.12 mg/L. These samples containe dlarger concentrations of barium, copper, molybdenum, and zinc, and a lesse rconcentration of lithium than did samples from the underlying Fox Hill saquifer .
Water from the Hell Creek aquifers is suitable for livestock, most domestic ,municipal, and some industrial uses . Although some water from the Hell Cree kaquifers has salinity and sodium hazards low enough to permit its use fo rirrigation, the residual sodium carbonate is too high for most irrigation use .
18

262 I
I
I
1
111111111111111 1
1 3 7-089-09ABA 1LAND SURFACE ALTITUD E
2,305 FEE TSCREENED 1,008-1,026 FEET
w 263w Vw QLL LLZ- D
J yW0264
W4 1 0J JC CW O
F JQm 1 1
12
_1 , -
A LAND SURFAC E
\
2,01 0SCREENED
132-087-27AD AALTITUD E
FEE T168-180 FEET
_
O DJ DJ D
72 1973 1974
3
80
y¢ w
80 .25 H QW LL
2 CC
O~Z>W J
3.25 w_I
Q m3
FIGURE 9 .-Water-level fluctuations in the middle Hell Creek aquife rin Grant County.
Ground Water in Rocks of Tertiary Age
Cannonball and Ludlow aquifer, undifferentiate d
The Cannonball and Ludlow Formations, undifferentiated, crop out in east -ern and southern Grant County and in southwestern and central Sioux Count y(fig. 3), but in northwestern Grant County are as much as 445 feet (136 m )below land surface . Beds of sandstone occur in as many as three intervals withinthe Cannonball and Ludlow Formations . The sandstone beds are discontinuousand occur in both the Cannonball and Ludlow deposits . These sandstone bedsoften contain fossiliferous or limonitic concretion zones; the concretions areeither round or lenticular, ranging from a few inches to several feet in th elongest dimension . In the outcrop areas the sandstone beds form weathered ,resistant benches topped with sandy soils . These benches have an undulatingsurface . Where buried, (in most of Grant County and in parts of Sioux County )the sandstone beds generally are saturated and form a major aquifer .
Measured thicknesses of the Cannonball and Ludlow aquifer in eight tes tholes ranged from 9 to 88 feet (3 to 27 m) ; mean thickness was 35 feet (11 m) .
Sediment-size classifications of five core samples from the Cannonball an dLudlow aquifer show aquifer materials consist of fine-grained sand, but includ e7 to 26 percent silt and 1 to 30 percent clay. Size analyses of material from thesesamples show that the median particle diameter ranges from 0.06 to 0 .16 mm ,and the uniformity coefficient ranges from 5.6 to 80 .
1 9

EXPLANATION
--/900— POTENTIOMETRIC CONTOUR--Showsaltitude of potentlometric surface. Dashedwhere inferred . Contour interval 100feet (30.5 meters) . Datum is mean sealeve l
1912 . 1915 WELL—Number is altitude of potentio-metric surface in feet above mean sealeve l
ELGI N
19 89
FRED A
1999 SHIELD
/900
RIVER
10ED4R
T.129 N .I
220o ]\
1\
i-- 1 \- 1=== f~--
R.87W,
R .86W .
R .85W .
207 1
0
3
6
0
5
12
18 MILE S
15
20
25 KILOMETER S
FIGURE 10.-Potentiometric surface of the upper Hell Creek aquifer, 1973 .

Laboratory tests of four core samples from the Cannonball and Ludlowaquifer indicated that the vertical hydraulic conductivity ranged from 3 .6x10-5
ft/d (1 .1x10-5 m/d) to 25x10- 2 ft/d (7 .7x10-2 m/d) and had a mean of 15x10-2 ft/d(4 .6x10`2 mid) . Total porosity ranged from 30 .3 to 42 .8 percent .
Flow or slug tests were made on three observation wells developed in thi saquifer . The transmissivities calculated from these tests ranged from 16 to 290ft2/d (1 .5 to 26 .9 m2/d) and had a mean of 111 ft2/d (10.3 m2/d) .
Potential yields to wells penetrating the Cannonball and Ludlow aquifer ar eestimated to be from 5 to 150 gal/min (0 .3 to 9 .5 Us) .
Water levels plotted in figure 11 reflect seasonal variations and trends o fwater in storage in two intervals of the Cannonball and Ludlow aquifer . Theseand other measured water levels indicate that seasonal fluctuations in well spenetrating the Cannonball and Ludlow aquifer generally are less than 2 fee t(0 .6 m) .
The potentiometric surface of the major parts of the Cannonball and Ludlo waquifer in December 1973 is shown in figure 12 . Contours indicate thatground-water movement generally is toward the east from recharge areas in th ewest . Ground water is discharged in the Cedar Creek and Cannonball Rive rvalleys . The regional hydraulic gradient through Grant County generally is 5 t o10 ft/mi (0 .9 to 2 m/km) . In the ground-water discharge areas, however, thehydraulic gradient increases to about 15 to 20 ft/mi (2 .8 to 4 m/km) .
Wells developed in the Cannonball and Ludlow aquifer in the Cedar Cree kand iin the Heart River valleys flow . Observation well 137-090-30AAC, in theHeart River valley, had an initial flow of 100 gal/min (6 .3 Us) from the Cannon-ball and Ludlow aquifer . When the well was shut in, pressure readings showe dthe head to be 71 feet (22 m) above land surface .
Twenty-six water samples were collected for chemical analysis from 20 well sand one spring developed in the Cannonball and Ludlow aquifer . Analyse sshow that water in the recharge areas is very hard and is a calcium bicarbonat etype, but in other areas the water ranges from soft to very hard and is either a
1111111111111111111 1132-064-06000
LAND SURFACE ALTITUD E2,049 FEE T
SCREENED 164-170 FEE T
132-064-06000 ~ ALAND SURFACE ALTITUD E
2,049 FEE TSCREENED 164-170 FEET \\
-
-
^`i
\
1-`/ '
ND J
DJ DJ D
71 1972 1973 1974
FIGURE 11t—Water-level fluctuations in the Cannonball and Ludlow aquifer, Grant County .
2 1
I- ww ow QLL LL
Z CC– D.1 yw
w QJ J
w D1- JQ m
20 1
86
8 7
88
198
199
200
iiiiiiiiiii26 .3 w
~ w26 .5 w O
aw26 .7 2rc
Z y
60.5 w Z
w J
61 .0 W,
J 3
0
~- w
3 m

R .90W .
R .89W.
R .88 W.
R.87W.
R .86W .
R .85W .
R .84W.
R.83W.
R.82W.
R .81W.
R .80W.
R .79W .
0
3
6
12
18 MILE S
0
5
10
I5
20
25 KILOMETER S
FIGURE 12.-Potentiometric surface of the Cannonball and Ludlow aquifer, 1973.
EXPLANATIO N
--2/00— POTENTIOMETRIC CONTOUR—Showsaltitude of potentiometric surface. Dashe d
where inferred . Contour interval 10 0
feet (30 .5 meters) . Datum is mean sea
level
•2167 WELL—Number is altitude of potentio-metric surface in feet above mean sea
level
sodium bicarbonate or a sodium sulfate type . Sodium or calcium is the predom -inant cation, and bicarbonate or sulfate is the predominant anion . Dissolved -solids concentrations in the samples ranged from 412 to 2,840 mg/L and had amean of 1,440 mg/L. Dissolved sodium ranged from 42 to 810 mg/L and had amean of481 mg/L . The sodium-adsorption ratio ranged from 0 .8 in the outcroparea to 92 in the northwestern part of Grant County . Dissolved sulfate rangedfrom 0 to 1,300 mg/L and had a mean of 388 mg/L. Sulfate concentrations in 1 1samples and iron concentrations in nine samples exceeded the limits recom-mended for drinking water (table 2) .
Figure 13 shows a comparison between water quality in the Cannonbal lRiver at Breien and water quality in the aquifer that crops out in the streamvalley upstream from the Breien station . Water in the Cannonball River duringperiods of low to moderate flows is chemically very similar to water in th eCannonball and Ludlow aquifer .
Three water samples from the Cannonball and Ludlow aquifer wereanalyzed for minor elements . The most abundant dissolved constituents foun din all samples were zinc, which ranged from 0 .01 to 2 .00 mg/L, and strontium ,which ranged from 0.13 to 1 .10 mg/L. These samples contained larger concen -trations of zinc, strontium, nickel, lead, and cyanide, and a lower concentratio nof vanadium than did samples from the underlying Hell Creek aquifers .
In the recharge areas, water from the Cannonball and Ludlow aquifer issuitable for most domestic, livestock, and municipal use . In discharge areas ,and where the aquifers are buried, high sulfate and iron concentrations mak ethe water undesirable for most domestic and municipal uses . Some water fro mthe Cannonball and Ludlow aquifer has salinity and sodium hazards low enoug hto permit its use for irrigation, but most of the water contains too high a sodiu mconcentration for irrigation use .
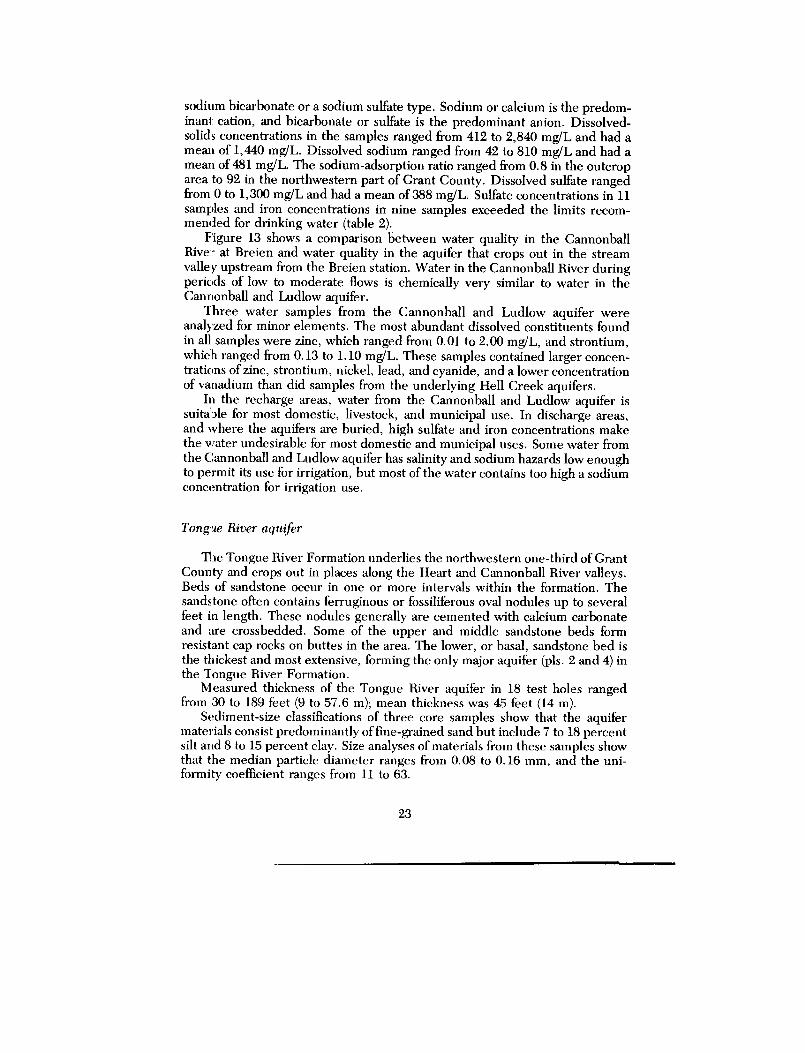
Tongue River aquife r
The Tongue River Formation underlies the northwestern one-third of Gran tCounty and crops out in places along the Heart and Cannonball River valleys .Beds of sandstone occur in one or more intervals within the formation . Thesandstone often contains ferruginous or fossiliferous oval nodules up to severa lfeet in length. These nodules generally are cemented with calcium carbonateand are crossbedded . Some of the upper and middle sandstone beds formresistant cap rocks on buttes in the area . The lower, or basal, sandstone bed i sthe thickest and most extensive, forming the only major aquifer (pls . 2 and 4) inthe Tongue River Formation .
Measured thickness of the Tongue River aquifer in 18 test holes rangedfrom 30 to 189 feet (9 to 57.6 m); mean thickness was 45 feet (14 m) .
Sediment-size classifications of three core samples show that the aquife rmaterials consist predominantly of fine-grained sand but include 7 to 18 percen tsilt arid 8 to 15 percent clay. Size analyses of materials from these samples showthat the median particle diameter ranges from 0 .08 to 0.16 mm, and the uni-formity coefficient ranges from 11 to 63 .
23

IliliiJANUARY 25, 1972 FEBRUARY 23, 1972 MARCH 21, 1972 APRIL 21, 1972 MAY 23, 197 2
17 ft 3/s 24 ft 3 /s 1,922 ft 3 /s 421 ft 3/s 625 ft3/s
Ca
H CO3 + CO 3
Na+K ' V I I 11111 I CICANNONBALL-LUDLO W
AQUIFERHELL CREEK
AQUIFERSHIELD SAQUIFER
12 8
4
0
4
8 1 2Cations
Anion s(milliequivalents per liter)
FIGURE 13.-Selected analyses of water from the Cannonball River at Breien and fro mmajor aquifers underlying the river upstream from the Breien station .

Laboratory tests of the core samples indicated that the vertical hydraulicconductivity ranged from 23x10-6 ft/d (7 .1x10-6 m/d) to 19x10-2 ft/d (5 .7x10- 2m/d) . Total porosity for the samples ranged from 29.0 to 41 .6 percent andaveraged 35 .8 percent .
Slug tests were made on two observation wells developed in the Tongu eRiver aquifer . Transmissivities calculated from these tests were 21 and 24 ft2/d(2 .0 and 2.2 m2/d) .
Potential yields to wells penetrating the Tongue River aquifer are estimate dto be from 5 to 100 gal/min (0 .3 to 6 .3 Us) .
Water levels plotted in figure 14 reflect seasonal variations of water i nstorage in the basal Tongue River aquifer . The fluctuations in well 132-090-14AA]B2, which is in a ground-water discharge area, indicate a decrease i nstorage in the aquifer during the period of record . Fluctuations in wells 137 -089-09ABA2 and 135-089-22CDD, which are in an area where the aquifer lie sbetween 189 and 366 feet (58 and 112 m) below land surface, reflect regionalwater-level trends in the aquifer .
232 I
I
I
I
I
I
f
I
I 111111111 - 70.7 5
137p0-0EMA2 '-,,_ -LAND SURFACE ALTITUDE
2.305 FEET
w 233SCREENEDED,38D366 FEET 71
w92 28
LL<CC
Cn
CC
28 .25 0OZ
493 J4J 135-0S9-22CD0 33 LAND SURFACE ALTITUD E
2.250 FEET 28 .500J
SCREENED 180201 FEET ww m
m 94 U,
12 ww I-u. w
z 132-000IUAA0 2
w
LAND SURFACE ALTITUDE;340 FEE T
SCREENED 84-90 FEET
z
J
13 w
w 4
>
RwI-
``\ O1v L\
w
Q
I-4
3 14 43
.s'N4 .5
15J
0 J
0
1973
1974
FIGURE 14.-Water-level fluctuations in the Tongue River aquifer, Grant County .
25

The potentiometric surface of the Tongue River aquifer during December1973 is shown in figure 15 . Contours indicate that ground-water movement i sgenerally east to northeast, and that the hydraulic gradient is about 11 ft/mi (2 . 1mlkm) . Local deviations indicate ground-water movement from topographichighs toward stream valleys .
Eleven water samples were collected for chemical analysis from 10 well sand one spring developed in the Tongue River aquifer . Water in seven of th esamples was very hard and had the highest noncarbonate hardness in the area .Water in the other four samples was soft and had no noncarbonate hardness .The very hard water ranged from calcium bicarbonate or calcium sulfate type tosodium bicarbonate or sodium sulfate type . The soft water was all sodiumbicarbonate or sodium sulfate type . Sodium and calcium were the predominan tcations, and bicarbonate and sulfate were the predominant anions in wate rsamples from the Tongue River aquifer in Grant County . Dissolved-solids con-centrations in the 11 samples ranged from 368 to 1,720 mg/L and had a mean of1,040 mg/L . The dissolved sodium ranged from 12 to 600 mg/L, and thesodium-adsorption ratio ranged from 0.3 to 52 . Dissolved sulfate ranged fro m61 to 880 mg/L and exceeded 250 mg/L in six of the 11 samples . Dissolved iro nranged from 0 to 3 .1 mg/L and exceeded 0 .3 mg/L in eight of the 11 samples .
Water from the Tongue River aquifer is suitable for most livestock use andfor some industrial uses ; however, the high sulfate and iron concentrations inmany areas make it undesirable for domestic and municipal use . Althoughwater from some parts of the Tongue River aquifer has salinity and sodiumhazards low enough to permit its use for irrigation, water from other parts of theaquifer is classified hazardous for irrigation (Randich, 1975, table 4) .
Sentinel Butte aquifers
The Sentinel Butte Formation occurs in a small part of northwestern GrantCounty (fig. 3) . Resistant sandstone beds in the formation form a cap rock onbuttes in this area. Logs of two test holes penetrating the formation show four tofive sections of sandstone and lignite ranging from 2 to 10 feet (0 .6 to 3.0 m) inthickness that may be potential aquifers . The basal section, which consists ofpoorly sorted very fine to fine-grained sandstone, appears to be the most exten -sive .
Potential yields to wells penetrating Sentinel Butte aquifers in GrantCounty probably would be less than 20 gal/min (1 .3 L/s) .
Ground Water in Glacial Deposits of Pleistocene Age
Aquifers with the greatest potential for ground-water development in th eglacial deposits (Coleharbor Formation) are those associated with buried valley sin parts of northeastern and eastern Grant County and in central and easter nSioux County . For convenience of discussion, identification, and future ref-erence, aquifer names are continued from adjacent areas — Elm Creek aquife r
26

R.90W.
R .89W .
R .88W.
R .87W.
R .86W .
R .85W.
R .84W.
R.83W.
R.82W .
R .81W.
R.80W.
R .79W .
0
3
6
12
18 MILE S1511
ti ' I
i
0
5
10
15
20
25 KILOMETER S
FIGURE 15 .-Potentiometric surface of the Tongue River aquifer, December 1973 .
EXPLANATIO N
--2/00— POTENTIOMETRIC CONTOUR—Showsaltitude of potentiometric surface . Dashedwhere inferred . Contour interval 100feet (30.5 meters). Datum is mean sealeve l
. 2073 WELL—Number is altitude of potentio-metric surface in feet above mean sealeve l
APPROXIMATE EASTERN BOUNDAR YOF TONGUE RIVER AQUIFER
i

4
(pl . 1) . Newly recognized aquifers are named after local geographic features ,such as streams or cities — Battle Creek, Beaver Creek, Shields, and St . Jamesaquifers (pl . 1) .
Where sufficient geohydrologic data are available, an estimate of groundwater available from storage is given . Estimates are in acre-feet, and are prod-ucts of areal extent, saturated thickness, and specific yield. These estimates arebased on static conditions and do not take into account recharge, natural dis-charge, or ground-water movement. The quantitative evaluation of these fac-tors is beyond the scope of this study .
The potential yields to properly constructed wells from these aquifers ar eshown on the ground-water availability map (pl . 1) . The yield values are basedon transmissivities calculated according to methods described by Keech (1964 )and Meyer (1963, p . 339) . The aquifers are lenticular in cross section, thus, thelargest well yields are obtainable only by developing the thickest parts, and b yscreening the entire section .
The ground-water availability map should be used with the understandingthat the estimated yields are for fully penetrating, properly screened and de-veloped wells . The map is intended as a guide in the location of ground-waterresources, and not as a map to locate specific production wells . Few if anyaquifers are so uniform in areal extent and physical properties that productio nwells could be constructed in them without additional test drilling .
Although a large quantity of water is available for potential irrigation devel -opment in places, the quality of the water generally is undesirable . Shouldirrigation supplies be developed, it is essential that irrigation practices beacceptable to soil and crop types in the area .
Shields aquifer
The Shields aquifer occupies a buried bedrock valley in Grant and SiouxCounties . The aquifer extends from south-central Morton County southwardtoward Shields, then east beneath the present Cannonball River to Porcupin eCreek . It underlies Porcupine Creek until the creek reaches Lake Oahe nort hof Fort Yates. The aquifer probably extends southward and underlies LakeOahe to the South Dakota border (pl . 1) . The Shields aquifer has an areal exten tof about 30 mi l (80 km 2) in Grant and Sioux Counties .
Data from 48 test holes show that the aquifer generally consists of severalsand and gavel beds (pl . 5, secs . D-D', E-E ' , and F-F' , in pocket) that range i nthickness from 5 to 139 feet (1 .5 to 42 .4 m) . The mean aquifer thickness is abou t90 feet (27 m) . Test-hole data indicate that the coarsest, most permeable mate-rial generally is found along the central axis of the buried valley and at th evalley bottom (pl . 5, secs. E-E' and F-F' ) . The most productive areas in th eShields aquifer are near Shields and near Fort Yates (pl . 1) .
Water levels in the Shields aquifer range from about 5 to 95 feet (2 to 29 m )below land surface . The largest fluctuations occur near Fort Yates (fig . 16) ,where the aquifer is very responsive to stage changes in Lake Oahe . Thefluctuations become very small beyond a 2-mile (3-km) distance from the lake .
28

43
DJ DJ D J1971 1972 1973 1974
FIGURE 16.-Water-level fluctuations in the Shields aquifer, stage changes in LakeOahe, and precipitation at Fort Yates, Sioux County .
29
1111111111 111111111111 I
I
I
I
I
I
I
I
I
I
I
I
I
I
I
I
I
I
I
130-080-23DD D(NEAR FT. YATES )
LAND SURFACE ALTITUD E1,640 FEE T
1LAKE OAH E
SOUTH
I1
AT PIERRE ,DAKOT A
161 7
161 5
161 3
• 161 1
1609
• 160 7
160 5
• 160 3
160 1
• 161 9
161 7
161 5
161 3
161 1
1609
1607
1605
6
- 490
489150
Jw>
491 J4wco
490 z4w
4890mQ
488 mwI-w
493Z
Jw
-
492 >wJ
493
CC491 H
492
5
1 - 25
0 - 0
100
7 5
- 50

Water levels generally fluctuate less than 1 foot (0 .3 m) annually in other part sof the aquifer (fig . 17) . The small fluctuations reflect gradual changes in storage— controlled largely by precipitation and by the hydraulically connected adja-cent and underlying bedrock aquifers .
Recharge is derived from underlying bedrock aquifers and from infiltratio nof precipitation through sediments in the stream valleys overlying the aquifer .
The potentiometric surface in the Shields aquifer ranges from 1,860 fee t(567 m) above mean sea level near Shields to about 1,604 feet (489 m) near FortYates . The average hydraulic gradient is about 50 ft/mi (9 m/km) southeasttoward Lake Oahe, which is a ground-water discharge area. Low-flow meas-urements made on the Cannonball River upstream, on, and downstream fromthe aquifer show a relatively small gain in streamflow, and a small but progres-sive decrease in most dissolved minerals in the water at and downstream fro mthe aquifer — indicating that some ground water from the Shields aquiferprobably is contributing to flows in this reach of the Cannonball River . How -ever, should water levels in the area be lowered by pumping, recharge wouldbe induced from the Cannonball River .
Based on an areal extent of30 mi2 (80 km2), a mean thickness of 90 feet (27m), and an estimated specific yield of 15 percent, about 260,000 acre-feet (320
hm 3) of water is available to wells from ground-water storage in the Shield saquifer .
Analyses of 23 water samples from the Shields aquifer indicate that thewater generally is very hard and is predominantly a sodium bicarbonate type .Dissolved-solids concentrations in the samples ranged from 413 to 1,600 mg/Land had a mean of 980 mg/L. Dissolved sulfate ranged from 15 to 680 mg/L, andiron from 0 to 15 mg/L. The sodium-adsorption ratio ranged from 0.8 to 34 andhad a mean of 10 . The irrigation classification of the water ranged from C2-S1 toC3-S4 (fig . 5) — indicating the water is suitable to marginal for irrigation .
At present (1974), several domestic and stock wells are developed in theaquifer . Pumpage from these wells has produced no noticeable fluctuation o fwater levels in the aquifer . Depending on the local aquifer thickness, hydrauli cconductivity of the material penetrated, and proximity to other wells, properl yconstructed wells in the Shields aquifer should yield from 50 to 1,000 gal/mi n(3 .2 to 63 Lis) .
Elm Creek aquife r
The Elm Creek aquifer occupies a buried bedrock valley in northeasternGrant County, extending from and returning to Morton County . The aquife runderlies the Big Muddy Creek and Heart River valleys (pl . 1) and is hydrau-lically connected with the surface streams. The Elm Creek aquifer has an arealextent of about 7 mi 2 (20 km 2 ) in Grant County .
Data from three test holes show that the aquifer generally consists of severa lsand and gravel beds interbedded with clay (pl . 5, sec . H-H ' ) . The aquife rranges in thickness from 67 to 167 feet (20 to 50.9 m) and has a mean thicknes sof about 100 feet (30 m). Test-hole data indicate that the coarsest and mostproductive material is located along the central axis and at the bottom of th eburied valley (pl . 5) .
30

11111111111
WUQU.
4.75 D--- .---~
U)
1111111111 1
6
w-) 2 6CCwQ 2 73 8
132-OS2./OCECCC
(NEAR PORCUPINE CREEK,
D• 16 -- LANDBISU
R
OUK COTY )ITUDE
1,741 UNFEETT
O
Q 1 7
' I 1 530Ij 1 6coI-
w1 7
LL 24Z
W 25
w4•
1511111111111
IIIIIIIIII IU.
0
2
7
DJ DJ OJ D
1971 1972 1973 1974
132-003.29000(NEAR SMIE LDS, SIOUX COUNTY )
LAND SURFACE ALTITUD E/ FA FEET
_
133-053'07CCB 1(NEAR FREDA, GRANT COUNTY )
LAND SURFACE ALTITUD E1,E86 FEET
7 5
5 0
1
- 25
0
5 0ZJ
34 .75
Wco
5 wWI-W
7 .5 Z
JW
8 wCCw
200 Q3
17 5
150
125
100
FIGURE 17.- Water-level fluctuations in the Shields aquifer andprecipitation at Shields .
31

Water levels in the Elm Creek aquifer range from about 13 to 22 feet (4 to
6.7 m) below land surface . The hydraulic gradient is about 7 ft/mi (1 m/km)southeastward . Water levels in observation well 136-085-09BCD, gage heightof the Heart River near Lark, and precipitation at Carson are shown in figur e
18 . These indicate that a hydraulic connection exists between the river and theunderlying Elm Creek aquifer . The peak events in river stage and in ground -water level are the result of spring runoff . The other peaks, which represent aresponse to precipitation, generally are less pronounced . The base-flow reces-sion in the Heart River and the decline in ground-water levels indicate adecrease of ground-water storage due to discharge to the river during a perio dof declining precipitation and streamflow .
Recharge is derived from precipitation by infiltration through sediments i nthe stream valley that overlie the aquifer . This recharge is favorable for sustain -ing large-yield development in the aquifer .
Low-flow measurements were made in October 1973, on the Heart River ,at sites upstream from, on, and downstream (Morton County) from the El mCreek aquifer . These measurements show an increase of 12 ft 3/s (0 .34 m3/s) ,more than 50 percent of the total flow, at the lower end of this reach of th eHeart River, indicating major gains to the stream where it flows across theunderlying Elm Creek aquifer . Water samples were collected from the Hear tRiver for chemical analyses at the same time and place that low-flow meas-urements were made . These analyses indicate the concentrations of dissolve dsodium and chloride increase, but concentrations of most other dissolved con-stituents decrease at successive downstream points . Dissolved solids in thesurface-water samples increased from 941 mg/L upstream from the aquifer t o988 mg/L downstream from the aquifer . The changes in the chemical quality o fwater in the Heart River, even though small, when compared to the chemica lquality of the water in the aquifer substantiate that a large part of the low-flo wdischarge in the downstream reach of the river is derived from ground-wate rdischarge by the Elm Creek aquifer .
Based on an areal extent of 7 mil (20 km 2), a mean thickness of 100 feet (30m), and an estimated specific yield of 15 percent, about 67,000 acre-feet (8 3hm 3) of water is available to wells from ground-water storage in the Gran tCounty part of the Elm Creek aquifer .
Analyses of three water samples from wells developed in the Elm Creekaquifer indicate that the water is very hard and is a sodium bicarbonate-sulfat etype . Dissolved-solids concentrations in the three samples were 819, 1,510 ,and 1,790 mg/L . The increase in dissolved solids is related directly to increasin gdepth below land surface in the aquifer . Dissolved sodium concentrations wer e180, 500, and 580 mg/L ; dissolved sulfate concentrations were 220, 510, an d630 mg/L; and iron concentrations were 2 .2, 5.7, and 5 .7 mg/L. Irrigationclassifications of the water ranged from C3-S1 to C4-S4 (fig . 5), indicating thewater is marginal to unsatisfactory for most irrigation use .
At present (1974), several domestic and stock wells are developed in th eaquifer . Pumpage from these wells has produced no noticeable water-levelfluctuations in the aquifer . Depending upon the local aquifer thickness an d
32

-1
1111111111 11111111111 III
II
II 11111111 1
1 36-085-09 B C C - 3(HEART RIVER NEAR LARK)
- 2. 5
2
1 . 5
- 1
v
- 0. 5
136-085-09BCD
_LAND SURFACE ALTITUDE 4
1,820 FEETSCREENED 172-178 FEET
_
- 4 . 5
r
I
'v\
A
- 5
5
r
DJ OJ DJ D1971 1972 1973 1974
1 1
1 0
9
w 28
w DU.}-
7- D
w=O 6I, Q
w O
wW > 5o
Q mQo 4
I- wW Uw <m u.z-J~W D> zW QJ J
ccw O~ JQ w
3m
1 4
1 5
1 6
1 78
7
6
2
0
N
m WU1— 4Wu-
2 mz_ mJOw Z> 4W JJ 3m Dw JH im3
200
17 5
150
5 0
2 5
FIGURE 18.-Water-level fluctuations in the Elm Creek aquifer, stage changes in th eHeart River, and precipitation at Carson, Grant County .
33

hydraulic conductivity of the material penetrated, properly constructed wells i nthe Elm Creek aquifer in Grant County could yield from 50 to 1,000 gal/mi n(3 .2 to 63 L/s ; pl . 1) .
St . James aquifer
The St . James aquifer occupies a narrow buried bedrock valley — an exten -sion of the Strasburg valley in Emmons County — in northeastern SiouxCounty . It extends from Emmons County northwest into Morton County . Theaquifer is named after St . James Church and Cemetery, which are located nea rthe aquifer in Sioux County . The aquifer is generally about 0 .5-mile (0 .8-km )wide and has an areal extent of about 3 mi 2 (8 km2) in Sioux County .
Data from eight test holes show that the aquifer generally consists of severa lalternating sand and gravel beds (pl . 5, sec . G- G') that range in thickness from 8to 105 feet (2 to 32 m) . The aquifer has a mean thickness of 28 feet (8 .5 m) .Test-hole data indicate that the coarsest and most productive aquifer material i slocated along the central axis and near the bottom of the buried valley (pl . 5) .
Water levels in the St . James aquifer range from about 30 to 77 feet (9 to 2 3m) below land surface . The shallowest water levels occur in localized shallo wparts of the aquifer, whereas the deepest water levels occur in the major part o fthe aquifer near the bottom of the buried valley . Water movement in theaquifer is downward and southeast toward Lake Oahe . Recharge is derive dfrom adjacent and underlying bedrock deposits and from infiltration of precipi -tation through surface sediments .
Based on an areal extent of 3 mi 2 (8 km 2), a mean thickness of 28 feet (8 . 5m), and an estimated specific yield of 15 percent, about 8,000 acre-feet (10 hm3)of water is available to wells from ground-water storage in the St . James aquiferin Sioux County .
Analysis of one water sample from the St . James aquifer indicates that thewater is moderately hard and is a sodium bicarbonate type. The dissolvedconstituents in this sample are similar to those in samples from the Fox Hill saquifer, indicating that some ground water is moving from the adjacent Fo xHills aquifer into and through the St . James aquifer . The irrigation classificatio nof the water sample was C3-S4 (fig . 5), indicating that the water generally i sunsatisfactory for most irrigation use .
At present (1974), several domestic and stock wells are developed in bot hthe shallow and deep parts of the aquifer . Pumpage by these wells has pro-duced no noticeable water-level fluctuations in the area . Depending upon th elocal aquifer thickness, hydraulic conductivity, and proximity to recharge ,properly constructed wells in the St . James aquifer in Sioux County could yiel dfrom 50 to 1,000 gal/min (3 .2 to 63 L/s ; pl . 1) .
Beaver Creek aquife r
The Beaver Creek aquifer occupies a narrow glacial-diversion stream chan-nel northwest of and underlying the main stem of Beaver Creek in northeaster nSioux County (pl . 1) . The aquifer materials were deposited in a channel that wa s
34
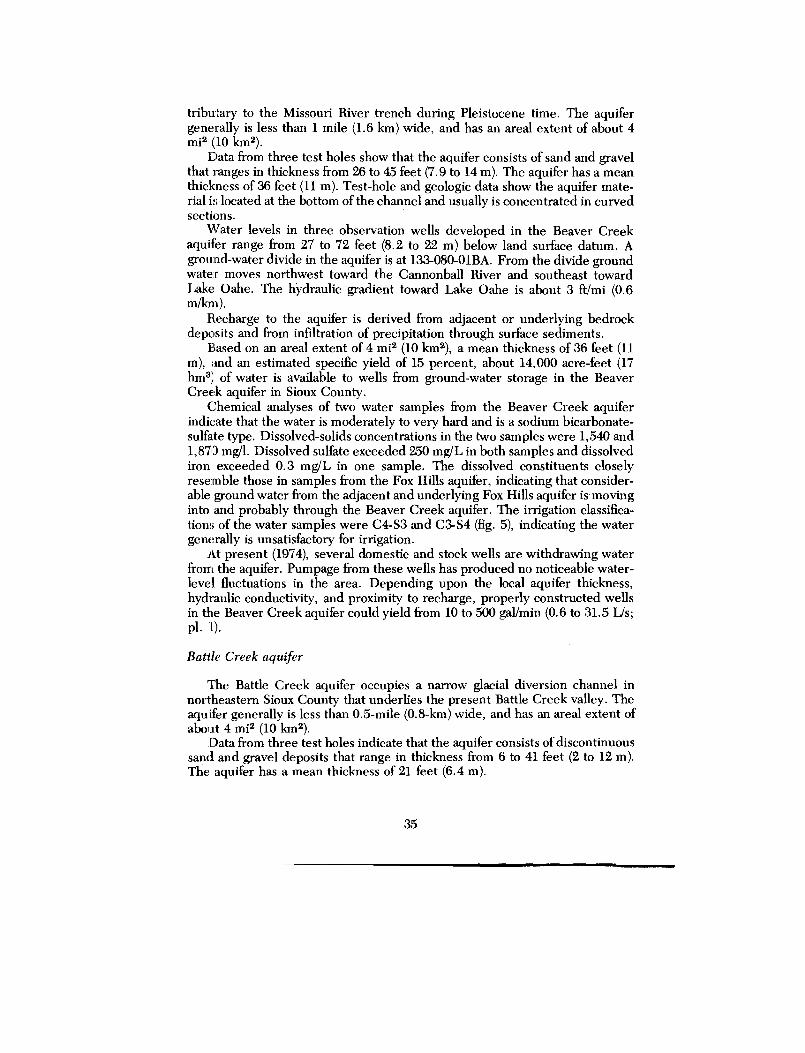
tributary to the Missouri River trench during Pleistocene time . The aquife rgenerally is less than 1 mile (1 .6 km) wide, and has an areal extent of about 4mi 2 (10 km 2) ,
Data from three test holes show that the aquifer consists of sand and grave lthat ranges in thickness from 26 to 45 feet (7 .9 to 14 m). The aquifer has a meanthickness of 36 feet (11 m) . Test-hole and geologic data show the aquifer mate -rial is located at the bottom of the channel and usually is concentrated in curvedsections .
Water levels in three observation wells developed in the Beaver Cree kaquifer range from 27 to 72 feet (8 .2 to 22 m) below land surface datum . Aground-water divide in the aquifer is at 133-080-01BA . From the divide groundwater moves northwest toward the Cannonball River and southeast towardLake Oahe. The hydraulic gradient toward Lake Oahe is about 3 ft/mi (0 . 6m/kni) .
Recharge to the aquifer is derived from adjacent or underlying bedrockdeposits and from infiltration of precipitation through surface sediments .
Based on an areal extent of 4 mi2 (10 km2), a mean thickness of 36 feet (1 1m), and an estimated specific yield of 15 percent, about 14,000 acre-feet (1 7hm3} of water is available to wells from ground-water storage in the Beave rCreek aquifer in Sioux County .
Chemical analyses of two water samples from the Beaver Creek aquife rindicate that the water is moderately to very hard and is a sodium bicarbonate -sulfate type . Dissolved-solids concentrations in the two samples were 1,540 an d1,871D mg/1 . Dissolved sulfate exceeded 250 mg/L in both samples and dissolve diron exceeded 0 .3 mg/L in one sample. The dissolved constituents closelyresemble those in samples from the Fox Hills aquifer, indicating that consider-able ground water from the adjacent and underlying Fox Hills aquifer is movin ginto and probably through the Beaver Creek aquifer . The irrigation classifica-tions of the water samples were C4-S3 and C3-S4 (fig . 5), indicating the watergenerally is unsatisfactory for irrigation .
At present (1974), several domestic and stock wells are withdrawing wate rfrom the aquifer . Pumpage from these wells has produced no noticeable water -level fluctuations in the area . Depending upon the local aquifer thickness ,hydraulic conductivity, and proximity to recharge, properly constructed well sin the Beaver Creek aquifer could yield from 10 to 500 gal/min (0 .6 to 31 .5 Lfs ;pl . 1) .
Battle Creek aquifer
The Battle Creek aquifer occupies a narrow glacial diversion channel innortheastern Sioux County that underlies the present Battle Creek valley . Theaquifer generally is less than 0 .5-mile (0 .8-km) wide, and has an areal extent ofabout 4 mil (10 km 2 ) .
Data from three test holes indicate that the aquifer consists of discontinuou ssand and gravel deposits that range in thickness from 6 to 41 feet (2 to 12 m) .The aquifer has a mean thickness of 21 feet (6 .4 m) .
35

Domestic and stock wells located in that part of the aquifer east of Stat eHighway 24 are reported to flow about 2 gal/min (0 .1 [is) . Ground-watermovement through the aquifer is southeastward toward IAke Oahe . Rechargeto the aquifer is derived from adjacent and underlying bedrock deposits andfrom infiltration of precipitation through surface sediments .
Based on an areal extent of 4 mi2 (10 km 2 ), a mean thickness of 21 feet (6 . 4m), and an estimated specific yield of 12 percent, about 6,000 acre-feet (7 hm 3 )of water is available to wells from ground-water storage in the Battle Cree kaquifer .
Properly constructed wells in the Battle Creek aquifer generally woul dyield less than 50 gal/min (3 .2 [is) .
Ground Water in Alluvial Deposits of Holocene Age
Alluvial deposits, mapped as the Walsh Formation (fig . 3), occur in most ofthe present stream and river valleys in Grant and Sioux Counties . They consistof clay, silt, sand, gravel, and often many combinations of these materials —clayey silt, silty sand, sandy gravel . The thicknesses of these deposits range dfrom 4 to 81 feet (1 to 25 m) in 60 test holes . Alluvial deposits containin gaquifers of potential importance occur in the Heart and Cannonball River val-leys and in Cedar Creek valley (pl . 1) . These aquifers obtain recharge waterfrom infiltration of precipitation through surface soils and from high streamflow ,which inundates the flood plains and saturates the underlying aquifers .
Heart River Valley aquifer
The Heart River Valley aquifer generally is less than 1 mile (1 .6 km) wideand has an areal extent of about 12 mi2 (31 km 2 ) in northern Grant County . Datafrom three test holes and data from private wells show that the aquifer consist spredominantly of sand . The thickness generally ranges from 10 to 20 feet (3 to 6m) with a mean of about 15 feet (4 .6 m). The thickest and most productive area slie within the flood plain near the present Heart River channel .
Based on an areal extent of 12 m i2 (31 km2), a mean thickness of 15 feet (4 . 6m), and an estimated specific yield of 14 percent, about 16,000 acre-feet (20hm 3 ) of water is available to wells from ground-water storage in the Heart Rive rValley aquifer . Potential yields to properly constructed wells generally woul dbe less than 50 gal/min (3 .2 [is ; pl . 1) .
Cannonball River Valley aquifer
The Cannonball River Valley aquifer generally is less than 1 mile (1 .6 km)wide and has an areal extent of about 25 mi 2 (65 km2) in Grant and SiouxCounties (pl . 1) . Data from eight test holes and private wells show the aquifermaterials consist of mixed sand and gravel . The thickness generally ranges fro m4 to 32 feet (1 to 9 .8 m) with a mean of about 17 feet (5 .2 m). The thickest andmost productive areas are located beneath the present flood plain of the Can-nonball River .
36

Based on an areal extent of 25 m i 2 (65 k m 2 ), a mean thickness of 17 feet (5 . 2m), and an estimated specific yield of 12 percent, about 33,000 acre-feet (4 1hm 3 ) of water is available to wells from ground-water storage in the Cannonbal lRiver Valley aquifer . Because of the variable lithologies, saturated thickness ,and extent of the aquifer deposits, potential yields to wells usually would be les sthan 50 gal/min (3 .2 L/s ; pl . 1) .
Cedar Creek Valley aquifer
The Cedar Creek Valley aquifer generally is less than 1 mile (1 .6 km) wideand has an areal extent of about 15 mi 2 (39 km2) in Grant and Sioux Countie s(pl . 1) . Data from three test holes and data from private wells show the aquiferconsists of sand and gravel beds . The thickness generally ranges from 6 to 2 5feet (2 to 7 .6 m) with a mean of about 15 feet (4 .6 m). The thickest and mos tproductive areas are located adjacent to the present stream channel and on th elow-level terraces .
Based on an areal extent of 15 m i 2 (39 k m 2 ), a mean thickness of 15 feet (4 . 6m), and a specific yield of 15 percent, about 22,000 acre-feet (27 h m3) of water isavailable to wells from ground-water storage in the Cedar Creek Valley aquifer .Potential yields to properly constructed wells generally would be less than 5 0gal/min (3.2 Us ; pl . 1).
REGIONAL GROUND-WATER FLOW SYSTEM AN DGEOCHEMICAL RELATIONSHIPS
Grant and Sioux Counties are located near the eastern edge of a large andcomplex regional ground-water flow system . This system includes aquifers inCretaceous and Tertiary deposits as well as Pleistocene glacial-drift deposit sand Holocene alluvial deposits . The scope of this investigation did not permi tthe collection and analysis of data to define all aspects of the ground-water flowsystem, but did indicate general areas of recharge, discharge, and direction o fground-water movement .
The ground-water flow system is recharged in the topographically hig hareas of Grant and Sioux Counties and in areas west of the counties . Groundwater generally moves downward and northeastward toward the topographi-cally lower areas in the eastern parts of the counties . Local deviations from thenortheastward movement occur in the system where aquifers crop out in drain -age valleys and where buried-valley aquifers are incised into the bedrock aqui -fers . Where these deviations . occur, ground water from the bedrock aquifers i sdischarged into the streams and the buried-valley aquifers . The regionalmovement through the aquifers of Pleistocene and Holocene age generally i seastward toward Lake Oahe .
Figure 19 shows the major chemical constituents in water from majorstreams and aquifers in the Grant and Sioux Counties . Analyses of water frommajor streams, represented by plots 1-3, group closely together . The water i spredominantly magnesium, calcium, or sodium sulfate types . The analyses of
37

WATER-ANALYSIS DIAGRAM
111 4
130-080-23DD D
n#n*
5
132-082-10CB C~a
6
132-083-2900 0/
7
133-079-29AB A$ 111t104
8
136-085-09C 1'~134-079-32ADD10
136-085-09B B CDD
1111®1~~1
1111111111111111111111111 118 0---11111 11` '0 AWAWA •4•##
60 ALUM 111®1aQa' ----1-- a}'1111/ %64
00 --A1AYAYAVA
X AVAVAVAW®©WWA11~AFAVAYAVAVAWA
-VAVAVA----FA-A-A 2 1ANAVATAWAYAWAV 91 1
AVA
132-090-14A AB 2132-084-0600 0132-087-27AD A133-089-04D AD130-089-32DD A133-085-12A A D137-088- 21 D D C
1 11 21 31 41 51 617
60
20
Shield sShield sShield sBeaver CreekShield sStrasburgElm Creek
BEDROCK AQUIFER S
Tongue Rive rCannonball-LudlowHell Cree kHell Cree kFox Hill sFox Hill sFox Hills
19012 824311 312428817 8
9017018061 2543522923
1,43059 2684
1,8701,11 01,0401,790
1,7201,5701,0701,22 01,1701,39 01,730
NUMBER
LOCATIONAQUIFER O R
STREAMDEPTH
DISSOLVE D(FEET)
SOLIDS (MG/L)
STREAMS AND RIVER S
1
130-089-33CC B2
134. 082-36CA D3
136-085-09B CC
Cedar CreekCannonball Rive rHeart River
1,9701,150
663
GLACIAL-DRIFT AQUIFER S
'6Ca
°o
CATIONS
`gyp
13-17
ry°
04 CI '$PERCENT OF TOTAL
ANION SMILLIEQUIVALENTS PER LITE R
FIGURE 19.-Major constituents in water from major aquifers and from streams .

Tertiary Tongue River and Cannonball-Ludlow water show high concentration sof sodium sulfate (plots 11-12) . In the Cretaceous Hell Creek and Fox Hill saquifers the sulfate concentration decreases somewhat and is replaced by a nincreased concentration of chloride, as shown by plots 13-17 . The change fromsulfate to chloride occurs where the Fox Hills aquifer lies several hundred fee tbeneath other Cretaceous and Tertiary aquifers . Brackish water from deeperaquifers may be moving upward in the vicinity of a synclinal structure in Gran tCounty (pl . 4) . The Fox Hills aquifer contains sodium bicarbonate-sulfate typewater where it crops out in eastern Sioux County . The glacial-drift aquifers arerepresented by plots 4-10 . Analyses from the glacial-drift aquifers plot betwee nthe surface-water analyses and the deeper bedrock analyses, indicating that th edrift aquifers generally contain a mixture of recharge from bedrock water an dprecipitation .
The geologic framework controlling the regional hydrology in Grant an dSioux Counties indicates that hydraulic connections exist between the glacial -drift and bedrock aquifers . Therefore, large-scale development of any on eaquifer probably would affect the entire system to some degree in the area o fdevelopment. The magnitude of the effect would be dependent upon the siz eand the location of the development .
GROUND-WATER UTILIZATION
During this study, information was collected on 1,610 wells and test holes i nGrant and Sioux Counties . The principal uses of ground water in the countie sare for domestic, livestock, and municipal supplies . The use of ground water fo rirrigation and by industry probably will increase in the future . Water-levelmeasurements in selected observation wells will be continued as part of astatewide program to monitor ground-water resources . The purpose of thestatewide program is to provide data to governmental agencies responsible fo rmanaging the water resources of the State .
Rural Domestic and Livestock Use
Rural domestic and stock wells were from 8 to 394 feet (2 .4 to 129.1 m)deep, were cased with 2- to 4-inch (5 .1- to 10.1-cm) pipe, and commonlyproduced less than 10 gal/min (0 .6 Lis) . Estimated consumption of groundwater from these wells is summarized in the following table .
39

Individual
Population
Estimated totalrequirements'
consumptionUse
(gal per
day) Grant County Sioux County (gal per day)
Domestic
100
2 3,263
2 1,953
520,00 0Cattle
20
372,000
3 38, 000
2,200,000Hogs
3
3 14,600
3 3,000
53,000Sheep
2
3 6,500
3 4,400
22,00 0Chickens
.04
3 8,000
3 25, 000
1,300Estimated total consumption (rounded)
2,800,000
'Murray, 1965 .2 U .S . Bureau of the Census, 1971 .3North Dakota State University, 1974.
Public Supplie s
Four incorporated communities — Carson, Elgin, Leith and New Leipzi g— in Grant County and three — Fort Yates, Selfridge, and Solen — in Siou xCounty rely on ground-water sources for their municipal supplies . Adequatequantities of ground water are available in the vicinity of each community t oaccommodate some future expansion by additional development of present wel lfields, or, in some cases, by development of deeper aquifers .
Carson
The city of Carson obtains its municipal supply from four wells developed i nthe Tongue River aquifer . The wells range in depth from 70 to 90 feet (21 to 2 7m) and yield from 20 to 50 gal/min (1 .2 to 3 .2 LJs) . Total yearly pumpage fro mthe well field was 7 Mgal (26,000 m 3) in 1972 and 8 Mgal (30,000 m3) in 1973 .The water is very hard and a calcium bicarbonate type . Dissolved solids in thewater ranged from 392 to 617 mg/L .
Elgin
The city of Elgin obtains its municipal supply from six wells . Five of thewells, all about 68 feet (21 m) deep, are developed in the Tongue River aquifer ,and the sixth well, 867 feet (264 m) deep, is developed in a Hell Creek aquifer .The five wells developed in the Tongue River aquifer yield from 15 to 3 5gal/min (0 .9 to 2 .2 Us), and are used as the primary municipal supply . The wel ldeveloped in the Hell Creek aquifer yields 45 gal/min (2 .8 L/s) and is used onl yas a standby supply. Total yearly pumpage from the wells in the Tongue Rive raquifer is about 17 Mgal (64,000 m 3 ) .
The water from wells in the Tongue River aquifer is very hard and of acalcium bicarbonate-sulfate type . Dissolved-solids concentrations in water fromthese wells ranged from 926 to 1,400 mg/I . Water from the well in the Hel lCreek aquifer is soft and is a sodium bicarbonate-chloride type .
40

Leith
Although Leith is an incorporated community, there is no public supplysystem; residents obtain their water from private wells developed in th eTongue River aquifer .
New Leipzig
The city of New Leipzig obtains its municipal supply from four wells . Two o fthe wells, 431 and 560 feet (131 and 171 m) deep respectively, are developed inthe Cannonball and Ludlow aquifer, and produce about 3.1 Mgal/yr (12,000
m 3/yr) ; a third well, 285 feet (86 .9 m) deep, is developed in the Tongue Rive raquifer, and produces about 1 .4 Mgal/yr (5,300 m 3/yr) ; the fourth well, 880 fee t(268 rn) deep, is developed in the Fox Hills aquifer and produces about 2 . 3Mgal/yr (8,700 m 3 /yr) . In 1973 total water use by the city of New Leipzig was6.8 Mgallyr (26,000 m 3/yr) .
Water from the wells developed in the Cannonball and Ludlow aquifer i ssoft and of a sodium bicarbonate type . Dissolved-solids concentrations in wate rfrom these wells ranged from 1,210 to 2,080 mg/L. Water from the well devel -oped in the Fox Hills aquifer is soft and of a sodium bicarbonate-chloride type .The dissolved-solids concentration in water from this well was 1,250 mg/L .
Fort Yates
The city of Fort Yates formerly obtained its municipal supply from two well sabout 133 feet (41 m) deep developed in the Fox Hills aquifer . Annual pumpagefrom these wells was about 3 Mgallyr (11,000 m 3 /yr) . Water from these wells i svery hard and of a sodium bicarbonate-sulfate type . Fort Yates now obtains it swater supply from Lake Oahe . The water treatment plant at Fort Yates proc-essed about 79 Mgal (300,000 m 3 ) in 1974 .
Selfridge
The city of Selfridge obtains its municipal supply from wells about 140 fee t(43 rn) deep developed in Hell Creek aquifers . These wells yield about 6.3 Mgal(24,000 m 3 ) of water annually . The water is soft and of a sodium bicarbonate-sulfate type .
Sole n
The city of Solen obtains its municipal supply from one well 210 feet (64 m )deep developed in the Fox Hills aquifer . This well yields about 2 .5 Mgal (9,500m 3 ) of water annually . The water is soft and of a sodium bicarbonate type .Dissolved-solids concentration in water from this well is about 1,500 mg/L .
41
SUMMARY AND CONCLUSION S
Ground water in Grant and Sioux Counties is available from aquifers i nbedrock formations of Late Cretaceous and Tertiary age, in glacial drift o fPleistocene age, and in alluvial deposits of Holocene age . Rocks older than LateCretaceous age generally occur at depths greater than 2,500 feet (760 m) andcontain brackish or saline water . The major bedrock aquifers occur in the Fo xHills and Hell Creek Formations of Late Cretaceous age and the Cannonball ,Ludlow, and Tongue River Formations of Tertiary age . Aquifers in glacialburied-valley deposits of Pleistocene age are located in the northeastern an deastern parts of Grant County and in central and eastern Sioux County . Shallowaquifers in alluvial deposits of Holocene age lie beneath the flood plains i nmajor river valleys . The Fox Hills aquifer is the largest and most extensiv eaquifer studied in the two-county area .
The aquifers occurring in the bedrock consist predominantly of very fine t omedium sand, and potential well yields generally do not exceed 150 gal/min(9 .5 Us) . Most domestic, livestock, and municipal supplies in Grant and SiouxCounties are obtained from the bedrock aquifers . Wells developed for domesticand stock use usually yield less than 10 gal/min (0.6 L/s), while the municipalwells generally yield from 20 to 50 gal/min (1 .3 to 3 .2 Lis) . The total combinedwithdrawal from these aquifers in Grant and Sioux Counties is approximatel y2 .8 Mgal/d (11,000 m 3/d) . The water generally is soft, varies from a sodiumbicarbonate-sulfate type to a sodium bicarbonate-chloride type, and is high i ndissolved constituents .
Ground-water movement in the bedrock aquifers generally is northeast an ddownward through the regional aquifer system . The aquifers are recharged inthe topographically high areas of Grant and Sioux Counties and in region sfarther west . The water becomes increasingly saline as it moves from rechargeareas toward the discharge areas in the drainage valleys . As the water perco-lates downward, the chemical quality changes . from sodium and calciumbicarbonate-sulfate types to a sodium bicarbonate-chloride type .
Aquifers in glacial deposits of Pleistocene age that have the greatest poten-tial for development are those in buried valleys . They are composed of sand an dgravel and include the Shields, Elm Creek, St . James, Beaver Creek, andBattle Creek aquifers . Approximately 355,000 acre-feet (438 hm 3) of availableground water is in storage in these glacial-drift aquifers underlying about 48 mil(124 km 2 ) in Grant and Sioux Counties (table 3) . Test drilling and other dataindicate that the largest yields would be obtainable along the central axes of thevalleys . Ground-water movement through these aquifers generally is east t osoutheast toward Lake Oahe . Recharge is derived from adjacent or underlyin gbedrock aquifers and from infiltration of precipitation through surface materi-als . Discharge occurs where major streams intercept the aquifers .
The predominant dissolved constituents found in grosnd water fro mglacial-drift aquifers are calcium, magnesium, sodium, bicarbonate, and sulfate .Iron is present in amounts that may be objectionable if the water is to be use dfor domestic or industrial purposes .
42

lAB3LE 3. — Summary of data for glacial-drift and alluvial aquifer s
Estimatedamount of Potential
AquiferApproximat eareal extent
(square miles)
water availablefrom storage
(acre-feet)
Generalwater type
yieldto well s(gal/min)
Shields 30 260,000 Sodium bicarbonate 50-1,000Elm Creek 7 67,000 Sodium bicarbonate- 50-1,000
'ti sulfateSt . James 3 8,000 Sodium bicarbonate 50-1,000Beaver Creek 4 14,000 Sodium bicarbonate- 10-500
Battle Creek 4 6,000sulfate
Less than 5 0
Heart River Valley 12 16,000 Less than 50Cannonball River Valley 25 33,000 Less than 5 0Cedar Creek Valley 15 22,000 Less than 50
TOTALS 100 426,000

Alluvial deposits of Holocene age consist of clay, silt, sand, and gavel . Thecoarser deposits form aquifers in the Heart and Cannonball River valleys and i nCedar Creek valley . About 70,000 acre-feet (86 hm3) of available ground wate ris in storage in the aquifers (table 3) underlying about 52 m il (135 k m 2 ) in Grantand Sioux Counties . Recharge is obtained from precipitation and from highstreamflow. The thickest, most productive areas occur beneath the flood plain sand terraces in the stream valleys .
44

SELECTED REFERENCE S
Abbott, G. A., and Voedisch, F. W., 1938, The municipal ground wate rsupplies of North Dakota : North Dakota Geological Survey Bulletin 11, 99P .
Alger, R. P ., 1966, Interpretation of electric logs in fresh water wells in uncon-solidated formations : Society of Professional Well Log Analysts Transac-tions, 7th Annual Logging Symposium, sec . cc, p . 1-25 .
Armstrong, C. A., 1975, Ground-water basic data for Emmons County, Nort h[)akota: North Dakota State Water Commission County Ground-Wate rStudies 23, pt . II, and North Dakota Geological Survey Bulletin 66, pt . II ,375 p ., 1 pl .
Baldwin, H. L., and McGuinness, C . L., 1963, A primer on ground water :VVashington, D .C., U .S . Government Printing Office, 26 p .
Brown, Eugene, Skougstad, M . W., and Fishman, M. J ., 1970, Methods fo rcollection and analysis of water samples for dissolved minerals and gases :Techniques of Water-Resources Investigations of the U .S . Geological Sur-vey, book 5, chapter Al, 160 p .
Calvert, W. R., Beekly, A. L., Barnett, V. H., and Pishel, M. A., 1914 ,Geology of the Standing Rock and Cheyenne River Indian Reservations ,North and South Dakota : U .S. Geological Survey Bulletin 575, 49 p ., 8 pls .
Colton, R . B., Lemke, R . W., and Lindvall, R . M., 1963, Preliminary glacialmap of North Dakota: U.S . Geological Survey Miscellaneous Geologic In-vestigations Map 1-331 .
Comly, H. H., 1945, Cyanosis in infants caused by nitrates in well water :American Medical Association Journal, v . 129, no . 2, p . 112-116.
Croft. M . G., 1974, Ground-water basic data for Adams and Bowman Counties ,North Dakota : North Dakota State Water Commission County Ground -Water Studies 22, pt . II, and North Dakota Geological Survey Bulletin 65 ,pt . II, 294 p ., 1 pl .
Denson, N. M., 1950, The lignite deposits of the Cheyenne River and StandingRock Indian Reservations, Corson, Dewey, and Ziebach Counties, Sout hDakota, and Sioux County, North Dakota : U .S . Geological Survey Circular78, 22 p ., 1 pl .
Durfor, C . N ., and Becker, Edith, 1965, Public water supplies of the 100largest cities in the United States, 1962: U.S. Geological Survey Water -Supply Paper 1812, 364 p .
Erskine, H . M., 1956, Losses due to ice storage in Heart River between HeartButte Dam and Mandan, North Dakota : American Society of Civil En-gineers Proceedings; Journal of the Hydraulics Division, paper 1261, 20 p .
Fenneman, N . M., 1946, Physical divisions of the United States : U .S . Geologi-cal Survey Map prepared in cooperation with the Physiographic Commis-sion, U .S . Geological Survey scale 1 :700,000 [Reprinted 1964] .
Ferris, J . G., Knowles, D . B., Brown, R. H., and Stallman, R. W., 1962 ,Theory of aquifer tests : U.S. Geological Survey Water-Supply Paper1536-E, p . 69-174 .
45

Greenman, D. W., 1953, Reconnaissance of the Missouri River pumping unitsbetween Garrison Dam and Bismarck, North Dakota : U.S. Geological Sur-vey Open-File Report, 65 p .
Hem, J . D ., 1970, Study and interpretation of the chemical characteristics ofnatural water (2d ed .) : U.S. Geological Survey Water-Supply Paper 1473 ,363 p., 2 pls .
Johnson, A . I ., 1963, Application of laboratory permeability data : U.S. Geolog-ical Survey Open-File Report, 33 p .
Keech, C. F., 1964, Ground-water conditions in the proposed waterfowl refug earea near Chapman, Nebraska, with a section on chemical quality of thewater by P. G. Rosene : U.S. Geological Survey Water-Supply Paper1779-E, 55 p ., 6 pls .
Laird, W. M ., and Mitchell, R . H ., 1942, The geology of the southern part ofMorton County, North Dakota: North Dakota Geological Survey Bulleti n14, 42 p .
Langbein, W . B ., and Iseri, K . T., 1960, General introduction and hydrologi cdefinitions, Manual of hydrology: pt . 1 . General surface-water techniques :U.S. Geological Survey Water-Supply Paper 1541-A, 29 p .
Lloyd, E . R., 1914, The Cannonball River lignite field, Morton, Adams, an dHettinger Counties, North Dakota, in Campbell, M. R., Contributions toeconomic geology, pt . II, mineral fuels : U.S. Geological Survey Bulletin541-G, p . 243-291 .
Lohman, S . W., 1972, Ground-water hydraulics : U.S. Geological Survey Pro-fessional Paper 708, 70 p ., 9 pls .
Lohman, S . W., and others, 1972, Definitions of selected ground-water term s— revisions and conceptual refinements : U.S. Geological Survey Water -Supply Paper 1988, 21 p .
Maclay, R. W., 1952, Occurrence of ground water in the Cheyenne River an dStanding Rock Indian Reservation areas, North and South Dakota : U.S .Geological Survey Open-File Report, 95 p ., 2 pls .
Maderak, M. L., 1966, Sedimentation and chemical quality of surface water inthe Heart River drainage basin, North Dakota : U .S . Geological SurveyWater-Supply Paper 1823, 42 p .
Maxey, K . F., 1950, Report on the relation of nitrate concentration in wellwaters to the occurrence of methemoglobinemia: National Research Coun-cil Bulletin, Sanitary Engineering and Environment, p . 265-271, appendixD .
Meyer, R. R., 1963, A chart relating well diameter, specific capacity, and th ecoefficients of transmissibility and storage, in Bentall, Ray, Methods ofdetermining permeability, transmissibility, and drawdown : U.S. Geologi-cal Survey Water-Supply Paper 1536-I, p . 338-340 .
Murray, C . R., 1968, Estimated use of water in the United States, 1965 : U.S .Geological Survey Circular 556, 53 p .
National Academy of Sciences-National Academy of Engineering, 1972 [1973] ,Water quality criteria, 1972: U .S. Environmental Protection Agency,Ecological Research Series, Report EPA R3-73-033, March 1973, 594 p .
46

National Weather Service, 1937-75, Climatological data, North Dakota : Annua lSummaries 1936-74, v . 45-74, no . 13 .
North Dakota State Department of Health, 1962, The low sodium diet i ncardiovascular and renal disease : Sodium content of municipal waters i nNorth Dakota : 12 p .
- 1964, Chemical analyses of municipal waters in North Dakota: 25 p .
- 1970, Water quality standards for surface waters of North Dakota : 45 p .North Dakota State University, 1974, North Dakota crop and livestock statis -
tics, annual summary for 1973, revisions for 1972 : Agricultural Statistics ,no . 32, 76 p .
Randich, P . G., 1975, Ground-water basic data for Grant and Sioux Counties ,North Dakota: North Dakota State Water Commission County Ground -Water Studies 24, pt . II, and North Dakota Geological Survey Bulletin 67 ,pt . II, 303 p., 1 pl .
Rand ich, P . G., and Hatchett, J . L ., 1966, Geology and ground water resource sof Burleigh County, North Dakota ; pt . III, Ground water resources : NorthDakota State Water Commission County Ground Water Studies 3, an dNorth Dakota Geological Survey Bulletin 42, 92 p .
Riggs, H . C ., 1972, Low-flow investigations : Techniques of Water-ResourcesInvestigations of the U .S. Geological Survey, book 4, chapter B1, 18 p .
Robinove, C . J ., Langford, R. H., and Brookhart, J . W., 1958, Saline-waterresources of North Dakota : U.S. Geological Survey Water-Supply Pape r1428, 72 p ., 1 pl .
Rorabaugh, M . I ., 1960, Use of water levels in estimating aquifer constants in afinite aquifer: International Association of Scientific Hydrology, publicatio n52, p . 314-323 .
Schroer, F. W., 1970, A study of the effect of water quality and management o nthe physical and chemical properties of selected soils under irrigation :North Dakota Water Resources Research Institute, Report no . WI-221 -007-70, FCST :III-C, 48 p .
Simpson, H. E., 1929, Geology and ground-water resources of North Dakotawith a discussion of the chemical character of the water by H . B. Riffen-burg: U .S . Geological Survey Water-Supply Paper 598, 312 p .
Smith, Carole, 1954, Summary of Youngblood and Youngblood-Leste rKelstrom No . 1, Grant County, North Dakota: North Dakota Geologica lSurvey Circular 70, 9 p .
Stephens, E . V., 1970, Geologic map of the Heart Butte NW quadrangle ,Morton and Grant Counties, North Dakota : U .S . Geological Survey CoalInvestigations Map C-52.
-1970, Geologic map of the Heart Butte quadrangle, Morton and Gran t
Counties, North Dakota : U.S. Geological Survey Coal Investigations MapC-53 .
Strassberg, Morton, 1954, Summary of the Ohio Oil Company Standing RockSioux Tribal No . 1, Sioux County, North Dakota : North Dakota GeologicalSurvey Circular 91, 8 p .
47

Theis, C . V., Brown, R . H., and Meyer, R. R., 1963, Estimating the transmis-sibility of aquifers from the specific capacity of wells, in Bentall, Ray ,Methods of determining permeability, transmissibility, and drawdown :U .S . Geological Survey Water-Supply Paper 1536-I, p . 331-336 .
Trapp, Henry, Jr ., 1971, Ground water basic data, Hettinger and Stark Coun-ties, North Dakota : North Dakota State Water Commission CountyGround-Water Studies 16, pt . II, 455 p., 1 p1 .
Tychsen, P . C., 1950, Geology and ground-water hydrology of the Heart Rive rirrigation project and the Dickinson area, North Dakota: U.S . GeologicalSurvey Circular 34, 59 p ., 1 pl .
U.S. Bureau of the Census, 1971, 1970 census of population, number of in-habitants, North Dakota : U .S . Bureau of the Census Report PC(1)-A36, 26P .
U.S. Geological Survey, 1974, 1972 Water resources data for North Dakota; pt .2, Water quality records : U.S. Geological Survey Open-File Report, Bis-marck, N . Dak., p . 85, 94-98, 139, and 157 .
U.S . Salinity Laboratory Staff, 1954, Diagnosis and improvement of saline an dalkali soils : U . S . Department of Agriculture, Agriculture Handbook no . 60 ,160 p .
Wilcox, L . V., and Durum, W . H ., 1967, Quality of irrigation water : America nSociety of Agronomy, Agronomy Series, chapter 9 .
48

DEFINITIONS OF SELECTED TERM S
Aquifer — an aquifer is a formation, group of formations, or part of a formatio nthat contains sufficient saturated permeable material to yield significan tquantities of water to wells and springs .
Confining bed - a body of "impermeable" material stratigraphically adjacent toone or more aquifers .
Heat -- pressure of a fluid upon a unit area due to the height at which the surfac eof' the fluid stands above the point where the pressure is determined .
Hydraulic conductivity — if a porous medium is isotropic and the fluid i shomogeneous, the hydraulic conductivity of the medium is the volume ofwater at the existing kinematic viscosity that will move in unit time under aunit hydraulic gradient through a unit area measured at right angles to th edirection of flow. It replaces the term "field coefficient of permeability, "which embodies the inconsistent units gallon, foot, and mile .
Hydraulic gradient - the change in static head per unit of distance in a give ndirection .
Hydrograph — a graph showing stage, flow, water level, precipitation, or othe rhydrologic properties with respect to time .
Observation well — a well from which hydrologic and chemical data are obtaine dand recorded.
Porosity — the porosity of a rock or soil is its property of containing interstices orvoids and may be expressed quantitatively as the ratio of the volume of it sinterstices to its total volume . It may be expressed as a decimal fraction o ras a percentage .
Potentiometric surface — a surface that represents the static head . As related t oan aquifer, it is defined by the levels to which water will rise in tightl ycased wells . It replaces the term "piezometric surface . "
Slug test — injecting a given quantity or "slug" of water into a well and measur -ing responses to determine the transmissivity at the site under certainconditions .
Transmissivity — the rate at which water of the prevailing kinematic viscosity i stransmitted through a unit width of the aquifer under a unit hydraulicgradient . It replaces the term "coefficient of transmissibility . "
Uniformity coefficient — a numerical expression of the variety in particle sizes inmixed natural soils, defined as the ratio of the sieve size through which 60percent (by weight) of the material passes to the sieve size that allows 1 0percent of the material to pass . It is unity for a material whose particles ar eall of the same size, and it increases with variety in size (as high as 30 fo rheterogeneous sand) .
Water table — that surface in an unconfined water body (aquifer) at which th epressure is atmospheric .
49