Embed Size (px)
Citation preview
GROUND-WATER RESOURCES OF FLAGLER COUNTY, FLORIDA
By A.S. Navoy and L.A. Bradner
U.S. GEOLOGICAL SURVEY
Water-Resources Investigations Report 87-4021
Prepared in cooperation with
FLAGLER COUNTY and the
ST. JOHNS RIVER WATER MANAGEMENT DISTRICT
Tallahassee, Florida
1987
DEPARTMENT OF THE INTERIOR
DONALD PAUL MODEL, Secretary
U.S. GEOLOGICAL SURVEY
Dallas L. Peck, Director
For additional information write to:
District ChiefU.S. Geological SurveySuite 3015227 North Bronough StreetTallahassee, Florida 32301
Copies of this report can be purchased from:
U.S. Geological SurveyBooks and Open-File Reports SectionFederal Center, Bldg. 810Box 25425Denver, Colorado 80225
CONTENTS
Page
Abstract............................................................. 1Introduction......................................................... 2
Purpose and scope............................................... 2Previous investigations.......................................... 2Acknowledgments................................................. 4
Environmental setting........................... ..................... 4Physiography and drainage....................................... 4Rainfall and evapotranspiration................................. 6Geology......................................................... 6
Hydrogeology......................................................... 8Aquifers........................................................ 8
Upper Floridan aquifer..................................... 8Intermediate aquifer system................................ 9Surficial aquifer system................................... 11
Ground-water movement........................................... 11Upper Floridan aquifer..................................... 11Intermediate aquifer system................................ 13Surficial aquifer system................................... 13
Hydraulic properties........................;................... 13Upper Floridan aquifer..................................... 13Intermediate aquifer system................................ 15
Age dating of ground water...................................... 15Water use............................................................ 17Hydrologic conditions 1979-82........................................ 18
Upper Floridan aquifer.......................................... 18Water levels............................................... 18Water quality.............................................. 20
Intermediate aquifer system..................................... 22Water levels............................................... 22Water quality.............................................. 22
Surficial aquifer system........................................ 28Water levels............................................... 28Water quality.... .......................................... 29
Ground water in the Hammock area................................ 29Effects of man's use on hydrology.................................... 37
Hydrologic changes since the 1950's............................. 37Effects of development.......................................... 40
Withdrawals................................................ 40Probable future effects.................................... 41
Monitoring considerations............................................ 41Summary and conclusions.............................................. 42Selected references.................................................. 44
III
ILLUSTRATIONSPage
Figure 1-2. Maps showing:1. Location of study area............................. 32. Pleistocene marine terraces........................ 5
3. Graph showing annual rainfall for Flagler County........ 74. Diagram showing stratigraphic and hydrogeologic column
in Flagler County..................................... 95-9. Maps showing:
5. Altitude of the top of the Floridan aquifersystem in Flagler County......................... 10
6. Potentiometric surface of the Upper Floridanaquifer and areas of artesian flow in May 1981... 12
7. Transmissivities in the Upper Floridan aquifer .... 148. Age of water in Flagler County and vicinity........ 169. Location of observation wells with long-term
records in the Upper Floridan aquifer............ 1910. Graphs showing water levels in wells in the Upper
Floridan aquifer, 1978-82............................. 2011-15. Maps showing:
11. Potentiometric surface of the Upper Floridanaquifer, September 1978.......................... 23
12. Dissolved solids concentration of water fromwells in the Upper Floridan aquifer.............. 24
13. Chloride concentration of water from wells in theUpper Floridan aquifer........................... 25
14. Hardness of water from wells in the UpperFloridan aquifer................................. 26
15. Water levels in wells of the intermediateaquifer system, May 1979......................... 27
16. Graph showing water levels in well 293313081135203of the intermediate aquifer system ................... 28
17-23. Maps showing:17. Dissolved solids concentration of water from
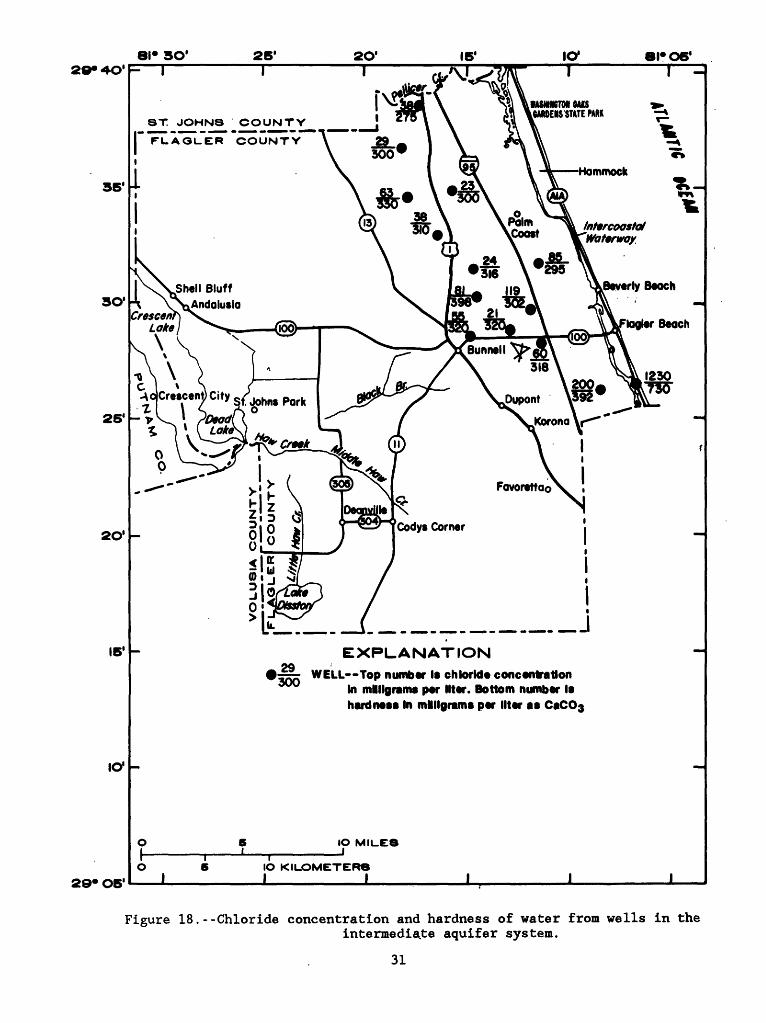
wells in the intermediate aquifer system......... 3018. Chloride concentration and hardness of water from
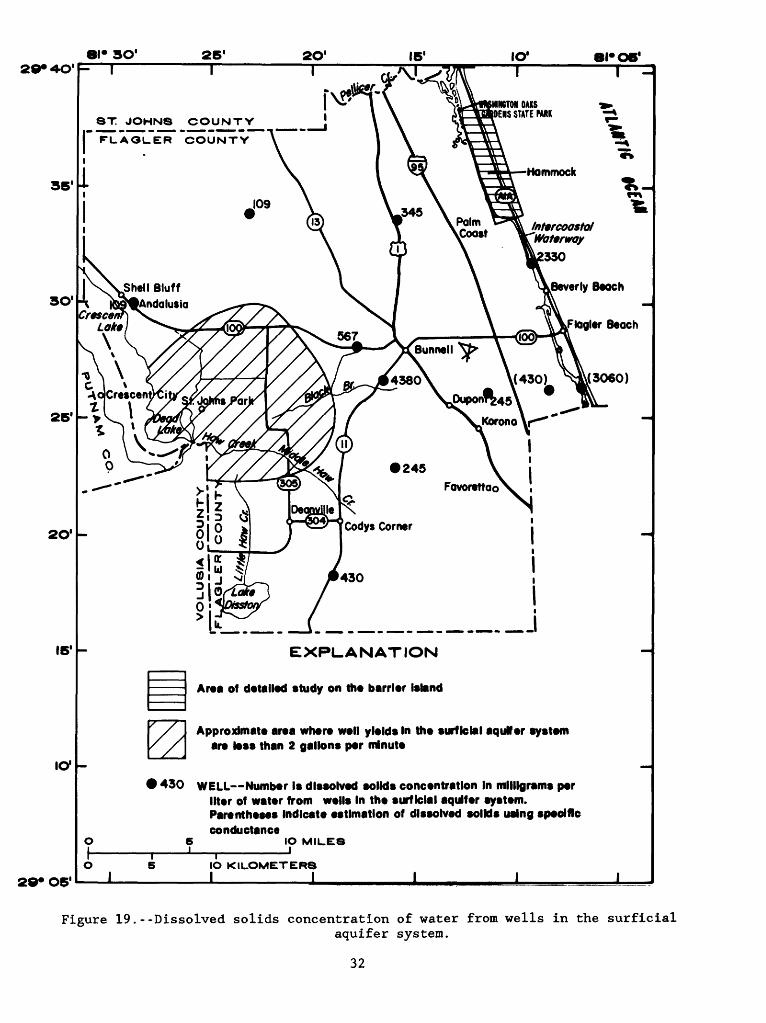
wells in the intermediate aquifer system......... 3119. Dissolved solids concentration of water from
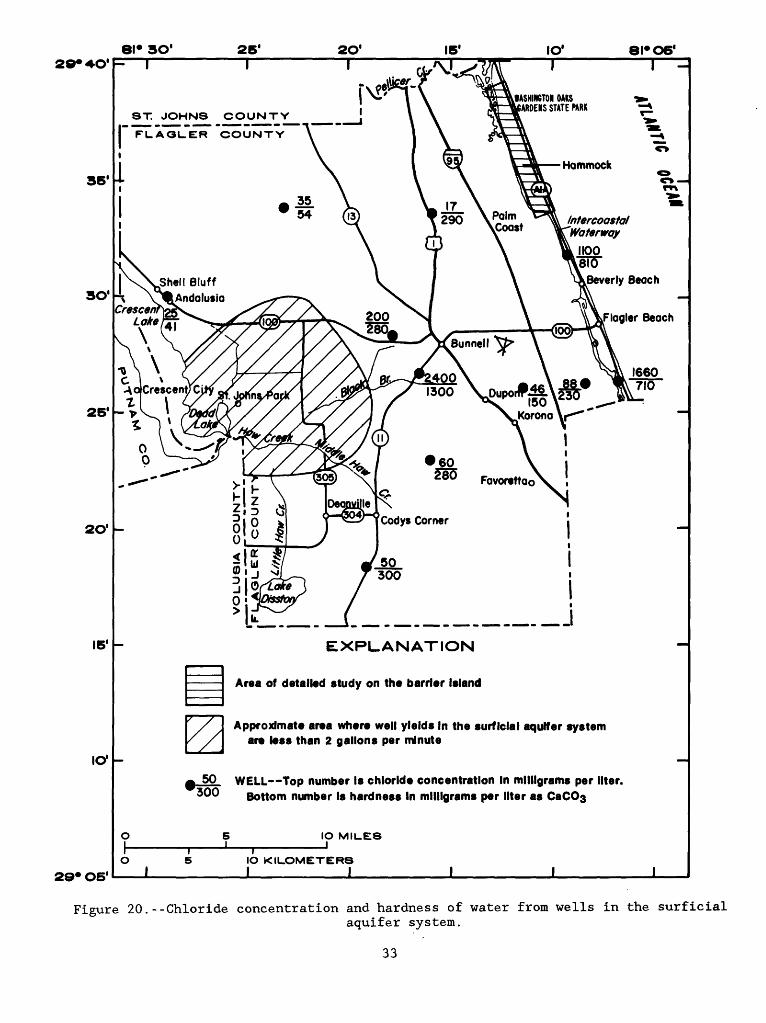
wells in the surficial aquifer system............ 3220. Chloride concentration and hardness of water from
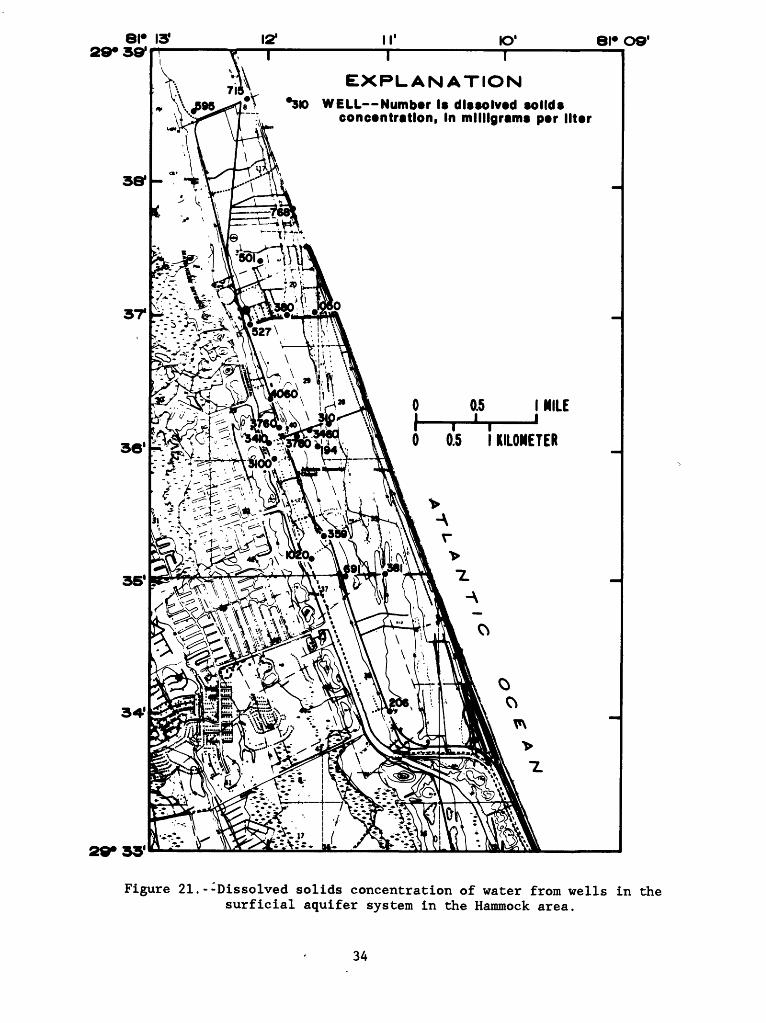
wells in the surficial aquifer system............ 3321. Dissolved solids concentration of water from
wells in the surficial aquifer system in the Hammock area.............................. 34
22. Chloride concentration of water from wells in thesurficial aquifer system in the Hammock area..... 35
23. Hardness of water from wells in the surficialaquifer system in the Hammock area............... 36
24. Graph showing hydrographs of well 292750081152001and 292820081221001................................... 38
25. Map showing change in the potentiometric surface of the Upper Floridan aquifer between September 1958 and September 1978......................................... 39
IV
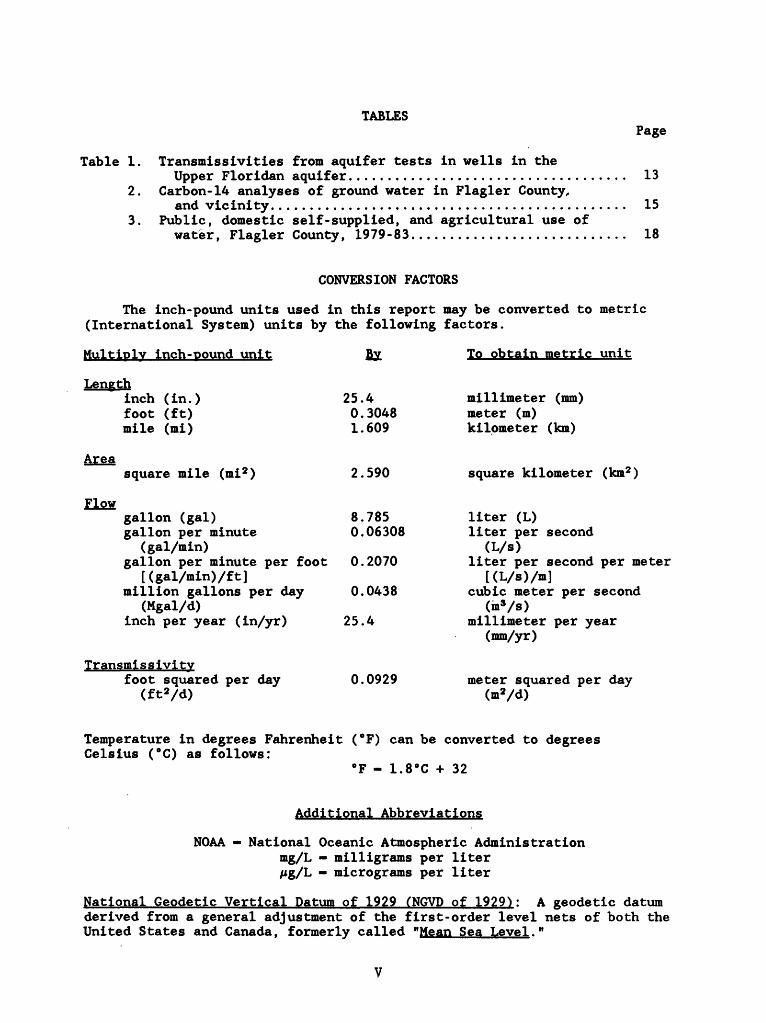
TABLESPage
Table 1. Transmissivities from aquifer tests in wells in theUpper Floridan aquifer.................................... 13
2. Carbon-14 analyses of ground water in Flagler County,.and vicinity.............................................. 15
3. Public, domestic self-supplied, and agricultural use ofwater, Flagler County, 1979-83............................ 18
CONVERSION FACTORS
The inch-pound units used in this report may be converted to metric (International System) units by the following factors.
Multiply inch-pound unit
Lengthinch (in.) foot (ft) mile (mi)
Areasquare mile (mi2 )
Flowgallon (gal) gallon per minute
(gal/min) gallon per minute per foot
[(gal/min)/ft] million gallons per day
(Mgal/d) inch per year (in/yr)
Transmissivityfoot squared per day
(ft2/d)
25.40.30481.609
2.590
8.7850.06308
0.2070
0.0438
25.4
0.0929
To obtain metric unit
millimeter (mm) meter (m) kilometer (km)
square kilometer (km2 )
liter (L)liter per second
(L/s) liter per second per meter
cubic meter per second(m»/s)
millimeter per year(mm/yr)
meter squared per day (m2/d)
Temperature in degrees Fahrenheit (°F) can be converted to degrees Celsius (°C) as follows:
°F - 1.8°C + 32
Additional Abbreviations
NOAA - National Oceanic Atmospheric Administration mg/L - milligrams per liter /ig/L - micrograms per liter
National Geodetic Vertical Datum of 1929 (NGVD of 1929): A geodetic datum derived from a general adjustment of the first-order level nets of both the United States and Canada, formerly called "Mean Sea Level. M
GROUND-WATER RESOURCES OF FLAGLER COUNTY, FLORIDA
By A.S. Navoy and L.A. Bradner
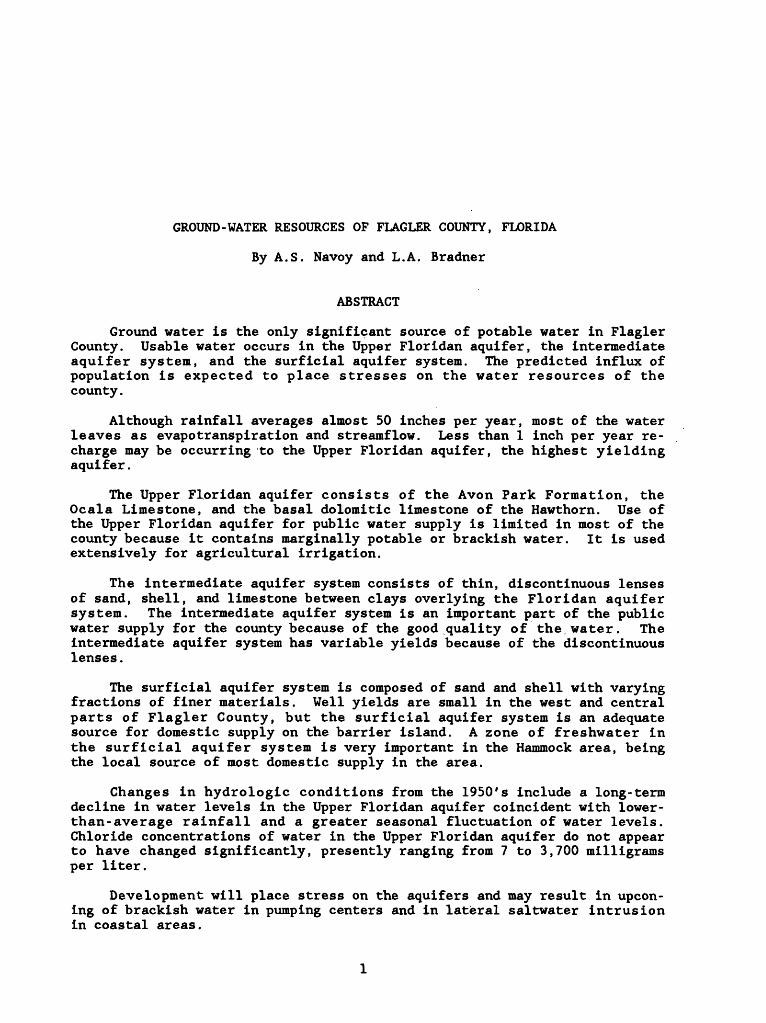
ABSTRACT
Ground water is the only significant source of potable water in Flagler County. Usable water occurs in the Upper Floridan aquifer, the intermediate aquifer system, and the surficial aquifer system. The predicted influx of population is expected to place stresses on the water resources of the county.
Although rainfall averages almost 50 inches per year, most of the water leaves as evapotranspiration and streamflow. Less than 1 inch per year re charge may be occurring to the Upper Floridan aquifer, the highest yielding aquifer.
The Upper Floridan aquifer consists of the Avon Park Formation, the Ocala Limestone, and the basal dolomitic limestone of the Hawthorn. Use of the Upper Floridan aquifer for public water supply is limited in most of the county because it contains marginally potable or brackish water. It is used extensively for agricultural irrigation.
The intermediate aquifer system consists of thin, discontinuous lenses of sand, shell, and limestone between clays overlying the Floridan aquifer system. The intermediate aquifer system is an important part of the public water supply for the county because of the good quality of the. water. The intermediate aquifer system has variable yields because of the discontinuous lenses.
The surficial aquifer system is composed of sand and shell with varying fractions of finer materials. Well yields are small in the west and central parts of Flagler County, but the surficial aquifer system is an adequate source for domestic supply on the barrier island. A zone of freshwater in the surficial aquifer system is very important in the Hammock area, being the local source of most domestic supply in the area.
Changes in hydrologic conditions from the 1950's include a long-term decline in water levels in the Upper Floridan aquifer coincident with lower- than-aver age rainfall and a greater seasonal fluctuation of water levels. Chloride concentrations of water in the Upper Floridan aquifer do not appear to have changed significantly, presently ranging from 7 to 3,700 milligrams per liter.
Development will place stress on the aquifers and may result in upcon- ing of brackish water in pumping centers and in lateral saltwater intrusion in coastal areas.
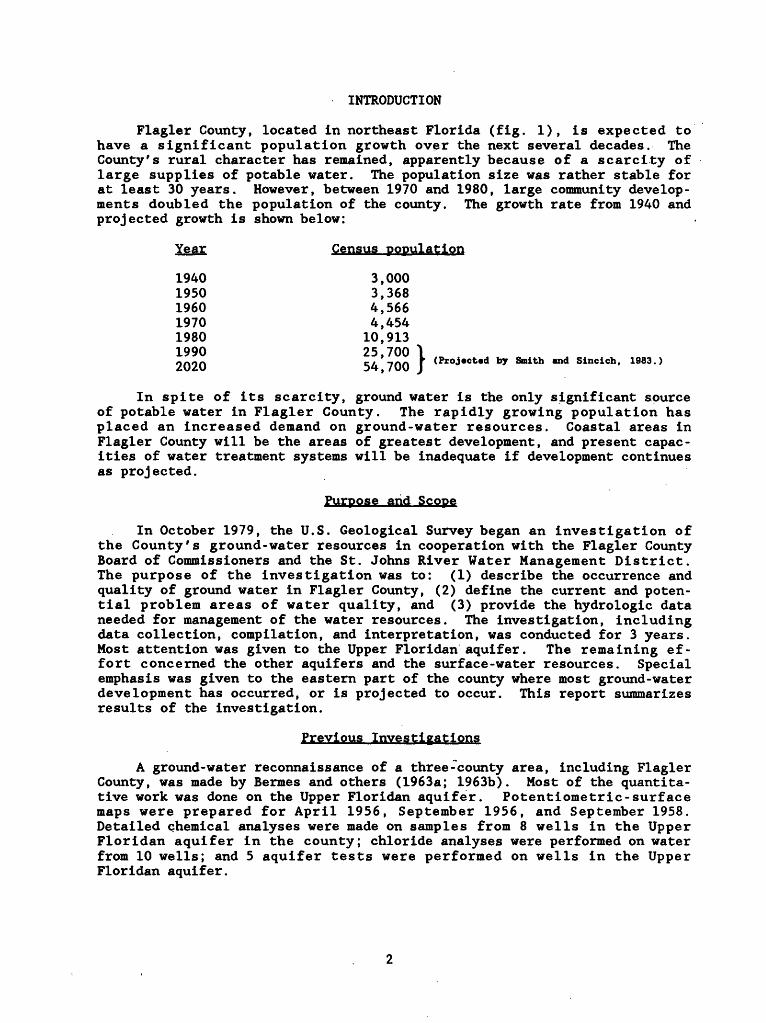
INTRODUCTION
Flagler County, located in northeast Florida (fig. 1), is expected to have a significant population growth over the next several decades. The County's rural character has remained, apparently because of a scarcity of large supplies of potable water. The population size was rather stable for at least 30 years. However, between 1970 and 1980, large community develop ments doubled the population of the county. The growth rate from 1940 and projected growth is shown below:
Year Census population
1940 3,0001950 3,3681960 4,5661970 4,4541980 10,9131990 25,7002020 54,700 ! (Projected by Smith and Sincich, 1983.)
In spite of its scarcity, ground water is the only significant source of potable water in Flagler County. The rapidly growing population has placed an increased demand on ground-water resources. Coastal areas in Flagler County will be the areas of greatest development, and present capac ities of water treatment systems will be inadequate if development continues as projected.
Purpose and Scope
In October 1979, the U.S. Geological Survey began an investigation of the County's ground-water resources in cooperation with the Flagler County Board of Commissioners and the St. Johns River Water Management District. The purpose of the investigation was to: (1) describe the occurrence and quality of ground water in Flagler County, (2) define the current and poten tial problem areas of water quality, and (3) provide the hydrologic data needed for management of the water resources. The investigation, including data collection, compilation, and interpretation, was conducted for 3 years. Most attention was given to the Upper Floridan aquifer. The remaining ef fort concerned the other aquifers and the surface-water resources. Special emphasis was given to the eastern part of the county where most ground-water development has occurred, or is projected to occur. This report summarizes results of the investigation.
Previous Investigations
A ground-water reconnaissance of a three-county area, including Flagler County, was made by Bermes and others (1963a; 1963b). Most of the quantita tive work was done on the Upper Floridan aquifer. Potentiome trie-surf ace maps were prepared for April 1956, September 1956, and September 1958. Detailed chemical analyses were made on samples from 8 wells in the Upper Floridan aquifer in the county; chloride analyses were performed on water from 10 wells; and 5 aquifer tests were performed on wells in the Upper Floridan aquifer.
29* 46' -
50'
20* 00*
STUDY AREA
10 2O KILOMETER*
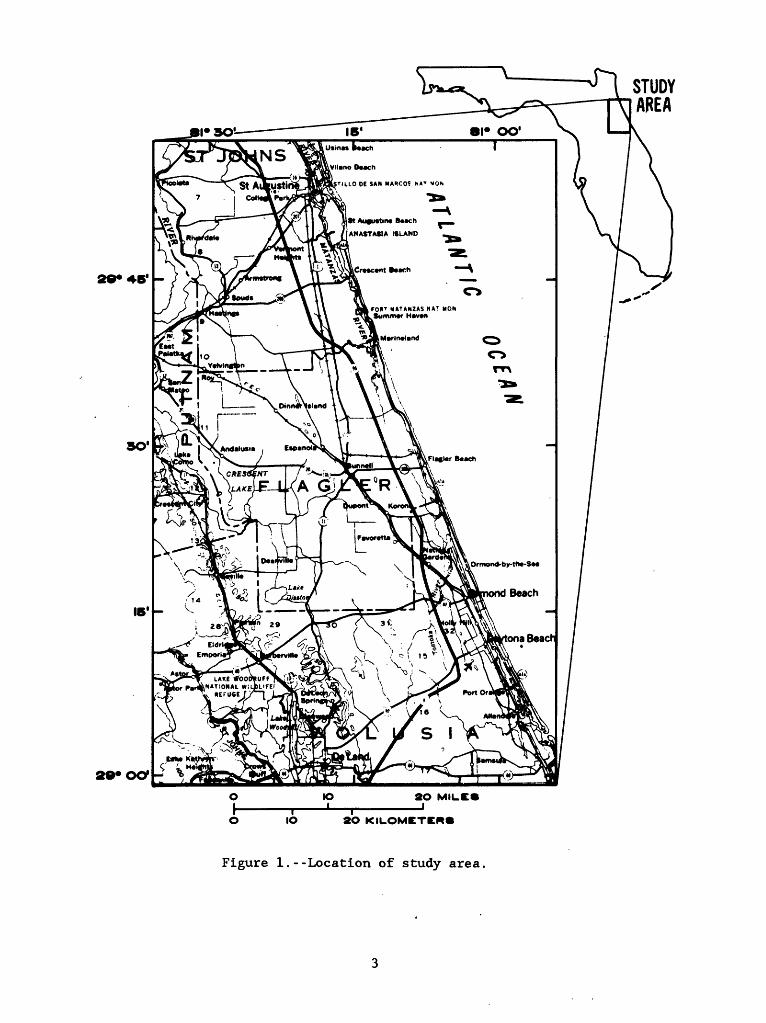
Figure 1.--Location of study area.
Kenner and Crooks (1963) summarized the surface-water resources of the same three-county area, concurrent with that of Bermes and others. One long-term streamflow station was located within the county and intermittent streamflow measurements were made at 10 additional sites.
Black, Crow, and Eidsness/CH2M-Hill Inc., in 1977 evaluated the water- resources and water-supply potential on the Palm Coast development property. Their interpretations were based on data from 39 test wells.
Munch and others (1979a; 1979b) examined the occurrence of saline water in the Upper Floridan aquifer in a three-county study. Within Flagler County, they focused on the agricultural area west of Bunnell.
Frazee and McClaugherty (1979) reported on the characteristics of aqui fers along the coast from Flagler County north to Fernandina Beach. Areas of saline-water intrusion were delineated and sources of potable water were indicated.
Acknowledgments
Appreciation is expressed to the many Flagler County residents who provided access to their wells. Special thanks are due to Carry A. Balogh, of the Palm Coast development property; Don Chinnery, the Flagler County engineer; and William Lenssen, whose information and advice greatly enhanced this report. Appreciation is also expressed to the staff of the Water Resources Evaluation Department of the St. Johns River Water Management District.
ENVIRONMENTAL SETTING
Flagler County is an area of 504 mi 2 (square miles) along the east coast of north central Florida (fig. 1). It is bounded on the east by the Atlantic Ocean and on the north, west, and south respectively by St. Johns, Putnam, and Volusia Counties. About one-half of its common boundary with Putham County lies in Crescent Lake.
Most of the population is concentrated in Bunnell (the county seat) and coastal communities. Major industries are agriculture, tourism, and for estry.
Physiography and Drainage
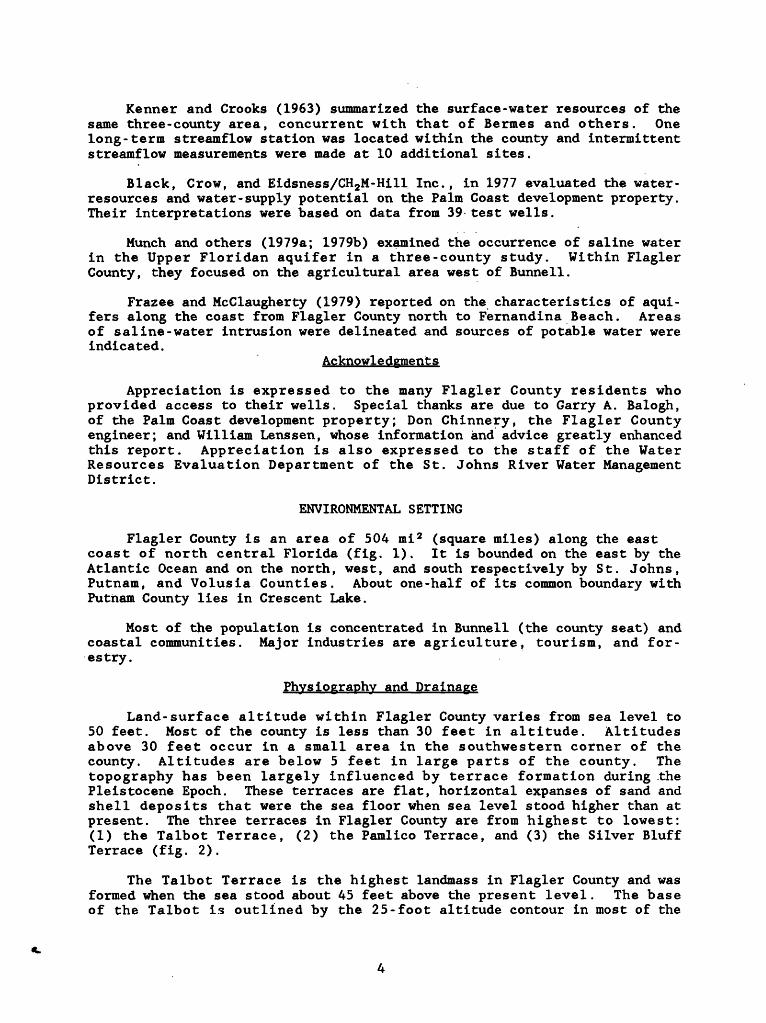
Land-surf ace altitude within Flagler County varies from sea level to 50 feet. Most of the county is less than 30 feet in altitude. Altitudes above 30 feet occur in a small area in the southwestern corner of the county. Altitudes are below 5 feet in large parts of the county. The topography has been largely influenced by terrace formation during .the Pleistocene Epoch. These terraces are flat, horizontal expanses of sand and shell deposits that were the sea floor when sea level stood higher than at present. The three terraces in Flagler County are from highest to lowest: (1) the Talbot Terrace, (2) the Pamlico Terrace, and (3) the Silver Bluff Terrace (fig. 2).
The Talbot Terrace is the highest landmass in Flagler County and was formed when the sea stood about 45 feet above the present level. The base of the Talbot is outlined by the 25-foot altitude contour in most of the
81*06*
8T JOHN8 COUNTY
26*
20*
IS1
10*
20* 06*
EXPLANATION
SILVER BLUFF TERRACE
PAMLICO TERRACE
TALBOT TERRACE
ATLANTIC COASTAL RDGE
IO MILESj
IIO KILOMETERS
Figure 2.--Pleistocene marine terrraces (from Bermes and others, 1963, fig. 3)
county. Its east edge is particularly well defined in northeast Flagler County where it is seen as a linear feature parallel to the coastline. The eastern edge of the Talbot is commonly referred to as the Atlantic Coastal Ridge.
The next lower terrace is the Pamlico, which was formed when sea level was 25 to 30 feet above the present level. It occurs in a narrow band east of the Talbot Terrace, and covers about two-thirds of the county area west of the Talbot.
The Silver Bluff Terrace is the lowest landmass in Flagler County, and was formed when the sea stood 5 to 10 feet above the present level. In east Flagler it occurs as an elongate band, adjacent to the coast and up to several miles in width. A small area occurs in west Flagler along Haw Creek and Crescent Lake.
Drainage in Flagler County is controlled by the Atlantic Coastal Ridge, which is the topographic high in the study area. Drainage east of the ridge is either to the Intracoastal Waterway or into the Atlantic Ocean by rela tively short streams that flow eastward. The remainder of the county tends to be poorly drained; streams are so poorly developed that much of the area is marshland. Drainage is through sluggish tributaries to Haw Creek and Crescent Lake and thence to the St. Johns River.
Rainfall and Evapotranspiration
Flagler County has a humid, subtropical climate with high annual rain fall and moderate temperatures. The mean annual temperature is about 70 °F.
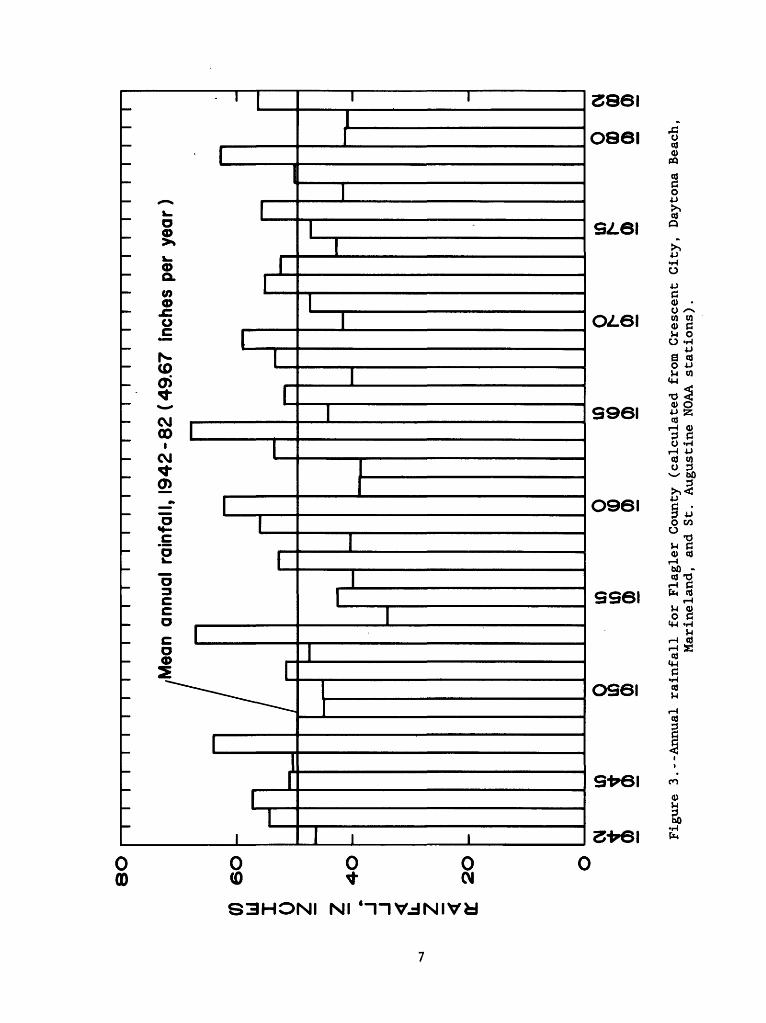
Figure 3 shows yearly rainfall for 1942-82 derived from National Oce anic and Atmospheric Administration stations located at Marineland, Crescent City, Daytona Beach and St. Augustine (fig. 1). The Marineland station was used for data through 1978 and the St. Augustine station was used from 1979 through 1982. Mean annual rainfall for Flagler County for the 41-year peri od was approximately 49.67 in/yr (inches per year).
In most years, wet and dry seasons are pronounced. About 65 percent of the average rainfall tends to occur during the 5 months of June through October. Local thunderstorms account for most of the summer rainfall. Win ter rains tend to be areal or regional in distribution and associated with movement of large frontal-type weather systems.
The major loss of water through the hydrologic cycle in the county is by evapotranspiration (the combination of plant transpiration and physical evaporation). The evapotranspiration rate for Flagler County is estimated to be greater than 35 in/yr (Lichtler and others, 1968).
Geology
The oldest geologic unit penetrated by water wells in Flagler County is the Avon Park Formation of late middle Eocene age. This formation is com posed of beds of white to brown limestone and dolomite; dense, indurated zones tend to alternate with highly porous zones. The top of the Avon Park generally dips north in Flagler County; ranging from about 100 feet below
80
0) 60
Id I 0 - -40
J J if z2O -m
^^m
1M
MI
mm
^m
^ i
MB
H
1 /1
Mea
i n ^^ m
annu
al
^^ H
rain
fa ^mm
m
mm
mm
II,
1 1
1
1942
-
mm
mm
8't mm
m
1
>( 4
9.67 M
^H
In w
i i
i i
i i
i
iche
s pe
r ye
ar )
^^ H
v^^
i ^s
MH
H
^
^^^
^M
^^^m
31
10
0
10
0
10
0
10
001
t
+
in
10
(0
(0
Is-
Is-
0)0
) 0
)0
)
0)
0)
0)
0)
0)
0)
0)0
)
Figure 3.--Annual ra
infa
ll fo
r Flagler
Coun
ty (c
alcu
late
d fr
om Crescent Ci
ty,
Daytona
Beach,
Mari
nela
nd,
and
St.
Augu
stin
e NO
AA stations).
sea level in southern Flagler to about 300 feet below sea level in the north (Bermes and others, 1963a, p. 25-27, fig. 6). The thickness of the Avon Park ranges from about 170 to 235 feet.
The Ocala Limestone overlies the Avon Park Formation throughout Flagler County. The Ocala, of late Eocene age, is a white-to-tan, highly fossil- iferous limestone that ranges in thickness from 150 feet in the north to less than 50 feet in the south (Bermes and others, 1963a, p. 29, fig. 6). The Ocala Limestone is tapped extensively by wells.
The middle Miocene Hawthorn Formation overlies the Ocala Limestone ex cept where absent in most of south Flagler County. The base of the forma tion is dolomitic limestone, but the remainder of the formation is sandy clay and marl, interbedded with lenses of phosphorite pebbles, phosphatic sand, and phosphatic sandy limestone.
Upper Miocene or Pliocene deposits occur in a band that parallels the coastline. The deposits consist of interstratified lenses of marine sand, shell, and clay that overlie the Hawthorn Formation where present. Where the Hawthorn is absent, these deposits overlie the Ocala Limestone.
Sand, clay, and shell deposits of Pleistocene and Holocene age comprise the surficial aquifer system in Flagler County. These deposits are des cribed by Bermes and others (1963a, p. 32-33) as fine- to medium-grained sand with thin clay and shell lenses. The shell lenses are loosely to well- cemented coquina beds that occur near and parallel to the coast. The co- quina beds, named the Anastasia Formation (Parker and others, 1955, p. 100), crop out on the beach at Washington Oaks Gardens State Park.
HYDROGEOLOGY Aquifers
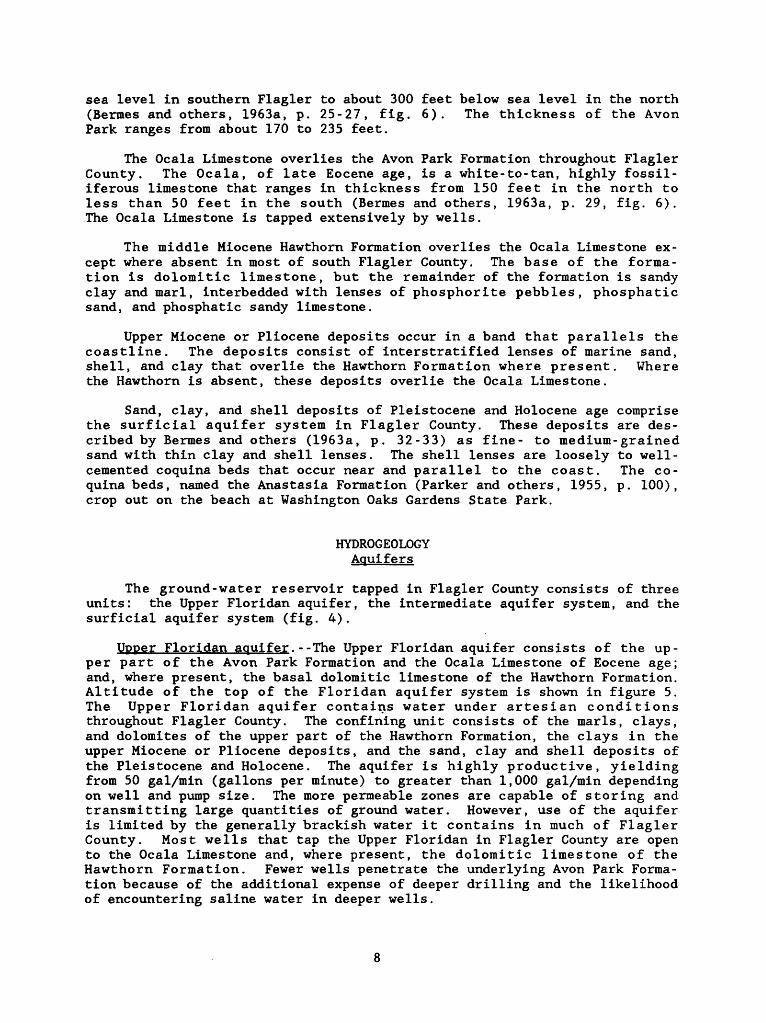
The ground-water reservoir tapped in Flagler County consists of three units: the Upper Floridan aquifer, the intermediate aquifer system, and the surficial aquifer system (fig. 4).
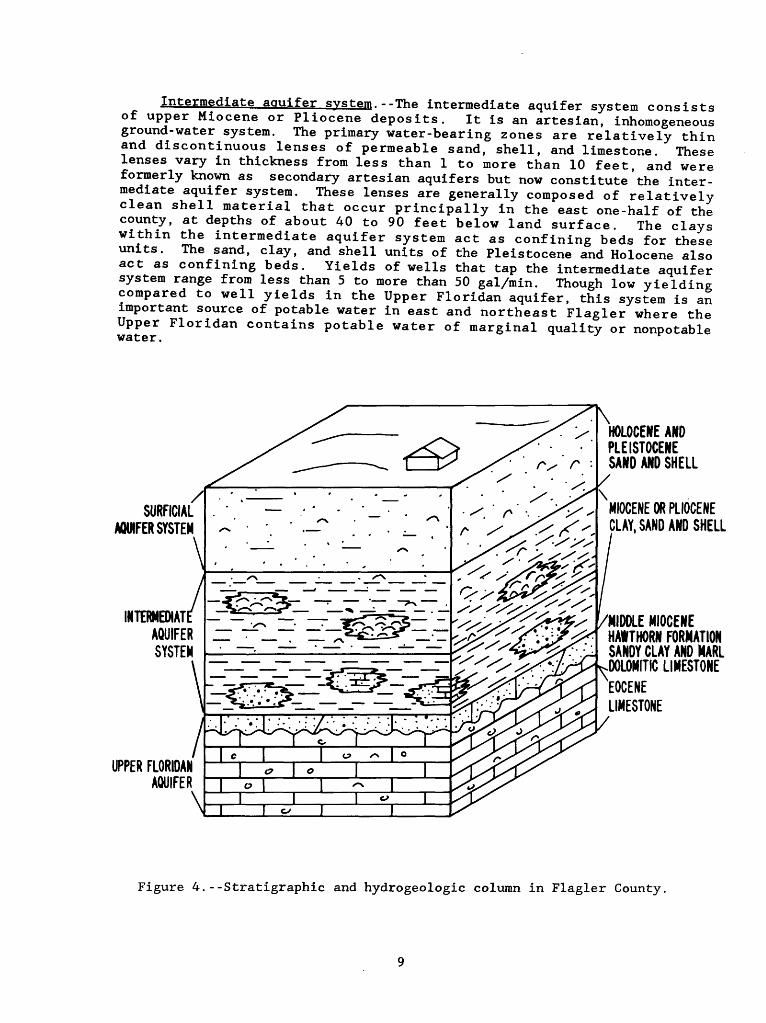
Upper Floridan aquifer.--The Upper Floridan aquifer consists of the up per part of the Avon Park Formation and the Ocala Limestone of Eocene age; and, where present, the basal dolomitic limestone of the Hawthorn Formation. Altitude of the top of the Floridan aquifer system is shown in figure 5. The Upper Floridan aquifer contains water under artesian conditions throughout Flagler County. The confining unit consists of the marls, clays, and dolomites of the upper part of the Hawthorn Formation, the clays in the upper Miocene or Pliocene deposits, and the sand, clay and shell deposits of the Pleistocene and Holocene. The aquifer is highly productive, yielding from 50 gal/min (gallons per minute) to greater than 1,000 gal/min depending on well and pump size. The more permeable zones are capable of storing and transmitting large quantities of ground water. However, use of the aquifer is limited by the generally brackish water it contains in much of Flagler County. Most wells that tap the Upper Floridan in Flagler County are open to the Ocala Limestone and, where present, the dolomitic limestone of the Hawthorn Formation. Fewer wells penetrate the underlying Avon Park Forma tion because of the additional expense of deeper drilling and the likelihood of encountering saline water in deeper wells.
Intermediate aquifer system.--Thg intermediate aquifer system consists of upper Miocene or Pliocene deposits. It is an artesian, inhomogeneous ground-water system. The primary water-bearing zones are relatively thin and discontinuous lenses of permeable sand, shell, and limestone These lenses vary in thickness from less than 1 to more than 10 feet, and were formerly known as secondary artesian aquifers but now constitute'the inter mediate aquifer system. These lenses are generally composed of relatively clean shell material that occur principally in the east one-half of the county, at depths of about 40 to 90 feet below land surface. The clays within the intermediate aquifer system act as confining beds for these units. The sand, clay, and shell units of the Pleistocene and Holocene also act as confining beds. Yields of wells that tap the intermediate aquifer system range from less than 5 to more than 50 gal/min. Though low yielding compared to well yields in the Upper Floridan aquifer, this system is an important source of potable water in east and northeast Flagler where the Upper Floridan contains potable water of marginal quality or nonpotable water.
SURFICIAL AQUIFER SYSTEM
INTERMEDIA! AQUIFER SYSTEM
UPPER FLORIDAN AQUIFER
HOLOCENE AND PLEISTOCENE SAND AND SHELL
MIOCENE OR PLIOCENE CLAY, SAND AND SHELL
IDDLE MIOCENE HAWTHORN FORMATION SANDY CLAY AND MARL DOLOMITIC LIMESTONEEOCENE LIMESTONE
Figure 4.--Stratigraphic and hydrogeologic column in Flagler County
2O-40'
36'
SO1
Inttrcoosto/ 'Waterway
Beverly Beach
Ftagltr Beach
26'
20'
16'
IO1
OS1
81*06'
>LC_. _J
EXPLANATION
/OO*
120
STRUCTURE CONTOUR--Shows altitude of top of Florldan aquifer eyetem In feet below National Geodetic Vertical Datum of 1929. Contour Interval 50 feet
WELL Number Indicates altitude of top of Florldan aquifer system In feet below the National Geodetic Vertical Datum of 1929
IO MILES
IIO KILOMETERS I____________I
Figure 5.--Altitude of the top of the Floridan aquifer system in Flagler County.
10
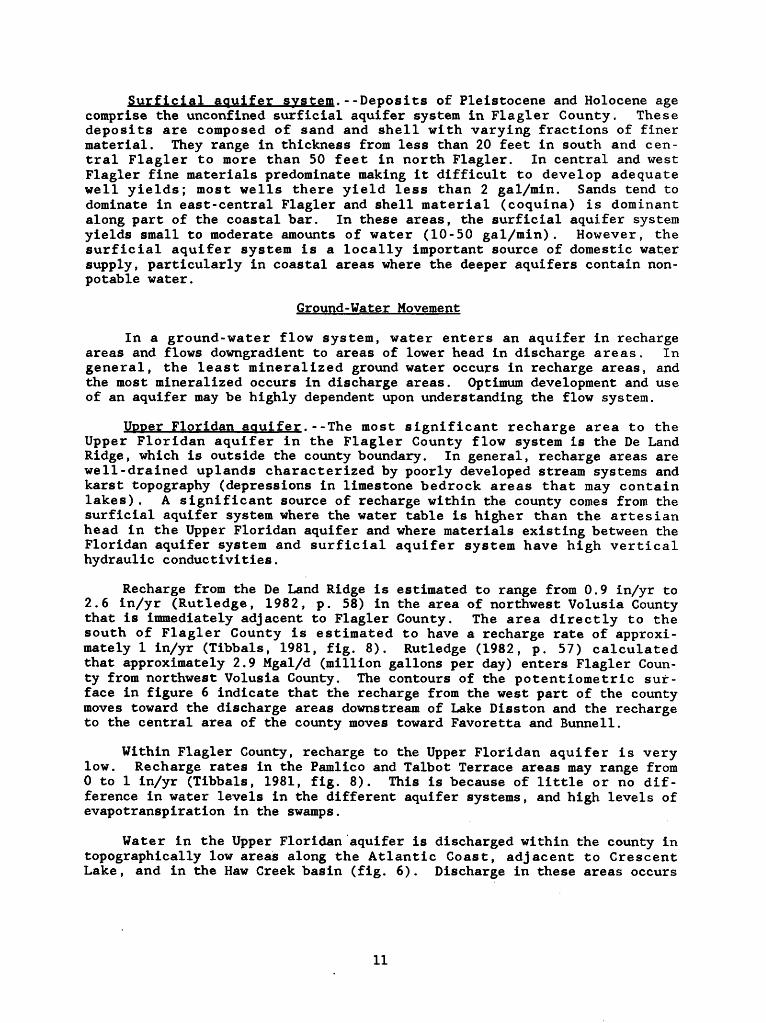
Surficial aquifer system. --Deposits of Pleistocene and Holocene age comprise the unconfined surficial aquifer system in Flagler County. These deposits are composed of sand and shell with varying fractions of finer material. They range in thickness from less than 20 feet in south and cen tral Flagler to more than 50 feet in north Flagler. In central and west Flagler fine materials predominate making it difficult to develop adequate well yields; most wells there yield less than 2 gal/min. Sands tend to dominate in east-central Flagler and shell material (coquina) is dominant along part of the coastal bar. In these areas, the surficial aquifer system yields small to moderate amounts of water (10-50 gal/min). However, the surficial aquifer system is a locally important source of domestic water supply, particularly in coastal areas where the deeper aquifers contain non- potable water.
Ground-Water Movement
In a ground-water flow system, water enters an aquifer in recharge areas and flows downgradient to areas of lower head in discharge areas . In general, the least mineralized ground water occurs in recharge areas, and the most mineralized occurs in discharge areas. Optimum development and use of an aquifer may be highly dependent upon understanding the flow system.
Upper Floridan aquifer.--The most significant recharge area to the Upper Floridan aquifer in the Flagler County flow system is the De Land Ridge, which is outside the county boundary. In general, recharge areas are we 11-drained uplands characterized by poorly developed stream systems and karst topography (depressions in limestone bedrock areas that may contain lakes) . A significant source of recharge within the county comes from the surficial aquifer system where the water table is higher than the artesian head in the Upper Floridan aquifer and where materials existing between the Floridan aquifer system and surficial aquifer system have high vertical hydraulic conductivities.
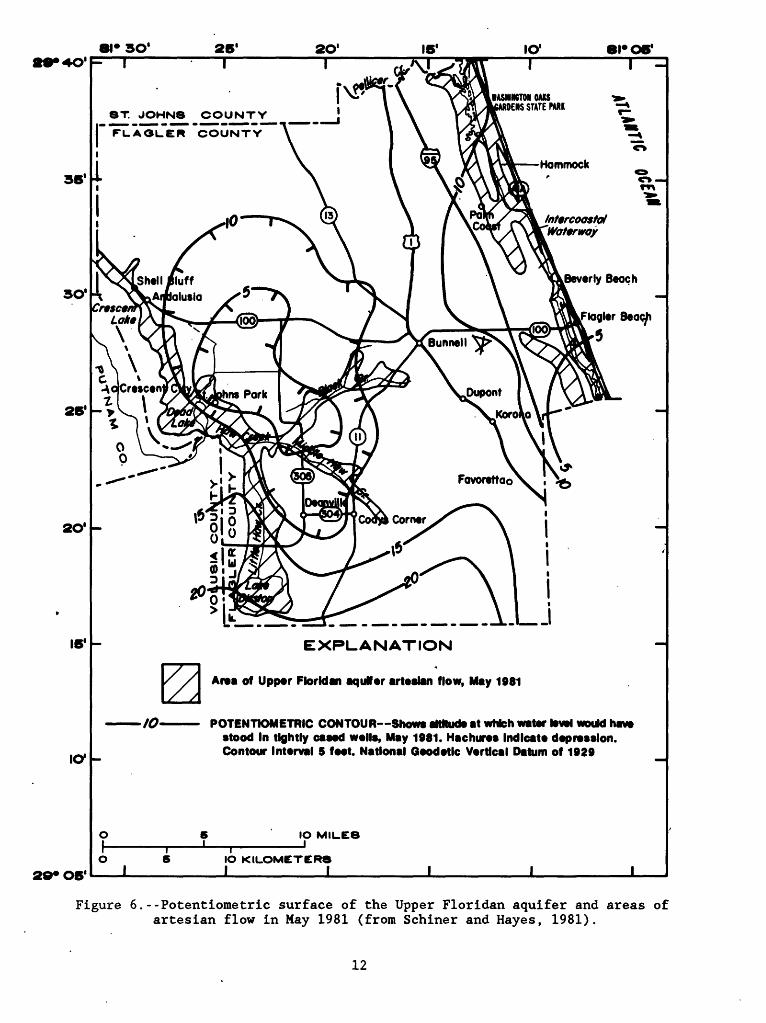
Recharge from the De Land Ridge is estimated to range from 0.9 in/yr to 2.6 in/yr (Rutledge, 1982, p. 58) in the area of northwest Volusia County that is immediately adjacent to Flagler County. The area directly to the south of Flagler County is estimated to have a recharge rate of approxi mately 1 in/yr (Tibbals, 1981, fig. 8). Rutledge (1982, p. 57) calculated that approximately 2.9 Mgal/d (million gallons per day) enters Flagler Coun ty from northwest Volusia County. The contours of the potentiometrie sur face in figure 6 indicate that the recharge from the west part of the county moves toward the discharge areas downstream of Lake Disston and the recharge to the central area of the county moves toward Favoretta and Bunnell.
Within Flagler County, recharge to the Upper Floridan aquifer is very low. Recharge rates in the Pamlico and Talbot Terrace areas may range from 0 to 1 in/yr (Tibbals, 1981, fig. 8). This is because of little or no dif ference in water levels in the different aquifer systems, and high levels of evapotranspiration in the swamps.
Water in the Upper Floridan aquifer is discharged within the county in topographically low areas along the Atlantic Coast, adjacent to Crescent Lake, and in the Haw Creek basin (fig. 6). Discharge in these areas occurs
11
30' 26' 2O1 16* IO1 81* OB'
36'
30'
26'
2O1
15'
IO1
29* O6*
8T JOHNS COUNTY "FLA"OLE"R" COUNTY
\L
EXPLANATION
Arsa of Uppsr FtorkJan aqutfar artaslan flow, May 1981
POTENTIOMETRIC CONTOUR Shows attNuda at whfch water tovrt wouM haw stood In tightly caaad walls, May 1981. Hachuras Indlcata daprasslon. Contour Intarval 5 faat. National Qaodatlc Vartical Datum of 1929
IO MILES I
IIO KILOMETERSI_________I I
Figure 6.--Potentiometric surface of the Upper Florldan aquifer and areas of artesian flow in May 1981 (from Schiner and Hayes, 1981).
12
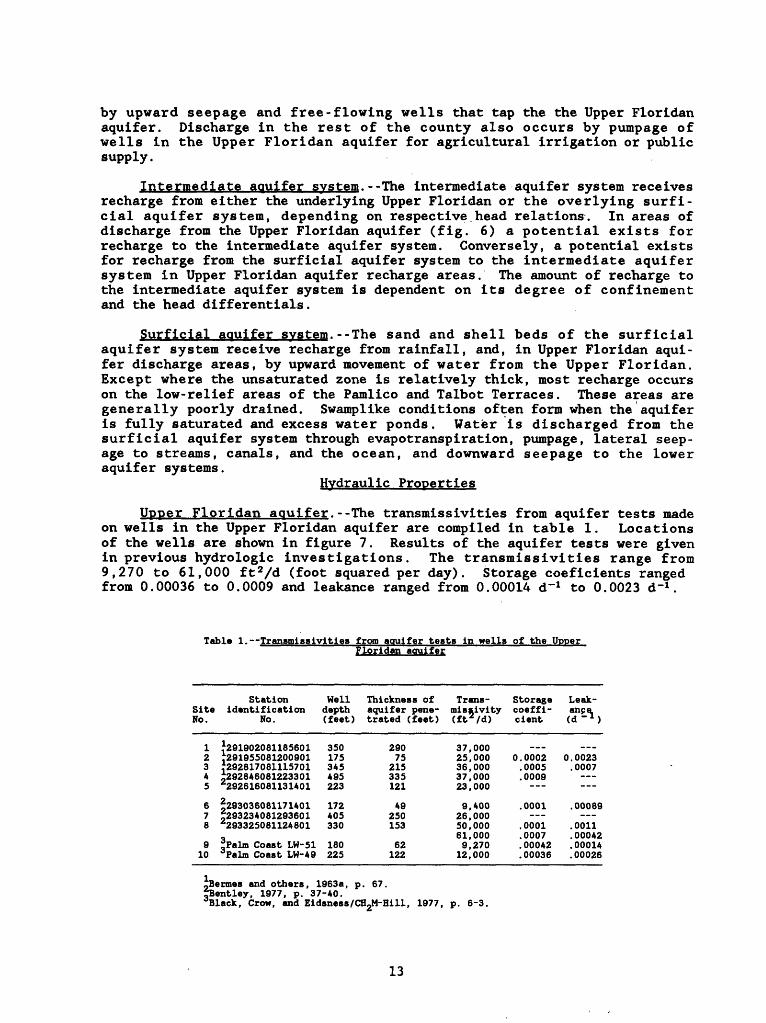
by upward seepage and free-flowing wells that tap the the Upper Floridan aquifer. Discharge in the rest of the county also occurs by pumpage of wells in the Upper Floridan aquifer for agricultural irrigation or public supply.
Intermediate aquifer system.--The intermediate aquifer system receives recharge from either the underlying Upper Floridan or the overlying surfi- cial aquifer system, depending on respective.head relations. In areas of discharge from the Upper Floridan aquifer (fig. 6) a potential exists for recharge to the intermediate aquifer system. Conversely, a potential exists for recharge from the surficial aquifer system to the intermediate aquifer system in Upper Floridan aquifer recharge areas. The amount of recharge to the intermediate aquifer system is dependent on its degree of confinement and the head differentials.
Surficial aquifer system.--The sand and shell beds of the surficial aquifer system receive recharge from rainfall, and, in Upper Floridan aqui fer discharge areas, by upward movement of water from the Upper Floridan. Except where the unsaturated zone is relatively thick, most recharge occurs on the low-relief areas of the Pamlico and Talbot Terraces. These areas are generally poorly drained. Swamp like conditions often form when the aquifer is fully saturated and excess water ponds. Water is discharged from the surficial aquifer system through evapotranspiration, pumpage, lateral seep age to streams, canals, and the ocean, and downward seepage to the lower aquifer systems.
Hydraulic Properties
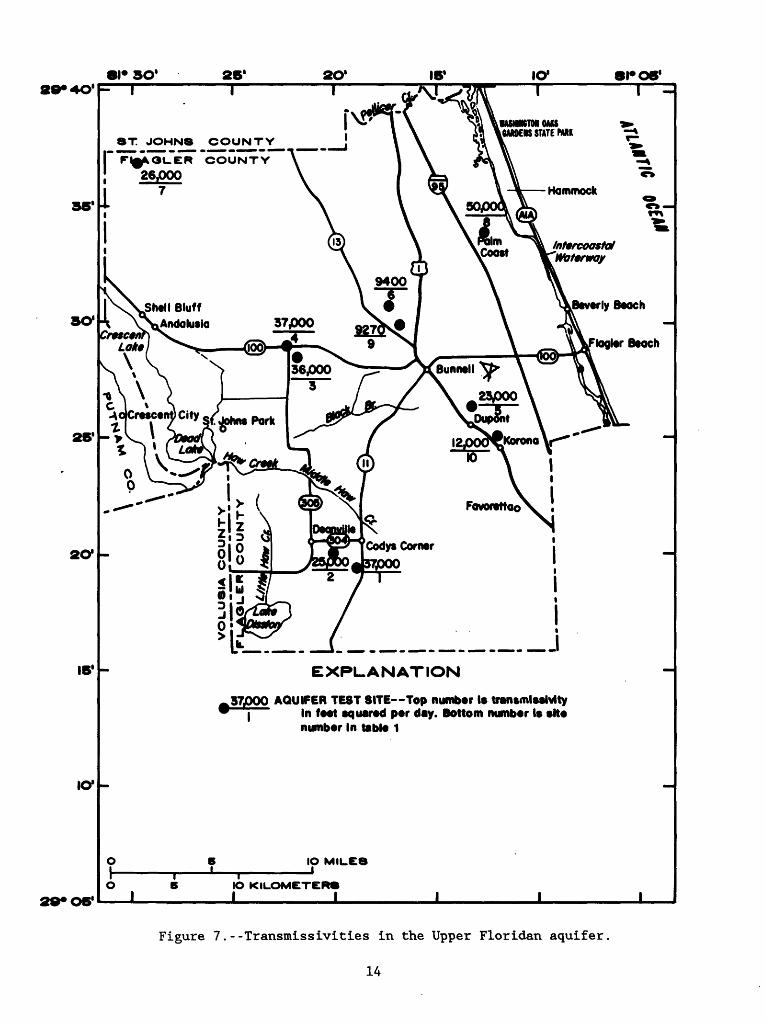
Upper Floridan aquifer. --The transmissivities from aquifer tests made on wells in the Upper Floridan aquifer are compiled in table 1. Locations of the wells are shown in figure 7. Results of the aquifer tests were given in previous hydrologic investigations. The transmissivities range from 9,270 to 61,000 ft 2/d (foot squared per day). Storage coeficients ranged from 0.00036 to 0.0009 and leakance ranged from 0.00014 d'1 to 0.0023 d"1 .
Table 1. Tranamiasivitiea from aquifer tests in wells of the UpperFloridan aquifer
StationSite identification No. No.
Hell Thickness ofdepth aquifer pene-(feet) trated (feet)
Trans- Storage Leak- mis si vity coeffi- anpa (ft z /d) cient (d' 1 )
12345
678
910
^291902081185601,291955081200901 3292817081115701,292846081223301"292616081131401
^293036081171401,293234081293601"293325081124801
^Palm Coast LW-51JPalm Coast LW-49
350175 345495223
172405330
180225
29075
215335121
49250153
62122
37,00025,000 36,00037,00023,000
9,40026,00050,00061,0009,27012,000
._.0.0002 .0005.0009
.0001___
.0001
.0007
.00042
.00036
...0.0023 .0007
.00089___
.0011
.00042
.00014
.00026
9Bermes and others, 1963a, p. 67."Bentley, 1977, p. 37-40.''Black, Crow, and Eidsness/CB2M-Hill, 1977, p. 6-3.
13
IN Q
H
l-S 8 w 9 h"
CO
CO 9 0> O l-S
h* a s
0-r
O
01-
'O
oi
PI PI-I
: PI
05
VO
LU
SIA
C
OU
NT
Y
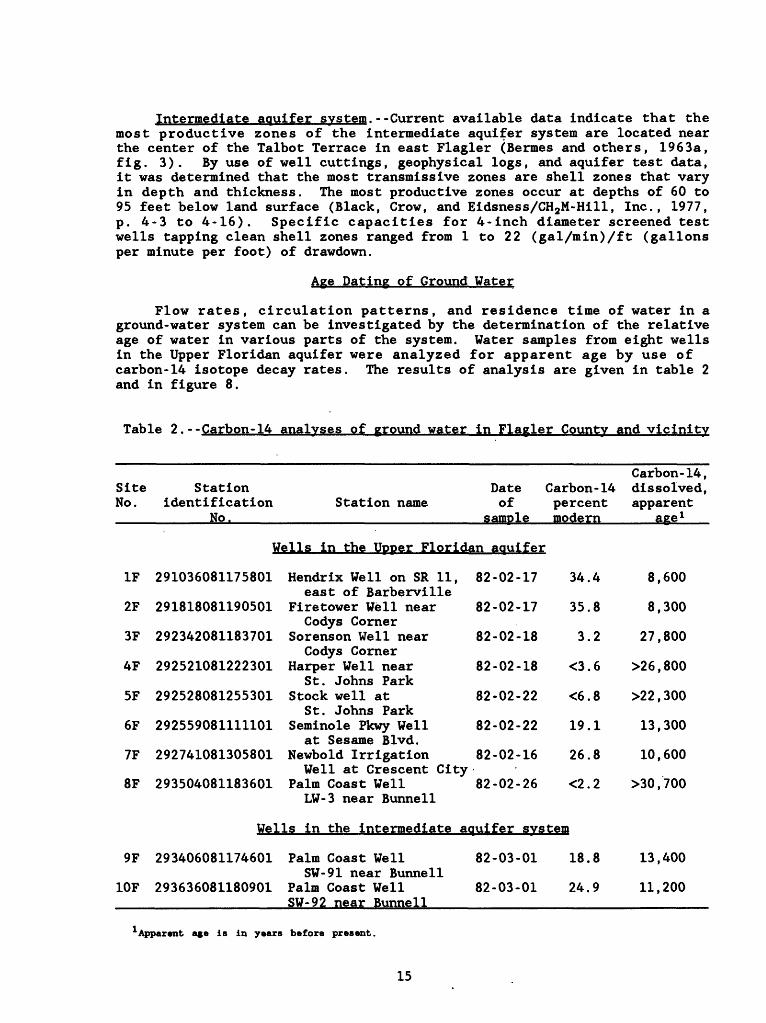
Intermediate aquifer system.--Current available data indicate that the most productive zones of the intermediate aquifer system are located near the center of the Talbot Terrace in east Flagler (Bermes and others, 1963a, fig. 3). By use of well cuttings, geophysical logs, and aquifer test data, it was determined that the most transmissive zones are shell zones that vary in depth and thickness. The most productive zones occur at depths of 60 to 95 feet below land surface (Black, Crow, and Eidsness/CH2M-Hill, Inc., 1977, p. 4-3 to 4-16). Specific capacities for 4-inch diameter screened test wells tapping clean shell zones ranged from 1 to 22 (gal/min)/ft (gallons per minute per foot) of drawdown.
Age Dating of Ground Water
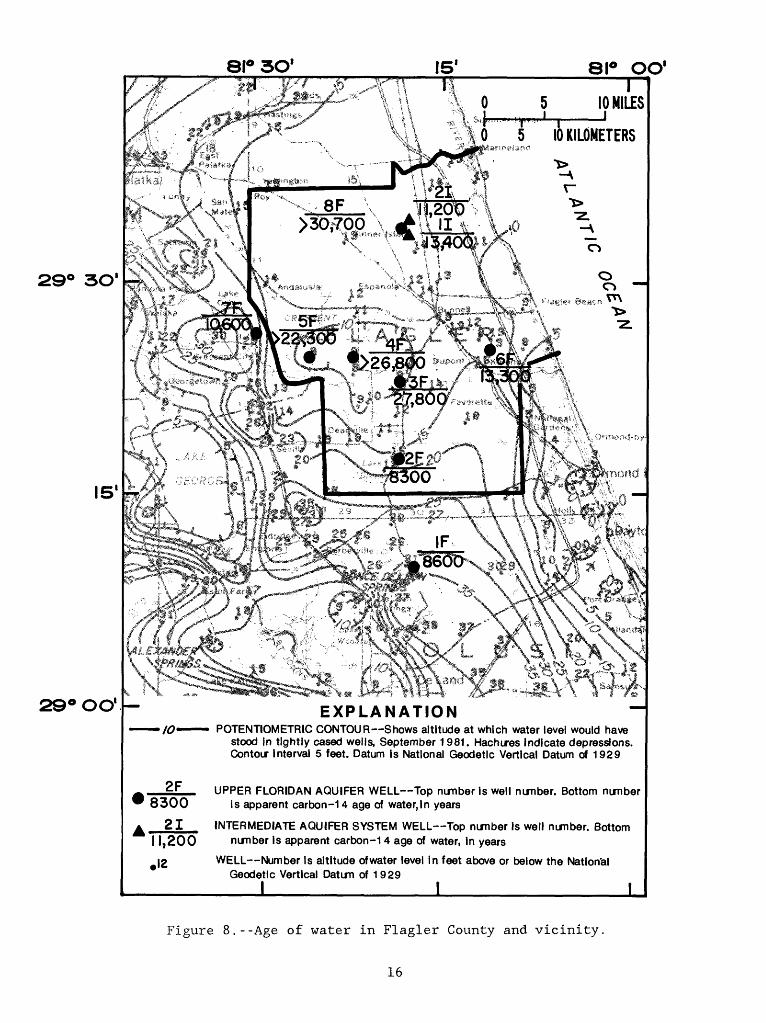
Flow rates, circulation patterns, and residence time of water in a ground-water system can be investigated by the determination of the relative age of water in various parts of the system. Water samples from eight wells in the Upper Floridan aquifer were analyzed for apparent age by use of carbon-14 isotope decay rates. The results of analysis are given in table 2 and in figure 8.
Table 2.--Carbon-14 analyses of ground water in Flagler County and vicinity
Carbon-14,Site Station Date Carbon-14 dissolved, No. identification Station name of percent apparent _________No.________________________sample modern_____age 1
Wells in the Upper Floridan aquifer
IF 291036081175801 Hendrix Well on SR 11, 82-02-17 34.4 8,600east of Barberville
2F 291818081190501 Firetower Well near 82-02-17 35.8 8,300Codys Corner
3F 292342081183701 Sorenson Well near 82-02-18 3.2 27,800Codys Corner
4F 292521081222301 Harper Well near 82-02-18 <3.6 >26,800St. Johns Park
5F 292528081255301 Stock well at 82-02-22 <6.8 >22,300St. Johns Park
6F 292559081111101 Seminole Pkwy Well 82-02-22 19.1 13,300at Sesame Blvd.
7F 292741081305801 Newbold Irrigation 82-02-16 26.8 10,600Well at Crescent City
8F 293504081183601 Palm Coast Well 82-02-26 <2.2 >30,700LW-3 near Bunnell
Wells in the intermediate aquifer system
9F 293406081174601 Palm Coast Well 82-03-01 18.8 13,400SW-91 near Bunnell
10F 293636081180901 Palm Coast Well 82-03-01 24.9 11,200 __________________SW-92 near Bunnell_____________________________
Apparent age is in years before present.
15
81° 3O1 15'
0s|
81° OO1T
10 MILES _i0 5 10 KILOMETERS
o
29° 3O1
15'
29° OO1EXPLANATION -
/O- - POTENTIOMETRIC CONTOUR -Shows altitude at which water level would have stood in tightly cased wells, September 1 981. Hachures indicate depressions. Contour interval 5 feet. Datum is National Geodetic Vertical Datum of 1929
2F UPPER FLORIDAN AQUIFER WELL--Top number is well number. Bottom number 8300 is apparent carbon -1 4 age of water, in years
21 INTERMEDIATE AQUIFER SYSTEM WELL--Top number is well number. Bottom 1 1,200 number is apparent carbon-1 4 age of water, in years
WELL Number is altitude of water level in feet above or below the National Geodetic Vertical Datum of 1 929
I ________ I I
12
Figure 8.--Age of water in Flagler County and vicinity
16
The youngest age water in the study area is near the De Land Ridge where most recharge that directly affects Upper Floridan aquifer water qual ity in Flagler County probably occurs. Well IF is in the high recharge area in Volusia County; wells 2F and 6F are immediately downgradient in Flagler County.
Well 7F is in the high recharge area on the Crescent City Ridge in Put- nam County, and well 5F is generally downgradient in Flagler County. The disparity in ages of the two sets of values probably indicates that most recharge from the Crescent City Ridge does not reach the interior of Flagler County but, rather, is discharged in the Crescent Lake discharge area, whereas recharge from the De Land Ridge does reach into Flagler County.
The remaining three wells in the Upper Floridan aquifer that were sam pled and analyzed for carbon-14 (wells 3F, 4F, and 8F) are in low recharge areas in the interior part of Flagler County. These wells yielded older age water which may indicate that little, recharge to the Upper Floridan occurs in Flagler County.
Two water samples from wells in the intermediate aquifer system in the northern part of the county were also dated. A comparison with Upper Flo ridan aquifer water from a nearby well showed that the intermediate aquifer system water is much younger (fig. 8). Apparently, the confining beds that overlie the intermediate aquifer system are permeable enough to allow re charge from the sand beds of the surficial aquifer system, but the recharge to the Upper Floridan aquifer in the north-central part of the county is negligible.
Water samples from the surficial aquifer system were not dated, but the age of most of the water in the sand and shell beds is probably very young. Possible exceptions would be where older Upper Floridan aquifer water dis charges into the surficial aquifer system.
WATER USE
Ground water in Flagler County is used for public supply and for agri culture. The county has no significant industrial or commercial water use. The municipalities and large developments in the county pump from both the intermediate aquifer system and Upper Floridan aquifer.
Pumpage for public supply water use is shown in table 3. At the cur rent usage of about 132 gal (gallons) per capita per day, approximately 7.2 Mgal/d would be required to support a population of 54,700 projected by the University of Florida for the year 2020 (Smith and Sincich, 1983).
The amount of ground water used for agriculture from 1979 to 1983 is more than three times that used for public and domestic supply (table 3). Of the water used for agriculture, 97.5 percent is withdrawn from the Upper Floridan aquifer. Surface water used mostly for livestock and irrigating turf grass accounts for the remainder of agricultural use.
17
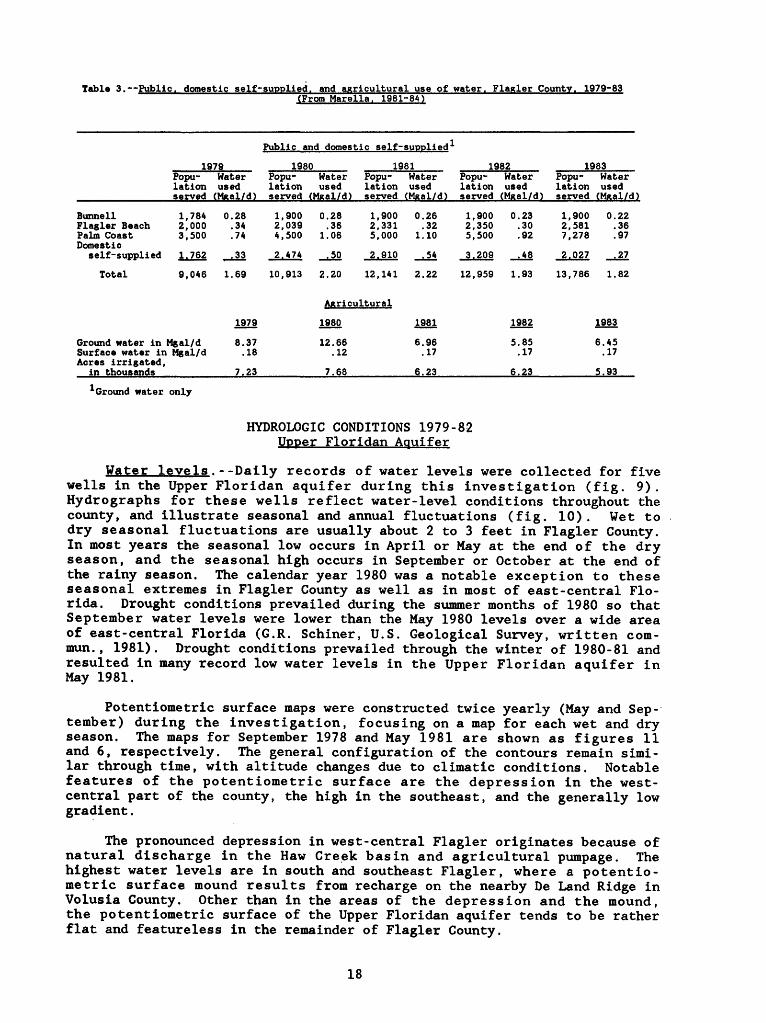
Table 3. Public, domestic self-supplied, and agricultural use of water. Flasler County. 1979-83(From Marella. 1981-84)
Public and domestic self-supplied 1
1979
BunnellFlagler BeachPalm CoastDomestic
self -supplied
Total
Populationserved
1,7842,0003,500
1.762
9,046
Waterused(Mxal/d)
0.28.34.74
.33
1.69
1980Populationserved
1,9002,0394,500
2.474
10,913
Waterused
(tfeal/d)
0.28.36
1.06
.50
2.20
1981Populationserved
1,9002,3315,000
2.910
12,141
Waterused(M*al/d)
0.26.32
1.10
.54
2.22
1982Populationserved
1,9002,3505,500
3.209
12,959
Waterused(Mjtal/d)
0.23.30.92
_^S
1.93
1983Populationserved
1,9002,5817,278
2.027
13,786
Waterused(Maal/d)
0.22.36.97
.27
1.82
Agricultural
Ground water in Mgal/d Surface water in Mgal/d Acres irrigated,
in thousands
1979
8.37 .18
7.23
1980
12.66.12
7.68
1981
6.96 .17
6.23
1982
5.85 .17
6.23
1983
6.45.17
5.93
Ground water only
HYDROLOGIC CONDITIONS 1979-82 Upper Floridan Aquifer
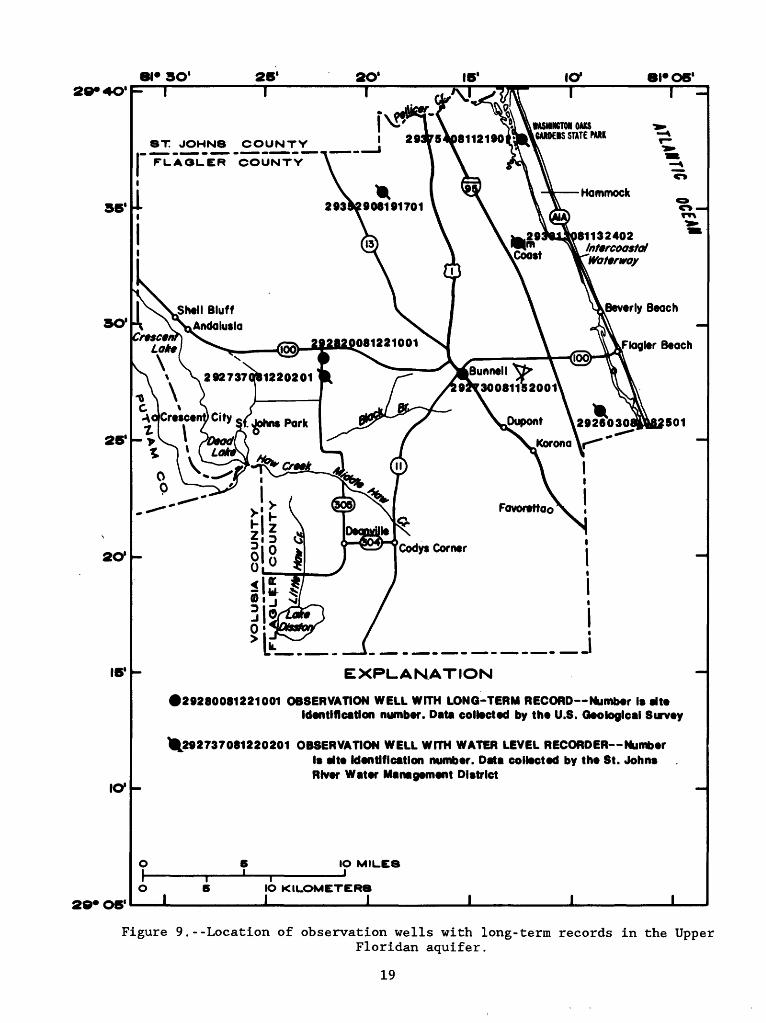
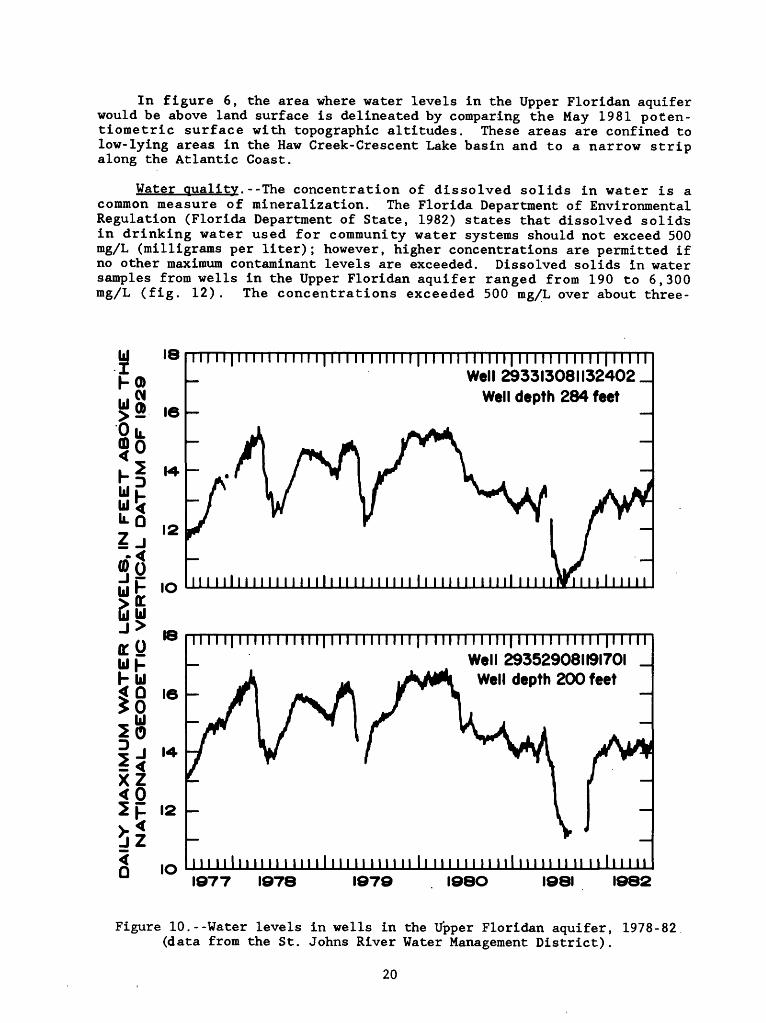
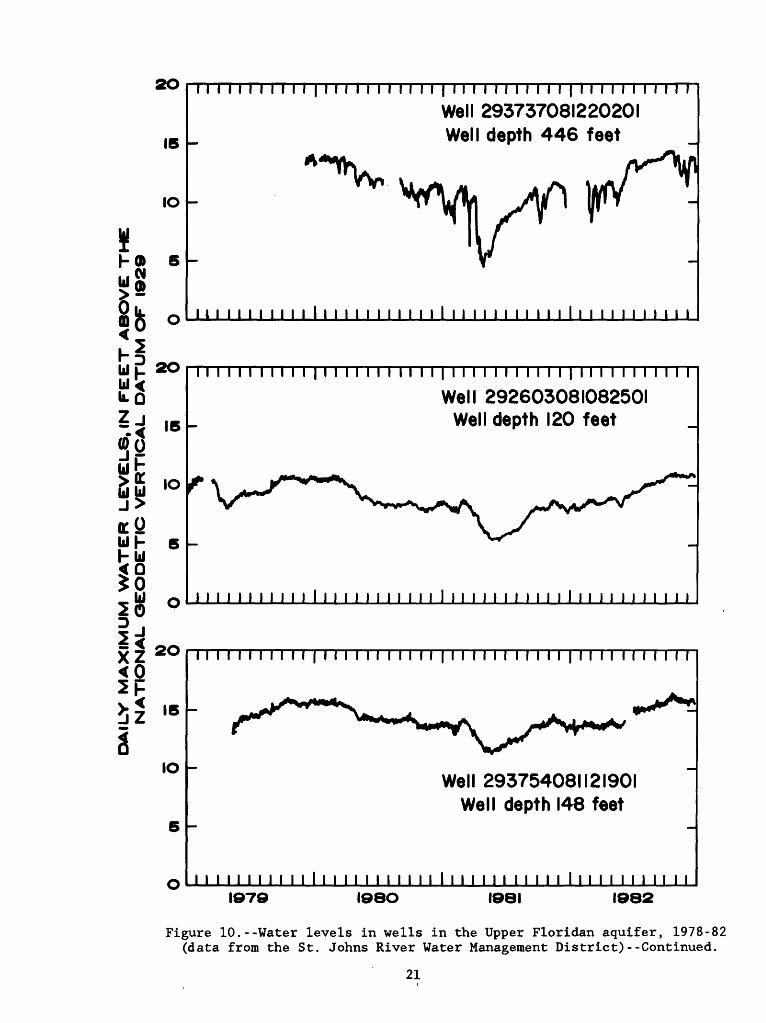
Water levels .--Daily records of water levels were collected for five wells in the Upper Floridan aquifer during this investigation (fig. 9). Hydrographs for these wells reflect water-level conditions throughout the county, and illustrate seasonal and annual fluctuations (fig. 10) . Wet to dry seasonal fluctuations are usually about 2 to 3 feet in Flagler County. In most years the seasonal low occurs in April or May at the end of the dry season, and the seasonal high occurs in September or October at the end of the rainy season. The calendar year 1980 was a notable exception to these seasonal extremes in Flagler County as well as in most of east-central Flo rida. Drought conditions prevailed during the summer months of 1980 so that September water levels were lower than the May 1980 levels over a wide area of east-central Florida (G.R. Schiner, U.S. Geological Survey, written com- mun. , 1981). Drought conditions prevailed through the winter of 1980-81 and resulted in many record low water levels in the Upper Floridan aquifer in May 1981.
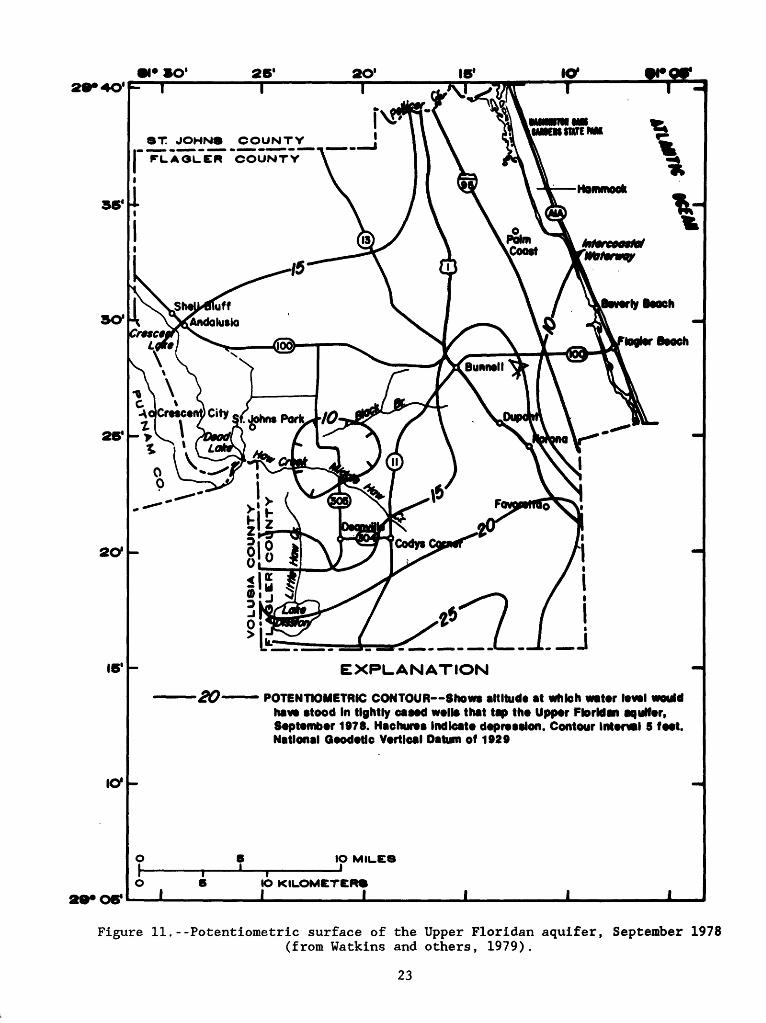
Potentiometric surface maps were constructed twice yearly (May and Sep tember) during the investigation, focusing on a map for each wet and dry season. The maps for September 1978 and May 1981 are shown as figures 11 and 6, respectively. The general configuration of the contours remain simi lar through time, with altitude changes due to climatic conditions. Notable features of the potentiometric surface are the depression in the west- central part of the county, the high in the southeast, and the generally low gradient.
The pronounced depression in west-central Flagler originates because of natural discharge in the Haw Creek basin and agricultural pumpage. The highest water levels are in south and southeast Flagler, where a potentio- metric surface mound results from recharge on the nearby De Land Ridge in Volusia County. Other than in the areas of the depression and the mound, the potentiometric surface of the Upper Floridan aquifer tends to be rather flat and featureless in the remainder of Flagler County.
18
81* SO' 26' 20* 16'29* 4O'
56'
SO'
26*
20'
IS1
IO1
29* OS*
81132402Intercoastol 'Waterway
Beverly Beach
f lagler Beach
ASWNtTM OAKS CAROEIS STATE PAIW
8T JOHNS COUNTY
FLAOLER COUNTY
Bunnell X>" 9^30081152001
Johns Pork o
ei*O6' I "
501
_JEXPL.AMATION
29280081221001 OBSERVATION WELL WITH LONG-TERM RECORD Number Is elte Identification number. Data collected by the U.S. Geological Survey
\^292737081220201 OBSERVATION WELL WITH WATER LEVEL RECORDER Numberla alte Identification number. Data collected by the St. John* . River Water Management Dlatrlct
IO MILES
IO KILOMETERS I____________I I I
Figure 9.--Location of observation wells with long-term records in the UpperFloridan aquifer.
19
In figure 6, the area where water levels in the Upper Floridan aquifer would be above land surface is delineated by comparing the May 1981 pot en- tiometric surface with topographic altitudes. These areas are confined to low-lying areas in the Haw Creek-Crescent Lake basin and to a narrow strip along the Atlantic Coast.
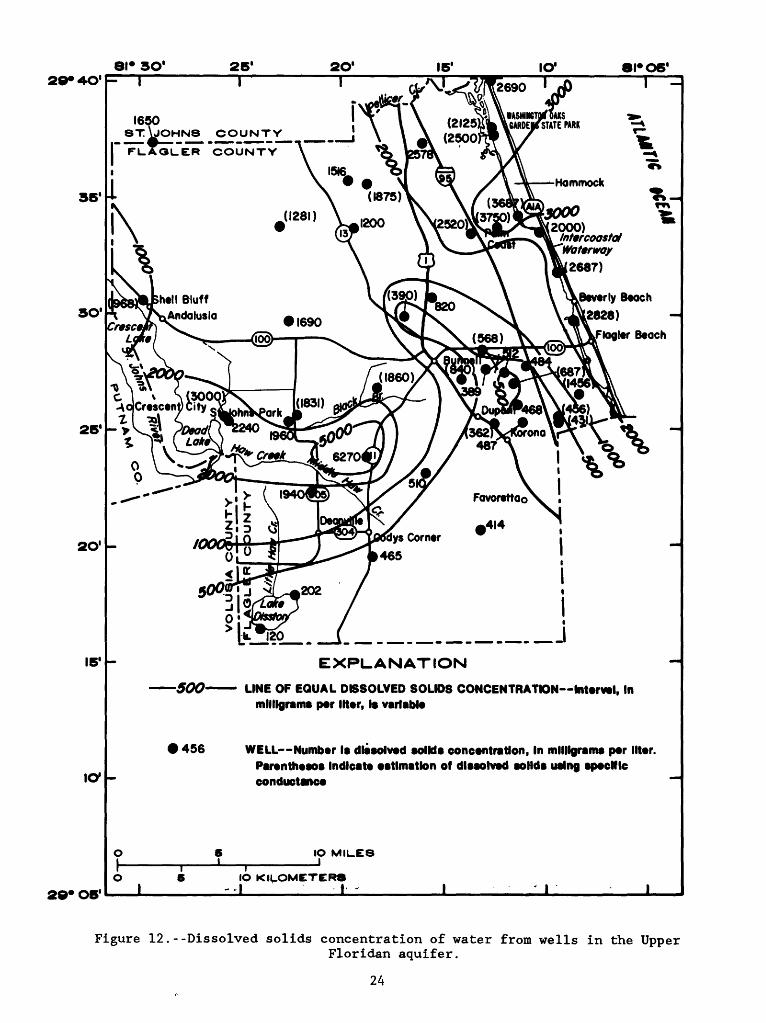
Water quality.--The concentration of dissolved solids in water is a common measure of mineralization. The Florida Department of Environmental Regulation (Florida Department of State, 1982) states that dissolved solid's in drinking water used for community water systems should not exceed 500 mg/L (milligrams per liter); however, higher concentrations are permitted if no other maximum contaminant levels are exceeded. Dissolved solids In water samples from wells in the Upper Floridan aquifer ranged from 190 to 6,300 mg/L (fig. 12). The concentrations exceeded 500 mg/L over about three-
18
hOj
^3 16
30
Zj
3*o:0 uhhlil
2 -J - <
5?:zI
MI-
IO
18
16
TI | I I 11 FTTI I I I I I I | I II II I 11 I II | I I I I I I 11 I II | I I I I I I I I I I I I I I I I I
Well 293313081132402 J Well depth 284 feet
1111111111111111111 n 1111111111111111 M 11111111 MM 111111111
12
10
11 I I l| I I I II I I Ml l| I I I I I I I I II I | I I II 11 I I 1111 II IT IT I Till 11 I III
Well 293529081191701 J Well depth 200 feet
III II III INI I INI I Ml II I Ml II 11 II II I I II III II I II II II I I 11 I I II 1977 1978 1979 I98O 1981 1982
Figure 10.--Water levels in wells in the Upper Floridan aquifer, 1978-82 (data from the St. Johns River Water Management District).
20
20
15
IO
hft 5
0 o
I I I I I I I II I I | I I I I I I I I I I I | I I I I I I I I I I I | I I I I I I I I I I I
Well 293737081220201 Well depth 446 feet
I i I I I I I I I I I I I I I I I I I I I M I I I I I I I I I I I I I I I I I I I I I I I I
Uj- 2O
LQ Zj |S«?S
IO
I I I M I M I I I | I I I I I I I I I I I | I I I I I I I I I I I | I I I I I I I I I I I
Well 292603081082501 Well depth 120 feet
I I I I I I I M I I I I M I I I M I I I I I I I I I I I I I I I I I I I I I I I I I I I
<0
IO
IT mil MI M i i i i i i i i i i i i i i i i i i i i i i i i i i i i i i i
Well 293754081121901 Well depth 148 feet
I I I I I I I I I I I I I I I I I I I I I I I I M 1 LJ I I I I I I I M I I I I I 1 I I I
1979 I98O 1981 1982
Figure 10.--Water levels in wells in the Upper Floridan aquifer, 1978-82 (data from the St. Johns River Water Management District)--Continued.
21
quarters of the county. Lowest concentrations are in southeast Flagler generally coincident with the potentiometric surface high related to re charge that enters the county from the De Land Ridge. The highest concen trations are in or near discharge areas along the coast and in west-central Flagler.
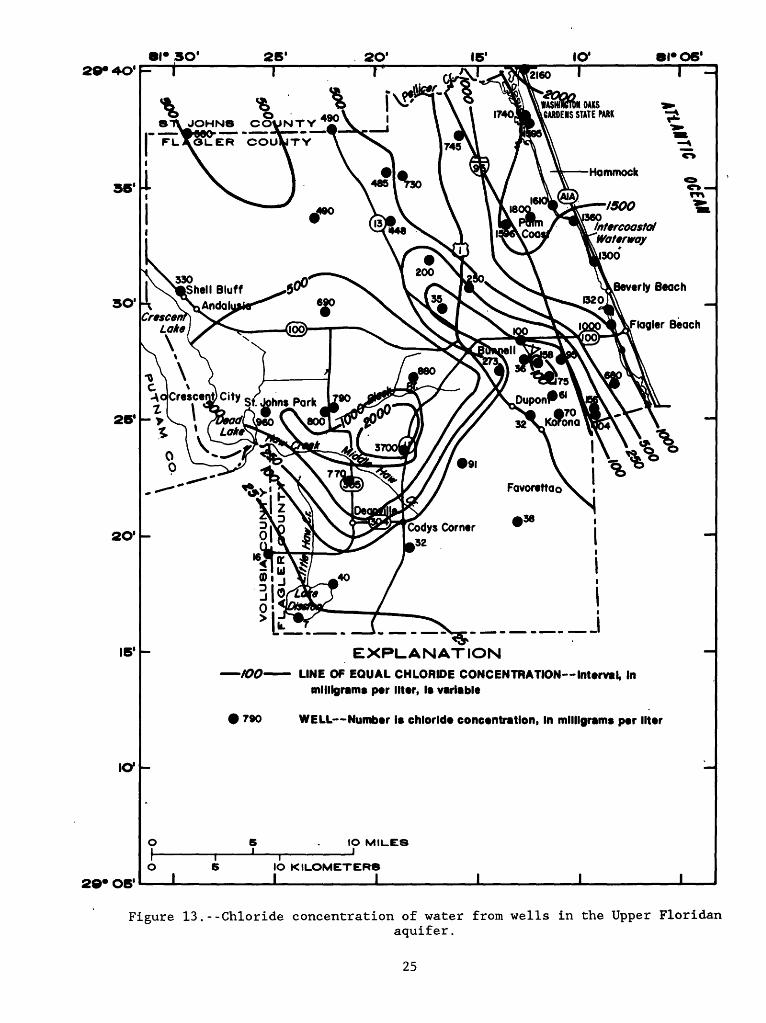
Chloride is a major constitutent of dissolved solids in coastal Flori da. Its concentration is used as an indicator of the extent of saltwater intrusion or amount of remnant seawater in an aquifer. The recommended max imum chloride concentration for public water supplies is 250 mg/L (Florida Department of State, 1982). Chloride concentrations ranged from less than 7 mg/L in southwest Flagler to 3,700 mg/L in west-central Flagler (fig. 13).
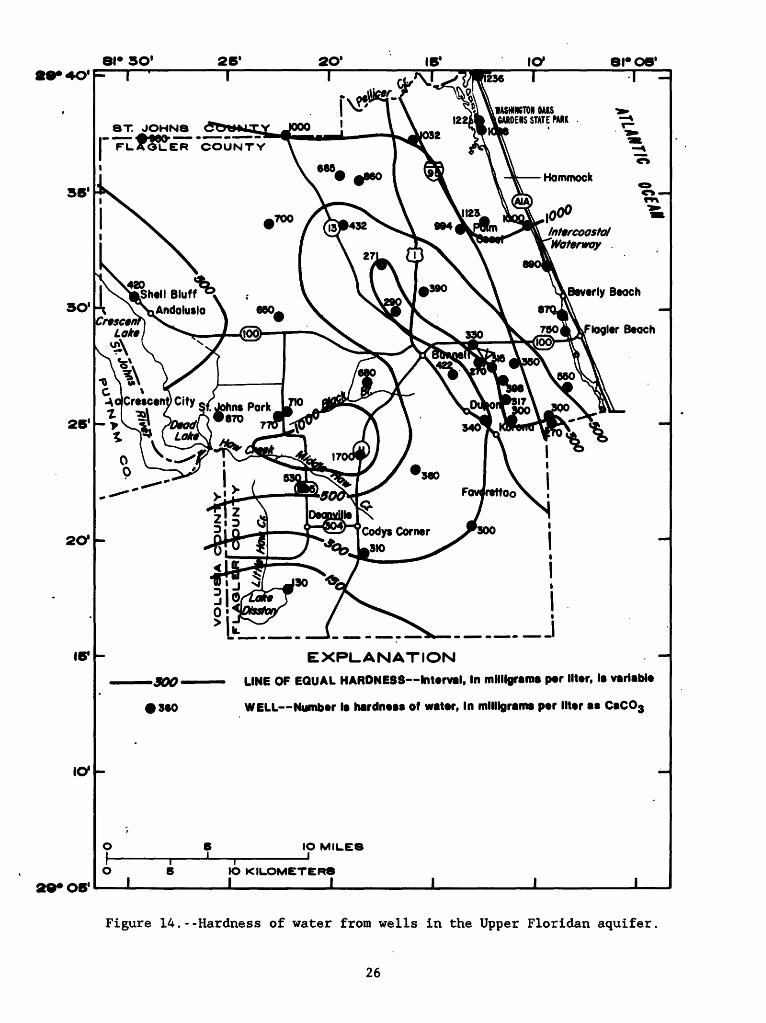
Hardness of water is due principally to the cations calcium and mag nesium. Hard water may have detrimental effects such as causing excessive soap consumption and the formation of encrustations or boiler scale (U.S. Environmental Protection Agency, 1977a). Water from the Upper Floridan aquifer in Flagler County (fig. 14) is very hard (greater than 300 mg/L as calcium carbonate) except in the southern part where the water is moderately hard to hard (75-300 mg/L as calcium carbonate).
Sulfate in water is generally associated with remnant seawater in an aquifer or from dissolution of minerals, such as gypsum or anhydrite, that are commonly found in carbonate rocks. Higher sulfate concentrations are generally coincident with the highest dissolved solids in the county; that is, in discharge areas in west-central Flagler and along the coast. How ever, the proportionality between sulfate and dissolved solids is different between the water in west-central Flagler and the coastal area. Water in the coastal area has a greater proportion of sulfate and is more likely to be from remnant sea water than dissolved minerals.
High iron concentration in water is generally considered undesirable to taste and causes rust-colored stains on clothing, plumbing fixtures, and other materials. The occurrence of iron in the Upper Floridan aquifer in Flagler County is quite variable.
Intermediate Aquifer System
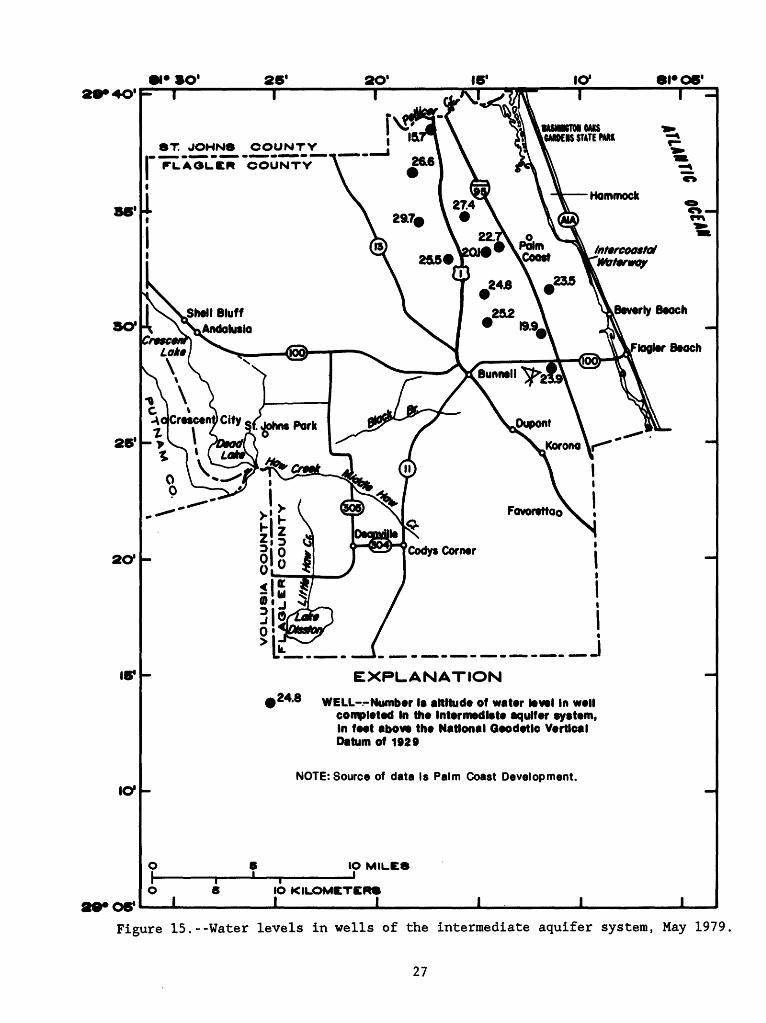
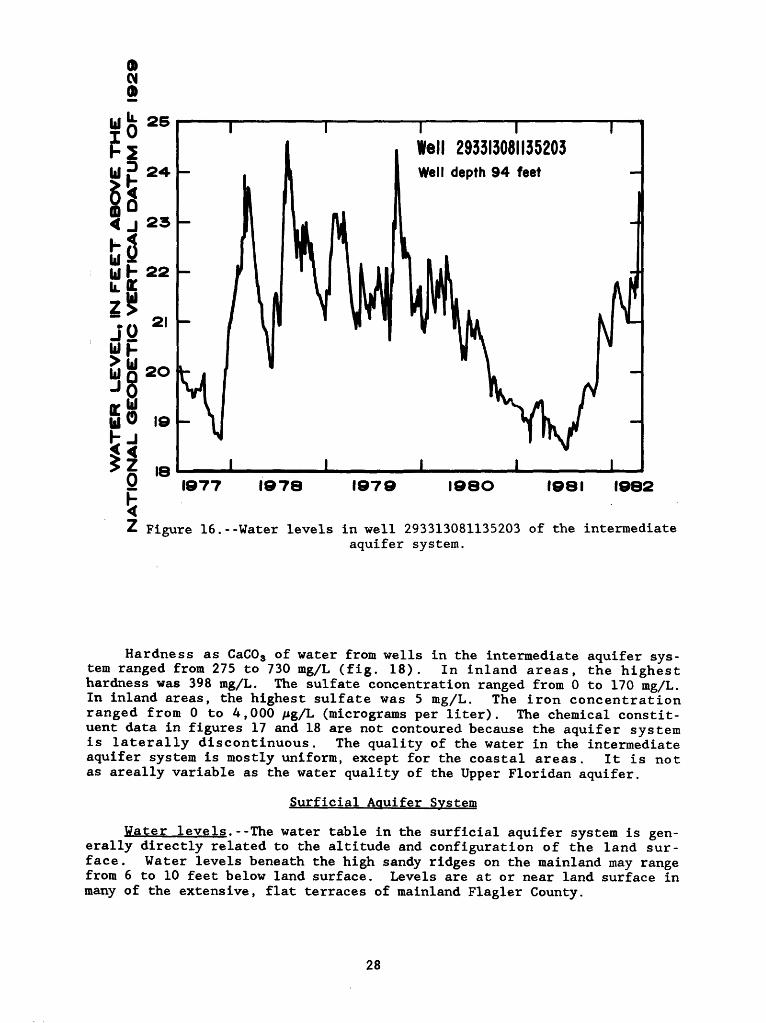
Water levels.--Figure 15 shows the water levels measured in wells of the intermediate aquifer system during May 1979. A contour map of the potentiometric surface was not drawn because of the lenticular nature of individual beds. Water levels in wells tapping the intermediate aquifer system are near land surface but wells usually do not flow except when levels are very high. Figure 16 is a continuous hydrograph of a well in the intermediate aquifer system from 1978 to 1982. The generally large and frequent fluctuations throughout the period of record is noticeable. The range in fluctuation from 1979 to 1982 was approximately 0 to 6 feet.
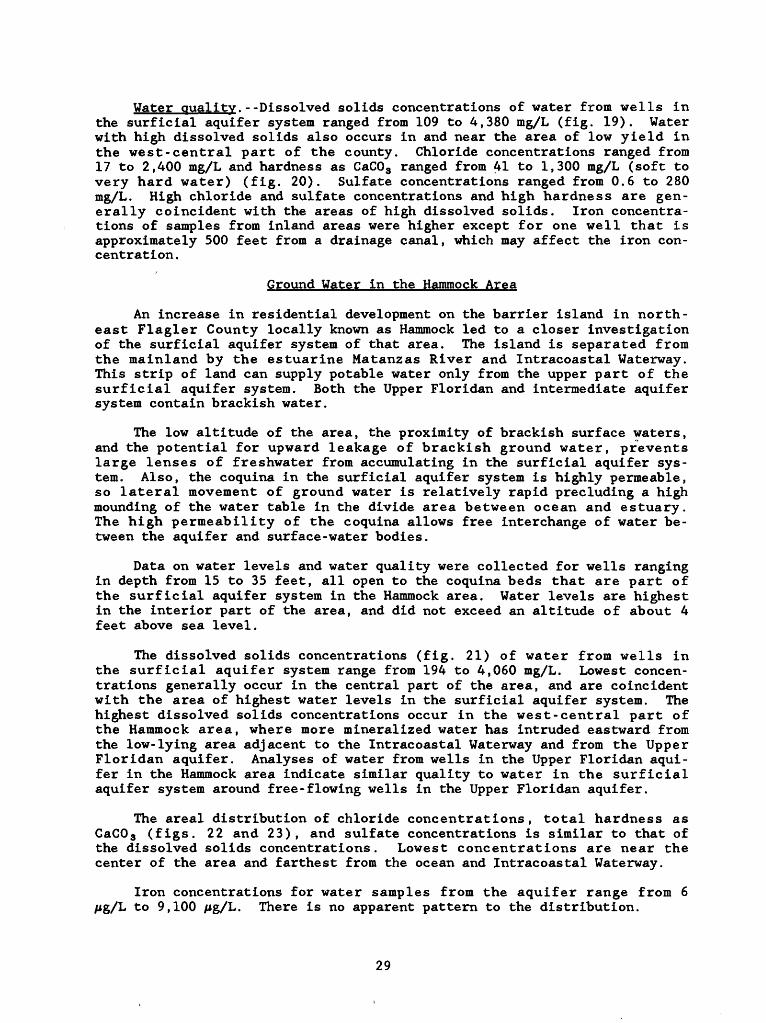
Water quality.--The dissolved solids concentration of water from wells in the intermediate aquifer system ranged from 290 to an estimated 2,000 mg/L (fig. 17). In noncoastal areas, the highest dissolved solids concen tration was 620 mg/L. The chloride concentration of water samples from wells in the intermediate aquifer system ranged from 21 to 1,230 mg/L (fig. 18). In inland areas the highest chloride concentration was 119 mg/L.
22
2B1 20'
SB1
SO1
25'
IB1
29* OB*
ST JOHNS COUNTY M^MW W^HW ̂^^^» «» ^^M *
FLAOUER COUNTY
.-J
EXPLANATION
-20- POTENTIOMETRIC CONTOUR Shows altitude at which wator (oval would haw stood In tightly caaad walls that tap tha Uppor FtorMan aquifer, Soptambor 1978. Hachurss Indteato doprosslon. Contour Interval 8 foot. National Qsodotlc Vortical Datum of 1929
10 MII.CS
IO KILOMETERSI_________I I I I
Figure 11.--Potentiometric surface of the Upper Floridan aquifer, September 1978(from Watkins and others, 1979).
23
L
81* 3O' 25' 2O'
35'
30'
25'
20'
15'
29* OS1
10'
STATE PARK
Hammock
2000) Intorcoasto/ Waterway
2687)
Beverly Beach
28)
togler Beach
ST \JOHNS COUNTY
FLAOLER COUNTY
ros' I ^
_JEXPLANATION
456
LINE op EQUAL DISSOLVED SOLIDS CONCENTRATION Interval, In milligrams per liter, Is variable
WELL Number Is dissolved solids concentration, In milligrams per liter. Parentheses Indicate estimation of dissolved solids using specific conductance
IO MILES
10 KILOMETERS J_______ I
Figure 12.--Dissolved solids concentration of water from wells in the UpperFloridan aquifer.
24
ir so1 26' 20'29* 40'
35'
30'
26'
2O'
15'
29* 06'
Hammock
[ntercoastol 'Waterway
300
Beverly Beach
Flagler Beach
JOHNS COUNTY 900
FLAGL.ER COUNTY
I* OS'| -
EXPLANATION-IOO LINE OF EQUAL CHLORIDE CONCENTRATION Interval, In
milligrams per liter, Is variable
I 790 WELL Number Is chloride concentration, In milligrams per liter
IO MILES I
10 KILOMETERSI____ _I I I I
Figure 13.--Chloride concentration of water from wells in the Upper Floridanaquifer.
25
81* SO' 26' 2O129*40'
16'
56'
50'
26'
20'
16'
I01
20*06'
ST JOHNS frfflfr^ .____
FLAOL.ER COU
Intercoastd 'Waterway .
Beverly Beach
tagler Beach
tASMNTON OAKS CARDENS STATE PARK
ei'oe' T ^
seo
EXPLANATION
LINE OF EQUAL HARDNESS Interval, In milligrams per liter, Is variable
WELL Number Is hardness of water, In milligrams per liter as CaCO3
IO MILES
IO KILOMETERSI_________I
Figure 14.--Hardness of water from wells in the Upper Floridan aquifer,
26
29* 4O'26' 20' IB1 icy SI* 06'
SO1
26'
16*
icy
29*06'
T. JOHNS COUNTY TLAOLJER COUNTY
UMHKTN vNK MMEK STATE MM
0
,24.8EXPLANATION
WELL -Number Is altitude of water level In well completed In the Intermediate aquifer system, In foot above the National Geodetic Vertical Datum of 1929
NOTE: Source of data is Palm Coast Development.
IO MILES
IO KILOMETERSI_________I
Figure 15.--Water levels in wells of the intermediate aquifer system, May 1979
27
25
23
22
21
2O
18
I I I
Well 293313081135203Well depth 94 feet
1977 1978 1979 I98O 1981 1982
Figure 16.--Water levels in well 293313081135203 of the intermediateaquifer system.
Hardness as CaC03 of water from wells in the intermediate aquifer sys tem ranged from 275 to 730 mg/L (fig. 18). In inland areas, the highest hardness was 398 mg/L. The sulfate concentration ranged from 0 to 170 mg/L. In inland areas, the highest sulfate was 5 mg/L. The iron concentration ranged from 0 to 4,000 A*g/L (micrograms per liter). The chemical constit uent data in figures 17 and 18 are not contoured because the aquifer system is laterally discontinuous. The quality of the water in the intermediate aquifer system is mostly uniform, except for the coastal areas. It is not as areally variable as the water quality of the Upper Floridan aquifer.
Surficial Aquifer System
Water levels.--The water table in the surficial aquifer system is gen erally directly related to the altitude and configuration of the land sur face . Water levels beneath the high sandy ridges on the mainland may range from 6 to 10 feet below land surface. Levels are at or near land surface in many of the extensive, flat terraces of mainland Flagler County.
28
Water quality.--Dissolved solids concentrations of water from wells in the surficial aquifer system ranged from 109 to 4,380 mg/L (fig. 19). Water with high dissolved solids also occurs in and near the area of low yield in the west-central part of the county. Chloride concentrations ranged from 17 to 2,400 mg/L and hardness as CaC03 ranged from 41 to 1,300 mg/L (soft to very hard water) (fig. 20). Sulfate concentrations ranged from 0.6 to 280 mg/L. High chloride and sulfate concentrations and high hardness are gen erally coincident with the areas of high dissolved solids. Iron concentra tions of samples from inland areas were higher except for one well that is approximately 500 feet from a drainage canal, which may affect the iron con centration.
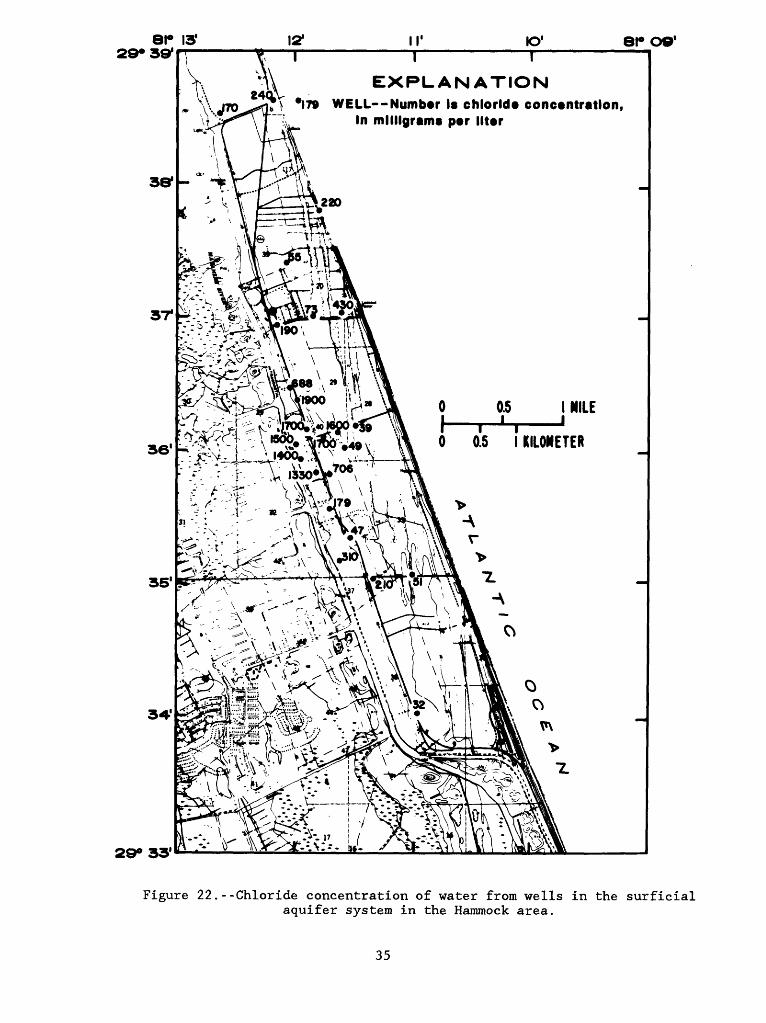
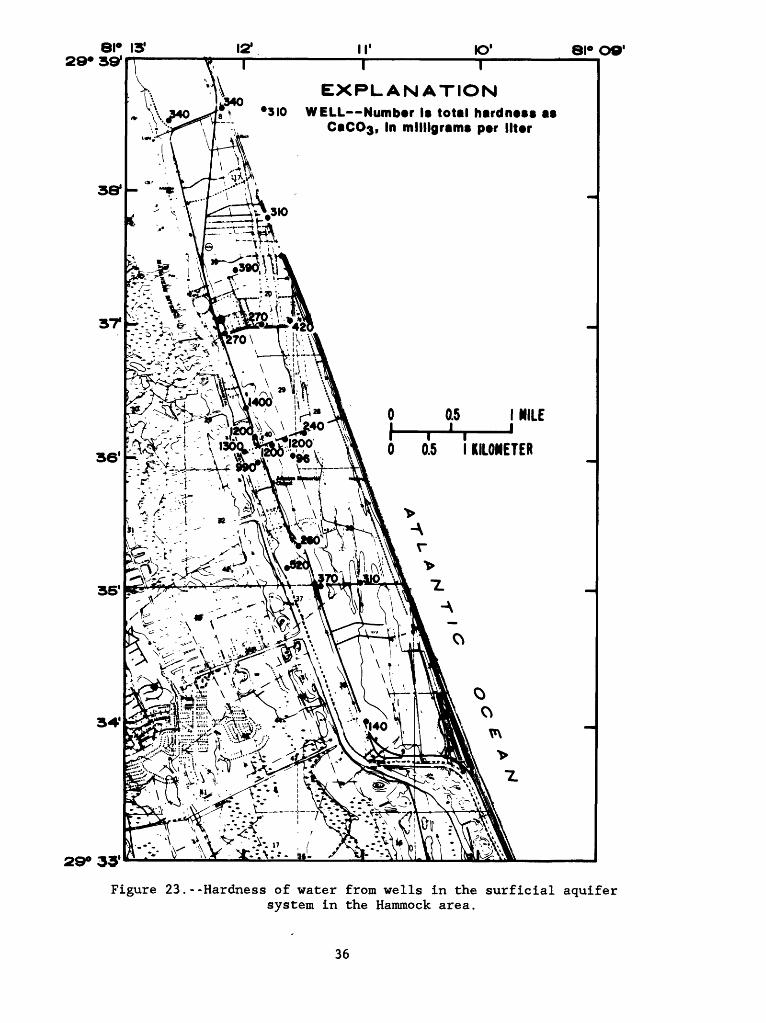
Ground Water in the Hammock Area
An increase in residential development on the barrier island in north east Flagler County locally known as Hammock led to a closer investigation of the surficial aquifer system of that area. The island is separated from the mainland by the estuarine Matanzas River and Intracoastal Waterway. This strip of land can supply potable water only from the upper part of the surficial aquifer system. Both the Upper Floridan and intermediate aquifer system contain brackish water.
The low altitude of the area, the proximity of brackish surface waters, and the potential for upward leakage of brackish ground water, prevents large lenses of freshwater from accumulating in the surficial aquifer sys tem. Also, the coquina in the surficial aquifer system is highly permeable, so lateral movement of ground water is relatively rapid precluding a high mounding of the water table in the divide area between ocean and estuary. The high permeability of the coquina allows free interchange of water be tween the aquifer and surface-water bodies.
Data on water levels and water quality were collected for wells ranging in depth from 15 to 35 feet, all open to the coquina beds that are part of the surficial aquifer system in the Hammock area. Water levels are highest in the interior part of the area, and did not exceed an altitude of about 4 feet above sea level.
The dissolved solids concentrations (fig. 21) of water from wells in the surficial aquifer system range from 194 to 4,060 mg/L. Lowest concen trations generally occur in the central part of the area, and are coincident with the area of highest water levels in the surficial aquifer system. The highest dissolved solids concentrations occur in the west-central part of the Hammock area, where more mineralized water has intruded eastward from the low-lying area adjacent to the Intracoastal Waterway and from the Upper Floridan aquifer. Analyses of water from wells in the Upper Floridan aqui fer in the Hammock area indicate similar quality to water in the surficial aquifer system around free-flowing wells in the Upper Floridan aquifer.
The areal distribution of chloride concentrations, total hardness as CaC0 3 (figs. 22 and 23), and sulfate concentrations is similar to that of the dissolved solids concentrations. Lowest concentrations are near the center of the area and farthest from the ocean and Intracoastal Waterway.
Iron concentrations for water samples from the aquifer range from 6 Aig/L to 9,100 A»g/L. There is no apparent pattern to the distribution.
29
I* SO* 28* 20* IB* 10-
SO1
25*
ao1
18*
* OB1
si* orI
T JOHNS COUNTY "COUNTY
MSMMiMMB CMKIS STATE MM
__J
EXPLANATION
482 WELL Numbar ! dlaaotvad soNda concentration In mNNgrama par Mar of watar from walla In tha Intarmadlata aqulfar ayatam. Paranthaaaa Indloata aatfmatfon of dlaaolvad aolMa uakig pacific eonduetanaa
10 MILCI
IO KILOMCTERaj
Figure 17.--Dissolved solids concentration of water from wells in the intermediateaquifer system.
30
3O' 25* 2O1 16' 10*
35'
30'
25*
2O'
16'
icy
29* 06'
1*06'I
ST JOHNS COUNTY
FLAGLER COUNTY
300
EXPLANATIONWELL Top numbsr Is chlorlds concentration
In mHllgrama psr lltsr. Bottom numbsr Is hardnsss In milligrams psr lltsr as CaCO3
IO
IO KILOMETERSI_________I
Figure 18.--Chloride concentration and hardness of water from wells in theintermediate aquifer system.
31
!! 3O1 25' 2O1 15*
35'
30'
25*
2O'
15*
I01
2Q« OS1
( OS*
ST JOHNS COUNTY "FLA~GL~ER COUNTY
mttrcoostot Waterway
330
Beverly Beoch
logler Beach
EXPLANATION
Area of detailed study on the barrier Island
Approximate area where well yields In the surf Ictal aquifer system are less than 2 gallons per minute
1 430 WELL Number Is dissolved solids concentration In milligrams per liter of water from wells In the surftelal aquifer system. Parentheses Indicate estimation of dissolved solids using specific conductance
6 IO MILES
IO KILOMETERSI_________I
Figure 19.--Dissolved solids concentration of water from wells in the surficialaquifer system.
32
er so1 2B1 2O1 IB1 I0129* 4O*
35*
30'
25*
2O'
IB1
I01
29* OS1
81* OB'
I
ST. JOHNS COUNTY
FLAGLER COUNTY
i Hammockcv rr> *
Intercoastal 'Waterway
1100 ~W
Beverly Beach
Flagler Beach
EXPLANATION
Area of detailed study on the barrier Island
Approximate area where well yields In the surfIclal aquifer system are less than 2 gallons per minute
> 50 WELL Top number Is chloride concentration In milligrams per liter. 300 Bottom number Is hardness In milligrams per liter as CaC(>3
IO MILES
IO KILOMETERSI_________I I I I
Figure 20.--Chloride concentration and hardness of water from wells in the surficialaquifer system.
33
81° 29*39*
81° O9'
381
EXPLANATION8 Y *3K> WELL Number Is dissolved solids
concentration, In milligrams par lltar
Figure 21. Dissolved solids concentration of water from wells in the surficial aquifer system in the Hammock area.
34
SI4 O9'I I
EXPLANATION *I79 WELL Numbtr Is chlorldt conctntratlon,
In milligrams ptr llttr
29° 33'
Figure 22.--Chloride concentration of water from wells in the surficial aquifer system in the Hammock area.
35
81° 13'29*39'
81° O9'
381
29°
EXPLANATION8 *3IO WELL Numbsr Is total hardnsss as
CaCO*, In milligrams psr lltsr
I|^>^
:.^^f-.-.,x^_-
Figure 23.--Hardness of water from wells in the surficial aquifersystem in the Hammock area.
36
The data indicate that quality of water in the surficial aquifer system is variable and depends on proximity to the ocean, estuary, or the free- flowing wells in the Upper Floridan aquifer. The freshest ground water oc curs in a north-south trending zone in the center of the area, and farthest from the ocean, estuary, or the free-flowing wells. The use of the upper part of the surficial aquifer system may be limited by its vulnerability to pollution by sources of poor quality water that may be introduced to the canals, abandoned coquina pits, or to the land surface.
EFFECTS OF MAN'S USE ON HYDROLOGY Hydrologic Changes Since the 1950's
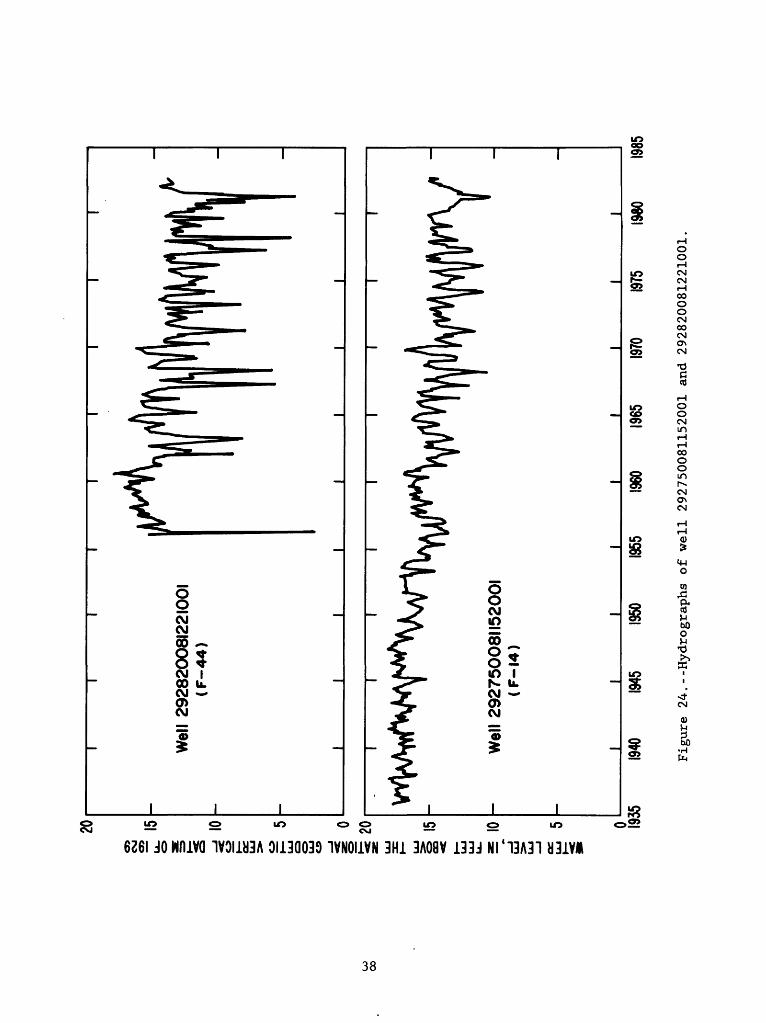
The Upper Floridan aquifer water-level and water-quality data collected by Bermes and others (1963a) provide an opportunity to compare and contrast early 1980's hydrogeologic conditions to those of the late 1950's. Long- term records from two observation wells in Flagler County (fig. 9) are available from March 1936 to the present for well 292750081152001 (F-14) located at Bunnell, and January 1956 to the present for well 292820081221001 (F-44) located approximately 7 miles west of Bunnell.
Long-term trends of water-level decline are apparent in each hydrograph in figure 24. The longest record (well F-14) shows that water levels de clined from a 1936-50 mean annual water level of approximately 17 feet above sea level to a 1951-82 mean level of slightly less than 14 feet above sea level. The hydrograph of well F-44 shows a decline of approximately 2 feet in mean annual water level from 1956-82.
Another trend shown by the hydrographs is an increase in annual water level fluctuations. For well F-14, the annual fluctuation is approximately 2 feet for the period 1936 to 1960. After 1960, the annual fluctuation in creased to 3 to 4 feet. Well F-44 shows marked annual variations of as much as 10 feet during dry years. The change in annual water level fluctuation is probably due to climatic trends or to increased dry-season irrigation. The fluctuations in well F-44, in an agricultural area, are more pronounced than that of well F-14, with extreme low-water levels coincident with the dry season and with crop irrigation. Well F-14 is not in an agricultural area.
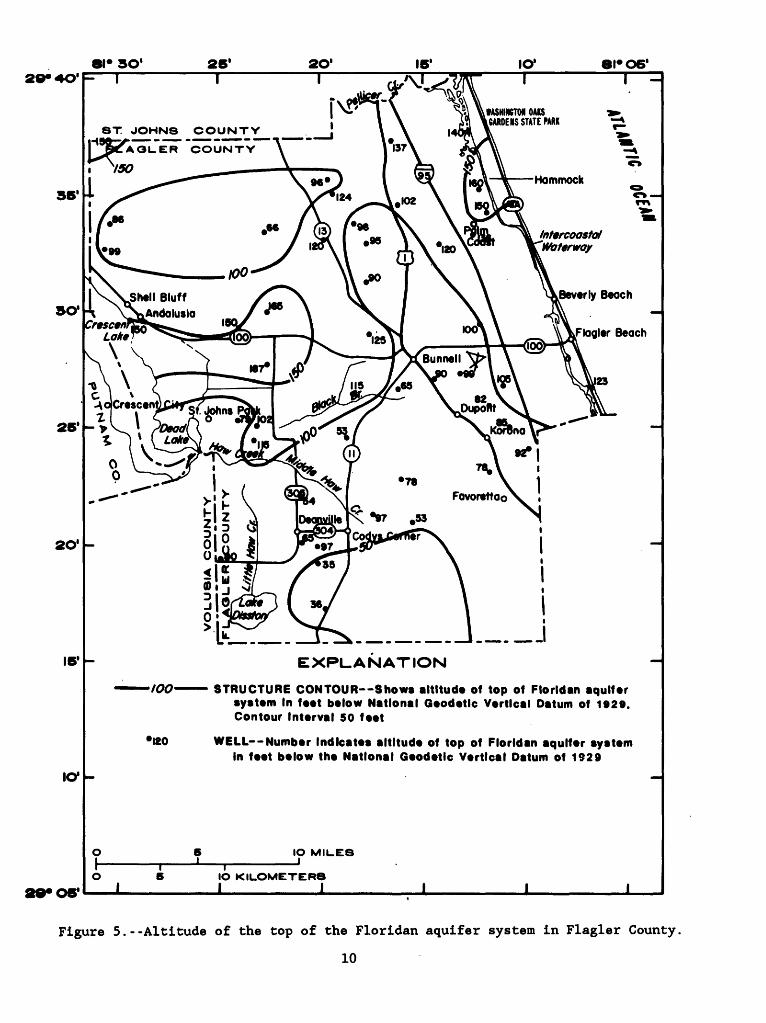
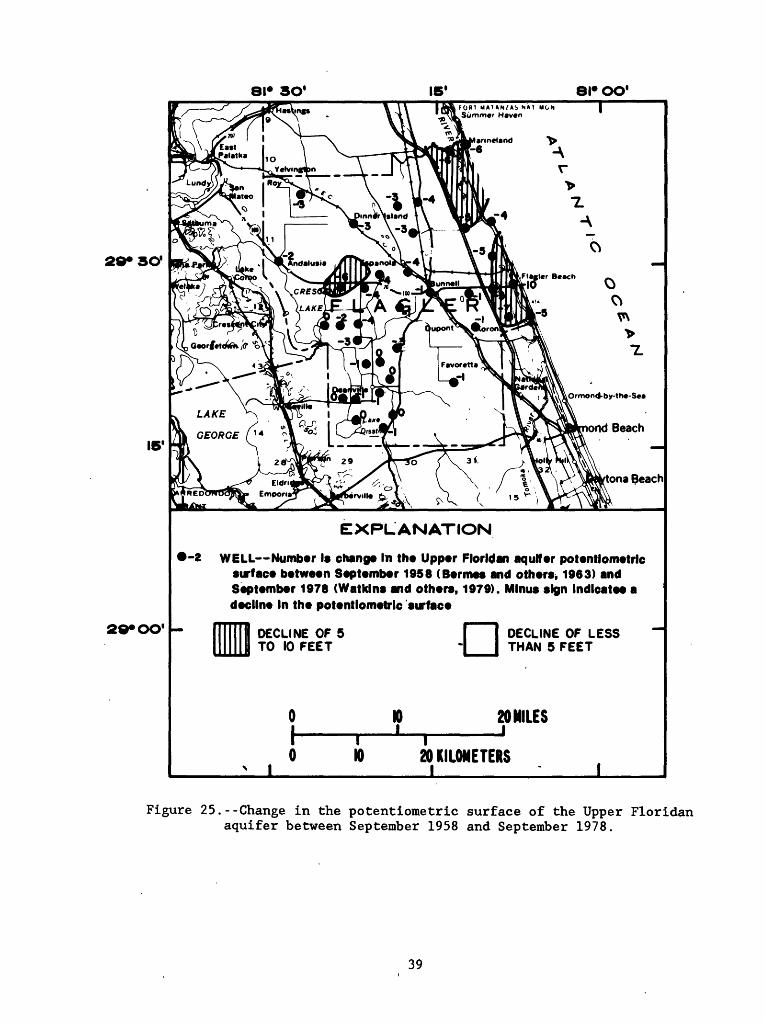
Figure 25 shows the changes in potentiometric surface of the county between September 1958 and September 1978. The potentiometric surface of September 1958 was the highest measured by Bermes and others (1963a) . The potentiometric surface of September 1978 (Watkins and others, 1979) is among the highest of the past 5 years. Figure 25 indicates the potentiometric surface declined slightly over most of the county except in localized areas along the coast and at Crescent Lake.
Bermes and others (1963a; 1963b) also collected water-quality data for the Upper Floridan aquifer in the late 1950's. No continuous chloride con centration data are available for wells in the county, therefore, a long- term trend could not be projected. Of the data that were available for com parison, changes in chloride concentration were less than 15 percent, except in an area north of Espanola and in an area east of Codys Corners.
37
WATER LEVEL, IN FEET ABOVE THE NATIONAL GEODETIC VERTICAL DATUM OF 1929enenenen
H- 5i-< (D
N5
3
o cw
O H)
(D I-1
N5 VO N5^J
U1 Oo oo
N5 O O
§aN> VO N5 00 N5 O O 00 I-1 N5 N5 I-1 O O
CO
en
I
COoo en
81* SO1 15' SI* OO'
I
29*30'
20* OO1
EXPLANATION
-2 WELL Number le change In the Upper F lor Wan aquifer potentlometric surface between September 1958 (Bermes and others, 1963) and September 1978 (Watklns and others, 1979). Minus sign Indicates a decline In the potentlometric surface
DECLINE OF 5 TO 10 FEET
DECLINE OF LESS THAN 5 FEET
01 10 2< i ii i
20 MILES
H) 20 KILOMETERS
Figure 25.--Change in the potentiometric surface of the Upper Floridan aquifer between September 1958 and September 1978.
39
The two areas of anomalous change are probably due to differences in interpretation. Examination of Bermes and others (1963b) well records shows that the wells used for control in these areas were very shallow (for Upper Floridan aquifer penetration) and may not have reached the Upper Floridan or could have been open to the intermediate aquifer system also. In the area north of Espanola, considerably higher chloride concentrations and other minerals were detected in water from wells in the Upper Floridan aquifer during the study period. In this area, intermediate aquifer system water quality is approximately the same as Upper Floridan aquifer data reported by Bermes. It was not possible to sample the same wells that were used for the earlier study. It seems likely then that the quality change may be a matter of depth or condition of the wells or well casings. Also, the questioned area has not had enough pumping stress over the past 2 decades to precipi tate a water-quality change.
In the area east of Codys Corners, surficial or intermediate aquifer system water quality cannot account for the higher chloride value of Bermes. Because only one value was reported, substantiation is lacking. Although the well is unused at present, pumping stress may have been a factor in the 1950's.
Evidence indicates that a water-quality change in the Upper Floridan aquifer was coincidental with the decline in potentiometric surface since the late 1950s. However, detailed data are scarce and the areas that indi cate a larger rise in chloride concentration are also the areas that already contain nonpotable water in the Upper Floridan aquifer.
Effects of Development
Withdrawals. - -One effect of pumping of wells in the Upper Floridan aquifer in well fields^in the county is a rise in chloride concentrations from water in individual wells. With an increase in rainfall, however, the chloride concentrations tend to decrease. The decrease is probably due to reduced pumpage and increased recharge. These conditions indicate that saline water is locally upconing with pumping, and continuous lateral salt water intrusion probably is not occurring.
Agricultural withdrawals in the central part of the county are seasonal and depend mainly on the rainfall pattern. Highly mineralized water occurs at all depths of the Upper Floridan aquifer in this area, therefore, the change in water quality due to heavy pumpage will not influence the pot ability of the water.
Dry-season withdrawals in the agricultural areas have increased season al fluctuations in the potentiometric surface of the Upper Floridan aquifer. Long-term rainfall deficiencies during the 1970's has increased the demand for irrigation water and.placed more stress on the Upper Floridan aquifer.
Available data do not indicate that transitory increases in mineraliza tion are a problem to any major users of the intermediate or the surficial aquifer systems. Continuous, concentrated pumping of the intermediate aquifer system could possibly raise the chloride concentrations, particu larly in coastal areas.
40
There are not enough data to determine long-term effects on the surfi- cial aquifer system; however, long-term withdrawals in the coastal area and barrier island may cause lateral intrusion of saline water into the surfi- cial aquifer system.
Probable future effects.--Agricultural development will probably not increase significantly in Flagler County, but residential development is projected to continue and accelerate. Water-treatment systems in the county use water from the Upper Floridan aquifer and the intermediate aquifer sys tem. With increased coastal residential development and tourism, the demand for treated water will probably exceed the designed production rates for the public-supply systems in the county. Well-field practices such as wide spacing of wells and alternation of withdrawals are in concert with best management of the resource.
The surficial aquifer system yields low to moderate amounts of water to domestic wells. The aquifer is likely to be stressed because of effects of development in the coastal areas, particularly in the Hammock area. Basic hydrologic principles indicate that development in these areas could seri ously affect the quality of the water by: (1) reducing recharge due to in creased surface runoff from impervious surfaces, (2) lowering water levels so that lateral saltwater intrusion could occur, and (3) recharging the sur ficial aquifer system with highly mineralized irrigation water.
MONITORING CONSIDERATIONS
Continued monitoring of ground-water levels and quality should be con sidered for each of the three aquifer systems in Flagler County. Type and intensity of data collection needed is related to the future distribution and intensity of stress placed on the aquifers, but some general guidelines are listed below.
Data from long-term, high-discharge aquifer tests on the Upper Floridan aquifer would be useful in better quantifying the response of the vertical saltwater interface with upconing in well-field areas, particularly in areas where the confining zone is thin between the discontinuous aquifers of the intermediate aquifer system and the underlying Floridan aquifer system. Continuing data collection on water-level fluctuations and water quality in both stressed and unstressed areas throughout the county would be desirable. In areas of withdrawal from the intermediate aquifer system and Upper Flori dan aquifer, maintenance of high water levels and acceptable quality water in the surficial aquifer system would also be desirable.
In the Hammock area the upper part of the surficial aquifer system is the sole local source of potable water for domestic supply. Contamination by brackish water from free-flowing wells in the Upper Floridan aquifer is gradually being reduced by the St. Johns River Water Management District's program of plugging free-flowing wells. Continued monitoring of water lev els and quality are desirable for areas of potential development and zones of highly mineralized water.
41
SUMMARY AND CONCLUSIONS
The population of Flagler County has been stable for at least three decades, but recent developments and future expansions of communities are projected to increase the population by 1990 to more than five times the population in 1970. This population influx is expected to place stresses on the water resources of the County.
Most of Flagler County tends to be poorly drained due to flat topog raphy and a poorly developed stream system. Most of the county is less than 30 feet altitude with altitudes below 5 feet occurring in large areas near the coast.
Rainfall has averaged about 49.67 in/yr over a 41-year period in Flag ler County. Most of this water leaves the County as evapotranspiration; the remainder recharges the surficial aquifer system and eventually leaves as streamflow or downward recharge to the lower intermediate and Floridan aqui fer systems.
The oldest geologic unit penetrated by water wells in Flagler County is the Avon Park Formation, composed of limestone and dolomite. The Ocala Limestone, which overlies the Avon Park Formation, is a white to tan lime stone. The Ocala Limestone is tapped extensively by wells. The Hawthorn Formation is absent in south Flagler County, but overlies the Ocala Lime stone where present. The Hawthorn Formation is dolomitic limestone at the base and sandy clay and marl above. Recent surficial deposits overlying the Hawthorn Formation consist of sand, clay, and shell.
Ground water is the only significant source of potable water in Flagler County. The water occurs in the Upper Floridan aquifer, the intermediate aquifer system, and the surficial aquifer system.
The Upper Floridan aquifer in Flagler County consists of the upper part of the Avon Park Limestone and the overlying Ocala Limestone; and where pre sent, the basal dolomitic limestone of the Hawthorn Formation. Its use is limited because it contains marginally potable or brackish quality water in much of Flagler County. Most wells that tap the Upper Floridan in Flagler County are open to the Ocala Limestone and, where present, the Hawthorn dolomitic limestone. Wells in the Upper Floridan aquifer are used for pub lic water supply by several water-treatment systems.
The Upper Floridan aquifer is confined by marls, clays, and dolomites of the Hawthorn Formation, where present, and by the clays of the overlying aquifers that occur throughout the county. Relatively thin and discontin uous lenses of sand, shell, and limestone occur within the confining beds and are collectively referred to as the intermediate aquifer system. The intermediate aquifer system is an important source of potable water in east and northeast Flagler where the Upper Floridan aquifer contains marginally potable or nonpotable water. This aquifer system is used for part of the public water supply for several water-treatment systems in the county.
The surficial aquifer system is composed of sand and shell with varying fractions of finer materials. In central and west Flagler, the silts and clays predominate and it is difficult to obtain adequate well yields greater than 5 gal/min. Sand tends to dominate in east-central Flagler, and coquina becomes dominant along part of the coast. The coastal surficial aquifer
42
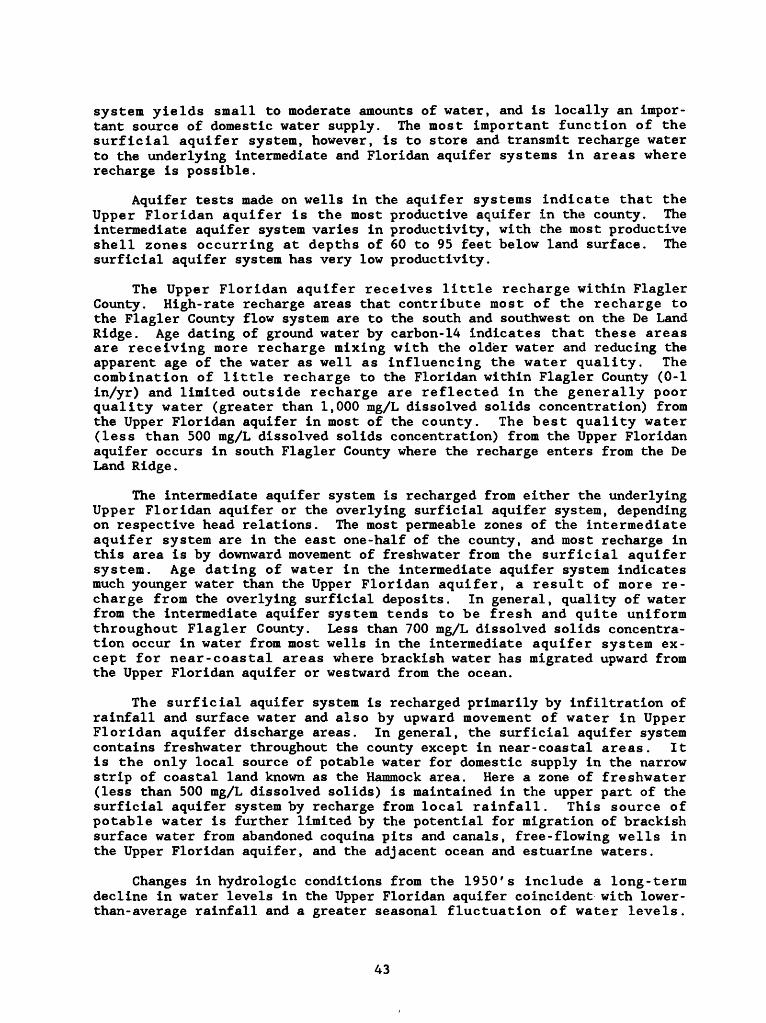
system yields small to moderate amounts of water, and is locally an impor tant source of domestic water supply. The most important function of the surficial aquifer system, however, is to store and transmit recharge water to the underlying intermediate and Floridan aquifer systems in areas where recharge is possible.
Aquifer tests made on wells in the aquifer systems indicate that the Upper Floridan aquifer is the most productive aquifer in the county. The intermediate aquifer system varies in productivity, with the most productive shell zones occurring at depths of 60 to 95 feet below land surface. The surficial aquifer system has very low productivity.
The Upper Floridan aquifer receives little recharge within Flagler County. High-rate recharge areas that contribute most of the recharge to the Flagler County flow system are to the south and southwest on the De Land Ridge. Age dating of ground water by carbon-14 indicates that these areas are receiving more recharge mixing with the older water and reducing the apparent age of the water as well as influencing the water quality. The combination of little recharge to the Floridan within Flagler County (0-1 in/yr) and limited outside recharge are reflected in the generally poor quality water (greater than 1,000 mg/L dissolved solids concentration) from the Upper Floridan aquifer in most of the county. The best quality water (less than 500 mg/L dissolved solids concentration) from the Upper Floridan aquifer occurs in south Flagler County where the recharge enters from the De Land Ridge.
The intermediate aquifer system is recharged from either the underlying Upper Floridan aquifer or the overlying surficial aquifer system, depending on respective head relations. The most permeable zones of the intermediate aquifer system are in the east one-half of the county, and most recharge in this area is by downward movement of freshwater from the surficial aquifer system. Age dating of water in the intermediate aquifer system indicates much younger water than the Upper Floridan aquifer, a result of more re charge from the overlying surficial deposits. In general, quality of water from the intermediate aquifer system tends to be fresh and quite uniform throughout Flagler County. Less than 700 mg/L dissolved solids concentra tion occur in water from most wells in the intermediate aquifer system ex cept for near-coastal areas where brackish water has migrated upward from the Upper Floridan aquifer or westward from the ocean.
The surficial aquifer system is recharged primarily by infiltration of rainfall and surface water and also by upward movement of water in Upper Floridan aquifer discharge areas. In general, the surficial aquifer system contains freshwater throughout the county except in near-coastal areas. It is the only local source of potable water for domestic supply in the narrow strip of coastal land known as the Hammock area. Here a zone of freshwater (less than 500 mg/L dissolved solids) is maintained in the upper part of the surficial aquifer system by recharge from local rainfall. This source of potable water is further limited by the potential for migration of brackish surface water from abandoned coquina pits and canals, free-flowing wells in the Upper Floridan aquifer, and the adjacent ocean and estuarine waters.
Changes in hydrologic conditions from the 1950's include a long-term decline in water levels in the Upper Floridan aquifer coincident with lower- than-average rainfall and a greater seasonal fluctuation of water levels.
43
Chloride concentrations of water in the Upper Floridan aquifer do not appear to have changed significantly over this same period, ranging at present from 7 to 3,700 mg/L.
Development, particularly in coastal areas, will place stress on the aquifers. Increased pumping in the well fields may cause upconing of brack ish water. Extensive development in the coastal areas will probably lower the surficial aquifer system water levels and could cause lateral saltwater intrusion.
SELECTED REFERENCES
Bentley, C.B., 1977, Aquifer test analyses for the Floridan aquifer in Flag-ler, Putnam, and St. Johns Counties, Florida: U.S. Geological SurveyWater-Resources Investigations 77-36, 50 p.
Bermes, B.J., Leve, G.W., and Tarver, G.R., 1963a, Geology and ground-waterresources of Flagler, Putnam and St. Johns Counties, Florida: FloridaGeological Survey Report of Investigations 32, 97 p.
----- 1963b, Ground-water records of Flagler, Putnam, and St. Johns Coun ties, Florida: Florida Geological Survey Information Circular 37, 89P-
Black, Crow, and Eidsness/CH2M-Hill, Inc., 1977, Water-supply potential from well field on ICDC, Palm Coast property, Flagler County, Florida: Project no. 184-78601, Gainesville, Fla.
Comprehensive land use plan, 1978, Palm Coast, Flagler County, Florida: ITT Community Development Corporation, v. 1-5.
Florida Department of State, 1982, Rules of the Department of Environmental Regulations, public drinking water systems Chapter 17-22, in Florida Administrative Code: Tallahassee, Fla.
Frazee, J.M., Jr., and McClaugherty, D.R. , 1979, Investigation of ground- water resources and saltwater intrusion in the coastal areas of north east Florida: St. Johns River Water Management District Water Resources Department Technical Report 3, 136 p.
-Kenner, W.E., and Crooks, J.W., 1963, Surface-water resources of St. Johns,Flagler, and Putnam Counties, Florida: Florida Geological SurveyInformation Circular 39, 44 p.
Leach, S.D., and Healy, H.G. , 1980, Estimated water use in Florida, 1977:U.S. Geological Survey Water-Resources Investigations 79-112, 76 p.
Lichtler, W.F., Anderson, Warren, and Joyner, B.F., 1968, Water resources ofOrange County, Florida: Florida Division of Geology Report ofInvestigations 50, 150 p.
Harella, Richard, 1981, Annual water use survey-1979: St. Johns River WaterManagement District Technical Publication SJ 81-3, 164 p.
----- 1982, Annual water use survey-1980: St. Johns River Water Management District Technical Publication SJ 82-5, 166 p.
----- 1983a, Annual water use summary-1981: St. Johns River Water Man agement District Technical Publication SJ 83-9, 95 p.
----- 1983b, Annual water use summary-1982: St. Johns River Water Man agement District Technical Publication SJ 84-2, 97 p.
----- 1984a, Annual water use summary-1983: St. Johns River Water Man agement District Technical Publication SJ 84-5, 103 p.
----- 1984b, Individual public and industrial water users, 1983: St. Johns River Water Management District Technical Report Supplement.
«U.S. GOVERNMENT PRINTING OFFICE:! 987-730-135/60002
44
Munch, D.A., Ripy, D.J., and Johnson, R.A., 1979a, Saline contamination of a limestone aquifer by connate intrusion in agricultural areas of St. Johns, Rutnam, and Flagler Counties, northeast Florida: St. Johns River Water Management District Technical Report 2, 89 p.
----- 1979b, Supplemental data for report of saline contamination of lime stone aquifer by connate intrusion in agricultural areas of St. Johns, Putnam, and Flagler Counties, northeast Florida: St. Johns River Water Management District Technical Memorandum 2, 75 p.
Parker, G.G., Ferguson, G.E., Love, S.K., and others, 1955, Water resources of southeastern Florida, with special reference to geology and ground water of the Miami area: U.S. Geological Survey Water Supply Paper 1255, p. 100.
Phelps, G.G., 1984, Recharge and discharge areas of the Floridan aquifer in the St. Johns River Water Management District and vicinity, Florida: U.S. Geological Survey Water-Resources Investigations Report 82-4058, 1 sheet.
Piper, A.M., 1944, A graphical procedure in the geochemical interpretation of water analyses: American Geophysical Union Transactions, v. 25, p. 914-923.
Rutledge, A.T., 1982, Hydrology of the Floridan aquifer in northwest Volusia County, Florida: U.S. Geological Survey Water-Resources Investigations Open-File Report 82-108, 116 p. and 1 sheet.
Schiner, G.R., and Hayes, E.G., 1981, Potentiometric surface of the Floridan aquifer in the St. Johns River Water Management District and vicinity, Florida, May 1981: U.S. Geological Survey Open-File Report 81-1052.
Smith, S.K., and Sincich, F. , 1983, Projections of Florida population by county, 1984-2020: University of Florida Bulletin 65, p. 52.
Stewart, J.W., 1980, Areas of natural recharge to the Floridan aquifer in Florida: Florida Bureau of Geology Map Series 98, 1 sheet.
Tibbals, C.H., 1975, Recharge areas of the Floridan aquifer in Seminole County and vicinity, Florida: Florida Bureau of Geology, Map Series 68, 1 sheet.
----- 1981, Computer simulation of the steady-state flow system of the ter tiary limestone (Floridan) aquifer system in east-central Florida: U.S. Geological Survey Water-Resources Investigations Report 81-681, 31 p. and 8 sheets.
U.S. Environmental Protection Agency, 1975, National interim primary drink ing water regulations: Federal Register, v. 40, no. 51, March 14, p. 11990-11998.
----- 1977a, Quality criteria for water, 1976: Washington, D.C., U.S. Government Printing Office, 256 p.
----- 1977b, National secondary drinking water regulations: Federal Regis ter v. 42, no. 62, Thursday, March 31, 1977, Part I, p. 17143-17147.
Watkins, F.A., Laughlin, C.P., and Hayes, E.G., 1979, Potentiometric surface map of the Floridan aquifer in the St. Johns River Water Management District and vicinity, Florida, September 1978: U.S. Geological Survey Open-File Report 79-986.
45