Embed Size (px)
Citation preview

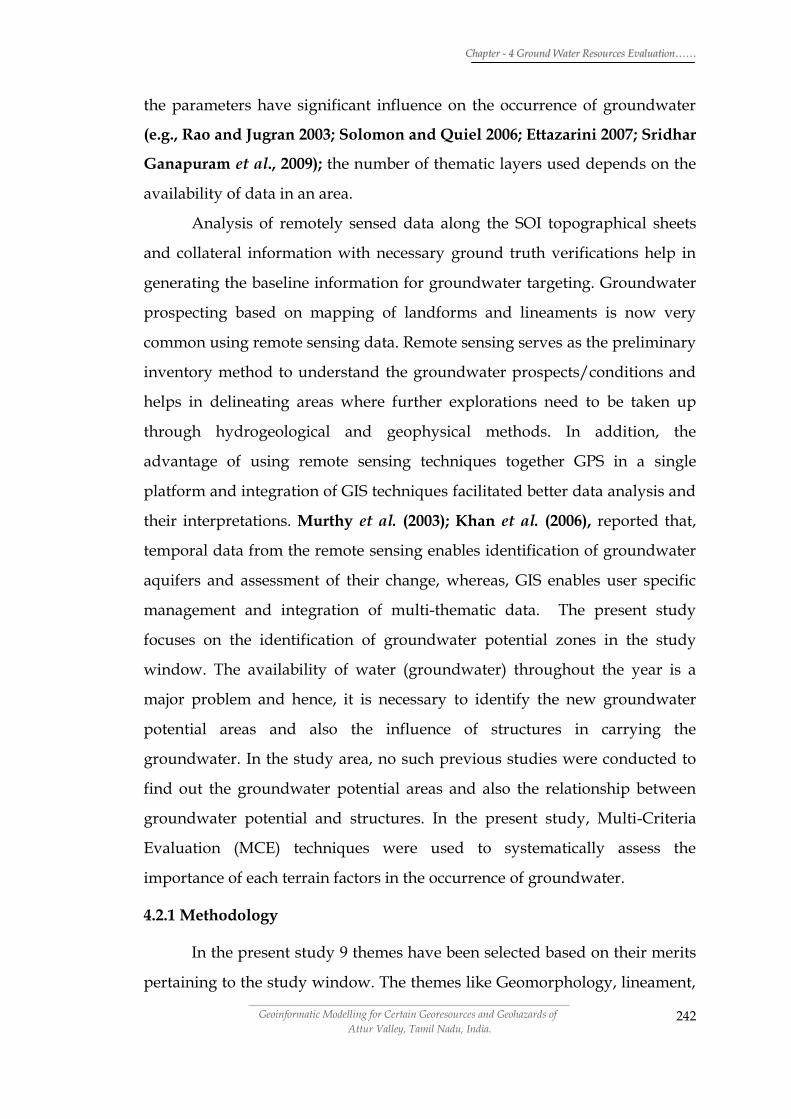
Chapter – 4
GROUND WATER RESOURCES EVALUATION AND
DETECTION OF WATER BEARING LINEAMENTS
4.1 GENERAL
The two fundamental causes for groundwater’s active role in nature
are its ability to interact with the ambient environment and the systematized
spatial distribution of its flow (Jozsef Toth, 1999). The occurrence, movement
and control of groundwater, particularly in hard rock areas are governed by
different factors such as topography, lithology, structures like fractures, faults
and nature of weathering (Janardhanaraju and Reddy, 1998).
Groundwater is one of the important natural resources which support
the human health, economic development and ecological diversity. Over
exploitation and unabated pollution of this vital resource is threatening our
ecosystem and even the life of the future generation (Madhan Jha et al., 2007).
Groundwater is available in various permeable geologic formation called
aquifers which can store and transmit water. It is an important natural source
that has to be sustained for the future. Groundwater is not available in the same
quality and quantity everywhere. It varies depending upon the geological,
geomorphological, type of soil and the amount of water mined. The increase in
population, industrialization and the pressure for development in agriculture
has led to the over exploitation of groundwater in most of the places. Usage of
deep bore wells has lowered the groundwater level in an alarming way. The
available water resources in India are not distributed evenly. Due to variation
in climatic condition, rainfall and topographical features availability of
groundwater is not the same in all the places.
Water being the essential commodity for the survival of life on the
Earth and ground water forms the primary source of water, it is a compelling
need for the geoscientists to evaluate the water potential of the region, to
monitor its flow and control by geologic phenomena and to assess its quality
for the potability.

CChhaapptteerr -- 44 GGrroouunndd WWaatteerr RReessoouurrcceess EEvvaalluuaattiioonn…………
Geoinformatic Modelling for Certain Georesources and Geohazards of
Attur Valley, Tamil Nadu, India.
241
The ground water controlling parameters like geology,
geomorphology, slope, landuse /land cover, and structure and lineament
were integrated and probable water potential zones were identified by rank
and weightage method in the present study. The highest weightage 10 was
given to the lithology, followed by geomorphology. In crystalline terrains, the
aquifer characters are mainly imparted by lineaments. So, the lineament
derived themes, viz: the lineament density, lineament frequency and
lineament intersection were given importance and equal weightage. Water
potential zone map was prepared; the output was validated with multi depth
resistivity data and water level data.
4.2 GROUND WATER RESOURCES EVALUATION
One of the best methodologies to locate and map the occurrence and
distribution of groundwater has focused on the utility of high resolution
satellite imagery to identify and delineate the surface features more
accurately. Remote sensing method provides the efficient way of mapping of
natural resources economically than those of the conventional methods and
yields better results. Krishanmurthy and Srinivas (1996); Ravindran and
Jayaram (1997); Jagadeeswara Rao et al. (2004), used the satellite remote
sensing data to define the spatial distribution of different groundwater
prospect classes on the basis of geomorphology and other associated
parameters. Sankar (2002); Basudeo Rai et al. (2005); Lokesha et al. (2005) in
their studies found that, identification of groundwater occurrence location
using remote sensing data is based on indirect analysis of some directly
observable terrain features like geological structures, geomorphology and
their hydrologic characteristics. Bahuguna et al. (2003), in their studies found
that lineaments play significant role in groundwater exploration particularly
in hard rock terrain. On the basis of hydrogeomorphology, Vijith (2007) has
delineated three categories of groundwater potential zones namely good,
moderate and poor of Kottayam district, Kerala. Various thematic maps for
delineating groundwater favorability zones were selected presuming that all
CChhaapptteerr -- 44 GGrroouunndd WWaatteerr RReessoouurrcceess EEvvaalluuaattiioonn…………
Geoinformatic Modelling for Certain Georesources and Geohazards of
Attur Valley, Tamil Nadu, India.
242
the parameters have significant influence on the occurrence of groundwater
(e.g., Rao and Jugran 2003; Solomon and Quiel 2006; Ettazarini 2007; Sridhar
Ganapuram et al., 2009); the number of thematic layers used depends on the
availability of data in an area.
Analysis of remotely sensed data along the SOI topographical sheets
and collateral information with necessary ground truth verifications help in
generating the baseline information for groundwater targeting. Groundwater
prospecting based on mapping of landforms and lineaments is now very
common using remote sensing data. Remote sensing serves as the preliminary
inventory method to understand the groundwater prospects/conditions and
helps in delineating areas where further explorations need to be taken up
through hydrogeological and geophysical methods. In addition, the
advantage of using remote sensing techniques together GPS in a single
platform and integration of GIS techniques facilitated better data analysis and
their interpretations. Murthy et al. (2003); Khan et al. (2006), reported that,
temporal data from the remote sensing enables identification of groundwater
aquifers and assessment of their change, whereas, GIS enables user specific
management and integration of multi-thematic data. The present study
focuses on the identification of groundwater potential zones in the study
window. The availability of water (groundwater) throughout the year is a
major problem and hence, it is necessary to identify the new groundwater
potential areas and also the influence of structures in carrying the
groundwater. In the study area, no such previous studies were conducted to
find out the groundwater potential areas and also the relationship between
groundwater potential and structures. In the present study, Multi-Criteria
Evaluation (MCE) techniques were used to systematically assess the
importance of each terrain factors in the occurrence of groundwater.
4.2.1 Methodology
In the present study 9 themes have been selected based on their merits
pertaining to the study window. The themes like Geomorphology, lineament,

CChhaapptteerr -- 44 GGrroouunndd WWaatteerr RReessoouurrcceess EEvvaalluuaattiioonn…………
Geoinformatic Modelling for Certain Georesources and Geohazards of
Attur Valley, Tamil Nadu, India.
243
landuse and structure and trendline were prepared from IRS IC LISS III data
acquired on 19th February 2004 (P100/R67). Drainage map was prepared
from Survey of India toposheets 58 I series of 1:50,000 scale. And district
resource maps published by Geological Survey of India (scale 1:2,50,000 of
year 1987) were used for lithology and slope map was produced from SRTM
data. Lineament density, lineament frequency and lineament intersection map
were derived from lineament map and drainage density map was prepared
from drainage map. The Salem province is unique by the virtue of its location
in the SGT and its topographic and structural set up. The region displays
spectacular variety of rocks and mineral wealth and well known shear zones
of SGT. Since, the water bearing qualities depends upon the porosity of the
rocks, the rocks in province like Salem which underwent multiple
deformation phases apart from the inherited porosity, higher weightage must
be given to lithology. The crystalline terrains the rock types gain more
importance in defining the geomorphology. So, higher weightages was given
to lithology prior to geomorphology followed by fractures related properties
like lineament density, lineament frequency and lineament intersection
(Table 4-1, Fig.4.1).
In this method all the vector GIS layers of the 9 terrain systems (Fig. 4.2
to 4.10) were used and for all these 9 terrains systems weightages (Wi) were
assigned on the basis of their possible influence and control to water
resources of a region. Then for the each sub variable of the 9 themes, scores
were assigned (Sij). Then these scores (Sij) of the sub variables were
multiplied with the corresponding weightage (Wi) of the terrain systems and
water potential zones weightages (Wi x Sij) were worked out for each sub
variable. For example, Wi for lithology layer was 10 and Sij for the Fissile
hornblende gneiss was 9. So the finally accrued water potential weightages
(Wi x Sij) for the Fissile hornblende gneiss was 90 (10 x 9). Similarly, for each
sub variable of the 9 terrain systems water resource weightages were worked
out and the corresponding weightages were assigned to such sub variables.

CChhaapptteerr -- 44 GGrroouunndd WWaatteerr RReessoouurrcceess EEvvaalluuaattiioonn…………
Geoinformatic Modelling for Certain Georesources and Geohazards of
Attur Valley, Tamil Nadu, India.
244
In this method, the total weights of the final integrated map were
derived as sum of the weights assigned to the different layers according to
their suitability. Finally, the block-wise groundwater condition has been
assessed by superimposing the block map over the groundwater potential
zone map (Fig. 4.1).
Table 4-1 Weightages assigned to 9 terrain parameters
Sl.No Themes Weightage (Wi)
1. LITHOLOGY 10
2. GEOMORPHOLOGY 9
3. LINEAMENT INTERSECTION 8
4. LINEAMENT FREQUENCY 8
5. LINEAMENT DENSITY 8
6. BUFFERED STRUCTURE AND
TREND LINE 7
7. SLOPE 6
8. DRAINAGE DENSITY 5
9. LANDUSE – LAND COVER 4
4.2.2 Assignment of Weightages (Wi) and Scores (Sij) to Terrain Systems
4.2.2.1 Lithology
As discussed in the methodology, first the weightages (Wi) were
assigned to the 9 terrain parameters as shown in Table 4-1. In the present
study, the maximum weightage of 10 was assigned to the lithology, as the
rock assemblage of Salem province is unique which includes brittle
charnockite, mafic granulite, hornblende biotite gneiss, amphibolites and so
on. These rocks differ from each other, in the water resource point, by
porosity as they were intensely of sheared and foliated.

CChhaapptteerr -- 44 GGrroouunndd WWaatteerr RReessoouurrcceess EEvvaalluuaattiioonn…………
Geoinformatic Modelling for Certain Georesources and Geohazards of
Attur Valley, Tamil Nadu, India.
245
Fig. 4.1 Methodology Flow Chart – Ground Water Resources Evaluation
Lineament Intersection
By Pump Test Method
Block wise Groundwater Potential Map
Neotectonics Vs Groundwater
Identification of Conduit and Discharge Lineaments
Groundwater Potential Map
Validation By Iso-Resistivity
Method
Lineament Density
Lineament
Vector Overlay
Lineament Frequency
Lithology
Geomorphology
Landuse/ Landcover
Drainage Density
Slope
District Resource Map from GSI
Structure and Trendline Map
Satellite Data
Water Resource Evaluation
Topographic Sheet from SOI (1:50000scale)
SRTM Data
Assigning Weightage (Wi) and Scores (Sij)
Drainage

CChhaapptteerr -- 44 GGrroouunndd WWaatteerr RReessoouurrcceess EEvvaalluuaattiioonn…………
Geoinformatic Modelling for Certain Georesources and Geohazards of
Attur Valley, Tamil Nadu, India.
246
Table 4-2 Weightages and Scores – Lithology
Sl.
No Lithology Class
Weight-
age
(Wi)
Score
(Sij) (Wi x Sij)
1. Fluvial sediments (sand, silt, gravel,
clay) Laterite 10 10 100
2. Fissile Hornblende Biotite Gneiss 10 9 90
3. Charnockite, Hornblende Biotite
Gneiss, Epidote Hornblende Gneiss,
Siderite-Ankerite Gneiss
10 8 80
4.
Amphibolite, Pyroxenite, Dunite,
Peridotite, Pink Migmatite,
Carbonatite, Calc granulite and
Limestone
10 5 50
5. Garnetiferous Gabbro, Pyroxene
Granulite
10 4 40
6. Syenite, Granite, Gingee
Granite,Granite / Granolite
(Tindivanam)
10 3 30
7.
Magnetite- Quartzite, Fuchsite-
Kyanite-Magnetite-Silimanite-
Quartzite, Pegmatite, Basic dyke
10 2 20
The secondary porosity is the essential character of crystalline aquifers
where the response to shearing varies from rock to rock and hence their water
holding properties. Based on this conception higher score of 9 was assigned to
fissile hornblende gneiss next to fluvial younger sediments (Table 4-2).
Charnockite, Hornblende Biotite Gneiss, Epidote Hornblende Gneiss, Siderite-
Ankerite Gneiss are relatively low porous than fissile hornblende gneiss and
hence lesser value of 8. Similarly rocks were ranked according to their merit
of water holding properties and weighted lithology GIS map was prepared
(Fig.4.2).
4.2.2.2 Geomorphology
Authors like Edet et al. (1998), Chakraborthy and Paul (2004), Erhen Sener
et al. (2005), Ravi Shankar and Mohan (2005), Sanjeev Kumar et al. (2006),
Semere Solomon and Friedrich Quiet (2006), Trivedi et al. (2006),Prasad et
al. (2007), Srinivasarao Yamani (2007), Thakur and Raghuwanshi (2008)

CChhaapptteerr -- 44 GGrroouunndd WWaatteerr RReessoouurrcceess EEvvaalluuaattiioonn…………
Geoinformatic Modelling for Certain Georesources and Geohazards of
Attur Valley, Tamil Nadu, India.
247
and Hsin-Fu Yeh et al. (2009) were using hydrgeomorphology as criteria for
delineating water potential zones.
The study area has a dominant rocky terrain, which is manifested by
hills and undulating surfaces. Hence, the geomorphology was assigned
weightage (Wi) 9.
Fig. 4.2 Water Resource- Weighted Lithology Map

CChhaapptteerr -- 44 GGrroouunndd WWaatteerr RReessoouurrcceess EEvvaalluuaattiioonn…………
Geoinformatic Modelling for Certain Georesources and Geohazards of
Attur Valley, Tamil Nadu, India.
248
Table 4-3 Weightages and Scores – Geomorphology
Sl.
No Geomorphology Class
Weigh-
tage (Wi)
Score
(Sij) (Wi x Sij)
1. Colluvial Fill Deep 9 10 90
2. Bajada 9 9 81
3. Intermontane Valley 9 8 72
4. Fracture Valley Fill 9 7 63
5. Colluvial Fill Moderate 9 6 54
6. Colluvial Fill Shallow 9 5 45
7. Hilltop Weathered / Dissected
Plateau 9 4 36
8. Undissected Plateau 9 3 27
9.
Residual Hills, Fracture Valley
Barren, Pediments / Pediment
Inselberg
9 2 18
10 Linear Ridge / Dyke, Structural
Hills, Rocky Slope / Cliffs 9 1 9
Ten distinct geomorphologic units have been identified and delineated
from the study area; include structural hills, escarpment/cliff, residual
mounds, denudational slope, pediment, fracture valley and valley fill, etc. The
distribution and extent of these geomorphic zones are varying from place to
place. Highest score was assigned to deep Colluvial fill followed by Bajada,
Intermontane valley and fracture valley fills (Table 4-3). Linear ridges, Dykes,
Inselberg were assigned low scores owing to lesser chances to hold water. The
corresponding weighted geomorphology GIS map was prepared (Fig.4.3).
4.2.2.3 Lineament
Lineaments like joints, fractures and faults are hydrogeologically very
important and may provide the pathways for groundwater movement
(Sankar, 2002). Presence of lineaments may act as a conduit for ground water
movement which results in increased secondary porosity and therefore, can
serve as groundwater prospective zone. The extension of large lineaments
representing a shear zone or a major fault can extend subsurface from hilly

CChhaapptteerr -- 44 GGrroouunndd WWaatteerr RReessoouurrcceess EEvvaalluuaattiioonn…………
Geoinformatic Modelling for Certain Georesources and Geohazards of
Attur Valley, Tamil Nadu, India.
249
terrain to alluvial terrain. It may form a productive groundwater reserve.
Similarly intersection of lineaments can also be the probable sites of
groundwater accumulation. Therefore, areas with high lineament density may
have important groundwater prospects even in hilly regions which otherwise
have nil groundwater prospects.
Fig 4.3 Water Resource- Weighted Geomorphology Map

CChhaapptteerr -- 44 GGrroouunndd WWaatteerr RReessoouurrcceess EEvvaalluuaattiioonn…………
Geoinformatic Modelling for Certain Georesources and Geohazards of
Attur Valley, Tamil Nadu, India.
250
Ramasamy et al. (1989) have integrated the regional spatial
information of transmissivity, permeability and storage coefficient values
and they are of the opinion that the ground water flow is controlled by the
folded systems in the area south of Cauvery whereas in the northern area the
groundwater flow is controlled by the fracture systems. So, weightage (Wi)
value of 8 was assigned to lineament derived features like lineament density,
lineament frequency and lineament intersection.
4.2.2.3.1 Lineament Density
Ramasamy et al. (2001) have done fracture pattern modeling for hard
rock aquifer system of central Tamil Nadu in which they have studied the
fracture density and their influence over groundwater.
In the present study, lineament density map was prepared by
measuring the total length of the lineaments per 5x5 sq.km grid. Then the
measured values were assigned to respective centers of grids. The values
were ranging from 5000m to 30000m per grid. The values were grouped into 5
classes and scores were assigned to each class. Highest score of 10 was
assigned to highest lineament density and minimum to lowest lineament
density (Table.4.4). An isolines map was prepared for the reclassified grid
values as weighted lineament density map (Fig. 4.4).
Table 4-4 Weightages and Scores – Lineament Density
Sl.
No Lineament Density Weightage (Wi)
Score
(Sij) (Wi x Sij)
1. Very High > 30000 8 10 80
2. High 30000-20000 8 8 64
3. Moderate 20000-10000 8 6 48
4. Low 10000-5000 8 4 32
5. Very Low 0-5000 8 2 16

CChhaapptteerr -- 44 GGrroouunndd WWaatteerr RReessoouurrcceess EEvvaalluuaattiioonn…………
Geoinformatic Modelling for Certain Georesources and Geohazards of
Attur Valley, Tamil Nadu, India.
251
Fig. 4.4 Water Resource- Weighted Lineament Density Map
4.2.2.3.2 Lineament Frequency
Weighted lineament frequency map was prepared by counting the
number of lineaments per 5x5 sq.km grid with corresponding weighted
values (Table 4-5, Fig.4.5).
Table 4-5 Weightages and Scores – Lineament Frequency
Sl.No Lineament Frequency Weightage (Wi) Score (Sij) (Wi x Sij)
1. Very High > 20 8 10 80
2. High 20 -15 8 8 64
3. Moderate 15-10 8 6 48
4. Low 10 -5 8 4 32
5. Very Low 0-5 8 2 16

CChhaapptteerr -- 44 GGrroouunndd WWaatteerr RReessoouurrcceess EEvvaalluuaattiioonn…………
Geoinformatic Modelling for Certain Georesources and Geohazards of
Attur Valley, Tamil Nadu, India.
252
Fig. 4.5 Water Resource- Weighted Lineament Frequency Map
4.2.2.3.3 Lineament Intersection
Weighted lineament intersection map was prepared by counting the
number of intersections of lineaments per 5x5 sq.km grid with corresponding
weighted values (Table 4-6, Fig.4.6).
Table 4-6 Weightages and Scores – Lineament Intersection
Sl.No Lineament Intersection Weightage
(Wi)
Score
(Sij) (Wi x Sij)
1. Very High > 60 8 10 80
2. High 60-45 8 8 64
3. Moderate 45-30 8 6 48
4. Low 30-15 8 4 32
5. Very Low 0-15 8 2 16

CChhaapptteerr -- 44 GGrroouunndd WWaatteerr RReessoouurrcceess EEvvaalluuaattiioonn…………
Geoinformatic Modelling for Certain Georesources and Geohazards of
Attur Valley, Tamil Nadu, India.
253
Fig. 4.6 Water Resource- Weighted Lineament Intersection Map
4.2.2.4 Buffered Structure and Trendline
Palanivel and Ramasamy (2002) have traced trend line of Western
Ghats and found appreciable ground water flow control and very good water
potential in folded structures.
The compositional banding in the rocks as well as the linearity
developed during shearing, dykes, mafic granulites and banded magnetite
quartzite were traced as trendline and they are qualified enough to control
water flow and damming ground water. So, 250m buffer zone was taken as a
terrain parameter and assigned the weightage value 7 (Table 4-7) and
weighted, buffered structure and trendline map was prepared (Fig.4.7).

CChhaapptteerr -- 44 GGrroouunndd WWaatteerr RReessoouurrcceess EEvvaalluuaattiioonn…………
Geoinformatic Modelling for Certain Georesources and Geohazards of
Attur Valley, Tamil Nadu, India.
254
Table 4-7 Weightages and Scores – Buffered Structure and Trend line
Sl.No Structural Class Weightage (Wi) Score (Sij) (Wi x Sij)
1. Structural basin 7 10 70
2. Open fold 7 8 56
3. Trend line 7 6 42
Fig. 4.7 Water Resource- Weighted Buffered -Structure and Trendline Map
4.2.2.5 Slope
Slope plays a key role in the groundwater occurrence as infiltration is
inversely related to slope. A break in the slope (i.e. steep slope followed by
gentler slope) generally promotes an appreciable groundwater infiltration.
Steeper the slope, greater will be the runoff and thus, lesser is the favorable
for groundwater recharge.

CChhaapptteerr -- 44 GGrroouunndd WWaatteerr RReessoouurrcceess EEvvaalluuaattiioonn…………
Geoinformatic Modelling for Certain Georesources and Geohazards of
Attur Valley, Tamil Nadu, India.
255
SRTM data was used for the estimation of slope in degrees. The
identified slope category varies from 1º to 56º in the study area and are
classified into four classes like, 0º to 3º (gentle), 3º0’01‖ to 20º (moderate),
20º0’01‖ to 40º (steep) and >40 (very steep). Weightage scores were assigned
and their total weighted values for each slopes have been calculated (Table 4-
8) and corresponding weighted slope map was prepared (Fig.4.8).
Table 4-8 Weightages and Scores – Slope
Sl.No Slope Name Weightage
(Wi) Score (Sij) (Wi x Sij)
1. Gentle Slope 6 10 60
2. Moderate Slope 6 8 48
3 Steep Slope 6 6 36
4. Very Steep Slope 6 4 24
4.2.2.6 Drainage Density
Drainage channels delineated using SOI topographic maps represent
channels along which surface runoff moves down slope. The surface water
infiltration is found to be more in the sheet wash than in channel flow. To
visualize the areas of sheet flow/channel flow the zones of different drainage
density, viz. very high, high, moderate, low and very low are derived based
on spatial density analysis of drainage network, comprising of 0.19%, 2.88%,
10.98%, 18.91% and 67.44% of the area respectively. The area of very high
drainage density represents more closeness of drainage lines and vice-versa.
Groundwater prospects are found to be poor in the very high drainage
density areas as major part of the water poured over them during rainfall is
lost as surface runoff with little infiltration to meet groundwater. On the
contrary low drainage density areas permit more infiltration and recharge to
the groundwater and therefore have more potential for groundwater
(Md. S. Mondal et al., 2007). Weightage scores of the total weightage for each

CChhaapptteerr -- 44 GGrroouunndd WWaatteerr RReessoouurrcceess EEvvaalluuaattiioonn…………
Geoinformatic Modelling for Certain Georesources and Geohazards of
Attur Valley, Tamil Nadu, India.
256
drainage density are given in Table 4-9 and weighted drainage density map
was prepared (Fig. 4.9).
Fig. 4.8 Water Resource- Weighted Slope Map
Table 4-9 Weightages and Scores – Drainage Density
Sl.No Drainage Density Weightage
(Wi)
Score
(Sij)
(Wi x
Sij)
1. Very
low < 5000 5 10 50
2. Low 10000 - 5000 5 8 40
3. Moderate 20000- 10000 5 6 30
4. High 30000- 20000 5 4 20
5. Very
high > 30000 5 2 10

CChhaapptteerr -- 44 GGrroouunndd WWaatteerr RReessoouurrcceess EEvvaalluuaattiioonn…………
Geoinformatic Modelling for Certain Georesources and Geohazards of
Attur Valley, Tamil Nadu, India.
257
Fig. 4.9 Water Resource- Weighted Drainage Density Map
4.2.2.7 Land use/land cover
For the identification and interpretation of land use pattern of the area,
the standard methods of visual interpretation were adopted and the various
land use classes delineated includes barren land, barren rock, built-up land,
cleared area, cropland, grassland, natural vegetation, plantations, and water
body. The weightage scores were assigned to each landuse and land cover
category (Table 4-10) and the corresponding weighted landuse and land
cover map has been prepared (Fig.4.10).

CChhaapptteerr -- 44 GGrroouunndd WWaatteerr RReessoouurrcceess EEvvaalluuaattiioonn…………
Geoinformatic Modelling for Certain Georesources and Geohazards of
Attur Valley, Tamil Nadu, India.
258
Table 4-10 Weightages and Scores – Landuse and Land Cover
Sl.No. Landuse and Land Cover Class Weightage
(Wi) Score (Sij)
(Wi x Sij)
1. River, River Island, River bed Vegetation, River/Sandy area,
Reservoirs, Abandoned quarries, Water Lakes/Ponds, Tanks
4 10 40
2. Crop Land in Forest, Crop land, Canal, Plantations, Grass land / degraded , Forest Plantations
4 8 32
3. Deciduous forest, Mining process 4 6 24
4. Wastelands-with/without scrub, Gullied/ Ravenous Land, Built-up, Built-up/Villages (Rural)
4 4 16
5. Barren Rocky/ Stony Waste 4 2 8
4.2.3 Vector Overlay and Identification of Groundwater Potential Zones
Finally, all these 9 weighted GIS vector layers of the different terrain
parameters were simplified by dissolving with scores of different classes of
each terrain parameters and the simplified vector layers were integrated
using ―Union‖ option in analysis tool in ARCGIS. Geographical Information
Systems are used to perform a number of fundamental spatial analysis
operations; such operations can use any number of analytical processes. An
overlay operation is much more than a simple merging of line work; all the
attributes of the features taking part in the overlay are carried through, as
shown in the example below, where polygons of layer 1 and polygons of layer
2 are overlaid (using the Union tool) to create a new polygon layer. The
parcels are split where they are crossed by the layer 2 zone boundaries, and
new polygons created

CChhaapptteerr -- 44 GGrroouunndd WWaatteerr RReessoouurrcceess EEvvaalluuaattiioonn…………
Geoinformatic Modelling for Certain Georesources and Geohazards of
Attur Valley, Tamil Nadu, India.
259
Fig. 4.10 Water Resource- Weighted Landuse and Land cover Map
All polygons retain their original category values in addition to
overlaid polygon value. We can use overlay analysis to combine the
characteristics of several datasets into one. Union calculates the geometric
intersection of any number of feature classes and feature layers . All inputs
must be of a common geometry type and the output will be of that same
geometry type. This means that a number of polygon feature classes and
feature layers can be unioned together. The output features will have the
attributes of all the input features that they overlap. Union does the following:

CChhaapptteerr -- 44 GGrroouunndd WWaatteerr RReessoouurrcceess EEvvaalluuaattiioonn…………
Geoinformatic Modelling for Certain Georesources and Geohazards of
Attur Valley, Tamil Nadu, India.
260
We can then find specific locations or areas that have a certain set of attribute
values—that is, match the criteria you specify. This approach is often used to
find locations that are suitable for a particular use or are susceptible to some
risk.
Determines the spatial reference for processing. This will also be the
output spatial reference. All the input feature classes are projected
into this spatial reference.
Cracks and clusters the features. Cracking inserts vertices at the
intersection of feature edges; clustering snaps together vertices that
are within the xy tolerance.
Discovers geometric relationships (overlap) between features from
all feature classes.
Writes the new features to the output.
The output will contain combined polygons from the unioned
maps. By using the calculator option in tables the values were
added and stored in a separate column of the table.
For example:
Layer 1 Layer2 Possible combinations (3X4=12)
1 A A1 B1 C1
2 B A2 B2 C2
3 C A3 B3* C3
4 A4 B4 C4
(*Not possible in the given layer, so actual polygons in the figure are 11)
Fig. 4.11 Vector Overlay Model

CChhaapptteerr -- 44 GGrroouunndd WWaatteerr RReessoouurrcceess EEvvaalluuaattiioonn…………
Geoinformatic Modelling for Certain Georesources and Geohazards of
Attur Valley, Tamil Nadu, India.
261
Fig. 4.12 Composite Map of Weighted Vector Layers
Table 4-11 Classification of Water Potential Zones
Sl.No Score Class
1. < 210 Poor
2. 211 - 270 Very low potential zone
3. 271 - 330 Low potential zone
4. 331 - 390 Moderate potential zones
5. 391 - 450 High potential zone
6. > 451 Very high potential zone

CChhaapptteerr -- 44 GGrroouunndd WWaatteerr RReessoouurrcceess EEvvaalluuaattiioonn…………
Geoinformatic Modelling for Certain Georesources and Geohazards of
Attur Valley, Tamil Nadu, India.
262
The scores of each class of the layers 1 and 2 can be added to the
corresponding resultant polygon so as represent the proper weightage of the
different terrain parameters are taken into account. The resultant scores are
added to scores of the next layer after ―union‖.
As explained above 9 terrain parameters with their sub classes were
unioned one after the other and the resultant polygons were 2049 and scores
were ranging from 141 to 534 (Fig. 4.12, possible maximum score was 650).
The values were classed into six categories as given in the Table 4-11. The
water potential map was prepared by dissolving all the 2049 polygons into six
polygons based on the classified scores in Table 4-11 (Fig.4.13).
Fig. 4.13 Water Potential Zones

CChhaapptteerr -- 44 GGrroouunndd WWaatteerr RReessoouurrcceess EEvvaalluuaattiioonn…………
Geoinformatic Modelling for Certain Georesources and Geohazards of
Attur Valley, Tamil Nadu, India.
263
4.3 VALIDATION
The delineated groundwater potential zone map was validated by
choosing Salem block as a study window, with iso-resistivity map of the area
and transmissivity, permeability and specific yield (TKS) of the aquifers
derived from pump test. The resistivity valley can be taken as high water
potential zones and similarly the resistivity hills may be corresponds to low
water potential zones.TKS (transmissivity, permeability and specific yield)
signifies the characters of holding , to permit the flow and yield thus indicate
the water potential zones.
4.3.1 Iso-resistivity Method
Resistivity is one of the best geophysical methods being widely used
for groundwater exploration where the resistivity drops/changes /flats in the
curves are taken as water potential zone and it can be used as a validation tool
(Lahcen zouhri et al., 2004). Since, the study area covers nearly 9000sq.km
the identification and further correlation of low resistivity values can be an
ideal method (Fig.4.12). Using iso-resistivity values contours were drawn for
various depths (30m, 50m, 80m, 100m and 150m) and they were analyzed as
detailed below.
4.3.1.1 Resistivity at 30m depth (Fig.4.14a)
Resistivity valleys with 150 ohm contours were matching with high
potential zone in the western side of Salem block and poor zone in the
southern side. And 550m hill was observed in the eastern side which is again
matching with high potential zone. The central smaller valleys were matching
with high potential zone and moderate potential zone.
4.3.1.2 Resistivity at 50m depth (Fig.4.14b)
Resistivity valleys with 100 ohm were recorded in the western side
where it was coinciding with high potential zone and the other valleys
coinciding with moderate potential zone.

CChhaapptteerr -- 44 GGrroouunndd WWaatteerr RReessoouurrcceess EEvvaalluuaattiioonn…………
Geoinformatic Modelling for Certain Georesources and Geohazards of
Attur Valley, Tamil Nadu, India.
264
4.3.1.3 Resistivity at 80m depth (Fig.4.14c)
At western side the valley coincides with high potential zone and the
central and southern side it matches with moderate potential zone.
Easternside hill was matching with massive charnockite in the Uthumalai
area.
Fig. 4.14 Validation- Isoresistivity Method
CChhaapptteerr -- 44 GGrroouunndd WWaatteerr RReessoouurrcceess EEvvaalluuaattiioonn…………
Geoinformatic Modelling for Certain Georesources and Geohazards of
Attur Valley, Tamil Nadu, India.
265
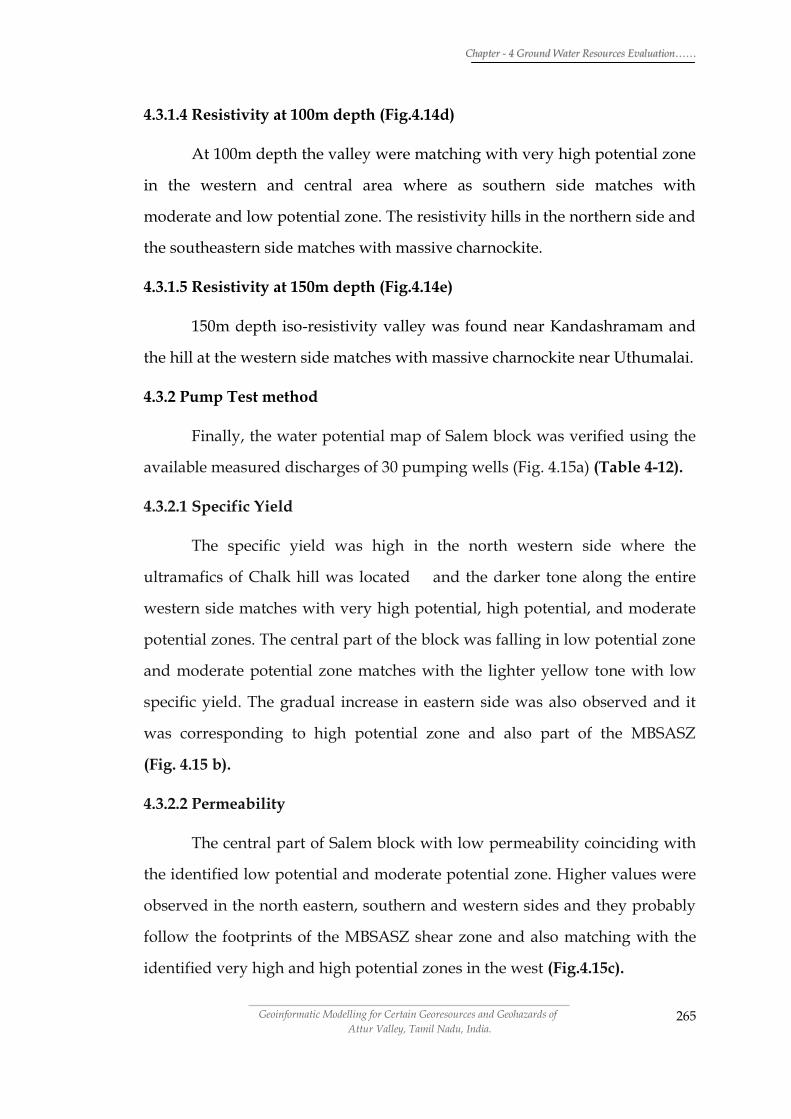
4.3.1.4 Resistivity at 100m depth (Fig.4.14d)
At 100m depth the valley were matching with very high potential zone
in the western and central area where as southern side matches with
moderate and low potential zone. The resistivity hills in the northern side and
the southeastern side matches with massive charnockite.
4.3.1.5 Resistivity at 150m depth (Fig.4.14e)
150m depth iso-resistivity valley was found near Kandashramam and
the hill at the western side matches with massive charnockite near Uthumalai.
4.3.2 Pump Test method
Finally, the water potential map of Salem block was verified using the
available measured discharges of 30 pumping wells (Fig. 4.15a) (Table 4-12).
4.3.2.1 Specific Yield
The specific yield was high in the north western side where the
ultramafics of Chalk hill was located and the darker tone along the entire
western side matches with very high potential, high potential, and moderate
potential zones. The central part of the block was falling in low potential zone
and moderate potential zone matches with the lighter yellow tone with low
specific yield. The gradual increase in eastern side was also observed and it
was corresponding to high potential zone and also part of the MBSASZ
(Fig. 4.15 b).
4.3.2.2 Permeability
The central part of Salem block with low permeability coinciding with
the identified low potential and moderate potential zone. Higher values were
observed in the north eastern, southern and western sides and they probably
follow the footprints of the MBSASZ shear zone and also matching with the
identified very high and high potential zones in the west (Fig.4.15c).

CChhaapptteerr -- 44 GGrroouunndd WWaatteerr RReessoouurrcceess EEvvaalluuaattiioonn…………
Geoinformatic Modelling for Certain Georesources and Geohazards of
Attur Valley, Tamil Nadu, India.
266
4.3.2.3 Transmissivity
Higher transmissivity was observed in the northeastern side where it
was coinciding with high potential zone and similar high transmissivity was
observed near chalk hills which falls under high potential zone. The central
low transmissivity value was corresponding to low potential zone and
moderate potential zone (Fig 4.15d).
Fig. 4.15 Validation- Pump Test Method
The verification of the groundwater potential map with the well yield
data reveals that the water potential map prepared was showing good
correlation still adequate number of pump well data will provide higher
degree of validation.

CChhaapptteerr -- 44 GGrroouunndd WWaatteerr RReessoouurrcceess EEvvaalluuaattiioonn…………
Geoinformatic Modelling for Certain Georesources and Geohazards of
Attur Valley, Tamil Nadu, India.
267
Table 4-12 Pump Test Locations and Aquifer Parameters
Sl
No
Name of Village
De
pth
of
we
ll
in'M
'
Mo
nth
&Y
ea
r o
f T
est
Pu
mp
ing
Ra
te i
n
Gp
m
Acc
ep
ted
Tra
nsm
isiv
ity
(T
in
pd
/ft)
Acc
ep
ted
P
erm
iab
ilit
y(K
in
Gp
d/s
q.f
t)
Sp
eci
fic
cap
icit
y
(S i
n g
pm
/ft
. of
D.D
)
1 Gajjalanakanapatty 44 Mar-79 50.25 1384.00 511.690 0.00
2 Valasiyur 40.8 May-79 59.70 2090.00 16.220 0.00
3 Kumarapalayam 54 Oct-79 27.50 500.00 0.439 0.00
4 Ammapalayam 45 Sep-79 6.00 21.28 0.172 0.00
5 Konamaduvu 80 Mar-82 12.40 158.42 0.758 0.1575
6 Governement Engg.college 70 Jan-81 6.00 126.00 0.640 5.5548
7 Gudumalai 42.5 Mar-82 12.40 0.00 0.000 0.00
8 Elampillai 78 Apr-83 96.00 1068.72 4.780 2.099
9 PWD SE'S Office compound 73 Jul-86 2.00 73.39 5.840 0.0280
10 Kannankuruchi 35 Mar-87 54.70 1623.15 22.370 0.0573
11 mettupatti 55 Mar-87 8.89 507.47 5.360 0.127
12 Pallakadi 60.5 Jan-87 2.19 27.29 0.180 0.023
13 Chettichavadi 60 Aug-87 21.70 847.86 5.180 0.225
14 Thamarainagar 60 Nov-91 2.19 - - -
15 Veerapandi Ist Pt 62 Jun-94 21.70 513.70 3.01 6.29
16 Veerapandi IInd Pt 62 Jul-94 21.70 1492.00 8.76 3.02
17 Sesanchavadi Ist Pt 75 Jun-95 34.20 0.00 0.000 0.00
18 Sesanchavadi IInd Pt 63 Jun-95 21.70 0.00 0.000 0.00
19 Chandrapillaivalasu Ist Pt 46 Jul-95 12.40 148.00 1.367 0.504
20 Chandrapillaivalasu IInd Pt 46 Aug-96 16.70 93.30 0.890 0.35
21 Muthunaicken patti Ist Pt 92 Mar-96 3.00 0.00 0.000 0.00
22 Muthunaikan patti Iind Pt 92 Mar-96
Poor yield - - -
23 Kullappanaickanoor Ist Pt 31 Oct-96 12.40 1016. 26.15 38.22
24 Kullappanaickanoor IInd Pt 36 Oct-96 70.20 2628.00 40.61 6.2
25 Kumarasamypatti 100 Sep-01 6.05 43.93 0.147 0.0414
26 Hasthampatti 79 Nov-01 2.19 - - -
27 Veeranam 44 Jan-02 16.70 188.81 1.546 0.427
28 Maniyanoor 73 Feb-04 12.40 3.09 0.015 0.279
29 Ammapet 53 Feb-01 34.20 140.38 0.92 0.378
30 Hasthampatti 42 Feb-01 8.89 48.67 0.419 0.108

CChhaapptteerr -- 44 GGrroouunndd WWaatteerr RReessoouurrcceess EEvvaalluuaattiioonn…………
Geoinformatic Modelling for Certain Georesources and Geohazards of
Attur Valley, Tamil Nadu, India.
268
4.4 BLOCK WISE GROUND WATER POTENTIAL MAP
After the proper validation the quantification can be done at least in
terms of areal extent which could be used for planning and execution at block
level. The blocks at the periphery of the study window were partial. Except
those blocks, total area of the water potential zones of all other blocks were
calculated and were presented in the Table 4-13. The block wise water
potential map was shown in Fig.4.16.
Fig. 4.16 Block wise Water Potential Zones

CChhaapptteerr -- 44 GGrroouunndd WWaatteerr RReessoouurrcceess EEvvaalluuaattiioonn…………
Geoinformatic Modelling for Certain Georesources and Geohazards of
Attur Valley, Tamil Nadu, India.
269
Table 4-13 Block wise Water Potential Zones
S.No Block name Class Area in sq.km
1 Attur
Very high potential zone 1.71
High potential zone 17.06
Moderate potential zone 132.63
Low potential zone 107.03
Very low potential zone 55.08
Poor 14.68
2 Ayothiapattinam
Very high potential zone 1.59
High potential zone 17.16
Moderate potential zone 91.59
Low potential zone 116.83
Very low potential zone 34.16
Poor 3.63
3 Chinnaselam
Very high potential zone 0.12
High potential zone 11.42
Moderate potential zone 153.10
Low potential zone 218.07
Very low potential zone 28.96
Poor 6.44
4 Dharmapuri
Very high potential zone 0.05
High potential zone 3.45
Moderate potential zone 10.59
Low potential zone 6.91
Very low potential zone 12.22
Poor 2.37
5 Elichipalayam
Very high potential zone 1.59
High potential zone 19.70
Moderate potential zone 48.50
Low potential zone 76.89
Very low potential zone 1.22
Poor 0.02
6 Erumapatti
Moderate potential zone 2.55
Low potential zone 3.24
Very low potential zone 0.51
Poor 0.00075

CChhaapptteerr -- 44 GGrroouunndd WWaatteerr RReessoouurrcceess EEvvaalluuaattiioonn…………
Geoinformatic Modelling for Certain Georesources and Geohazards of
Attur Valley, Tamil Nadu, India.
270
7 Gangavalli
Very high potential zone 0.73
High potential zone 19.44
Moderate potential zone 156.86
Low potential zone 232.037
Very low potential zone 97.36
Poor 14.69
8 Harur
High potential zone 0.038
Moderate potential zone 19.60
Low potential zone 95.59
Very low potential zone 90.25
Poor 24.28
9 Kadayampatti
Very high potential zone 2.91
High potential zone 36.75
Moderate potential zone 125.69
Low potential zone 105.90
Very low potential zone 63.13
Poor 3.95
10 Kallakurichi
High potential zone 1.30
Moderate potential zone 86.23
Low potential zone 174.47
Very low potential zone 16.29
Poor 2.64
11 Kalrayan hill
High potential zone 1.13
Moderate potential zone 69.20
Low potential zone 263.85
Very low potential zone 195.99
Poor 21.84
12 Kolli-hills
High potential zone 0.90
Moderate potential zone 33.23
Low potential zone 119.95
Very low potential zone 147.31
Poor 38.99
13 Kurinjipadi
High potential zone 0.32
Moderate potential zone 31.94
Low potential zone 63.92
Very low potential zone 21.67
Poor 9.36
14 Mallasamudram
Very high potential zone 0.31
High potential zone 9.90
Moderate potential zone 52.04
Low potential zone 54.51
Very low potential zone 0.91
Poor 0.056

CChhaapptteerr -- 44 GGrroouunndd WWaatteerr RReessoouurrcceess EEvvaalluuaattiioonn…………
Geoinformatic Modelling for Certain Georesources and Geohazards of
Attur Valley, Tamil Nadu, India.
271
15 Mangalur
Very high potential zone 0.018
High potential zone 1.65
Moderate potential zone 48.13
Low potential zone 105.89
Very low potential zone 7.85
Poor 0.35
16 Mcdonald-choultry
Very high potential zone 0.0085
High potential zone 0.73
Moderate potential zone 11.10
Low potential zone 15.69
Very low potential zone 1.23
Poor 0.0118
17 Mecheri
Very high potential zone 0.0117
High potential zone 5.84
Moderate potential zone 3.53
Low potential zone 1.34
Very low potential zone 0.0318
Poor 0.00468
18 Morappur
Moderate potential zone 0.01224
Low potential zone 0.79
Very low potential zone 0.053
Poor 0.46
19 Nallampalli
Very high potential zone 3.32
High potential zone 15.17
Moderate potential zone 24.33
Low potential zone 38.92
Very low potential zone 13.995
Poor 1.086
20 Namagiripettai
Very high potential zone 0.62
High potential zone 17.67
Moderate potential zone 109.39
Low potential zone 111.92
Very low potential zone 55.74
Poor 15.72
21 Namakkal
High potential zone 0.89
Moderate potential zone 17.24
Low potential zone 44.91
Very low potential zone 1.027
Poor 0.081
22 Omalur
Very high potential zone 2.479
High potential zone 21.019
Moderate potential zone 80.12
Low potential zone 68.40
Very low potential zone 9.51
Poor 0.0046

CChhaapptteerr -- 44 GGrroouunndd WWaatteerr RReessoouurrcceess EEvvaalluuaattiioonn…………
Geoinformatic Modelling for Certain Georesources and Geohazards of
Attur Valley, Tamil Nadu, India.
272
23 Panamarathupatty
Very high potential zone 0.047
High potential zone 7.50
Moderate potential zone 56.34
Low potential zone 40.92
Very low potential zone 53.60
Poor 17.43
24 Pappireddipatti
Very high potential zone 1.28
High potential zone 15.11
Moderate potential zone 117.79
Low potential zone 213.57
Very low potential zone 192.10
Poor 14.18
25 Paramathi
High potential zone 1.94
Moderate potential zone 7.62
Low potential zone 6.61
Very low potential zone 0.30
Poor 0.007
26 Pendanaickenpalayam
Very high potential zone 16.92
High potential zone 43.88
Moderate potential zone 135.71
Low potential zone 198.02
Very low potential zone 107.35
Poor 46.37
27 Puduchathiram
High potential zone 12.37
Moderate potential zone 75.56
Low potential zone 106.75
Very low potential zone 7.97
Poor 1.68
28 Rasipuram
High potential zone 3.91
Moderate potential zone 40.26
Low potential zone 57.62
Very low potential zone 17.03
Poor 5.75
29 Rishivandhiyam
High potential zone 1.40
Moderate potential zone 19.29
Low potential zone 49.66
Very low potential zone 5.61
Poor 0.23
30 Salem
Very high potential zone 1.23
High potential zone 6.62
Moderate potential zone 35.79
Low potential zone 39.79
Very low potential zone 13.064
Poor 0.48

CChhaapptteerr -- 44 GGrroouunndd WWaatteerr RReessoouurrcceess EEvvaalluuaattiioonn…………
Geoinformatic Modelling for Certain Georesources and Geohazards of
Attur Valley, Tamil Nadu, India.
273
31 Salem corporation
Very high potential zone 0.102
High potential zone 2.44
Moderate potential zone 20.42
Low potential zone 34.79
Very low potential zone 9.81
Poor 0.57
32 Sankarapuram
Very high potential zone 0.021
High potential zone 5.12
Moderate potential zone 49.71
Low potential zone 154.93
Very low potential zone 27.22
Poor 3.99
33 Sendamangalam
High potential zone 8.17
Moderate potential zone 61.85
Low potential zone 57.96
Very low potential zone 25.63
Poor 5.068
34 Thalaivasal
High potential zone 1.31
Moderate potential zone 80.36
Low potential zone 148.79
Very low potential zone 47.17
Poor 14.95
35 Thandarampet
Low potential zone 0.012
Very low potential zone 4.57
Poor 2.05
36 Tharamangalam
Moderate potential zone 1.29
Low potential zone 9.96
Very low potential zone 1.89
Poor 0.057
37 Thuraiyur
Low potential zone 15.98
Very low potential zone 44.97
Poor 8.12
38 Uppiliyapuram
Very high potential zone 0.098
High potential zone 4.79
Moderate potential zone 53.31
Low potential zone 88.74
Very low potential zone 105.90
Poor 15.104
39 Valapady
Very high potential zone 1.55
High potential zone 18.64
Moderate potential zone 75.16
Low potential zone 92.056
Very low potential zone 51.45
Poor 8.34

CChhaapptteerr -- 44 GGrroouunndd WWaatteerr RReessoouurrcceess EEvvaalluuaattiioonn…………
Geoinformatic Modelling for Certain Georesources and Geohazards of
Attur Valley, Tamil Nadu, India.
274
40 Veerapandy
Very high potential zone 2.17
High potential zone 14.47
Moderate potential zone 47.66
Low potential zone 62.86
Very low potential zone 3.16
Poor 0.00148
41 Vennandur
Very high potential zone 1.18
High potential zone 15.068
Moderate potential zone 59.66
Low potential zone 42.20
Very low potential zone 49.23
Poor 17.15
42 Veppanthattai
High potential zone 11.07
Moderate potential zone 194.95
Low potential zone 318.18
Very low potential zone 27.86
Poor 5.12
43 Veppur
High potential zone 0.94
Moderate potential zone 13.36
Low potential zone 57.77
Very low potential zone 4.15
Poor 0.52
44 Yercaud
Very high potential zone 0.0087
High potential zone 4.095
Moderate potential zone 34.19
Low potential zone 181.35
Very low potential zone 142.43
Poor 22.20
4.5 NEOTECTONICS VS GROUNDWATER
4.5.1 General
Caponera (1989) interpreted the remote sensing image for
groundwater surveying and extracted the morphology, lineaments, structural
features, vegetation and drainage from the image. His study concluded that
the tensional fractures by tectonism are related to the groundwater storage or
movement in bedrock.
Travaglia (1989) also studied the fracture and groundwater exploration
in two areas, the Bayhan Al Qasab area (Yemen) and the Philippines. He also
revealed that the tensional fractures (N10ºW and N15º-25ºE directions) are
related with groundwater exploration in the Karst region, Philippines.

CChhaapptteerr -- 44 GGrroouunndd WWaatteerr RReessoouurrcceess EEvvaalluuaattiioonn…………
Geoinformatic Modelling for Certain Georesources and Geohazards of
Attur Valley, Tamil Nadu, India.
275
Sidle and Lee (1995) concluded that anisotropic hydraulic conductivity
was related to the orientation of geologic structures. Larson (1972) indicated
that wells located in fractures which were interpreted as extensional fractures
were much more productive than wells located in shear fractures.
Kafri (1970) has inferred that the active tectonic movements have
substantially altered the Cenomanian – Turonian carbonate aquifer of Galilee
region.
Usha et al. (1989), on the basis of thematic correlations, inferred that
the faults / fractures perpendicular to the fold axis are better groundwater
prospects when compared to conjugate ones.
Ramasamy and Balaji (1993) have classified the lineaments of Tamil
Nadu into Precambrian, Precambrian reactivation in Pleistocene and
exclusive Pleistocene and observed that the exclusive Pleistocene lineaments
have better groundwater prospects.
Similar modifications of groundwater flow due to recently renewed
tectonic activities were observed by Kresic (1995) in Dinaric Karst of Balkans
area.
Kissin et al. (1996), on the basis of their studies in Main Kopetdag fault
zone of Turkmenistan demonstrated that the groundwater level fluctuation
can be used as precursor for earthquakes.
Similar observations were made on the various aquifer responses and
health during both prior and after the 21st September 1999 Chi – Chi
earthquake of China (Fu-qiong Huang et al., 1999).
Gudmundsson (1999) has observed that the postglacial crustal doming
and the related formation of fractures of Norway have substantially changed
the groundwater behavior in the area.

CChhaapptteerr -- 44 GGrroouunndd WWaatteerr RReessoouurrcceess EEvvaalluuaattiioonn…………
Geoinformatic Modelling for Certain Georesources and Geohazards of
Attur Valley, Tamil Nadu, India.
276
Again by analyzing the various azimuthal frequencies of lineaments,
Ramasamy et al. (2001) inferred that the groundwater behaviours are
substantially modified by the Pleistocene faults of Tamil Nadu.
Fracture zones characterized by high transmissivity generally generate
the high groundwater production area but it is very problematic to identify
these highly productive fractures. Structural analysis and tectonic history
study can provide useful information for this problem in regional scale
studies (Mabee et al., 1994).
In the recent years, in Pingtung plain, Taiwan, SAR interferometry
studies were carried out to demonstrate the possible impacts of active tectonic
movements over groundwater system (Chang et al., 2004).
In India too, the studies have been done on the general tectonics and
the groundwater behaviours and in some areas, active tectonics and their
impact over groundwater systems.
Mohammad Aryamanesh et al. (2009) have showed that the location of
ground water potential zones and the artificial recharge regions have a great
relationship with seismic activities, fractured zones and the earthquake
epicenters, in the Isfahak is located in the south of the city of Tabas, eastern
Iran
Rana Chatterjee and Raja Ram Purohit (2009) have used water level
fluctuation method for groundwater resource estimation by studying long
term water level trend.
Continuous multiple tectonism and shear mechanism can change the
previous geometry of fractures, so it is difficult to define the total fracture
mechanism and to extract the extensional fractures. But, if we know the
tectonic history and define the extensional fractures, we can try to reveal the
relation between lineaments or extensional lineaments and groundwater
productivity. Though the water level fluctuation is a direct dependant on
rainfall, infiltration and usage, the fluctuation trend would be entirely

CChhaapptteerr -- 44 GGrroouunndd WWaatteerr RReessoouurrcceess EEvvaalluuaattiioonn…………
Geoinformatic Modelling for Certain Georesources and Geohazards of
Attur Valley, Tamil Nadu, India.
277
controlled by the general structural orientation of the aquifers, landforms,
topographic lows, structural basins and in fact the fractures.
Since we mapped the Neotectonic lineaments a behavior of water level
fluctuation linearity could reveal the water table dynamics controlled by these
lineaments.
4.5.2 Water level Fluctuations and Water Bearing Lineaments
Water level data for the entire study window was collected from Public
Works Department (PWD) and Tamilnadu water supply and drainage board
(TWAD) for 204 wells from the year 1990 for both the seasons up to 2008. The
isolines for water level were drawn with the SURFER and then exported to
ARCGIS and the trend of the fluctuation pattern was studied to establish the
relationship between Neotectonic lineaments. The valleys were correlated
with the Neotectonic lineaments and the variation could be traced with
respect to seasonal and temporal variations. The final results were tabulated
and the lineaments which bear water for the entire period of study were taken
as water bearing lineaments (Table 4-14).
A detailed analysis was made on the water level data for the study area
and they display a fluctuation trend along certain directions. The premonsoon
and post monsoon water level data showed a great variation in the water
level still the water level valleys were located along certain pockets within
the study area. Most of the water level valleys were concentrated along the
intersections of many differently oriented lineaments.
4.5.2.1 Water level Fluctuations Vs Neotectonic Lineaments (1990)
Water level valleys were observed near south western side of the the
study area and along E-W trending Swetha Nadi fault. The trends of the
valleys match with the neotectonic lineaments shown in the table. 4.14.
In the post monsoon season the valley were observed near north of
Kolli hills and along Tirumanimuthar stream and near the eastern side of the
study area.

CChhaapptteerr -- 44 GGrroouunndd WWaatteerr RReessoouurrcceess EEvvaalluuaattiioonn…………
Geoinformatic Modelling for Certain Georesources and Geohazards of
Attur Valley, Tamil Nadu, India.
278
Fig.4.17 Water level Fluctuations Vs Neotectonics (Year 1990)
The trend of the valley was generally aligning with NE-SW direction in
the western side. N-S trend and E-W were also seen and reflecting the nature
of fractures controlling the storage capacity of aquifer (Fig. 4.17).

CChhaapptteerr -- 44 GGrroouunndd WWaatteerr RReessoouurrcceess EEvvaalluuaattiioonn…………
Geoinformatic Modelling for Certain Georesources and Geohazards of
Attur Valley, Tamil Nadu, India.
279
4.5.2.2 Water level Fluctuations Vs Neotectonic Lineaments (1991- 1993)
In the year 1991, there was a marked difference in the water level. In
the post monsoon season where the water level varies between 2 to 30m but
in the pre monsoon season the water level varies between 5 to 80m. The
trends of the valleys which are concordant with the water level valleys were
taken as water bearing valleys (Table 4-14).
Max Min Fig.4.18 Water level Fluctuations Vs Neotectonics (Years 1991 - 1993)

CChhaapptteerr -- 44 GGrroouunndd WWaatteerr RReessoouurrcceess EEvvaalluuaattiioonn…………
Geoinformatic Modelling for Certain Georesources and Geohazards of
Attur Valley, Tamil Nadu, India.
280
In 1991 pre monsoon season, major valleys were found near Belur,
Thumbal area, South of Salem and Thalaivasal towns. The valleys were broad
and widely distributed, whereas in post monsoon season the valleys were
restricted to Tirumanimuthar stream course and north of Kalrayan hills (Fig.
4.18a&b).
In 1992 premonsoon season, the NE-SW lineaments running west and
east of Chitteri hills seems to have control over the water level of NE and SW
zones of Salem.
In post monsoon season, NE-SW trending Chitteri east lineaments have
control over the water level valleys NE and SW of Salem; NW-SE lineaments
have control over Attur- Gangavalli region and N-S lineaments in the east of
Kalrayan hills (Fig.4.18c&d).
In 1993 premonsoon season, the N-S and E-W lineaments have great
control over valley at the east and west of Salem. The NW-SE lineaments have
their role in Gangavalli and Vazhapadi region (Fig.4.18e&f).
4.5.2.3 Water level Fluctuations Vs Neotectonic Lineaments (1994- 1996)
In the year 1994 premonsoon season NE-SW, E-W and N-S lineaments
have the control over the valleys in the south of Salem sector. NW-SE
lineaments L12 and L16 have their control near Attur segment. N-S trending
L27, L28, L58 and L72 have seems to carry water from high rain fed Kalrayan
hills to Gangavalli zone and further south.
In the post monsoon season prominent valleys were observed in the
central part of Attur valley, Gangavalli, Tirumanimuthar stream course. The
NE-SW and NW-SE lineaments have good control and the valleys were
perfectly aligning with the lineaments (Fig.4.19a&b).
In the year 1995, isolated patches of valleys were found in the
Vazhapadi, and the NW-SE lineaments L97and L63 have their role of
controlling water table. The lineaments L27, L28 and L68 drain the water to
Thammampatti zone. In the post monsoon season, the NE-SW trending

CChhaapptteerr -- 44 GGrroouunndd WWaatteerr RReessoouurrcceess EEvvaalluuaattiioonn…………
Geoinformatic Modelling for Certain Georesources and Geohazards of
Attur Valley, Tamil Nadu, India.
281
lineaments control the flow from Belur –Vazhapadi segment to South of
Salem region. NW-SE carries water from the Chitteri and Kalrayan catchment
to Gangavalli zone (Fig.4.19c&d).
Max Min
Fig.4.19 Water level Fluctuations Vs Neotectonics (Years 1994 - 1996)

CChhaapptteerr -- 44 GGrroouunndd WWaatteerr RReessoouurrcceess EEvvaalluuaattiioonn…………
Geoinformatic Modelling for Certain Georesources and Geohazards of
Attur Valley, Tamil Nadu, India.
282
1996 pre monsoon season isolated patches of valleys were observed
and the post monsoon season was covered with broad valleys. The NE-SW
trending Lineaments L84 and L87 were aligning with valleys south of Salem
and NW-SE trending L74 and L75 were aligning with the Valley connecting
Rasipuram- Salem sector. NW-SE trending L68 carries water from Belur to
Attur area and N-S trending L58 and L72 carries water from Kalrayan to
Gangavalli (Fig.4.19e&f).
4.5.2.4 Water level Fluctuations Vs Neotectonic Lineaments (1997- 1999)
In 1997 premonsoon season, N-S trending L39 and L76 lineaments
seem to have control along Chitteri to Rasipuram segment. NW-SE trending
L63 and L68 have control in Gangavalli area and N-S trending L33- L58 and
L91 have control over the valleys Gangavalli and in Kallakurichi area
respectively. In post monsoon season L40, L69, L84 and L87 lineaments have
control over NE-SW direction and L11 and L63 have their control along NW-
SE direction (Fig.4.20a&b).
In 1998 premonsoon season, apart from the general controlling
lineaments the NE-SW trending L6 and L46 have their control along Metala to
Attur valley. Similar trend was observed in postmonsoon season
(Fig.4.20c&d).
In 1999 premonsoon season N-S trending L39 and L67 aligning with
valleys at Chitteri-Metala sector. L74 and L75 have their control along NW-SE
directions. Broad N-S trending valleys were observed around Attur area and
aligning with N-S lineaments L27, L58 and L72. Postmonsoon season shows
isolated valley with controlling lineaments (Fig.4.20c&d).
4.5.2.5 Water level Fluctuations Vs Neotectonic Lineaments (2000- 2002)
In 2000 premonsoon season, very broad valleys were observed around
Vazhapadi, Rasipuram, south of Salem and east of Attur. The neotectonic and
significant lineaments are equally important in the flow of water in this part
of region. Post monsoon season N-S trending L36 and L67 have their great
control in the N-S trending valleys (Fig.4.21a&b).

CChhaapptteerr -- 44 GGrroouunndd WWaatteerr RReessoouurrcceess EEvvaalluuaattiioonn…………
Geoinformatic Modelling for Certain Georesources and Geohazards of
Attur Valley, Tamil Nadu, India.
283
In 2001 L69, L84 and L87 lineaments have their control along NE-SW
directions and L98, L44, L75 and L74 along NW-SE directions. In post
monsoon season isolated valley were observed and E-W lineament L38 has its
contribution of controlling on the south of Kalrayan (Fig.4.21c&d).
Max Min
Fig.4.20 Water level Fluctuations Vs Neotectonics (Years 1997 - 1999)

CChhaapptteerr -- 44 GGrroouunndd WWaatteerr RReessoouurrcceess EEvvaalluuaattiioonn…………
Geoinformatic Modelling for Certain Georesources and Geohazards of
Attur Valley, Tamil Nadu, India.
284
In 2002 L1, L23, and L78 have their control in post monsoon season and
NE-SW trending lineaments have higher control in both the seasons
(Fig.4.21e&f).
Max Min
Fig.4.21 Water level Fluctuations Vs Neotectonics (Years 2000 - 2002)

CChhaapptteerr -- 44 GGrroouunndd WWaatteerr RReessoouurrcceess EEvvaalluuaattiioonn…………
Geoinformatic Modelling for Certain Georesources and Geohazards of
Attur Valley, Tamil Nadu, India.
285
4.5.2.6 Water level Fluctuations Vs Neotectonic Lineaments (2003-2005)
In the year 2003 premonsoon season, valleys were found along Belur –
Attur sector with NW-SE controlling lineaments NL12, L16 and NL14. N-S
lineaments were aligning valleys near Omalur and Kallakurichi sector.
Max Min
Fig.4.22 Water level Fluctuations Vs Neotectonics (Years 2003 - 2005)

CChhaapptteerr -- 44 GGrroouunndd WWaatteerr RReessoouurrcceess EEvvaalluuaattiioonn…………
Geoinformatic Modelling for Certain Georesources and Geohazards of
Attur Valley, Tamil Nadu, India.
286
Similar, conditions prevails in postmonsoon season also (Fig.4.22a&b).
In the year 2004 the valleys and their spread were increased after post
monsoon and in general the NE-SW and NW-SE lineaments were dominating
the control of the water level (Fig.4.22 c&d). In the year 2005, the heavy
rainfall has completely saturated with water and the barriers were
disappeared and the almost all the lineaments aligning with them (Fig.
4.22e&f).
Max Min
Fig.4.23 Water level Fluctuations Vs Neotectonics (Years 2006 - 2008)

CChhaapptteerr -- 44 GGrroouunndd WWaatteerr RReessoouurrcceess EEvvaalluuaattiioonn…………
Geoinformatic Modelling for Certain Georesources and Geohazards of
Attur Valley, Tamil Nadu, India.
287
4.5.2.7 Water level Fluctuations Vs Neotectonic Lineaments (2006-2008)
In the year 2006 the entire region received good amount of rainfall and
it was reflected in the wide and broad distributions of valleys on both the
seasons. In post monsoon season even the smallest hills were disappeared
(Fig.4.23a&b).
In the year 2007, the water level fluctuation was swinging between 0 to
28m in premonsoon and 0-25m in postmonsoon season. Almost many of the
significant and neotectonic lineaments were marked for controlling
(Fig.4.23 c&d).
In the year 2008, the dominance of the NE-SW, NW-SE and N-S
lineaments were observed along Salem-Omalur and Attur –Thalaivasal sector.
The post monsoon Chinna Salem, Gangavalli and Omalur area shows broad
valley and controlled by NE-SW and NW-SE lineaments (Fig.4.23e&f).
4.6 SYNTHESIS
This study has included all the significant lineaments as the water
conducive properties may rest upon any fractures/ lineaments irrespective of
its neotectonic characters. From the analysis of the water level valleys for 19
years from 1990 to 2008, we could observe that certain parts of the region
have permanent water level stable zones near Belur, Tirumanimuthar stream
course south of Salem, Rasipuram-Metala segment, Kallakurichi- Chinna
Salem - Thalaivasal segment, Thammampatti zone, Puthansandhai-west of
Kolli hill zone, Attur-Gangavalli zone, Thoppal Ar zone and Omalur-
Kadayampatti zone. These zones have at least small valleys throughout both
seasons of 19 years.
The E-W lineaments have control over valleys seen at the foot of
Shevaroys to Kalrayan, but seem to have a flow barrier at the middle of the
Salem-Attur segment, especially near Vazhapadi-Malliyakkarai segment. This
area is a topographic as well as a lithologic barrier. Moreover the general
foliation trend takes a northerly swerve near Godumalai but for the shear
zones and E-W trending lineaments the flow control would not have occurred
CChhaapptteerr -- 44 GGrroouunndd WWaatteerr RReessoouurrcceess EEvvaalluuaattiioonn…………
Geoinformatic Modelling for Certain Georesources and Geohazards of
Attur Valley, Tamil Nadu, India.
288
towards the east at heavy rainy season. This area is covered with numerous
dykes, mafic granulites and banded magnetite quartzite bands, these rocks
serve as walls in damming the flow of water despite dissected by many
lineaments. This area is also known for its carbonatites and carbonate gneiss
occurrences, and hence there is valid reason to believe the leachates from
carbonates form kankars and heals the primary and secondary porosities of
the rocks. At seasons of heavy rainfall (2002 & 2006) the barriers have been
breached and broad valleys could be seen (Fig.4.21e & 4.23b).
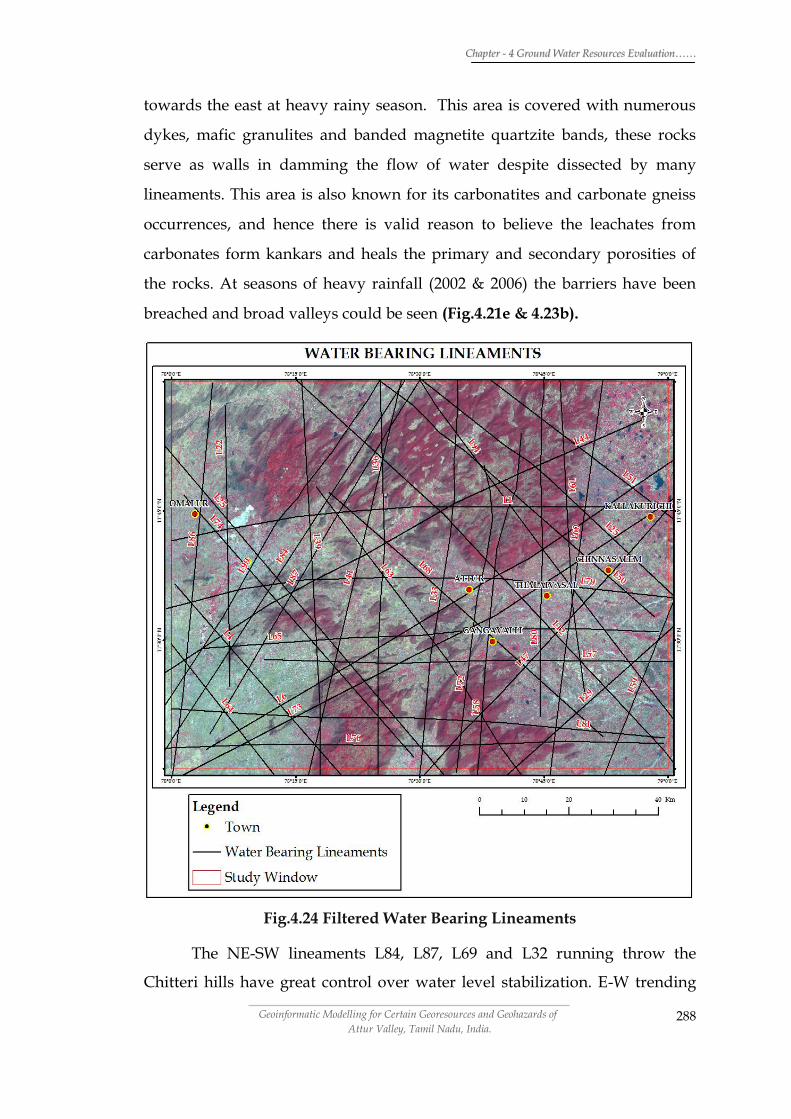
Fig.4.24 Filtered Water Bearing Lineaments
The NE-SW lineaments L84, L87, L69 and L32 running throw the
Chitteri hills have great control over water level stabilization. E-W trending

CChhaapptteerr -- 44 GGrroouunndd WWaatteerr RReessoouurrcceess EEvvaalluuaattiioonn…………
Geoinformatic Modelling for Certain Georesources and Geohazards of
Attur Valley, Tamil Nadu, India.
289
L1, L8, L38 and L40 have similar control and even they were penetrative
through the northeasterly trending foliated rocks. Similar penetrative trend
was observed along Swetha nadi fault lineament L76. The lineaments L12 and
L16 have the flow control along NW-SE directions in Thumbal-Gangavalli
sector. Apart from this N-S trending L6, L36 and L82 lineaments have the
control over the flow in Chitteri to Vazhapadi sector. Significant lineaments
do also have the control in the ground water flow especially L60, L68, L91 and
L97 have control in the Kalrayan eastern segment. N-S trending L27, L28, L58
and L72 have seems to carry water from high rain fed Kalrayan hills to
Gangavalli zone and further south. The NE-SW trending lineaments control
the flow from Belur –Vazhapadi segment to South of Salem region. NW-SE
carries water from the Chitteri and Kalrayan catchment to Gangavalli zone.
This study has given a clear idea about the conductive nature of certain
lineaments. The lineaments which have been contributing the waterlevel
maintenance of the region were filtered out after evaluating the characters for
18 years of water level data for both seasons. The significant lineaments which
have contributed for at least ten seasons were filtered out as water bearing
lineaments viz. L1,L4, L6, L12, L22, L25, L29, L33, L36, L39, L41, L44, L47,
L50, L51, L57, L58, L59, L60, L63, L64, L65, L68, L69, L72, L73,L74, L75,
L76,L79, L80, L81, L84, L86, L87, L94 and L9 (Fig.4.24, Table 4-14). Out of
these 38 significant lineaments 18 are neotectonic lineaments they are NL1,
NL4, NL10, NL20, NL21, NL24, NL26, NL29, NL32, NL36, NL39, NL40, NL41,
NL42, NL45, NL46, NL48, NL50, NL51 and NL53 (Table4-14).
These lineaments intersection zones found to be highly water potential
and the same was found in the study (Fig.4.13). The shear zone with
weathered ultramafics and fissile hornblende gneiss seems to be very good
aquifers. The region like Salem has very unique lithology and they have
higher secondary porosity owing to intense shearing. Prime weightage was
assigned to lithology and proved to be correct with resistivity and aquifer
parameters study by pump test. The water level stable zones were also found
along the shear zones and lineament intersection areas.

CChhaapptteerr -- 44 GGrroouunndd WWaatteerr RReessoouurrcceess EEvvaalluuaattiioonn…………
Geoinformatic Modelling for Certain Georesources and Geohazards of
Attur Valley, Tamil Nadu, India.
290
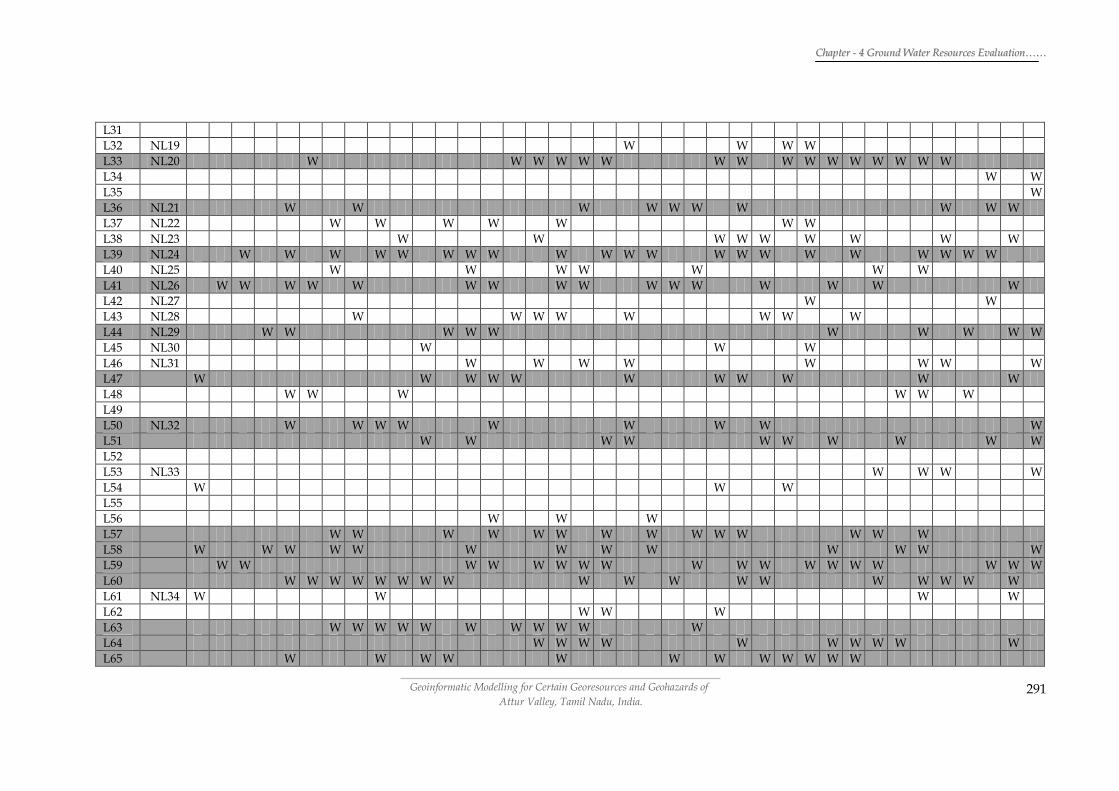
TABLE 4.14 WATER BEARING LINEAMENTS DERIVED FROM WATERLEVEL DATA FOR 19 YEARS
Sig
nif
ica
nt
Lin
eam
en
ts
Ne
ote
cto
nic
Lin
eam
en
ts
19
90 P
RE
19
90 P
M
19
91 P
RE
19
91 P
M
19
92 P
RE
19
92 P
M
19
93 P
RE
19
93 P
M
19
94 P
RE
19
94 P
M
19
95 P
RE
19
95 P
M
19
96 P
RE
19
96 P
M
19
97 P
RE
19
97 P
M
19
98 P
RE
19
98 P
M
19
99 P
RE
19
99 P
M
20
00 P
RE
20
00 P
M
20
01 P
RE
20
01 P
M
20
02 P
RE
20
02 P
M
20
03 P
RE
20
03 P
M
20
04 P
RE
20
04 P
M
20
05 P
RE
20
05 P
M
20
06 P
RE
20
06 P
M
20
07 P
RE
20
07 P
M
20
08 P
RE
20
08 P
M
L1 NL1 W W W W W W W W W W W W W W W W W W W W W W
L2 NL2 W W W
L3 NL3 W W W
L4
W W W W W W W W W W W W W W W W W W W W W W W W W W W W W W W W W
L5
W W W W W W W
L6 NL4 W W W W W W W W W W W W
L7 NL5 W W W
L8 NL6 W W W W W W W W
L9 NL7 W W W W W
L10 NL8 W W W W W
L11 NL9 W W W W
L12 NL10 W W W W W W W W W W W W W W W W W W W W
L13 NL11 W W W W W W
L14
L15 NL12 W W
L16 NL13 W W W W
L17 NL14 W W W W
L18
W
L19
L20
L21
L22
W W W W W W W W W W W W W W W W W W W W W W W
L23 NL15 W W W W W
L24
L25
W W W W W W W W W W
L26 NL16 W W W W W
L27 NL17 W W W W W W W
L28 NL18 W W W W W W W
L29
W W W W W W W W W W W
L30
W W W W
CChhaapptteerr -- 44 GGrroouunndd WWaatteerr RReessoouurrcceess EEvvaalluuaattiioonn…………
Geoinformatic Modelling for Certain Georesources and Geohazards of
Attur Valley, Tamil Nadu, India.
291
L31
L32 NL19 W W W W
L33 NL20 W W W W W W W W W W W W W W W W
L34
W W
L35
W
L36 NL21 W W W W W W W W W W
L37 NL22 W W W W W W W
L38 NL23 W W W W W W W W W
L39 NL24 W W W W W W W W W W W W W W W W W W W W W
L40 NL25 W W W W W W W
L41 NL26 W W W W W W W W W W W W W W W W
L42 NL27 W W
L43 NL28 W W W W W W W W
L44 NL29 W W W W W W W W W W
L45 NL30 W W W
L46 NL31 W W W W W W W W
L47
W W W W W W W W W W W
L48
W W W W W W
L49
L50 NL32 W W W W W W W W W
L51
W W W W W W W W W W
L52
L53 NL33 W W W W
L54
W W W
L55
L56
W W W
L57
W W W W W W W W W W W W W W
L58
W W W W W W W W W W W W W
L59
W W W W W W W W W W W W W W W W W W
L60
W W W W W W W W W W W W W W W W W W
L61 NL34 W W W W
L62
W W W
L63
W W W W W W W W W W W
L64
W W W W W W W W W W
L65
W W W W W W W W W W W W

CChhaapptteerr -- 44 GGrroouunndd WWaatteerr RReessoouurrcceess EEvvaalluuaattiioonn…………
Geoinformatic Modelling for Certain Georesources and Geohazards of
Attur Valley, Tamil Nadu, India.
292
L66
W
L67 NL35 W W W W
L68
W W W W W W W W W W W W
L69 NL36 W W W W W W W W W W W W W W W W W W
L70 NL37 W W W W W
L71 NL38 W W W W W W
L72
W W W W W W W W W
L73 NL39 W W W W W W W W W W
L74 NL40 W W W W W W W W W W W W W W W W W
L75 NL41 W W W W W W W W W W W W W W
L76 NL42 W W W W W W W W W W W W W W W W W W W W W W W
L77 NL43 W W W
L78 NL44 W W W W W
L79 NL45 W W W W W W W W W W
L80 NL46 W W W W W W W W W W W W W W W W
L81
W W W W W W W W W W W W W W W W
L82 NL47 W W W W W W W W W
L83
W W W
L84 NL48 W W W W W W W W W W W W W W W W W W
L85 NL49 W W W W W
L86 NL50 W W W W W W W W W
L87 NL51 W W W W W W W W W W W W W W W
L88
L89
W W W W W W W
L90
W W
L91
W W W W W W W W W W W W W W W W W W W W W W W W W W W W W W W
L92
L93
W W W W W W W
L94
W W W W W W W W W W W W W W W W W
L95
L96
W
L97
W W W W W W W
L98 NL52 W W W W W W
L99 NL53 W W W W W W W W W W W W W
PRE- PREMONSOON, PM-POST MONSOON, W- LINEAMENTS ALIGNING WITH WATER LEVEL VALLEYS