Embed Size (px)
Citation preview
SPECIAL STUDY 113UTAH GEOLOGICAL SURVEYa division ofUtah Department of Natural Resources
ISBN 1-55791-714-0
2004
GROUND-WATER QUALITY CLASSIFICATIONAND RECOMMENDED SEPTIC TANK
SOIL-ABSORPTION- SYSTEMDENSITY MAPS, CASTLE VALLEY,
GRAND COUNTY, UTAH
by
Mike Lowe, Janae Wallace, Charles E. Bishop, and Hugh A. Hurlow
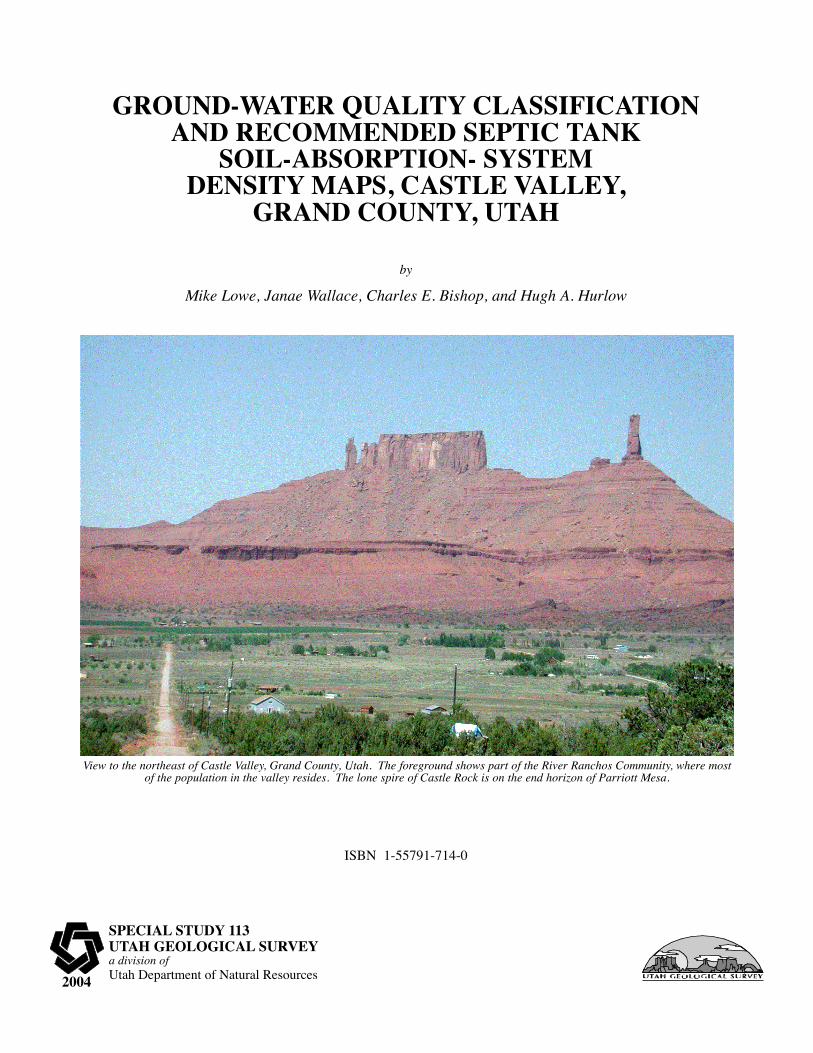
View to the northeast of Castle Valley, Grand County, Utah. The foreground shows part of the River Ranchos Community, where mostof the population in the valley resides. The lone spire of Castle Rock is on the end horizon of Parriott Mesa.
STATE OF UTAHOlene S. Walker, Govenor
DEPARTMENT OF NATURAL RESOURCESRobert L. Morgan, Executive Director
UTAH GEOLOGICAL SURVEYRichard G. Allis, Director
PUBLICATIONScontact
Natural Resources Map/Bookstore1594 W. North Temple
telephone: 801-537-3320toll-free: 1-888-UTAH MAP
website: http://mapstore.utah.govemail: [email protected]
THE UTAH GEOLOGICAL SURVEYcontact
1594 W. North Temple, Suite 3110Salt Lake City, UT 84116telephone: 801-537-3300
website: http://geology.utah.gov
Although this product represents the work of professional scientists, the Uah Department of Natural Resources, Utah Geological Survey, makes nowarranty, expressed or implied, regarding its suitability for any particular use. The Utah Department of Natural Resources, Utah Geological Sur-vey, shall not be liable under any circumstances for any direct, indirect, special, incidental, or consequential damages with respect to claims by usersof this product.
The Utah Department of Natural Resources receives federal aid and prohibits discrimination on the basis of race, color, sex, age, national origin,or disability. For information or complaints regarding discrimination, contact Executive Director, Utah Department of Natural Resources, 1594West North Temple #3710, Box 145610, Salt Lake City, UT 84116-5610 or Equal Employment Opportunity Commission, 1801 L. Street, NW, Wash-ington DC 20507.
Printed on recycled paper 1/04
CONTENTS
ABSTRACT . . . . . . . . . . . . . . . . . . . . . . . . . . . . . . . . . . . . . . . . . . . . . . . . . . . . . . . . . . . . . . . . . . . . . . . . . . . . . . . . . . . . . . . . . . . . . . . .1INTRODUCTION . . . . . . . . . . . . . . . . . . . . . . . . . . . . . . . . . . . . . . . . . . . . . . . . . . . . . . . . . . . . . . . . . . . . . . . . . . . . . . . . . . . . . . . . . . .1
Purpose and Scope . . . . . . . . . . . . . . . . . . . . . . . . . . . . . . . . . . . . . . . . . . . . . . . . . . . . . . . . . . . . . . . . . . . . . . . . . . . . . . . . . . . . . . . .3Ground-Water Quality Classification . . . . . . . . . . . . . . . . . . . . . . . . . . . . . . . . . . . . . . . . . . . . . . . . . . . . . . . . . . . . . . . . . . . . . . .3Septic-Tank Density/Water-Quality Degradation Analysis . . . . . . . . . . . . . . . . . . . . . . . . . . . . . . . . . . . . . . . . . . . . . . . . . . . . . .4
Well-Numbering System . . . . . . . . . . . . . . . . . . . . . . . . . . . . . . . . . . . . . . . . . . . . . . . . . . . . . . . . . . . . . . . . . . . . . . . . . . . . . . . . . . .4Location and Geography . . . . . . . . . . . . . . . . . . . . . . . . . . . . . . . . . . . . . . . . . . . . . . . . . . . . . . . . . . . . . . . . . . . . . . . . . . . . . . . . . . .4Population and Land Use . . . . . . . . . . . . . . . . . . . . . . . . . . . . . . . . . . . . . . . . . . . . . . . . . . . . . . . . . . . . . . . . . . . . . . . . . . . . . . . . . . .4Climate . . . . . . . . . . . . . . . . . . . . . . . . . . . . . . . . . . . . . . . . . . . . . . . . . . . . . . . . . . . . . . . . . . . . . . . . . . . . . . . . . . . . . . . . . . . . . . . . .4
PREVIOUS INVESTIGATIONS . . . . . . . . . . . . . . . . . . . . . . . . . . . . . . . . . . . . . . . . . . . . . . . . . . . . . . . . . . . . . . . . . . . . . . . . . . . . . . .6GEOLOGIC SETTING . . . . . . . . . . . . . . . . . . . . . . . . . . . . . . . . . . . . . . . . . . . . . . . . . . . . . . . . . . . . . . . . . . . . . . . . . . . . . . . . . . . . . . .6GROUND-WATER CONDITIONS . . . . . . . . . . . . . . . . . . . . . . . . . . . . . . . . . . . . . . . . . . . . . . . . . . . . . . . . . . . . . . . . . . . . . . . . . . . . .6
Introduction . . . . . . . . . . . . . . . . . . . . . . . . . . . . . . . . . . . . . . . . . . . . . . . . . . . . . . . . . . . . . . . . . . . . . . . . . . . . . . . . . . . . . . . . . . . . .6Valley-Fill Aquifer . . . . . . . . . . . . . . . . . . . . . . . . . . . . . . . . . . . . . . . . . . . . . . . . . . . . . . . . . . . . . . . . . . . . . . . . . . . . . . . . . . . . . . . .6
Occurrence . . . . . . . . . . . . . . . . . . . . . . . . . . . . . . . . . . . . . . . . . . . . . . . . . . . . . . . . . . . . . . . . . . . . . . . . . . . . . . . . . . . . . . . . . . .6Thickness . . . . . . . . . . . . . . . . . . . . . . . . . . . . . . . . . . . . . . . . . . . . . . . . . . . . . . . . . . . . . . . . . . . . . . . . . . . . . . . . . . . . . . . . . . . .9Ground-Water Depth, Volume, and Flow Direction . . . . . . . . . . . . . . . . . . . . . . . . . . . . . . . . . . . . . . . . . . . . . . . . . . . . . . . . . . .9Recharge and Discharge . . . . . . . . . . . . . . . . . . . . . . . . . . . . . . . . . . . . . . . . . . . . . . . . . . . . . . . . . . . . . . . . . . . . . . . . . . . . . . . .11
Relationship of Geology to Ground-Water Quality . . . . . . . . . . . . . . . . . . . . . . . . . . . . . . . . . . . . . . . . . . . . . . . . . . . . . . . . . . . . .11GROUND-WATER QUALITY CLASSIFICATION . . . . . . . . . . . . . . . . . . . . . . . . . . . . . . . . . . . . . . . . . . . . . . . . . . . . . . . . . . . . . . .11
Introduction . . . . . . . . . . . . . . . . . . . . . . . . . . . . . . . . . . . . . . . . . . . . . . . . . . . . . . . . . . . . . . . . . . . . . . . . . . . . . . . . . . . . . . . . . . . .11Results . . . . . . . . . . . . . . . . . . . . . . . . . . . . . . . . . . . . . . . . . . . . . . . . . . . . . . . . . . . . . . . . . . . . . . . . . . . . . . . . . . . . . . . . . . . . . . . .11
2000-2003 Data for Valley-Fill Aquifer . . . . . . . . . . . . . . . . . . . . . . . . . . . . . . . . . . . . . . . . . . . . . . . . . . . . . . . . . . . . . . . . . . . .11Data sources . . . . . . . . . . . . . . . . . . . . . . . . . . . . . . . . . . . . . . . . . . . . . . . . . . . . . . . . . . . . . . . . . . . . . . . . . . . . . . . . . . . . . .11Total-dissolved-solids concentrations . . . . . . . . . . . . . . . . . . . . . . . . . . . . . . . . . . . . . . . . . . . . . . . . . . . . . . . . . . . . . . . . . . .12Nitrate concentrations . . . . . . . . . . . . . . . . . . . . . . . . . . . . . . . . . . . . . . . . . . . . . . . . . . . . . . . . . . . . . . . . . . . . . . . . . . . . . . .12Other constituents . . . . . . . . . . . . . . . . . . . . . . . . . . . . . . . . . . . . . . . . . . . . . . . . . . . . . . . . . . . . . . . . . . . . . . . . . . . . . . . . . .12
Resulting Ground-Water Quality Classification . . . . . . . . . . . . . . . . . . . . . . . . . . . . . . . . . . . . . . . . . . . . . . . . . . . . . . . . . . . . . .12Class IA- Pristine ground water . . . . . . . . . . . . . . . . . . . . . . . . . . . . . . . . . . . . . . . . . . . . . . . . . . . . . . . . . . . . . . . . . . . . . . .14Class II- Drinking Water Quality ground water . . . . . . . . . . . . . . . . . . . . . . . . . . . . . . . . . . . . . . . . . . . . . . . . . . . . . . . . . . .14Unclassified part of valley-fill aquifer in Castle Valley . . . . . . . . . . . . . . . . . . . . . . . . . . . . . . . . . . . . . . . . . . . . . . . . . . . . .14
Land-Use Planning Considerations . . . . . . . . . . . . . . . . . . . . . . . . . . . . . . . . . . . . . . . . . . . . . . . . . . . . . . . . . . . . . . . . . . . . . . .15Current beneficial uses of ground water . . . . . . . . . . . . . . . . . . . . . . . . . . . . . . . . . . . . . . . . . . . . . . . . . . . . . . . . . . . . . . . . .15Potential for ground-water quality degradation . . . . . . . . . . . . . . . . . . . . . . . . . . . . . . . . . . . . . . . . . . . . . . . . . . . . . . . . . . .15Possible land-use planning applications of this ground-water quality classification . . . . . . . . . . . . . . . . . . . . . . . . . . . . . . .15
SEPTIC-TANK DENSITY/WATER-QUALITY DEGRADATION ANALYSIS . . . . . . . . . . . . . . . . . . . . . . . . . . . . . . . . . . . . . . . . . .15Introduction . . . . . . . . . . . . . . . . . . . . . . . . . . . . . . . . . . . . . . . . . . . . . . . . . . . . . . . . . . . . . . . . . . . . . . . . . . . . . . . . . . . . . . . . . . . .15Ground-Water Contamination from Septic-Tank Systems . . . . . . . . . . . . . . . . . . . . . . . . . . . . . . . . . . . . . . . . . . . . . . . . . . . . . . . .16
Pathogens . . . . . . . . . . . . . . . . . . . . . . . . . . . . . . . . . . . . . . . . . . . . . . . . . . . . . . . . . . . . . . . . . . . . . . . . . . . . . . . . . . . . . . . . . . .16Household and Industrial Chemicals . . . . . . . . . . . . . . . . . . . . . . . . . . . . . . . . . . . . . . . . . . . . . . . . . . . . . . . . . . . . . . . . . . . . . .16Phosphate . . . . . . . . . . . . . . . . . . . . . . . . . . . . . . . . . . . . . . . . . . . . . . . . . . . . . . . . . . . . . . . . . . . . . . . . . . . . . . . . . . . . . . . . . . .16Nitrate . . . . . . . . . . . . . . . . . . . . . . . . . . . . . . . . . . . . . . . . . . . . . . . . . . . . . . . . . . . . . . . . . . . . . . . . . . . . . . . . . . . . . . . . . . . . . .16
The Mass-Balance Approach . . . . . . . . . . . . . . . . . . . . . . . . . . . . . . . . . . . . . . . . . . . . . . . . . . . . . . . . . . . . . . . . . . . . . . . . . . . . . . .17General Methods . . . . . . . . . . . . . . . . . . . . . . . . . . . . . . . . . . . . . . . . . . . . . . . . . . . . . . . . . . . . . . . . . . . . . . . . . . . . . . . . . . . . .17Limitations . . . . . . . . . . . . . . . . . . . . . . . . . . . . . . . . . . . . . . . . . . . . . . . . . . . . . . . . . . . . . . . . . . . . . . . . . . . . . . . . . . . . . . . . . .17
Ground-Water Flow Calculations . . . . . . . . . . . . . . . . . . . . . . . . . . . . . . . . . . . . . . . . . . . . . . . . . . . . . . . . . . . . . . . . . . . . . . . . . . . .17Introduction . . . . . . . . . . . . . . . . . . . . . . . . . . . . . . . . . . . . . . . . . . . . . . . . . . . . . . . . . . . . . . . . . . . . . . . . . . . . . . . . . . . . . . . . .17Computer Modeling . . . . . . . . . . . . . . . . . . . . . . . . . . . . . . . . . . . . . . . . . . . . . . . . . . . . . . . . . . . . . . . . . . . . . . . . . . . . . . . . . .17Description of Model of Downs and Lasswell (Undated) . . . . . . . . . . . . . . . . . . . . . . . . . . . . . . . . . . . . . . . . . . . . . . . . . . . . . .18Results . . . . . . . . . . . . . . . . . . . . . . . . . . . . . . . . . . . . . . . . . . . . . . . . . . . . . . . . . . . . . . . . . . . . . . . . . . . . . . . . . . . . . . . . . . . . .20Model Limitations . . . . . . . . . . . . . . . . . . . . . . . . . . . . . . . . . . . . . . . . . . . . . . . . . . . . . . . . . . . . . . . . . . . . . . . . . . . . . . . . . . . .20
Septic-Tank System/Water-Quality Degradation Analyses . . . . . . . . . . . . . . . . . . . . . . . . . . . . . . . . . . . . . . . . . . . . . . . . . . . . . . . .21Introduction . . . . . . . . . . . . . . . . . . . . . . . . . . . . . . . . . . . . . . . . . . . . . . . . . . . . . . . . . . . . . . . . . . . . . . . . . . . . . . . . . . . . . . . . .21Results . . . . . . . . . . . . . . . . . . . . . . . . . . . . . . . . . . . . . . . . . . . . . . . . . . . . . . . . . . . . . . . . . . . . . . . . . . . . . . . . . . . . . . . . . . . . .23Recommendations for Land-Use Planning . . . . . . . . . . . . . . . . . . . . . . . . . . . . . . . . . . . . . . . . . . . . . . . . . . . . . . . . . . . . . . . . .23
SUMMARY AND CONCLUSIONS . . . . . . . . . . . . . . . . . . . . . . . . . . . . . . . . . . . . . . . . . . . . . . . . . . . . . . . . . . . . . . . . . . . . . . . . . . . .25ACKNOWLEDGMENTS . . . . . . . . . . . . . . . . . . . . . . . . . . . . . . . . . . . . . . . . . . . . . . . . . . . . . . . . . . . . . . . . . . . . . . . . . . . . . . . . . . .27REFERENCES . . . . . . . . . . . . . . . . . . . . . . . . . . . . . . . . . . . . . . . . . . . . . . . . . . . . . . . . . . . . . . . . . . . . . . . . . . . . . . . . . . . . . . . . . . . . .27APPENDICES . . . . . . . . . . . . . . . . . . . . . . . . . . . . . . . . . . . . . . . . . . . . . . . . . . . . . . . . . . . . . . . . . . . . . . . . . . . . . . . . . . . . . . . . . . . . .30
APPENDIX A. WATER QUALITY DATAAPPENDIX B. EPA PRIMARY GROUND-WATER QUALITY STANDARDS AND ANALYTICAL METHODAPPENDIX C. POTENTIAL CONTAMINANT SOURCESAPPENDIX D. EXPLANATION FOR PLATE 1APPENDIX E. WATER-WELL DATA FOR VALLEY-FILL ISOPACH MAPAPPENDIX F. AQUIFER TESTSAPPENDIX G. POTENTIAL SITES FOR PUBLIC-SUPPLY WELLS
TABLES
Table 1. Ground-water quality classes . . . . . . . . . . . . . . . . . . . . . . . . . . . . . . . . . . . . . . . . . . . . . . . . . . . . . . . . . . . . . . . . . . . . . . . . . . .3Table 2. Geologic and hydrologic characteristics of aquifers in southern Grand County . . . . . . . . . . . . . . . . . . . . . . . . . . . . . . . . . . .8Table 3. Typical characteristics of wastewater from septic-tank systems . . . . . . . . . . . . . . . . . . . . . . . . . . . . . . . . . . . . . . . . . . . . . . .16Table 4. Final hydraulic parameter values used in the Castle Valley ground-water flow model . . . . . . . . . . . . . . . . . . . . . . . . . . . . .20Table 5. Simulated steady-state ground-water budget for the valley-fill aquifer . . . . . . . . . . . . . . . . . . . . . . . . . . . . . . . . . . . . . . . . .21Table 6. Parameters used to perform a mass-balance analysis for ground-water flow domains . . . . . . . . . . . . . . . . . . . . . . . . . . . . .21Table 7. Results of the mass-balance analysis using the best-estimate nitrogen loading of 54.4 mg N/L for different ground-
water flow domains . . . . . . . . . . . . . . . . . . . . . . . . . . . . . . . . . . . . . . . . . . . . . . . . . . . . . . . . . . . . . . . . . . . . . . . . . . . . . . .22
FIGURES
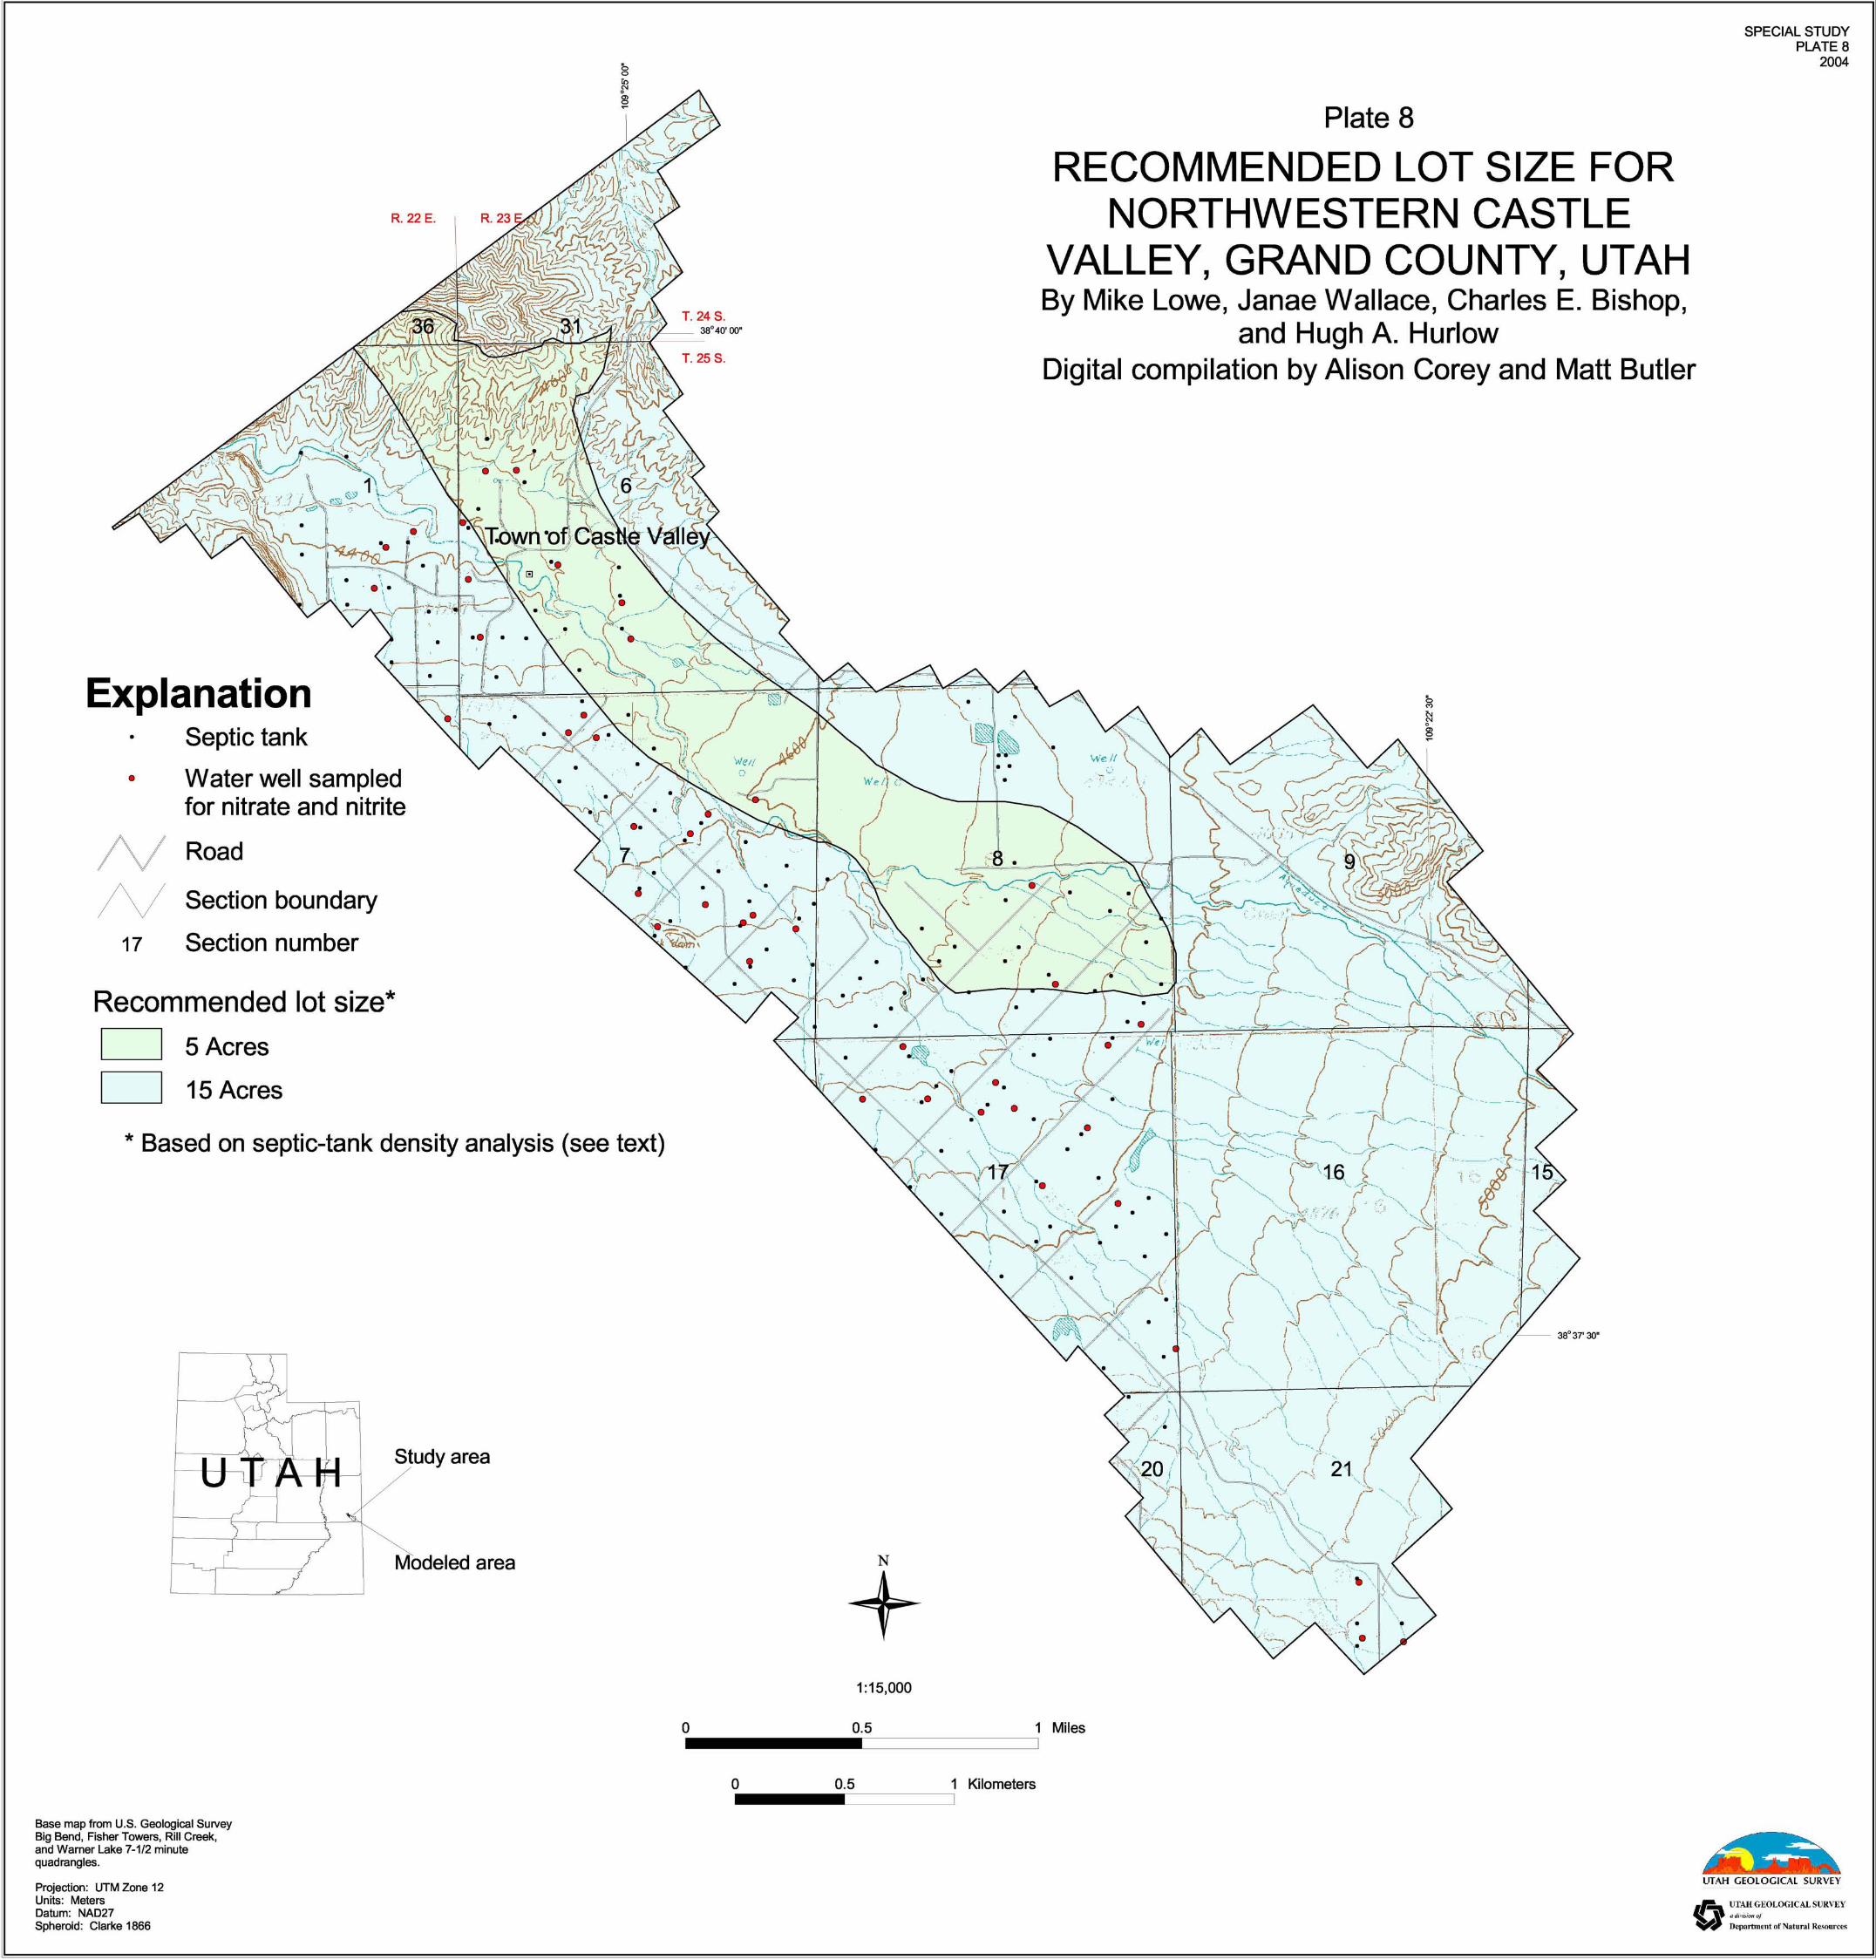
Figure 1. Drainage-basin study area, Castle Valley, Grand County . . . . . . . . . . . . . . . . . . . . . . . . . . . . . . . . . . . . . . . . . . . . . . . . . . . . .2Figure 2. Numbering system for wells in Utah . . . . . . . . . . . . . . . . . . . . . . . . . . . . . . . . . . . . . . . . . . . . . . . . . . . . . . . . . . . . . . . . . . . .5Figure 3. Regional tectonic setting of the study area showing major tectonic features . . . . . . . . . . . . . . . . . . . . . . . . . . . . . . . . . . . . .7Figure 4. Schematic block diagram showing ground-water flow in Castle Valley . . . . . . . . . . . . . . . . . . . . . . . . . . . . . . . . . . . . . . . . .9Figure 5. Potentiometric-surface map of northern Castle Valley . . . . . . . . . . . . . . . . . . . . . . . . . . . . . . . . . . . . . . . . . . . . . . . . . . . . . .10Figure 6. Water wells having chemical constituents that exceed secondary drinking-water standards in Castle Valley . . . . . . . . . . .13Figure 7. Specific conductance versus total-dissolved-solids concentration data . . . . . . . . . . . . . . . . . . . . . . . . . . . . . . . . . . . . . . . . .14Figure 8. Finite-difference grid and some boundary conditions used in the mathematical model . . . . . . . . . . . . . . . . . . . . . . . . . . . .19Figure 9. Ground-water flow domains in Castle Valley . . . . . . . . . . . . . . . . . . . . . . . . . . . . . . . . . . . . . . . . . . . . . . . . . . . . . . . . . . . . .22Figure 10. Projected septic-tank density versus nitrate concentration for domains 1 through 4 . . . . . . . . . . . . . . . . . . . . . . . . . . . . . .23Figure11. Recommended lot size based on septic-tank system density for northwestern Castle Valley . . . . . . . . . . . . . . . . . . . . . . . .26
PLATES
Plate 1. Geologic map of Castle ValleyPlate 2. Cross sectionsPlate 3. Schematic isopach map of valley-fill deposits, Castle Valley, Grand CountyPlate 4. Total-dissolved-solids concentration map for the valley-fill aquiferPlate 5. Nitrate concentration map for the valley-fill aquiferPlate 6. Ground-water quality classification map for the valley-fill aquiferPlate 7. Potential contaminant source map for the valley-fill aquiferPlate 8. Recommended lot size for northwestern Castle Valley
ABSTRACT
Castle Valley in southeastern Utah is experiencing anincrease in residential development, all of which uses septictank soil-absorption systems for wastewater disposal. Mostof this development is on unconsolidated deposits of theunconfined valley-fill aquifer, the primary source of drinkingwater. The purposes of our study are to (1) classify theground-water quality of the principal aquifer to formallyidentify and document the beneficial use of the valley'sground-water resource, and (2) apply a ground-water flowmodel using a mass-balance approach to determine thepotential impact of projected increased numbers of septic-tank systems on water quality in the Castle Valley valley-fillaquifer and thereby recommend appropriate septic-systemdensity requirements to limit water-quality degradation.
Utah's ground-water quality classes are based mostly ontotal-dissolved-solids (TDS) concentrations as follows:Class IA (Pristine), less than 500 mg/L; Class II (DrinkingWater Quality), 500 to less than 3,000 mg/L; Class III (Lim-ited Use), 3,000 to less than 10,000 mg/L; and Class IV(Saline), 10,000 mg/L and greater. Aquifer classification isbased on data from water wells representing the valley-fillmaterial.
In the mass-balance approach, the nitrogen mass fromprojected additional septic tanks is added to the current nitro-gen mass and then diluted with ground-water flow availablefor mixing plus the water added by the septic-tank systemsthemselves. Ground water available for mixing was calcu-lated based on estimated parameters representing existingconditions using a Brigham Young University simulation ofthe ground-water flow system in Castle Valley.
The quality of water in the Castle Valley valley-fillaquifer is generally good. In the northwestern part (40 per-cent) of the valley, we classify ground water in 48 percent ofthe aquifer as Class IA and 52 percent as Class II, based ondata from 54 wells sampled during either October 2001 orFebruary 2003, and on TDS values converted from specific-conductance data for 14 wells and 4 surface-water sitesreported by the Utah Department of Agriculture and Food,
the Utah Division of Water Rights, the Utah Geological Sur-vey, and the Utah Department of Water Quality. Total-dis-solved-solids concentrations in the valley-fill aquifer rangefrom 204 to 2,442 mg/L, and average 785 mg/L. Data areinsufficient to classify the southeastern part (60 percent) ofthe valley-fill aquifer. Nitrate-as-nitrogen concentrations inthe valley-fill aquifer range from less than 0.1 to 4.27 mg/L,the average (background) nitrate concentration being 0.52mg/L.
The results of our ground-water flow simulation usingthe mass-balance approach indicate that two categories ofrecommended maximum septic-system densities are appro-priate for development in Castle Valley: 5 and 15 acres persystem (2 hm2/system and 6 hm2/system). These recom-mended maximum septic-system densities are based onhydrogeologic parameters incorporated in the ground-waterflow simulation and geographically divided into four ground-water flow domains (background nitrate concentrations rang-ing from 0.18 to 0.48 mg/L) on the basis of flow-volumesimilarities.
INTRODUCTION
Castle Valley, Grand County, is a rural area in southeast-ern Utah (figure 1) experiencing an increase in residentialdevelopment, all of which uses septic tank soil-absorptionsystems for wastewater disposal. Most of this developmentis situated on unconsolidated deposits of the valley-fillaquifer. Ground water, mostly from the valley-fill aquifer,provides all of the drinking-water supply in Castle Valley.Preservation of ground-water quality and the potential forground-water quality degradation are critical issues thatshould be considered in determining the extent and nature offuture development in Castle Valley. Local government offi-cials in Castle Valley have expressed concern about thepotential impact that development may have on ground-water quality, particularly development that uses septic tanksoil-absorption systems for wastewater disposal.
GROUND-WATER QUALITY CLASSIFICATION ANDRECOMMENDED SEPTIC TANK SOIL-ABSORPTION-
SYSTEM DENSITY MAPS, CASTLE VALLEY,GRAND COUNTY, UTAH
by
Mike Lowe, Janae Wallace, Charles E. Bishop, and Hugh A. Hurlow
2 Utah Geological Survey
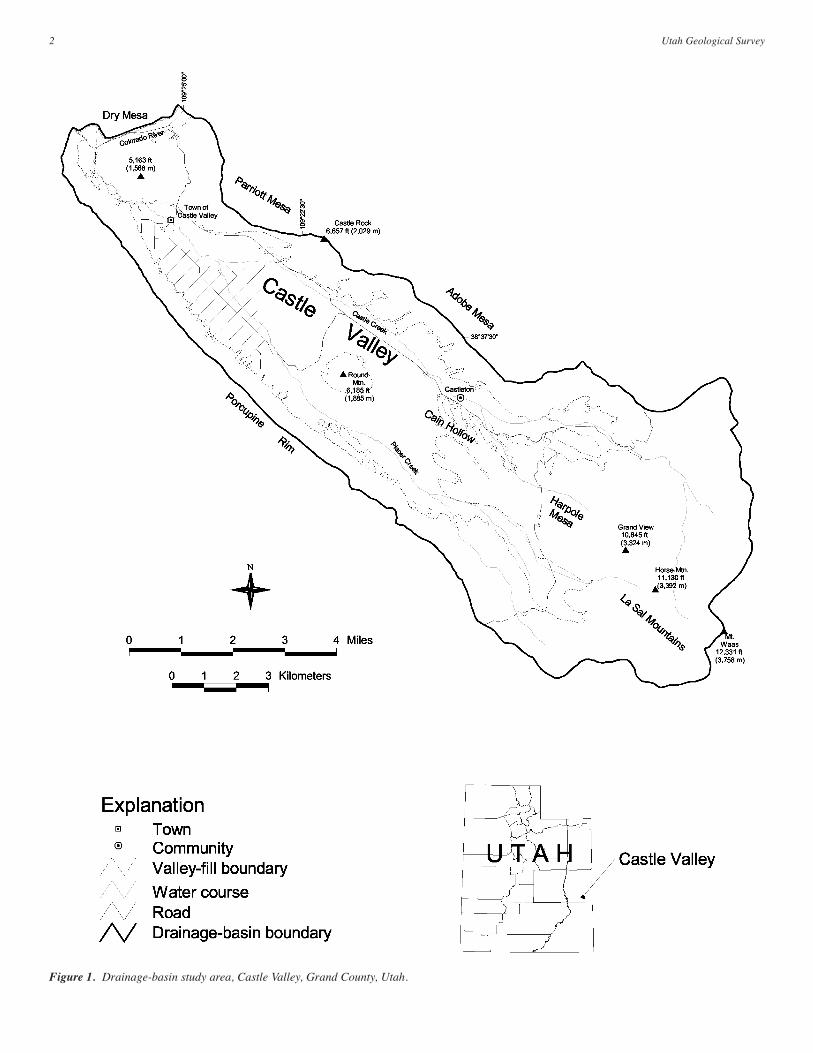
Figure 1. Drainage-basin study area, Castle Valley, Grand County, Utah.
Purpose and Scope
The purposes of our study are to (1) classify the ground-water quality of the valley-fill aquifer to formally identifyand document the beneficial use of Castle Valley's ground-water resource, and (2) apply a ground-water flow simulationand use a mass-balance approach to determine the potentialimpact of projected increased numbers of septic-tank sys-tems on water quality in the valley-fill aquifer and therebyrecommend appropriate septic-system-density requirements.These two study components will, in concert, provide land-use planners with a tool to use in approving new develop-ment in a manner that will be protective of ground-waterquality.
Ground-Water Quality Classification
Ground-water quality classes under the Utah WaterQuality Board classification scheme are based largely ontotal-dissolved-solids (TDS) concentrations (table 1) (for theranges of chemical-constituent concentrations used in thisreport, including those for TDS, mg/L equals parts per mil-lion). If any contaminant exceeds Utah's ground-water qual-ity (health) standards (appendix B) (and, if human caused,cannot be cleaned up within a reasonable time period), theground water is classified as Class III, Limited Use groundwater.
To classify the quality of ground water in the Castle Val-ley valley-fill aquifer, we sampled ground water from 40wells in October 2001, and had the samples analyzed forgeneral chemistry and nutrients by the Utah Department ofEpidemiology and Laboratory Services; of these 40 wells,ground water from 10 wells was analyzed for organics and
pesticides and ground water from 5 wells was analyzed forradionuclides (appendix A). These data were augmented by(1) another 43 wells sampled in September 2000 that wereanalyzed for bacteria, specific conductance, pesticides, andnutrients (appendix A) by the Utah Department of Agricul-ture and Food (Quilter, 2001), (2) specific-conductance andTDS-concentration data from ground water from 6 wellsmeasured by the Utah Division of Water Rights between1991 and 1996 (appendix A) (Ford and Grandy, 1997), and(3) specific-conductance data we collected in February 2003from another 5 wells (appendix A). Specific-conductancedata that we collected from four surface-water sites in Feb-ruary 2003 were also used as part of this classification(appendix A); because of an apparent hydraulic connectionbetween ground and surface water in the valley-fill aquifer,surface-water quality is likely representative of ground-waterquality. Appendix B summarizes the constituents analyzedfor and, where appropriate, ground-water quality (health)standards for the constituents; our water-quality data are pre-sented in appendix A.
In July 2003, some local citizens of Castle Valley sam-pled water from 17 wells and surface-water sites, and had thesamples analyzed for TDS concentration by the Utah Depart-ment of Epidemiology and Laboratory Services (appendixA); of these samples, eight were from wells, eight fromsprings, and one from Castle Creek. Total-dissolved-solids-concentration values range from 188 to 1,944 mg/L. How-ever, these data were not used to supplement the TDS con-centration data from Lowe and Wallace (2003) because theydid not meet sampling protocol requirements associated withour Quality Assurance Project Plan approved by the U.S.Environmental Protection Agency.
3Ground-water quality, Castle Valley, Grand County, Utah
Table 1. Ground-water quality classes under the Utah Water Quality Board's total-dissolved-solids (TDS) based classification system (modifiedfrom Utah Division of Water Quality, 1998).
Ground-Water Quality Class TDS Concentration Beneficial Use
Class IA1/IB1/IC2 less than 500 mg/L3 Pristine/Irreplaceable/Ecologically Important
Class II 500 to less than 3,000 mg/L Drinking Water4
Class III 3,000 to less than 10,000 mg/L Limited Use5
Class IV 10,000 mg/L and greater Saline6
1 Irreplaceable ground water (Class IB) is a source of water for a community public drinking-water system for which no other reliable supply of comparable quality and quantity is available due to economic or institutional constraints; it is a ground-water quality class that is not based on TDS. In addition to TDS, Class IA must also meet standards listed in appendix B.
2 Ecologically Important ground water (Class IC) is a source of ground-water discharge important to the continued existence of wildlife habitat; it is a ground-water quality class that is not based on TDS.
3 For concentrations less than 7,000 mg/L, mg/L is about equal to parts per million (ppm).
4 Water having TDS concentrations in the upper range of this class must generally undergo some treatment before being used as drinking water.
5 Generally used for industrial purposes.
6 May have economic value as brine.
Another component of the classification process is todocument existing and potential pollution sources that maythreaten the public's drinking-water supply. We mappedpotential pollution sources based on Utah's Drinking WaterSource Protection Rules (appendix C).
Septic-Tank Density/Water-Quality DegradationAnalysis
To provide recommended septic-tank densities for Cas-tle Valley using the mass-balance approach to evaluatepotential water-quality degradation, we used the digitalground-water flow simulation of Downs and Lasswell(undated), after modifying the simulation using data from anaquifer test we conducted in 2000 and slug tests, to estimateground-water flow available for mixing (dilution). We then(1) grouped areas into four ground-water flow domains (geo-graphic areas having similar characteristics of flow volumeper unit area); (2) determined area acreage, ground-waterflow volumes, number of existing septic-tank systems, andambient (background) nitrate concentrations for eachdomain; and (3) calculated projected nitrogen loadings ineach domain, based on increasing numbers of septic tanksoil-absorption systems and using the appropriate amount ofwastewater and accompanying nitrogen load introduced perseptic-tank system. By limiting allowable degradation ofground-water nitrate concentration to 3 mg/L, the amount ofwater-quality degradation determined to be acceptable bylocal government officials, we were then able to derive sep-tic-tank density recommendations for each domain.
Well-Numbering System
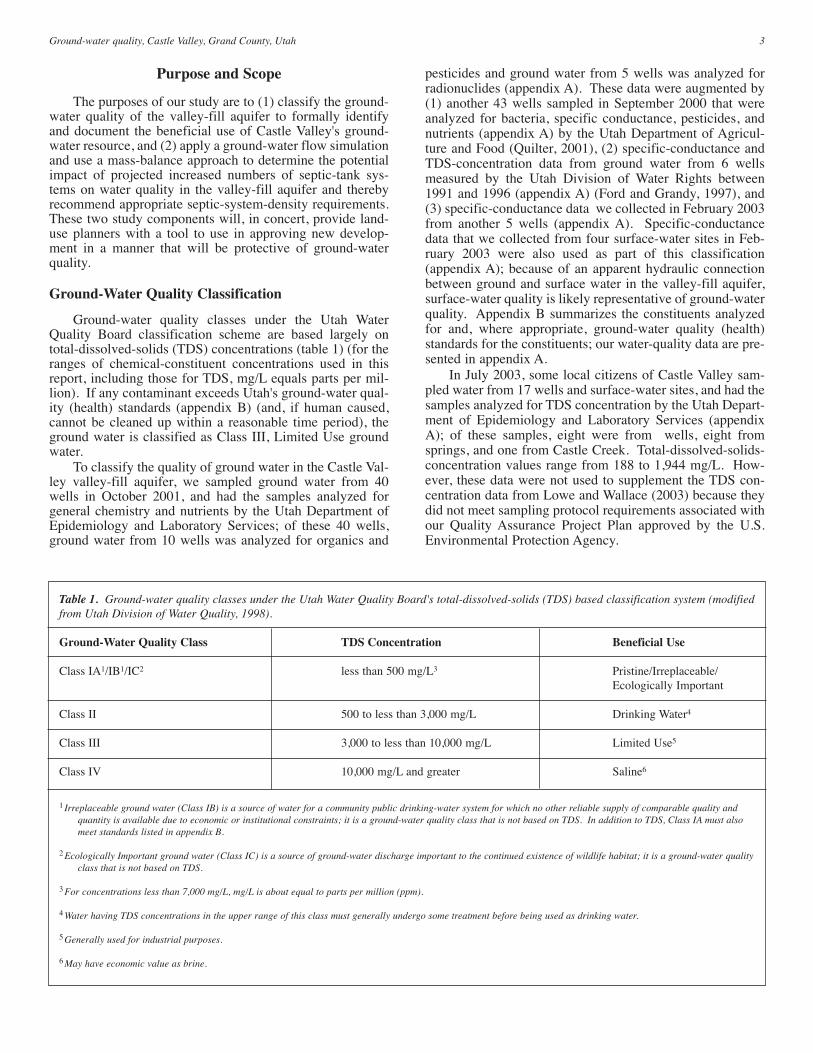
The numbering system for wells in this study is based onthe federal government cadastral land-survey system thatdivides Utah into four quadrants (A-D) separated by the SaltLake Base Line and Meridian (figure 2). The study area is inthe southeastern quadrant (D). The wells are numbered withthis quadrant letter (D), followed by township and range, allenclosed in parentheses. The next set of characters indicatesthe section, quarter section, quarter-quarter section, and quar-ter-quarter-quarter section designated by letters a through d,indicating the northeastern, northwestern, southwestern, andsoutheastern quadrants, respectively. A number after thehyphen corresponds to an individual well within a quarter-quarter-quarter section. For example, the well (D-25-23)17adb-1 would be the first well in the northwestern quarterof the southeastern quarter of the northeastern quarter of sec-tion 17, Township 25 South, Range 23 East (NW1/4SE1/4NE1/4 section 17, T. 25 S., R. 23 E.).
Location and Geography
Castle Valley is a northwest-trending valley in the Col-orado Plateau physiographic province (Stokes, 1977), and isabout 10 miles (19 km) long and 2 miles (3 km) wide with anarea of about 21.5 square miles (56 km2) (figure 1). CastleValley is bordered by Parriott and Adobe Mesas to the north-east, the La Sal Mountains to the southeast, Porcupine Rimto the west, and the Colorado River to the northwest (figure1). Castle Valley ranges in elevation from about 4,120 feet
(1,250 m) at the Colorado River to the northwest to about6,800 feet (2,100 m) in the upper reaches of Castle Creekwithin valley-fill material in the foothills of the La SalMountains to the southeast; the drainage basin reaches12,331 feet (3,758 m) in elevation at Mount Waas (figure 1).
The headwaters of Castle Creek and Placer Creek, theprincipal drainages in Castle Valley, are in the La Sal Moun-tains (figure 1). Castle Creek is a perennial stream whereasPlacer Creek is ephemeral (Ford and Grandy, 1997). Thesestreams flow into the valley on either side of Cain Hollowand Round Mountain, join near the town of Castle Valley,and then flow through a short, narrow canyon and enter theColorado River.
Population and Land Use
Most people in Castle Valley live within the limits of therecently incorporated (November 27, 1985) Town of CastleValley, but some live outside the town limits. The 2000 U.S.Census population of the Town of Castle Valley is 349, a 65.4percent increase from the 1990 Census population of 211(Demographic and Economic Analysis Section, 2001). TheUtah School and Institutional Trust Lands Administration(SITLA) is anticipating the sale of its land for the develop-ment of new lots, which may lead to continued growth inCastle Valley.
Much of the land use in Castle Valley is residential, butsome of the valley is irrigated cropland. Cattle grazing alsotakes place in the valley, primarily in the winter (Snyder,1996a, b).
Climate
Average annual precipitation in the Castle Valleydrainage basin increases with altitude and ranges from about9 inches (23 cm) at the Colorado River to more than 30 inch-es (76 cm) in the La Sal Mountains (Blanchard, 1990). Aver-age annual precipitation from 1978 to 1992 was 11.5 inches(29.2 cm) at the Castle Valley Institute in the Town of CastleValley (elevation 4,720 feet [1,439 m]). Average annual pre-cipitation from 1963 to 1978 in the community of Castleton,farther southeast in Castle Valley at an elevation of 5,840 feet(1,780 m), was 13.63 inches (34.6 cm) (Ashcroft and others,1992). Summer precipitation is usually in the form of brief,localized, intense thunderstorms, whereas winter precipita-tion is of longer duration, less localized, less intense and, athigher elevations, primarily in the form of snow (Blanchard,1990). Temperatures range from a record high of 107°F(41.2°C) at the Castle Valley Institute for the 1978 to 1992time period to a record low of -15°F (-26.1°C) at Castletonfor the 1963 to 1978 time period. Average mean tempera-tures were 53.9 and 50.2°F (12.2 and 10.1°C) at the CastleValley Institute and Castleton, respectively, for the periods ofrecord (Ashcroft and others, 1992). Average annual evapo-transpiration was 4.4 and 3.4 times precipitation at the Cas-tle Valley Institute and Castleton, respectively, for the sametime periods (Ashcroft and others, 1992). Because of thebrevity of precipitation events and higher evapotranspirationrates in the summer, most recharge to ground-water aquiferstakes place during spring snowmelt (Blanchard, 1990).
4 Utah Geological Survey
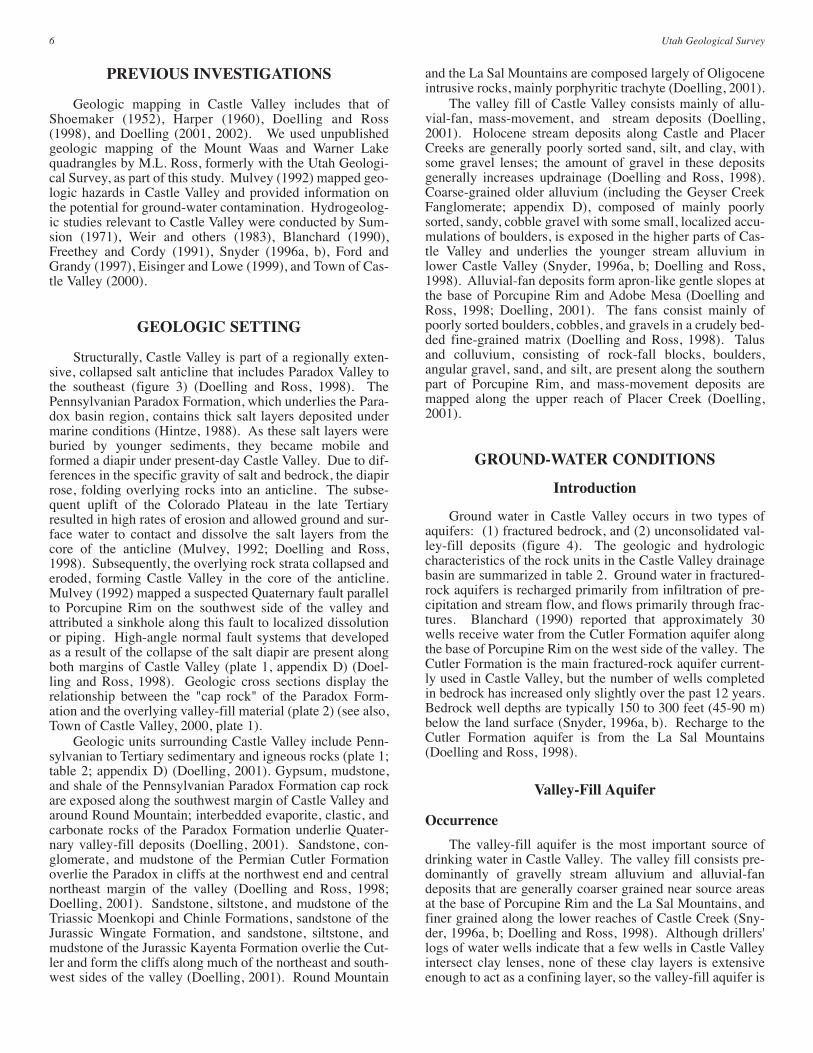
PREVIOUS INVESTIGATIONS
Geologic mapping in Castle Valley includes that ofShoemaker (1952), Harper (1960), Doelling and Ross(1998), and Doelling (2001, 2002). We used unpublishedgeologic mapping of the Mount Waas and Warner Lakequadrangles by M.L. Ross, formerly with the Utah Geologi-cal Survey, as part of this study. Mulvey (1992) mapped geo-logic hazards in Castle Valley and provided information onthe potential for ground-water contamination. Hydrogeolog-ic studies relevant to Castle Valley were conducted by Sum-sion (1971), Weir and others (1983), Blanchard (1990),Freethey and Cordy (1991), Snyder (1996a, b), Ford andGrandy (1997), Eisinger and Lowe (1999), and Town of Cas-tle Valley (2000).
GEOLOGIC SETTING
Structurally, Castle Valley is part of a regionally exten-sive, collapsed salt anticline that includes Paradox Valley tothe southeast (figure 3) (Doelling and Ross, 1998). ThePennsylvanian Paradox Formation, which underlies the Para-dox basin region, contains thick salt layers deposited undermarine conditions (Hintze, 1988). As these salt layers wereburied by younger sediments, they became mobile andformed a diapir under present-day Castle Valley. Due to dif-ferences in the specific gravity of salt and bedrock, the diapirrose, folding overlying rocks into an anticline. The subse-quent uplift of the Colorado Plateau in the late Tertiaryresulted in high rates of erosion and allowed ground and sur-face water to contact and dissolve the salt layers from thecore of the anticline (Mulvey, 1992; Doelling and Ross,1998). Subsequently, the overlying rock strata collapsed anderoded, forming Castle Valley in the core of the anticline.Mulvey (1992) mapped a suspected Quaternary fault parallelto Porcupine Rim on the southwest side of the valley andattributed a sinkhole along this fault to localized dissolutionor piping. High-angle normal fault systems that developedas a result of the collapse of the salt diapir are present alongboth margins of Castle Valley (plate 1, appendix D) (Doel-ling and Ross, 1998). Geologic cross sections display therelationship between the "cap rock" of the Paradox Form-ation and the overlying valley-fill material (plate 2) (see also,Town of Castle Valley, 2000, plate 1).
Geologic units surrounding Castle Valley include Penn-sylvanian to Tertiary sedimentary and igneous rocks (plate 1;table 2; appendix D) (Doelling, 2001). Gypsum, mudstone,and shale of the Pennsylvanian Paradox Formation cap rockare exposed along the southwest margin of Castle Valley andaround Round Mountain; interbedded evaporite, clastic, andcarbonate rocks of the Paradox Formation underlie Quater-nary valley-fill deposits (Doelling, 2001). Sandstone, con-glomerate, and mudstone of the Permian Cutler Formationoverlie the Paradox in cliffs at the northwest end and centralnortheast margin of the valley (Doelling and Ross, 1998;Doelling, 2001). Sandstone, siltstone, and mudstone of theTriassic Moenkopi and Chinle Formations, sandstone of theJurassic Wingate Formation, and sandstone, siltstone, andmudstone of the Jurassic Kayenta Formation overlie the Cut-ler and form the cliffs along much of the northeast and south-west sides of the valley (Doelling, 2001). Round Mountain
and the La Sal Mountains are composed largely of Oligoceneintrusive rocks, mainly porphyritic trachyte (Doelling, 2001).
The valley fill of Castle Valley consists mainly of allu-vial-fan, mass-movement, and stream deposits (Doelling,2001). Holocene stream deposits along Castle and PlacerCreeks are generally poorly sorted sand, silt, and clay, withsome gravel lenses; the amount of gravel in these depositsgenerally increases updrainage (Doelling and Ross, 1998).Coarse-grained older alluvium (including the Geyser CreekFanglomerate; appendix D), composed of mainly poorlysorted, sandy, cobble gravel with some small, localized accu-mulations of boulders, is exposed in the higher parts of Cas-tle Valley and underlies the younger stream alluvium inlower Castle Valley (Snyder, 1996a, b; Doelling and Ross,1998). Alluvial-fan deposits form apron-like gentle slopes atthe base of Porcupine Rim and Adobe Mesa (Doelling andRoss, 1998; Doelling, 2001). The fans consist mainly ofpoorly sorted boulders, cobbles, and gravels in a crudely bed-ded fine-grained matrix (Doelling and Ross, 1998). Talusand colluvium, consisting of rock-fall blocks, boulders,angular gravel, sand, and silt, are present along the southernpart of Porcupine Rim, and mass-movement deposits aremapped along the upper reach of Placer Creek (Doelling,2001).
GROUND-WATER CONDITIONS
Introduction
Ground water in Castle Valley occurs in two types ofaquifers: (1) fractured bedrock, and (2) unconsolidated val-ley-fill deposits (figure 4). The geologic and hydrologiccharacteristics of the rock units in the Castle Valley drainagebasin are summarized in table 2. Ground water in fractured-rock aquifers is recharged primarily from infiltration of pre-cipitation and stream flow, and flows primarily through frac-tures. Blanchard (1990) reported that approximately 30wells receive water from the Cutler Formation aquifer alongthe base of Porcupine Rim on the west side of the valley. TheCutler Formation is the main fractured-rock aquifer current-ly used in Castle Valley, but the number of wells completedin bedrock has increased only slightly over the past 12 years.Bedrock well depths are typically 150 to 300 feet (45-90 m)below the land surface (Snyder, 1996a, b). Recharge to theCutler Formation aquifer is from the La Sal Mountains(Doelling and Ross, 1998).
Valley-Fill Aquifer
Occurrence
The valley-fill aquifer is the most important source ofdrinking water in Castle Valley. The valley fill consists pre-dominantly of gravelly stream alluvium and alluvial-fandeposits that are generally coarser grained near source areasat the base of Porcupine Rim and the La Sal Mountains, andfiner grained along the lower reaches of Castle Creek (Sny-der, 1996a, b; Doelling and Ross, 1998). Although drillers'logs of water wells indicate that a few wells in Castle Valleyintersect clay lenses, none of these clay layers is extensiveenough to act as a confining layer, so the valley-fill aquifer is
6 Utah Geological Survey
7Ground-water quality, Castle Valley, Grand County, Utah
AbajoMountains
Mtns.
Ute Mountain
110o00' 109o00'
37o00'
38o00'
er SinbadV
alleys
Green
River
S
a lt
-
Cache
Lake
Powell
EXPLANATION
UTAH
Uncompahgre
F
Cortez
Green River
Gateway
EMERY COUNTY
WAYNE COUNTY
GARFIELD COUNTY
GRAND COUNTY
SAN JUAN COUNTY
UTAH
ARIZONA
COLORADO
NEW MEXICO
MONTEZUMA COUNTY
DOLORES COUNTY
SAN MIGUEL CO.
UNCOMPAHGRE
PLATEAU
UTA
H
CO
LO
RA
DO
Moab
Lisbon
Valley
Dolo
res
Boulder
Knoll
Gypsum
Valley
Big Flat
Rustler
Lockhart
Moab
CaneCreek
Gibson
Salt Wash
Dellenbaugh
Colorado
River
BOUNDARY OF
PARADOX BASIN
10 0 20
Scale in miles
Location Map
San
Juan River
Collapsed salt anticline
Uncollapsed salt anticline
Tertiary intrusive rock
Moab
-Spanish
Valley
ParadoxValley
CastleValley
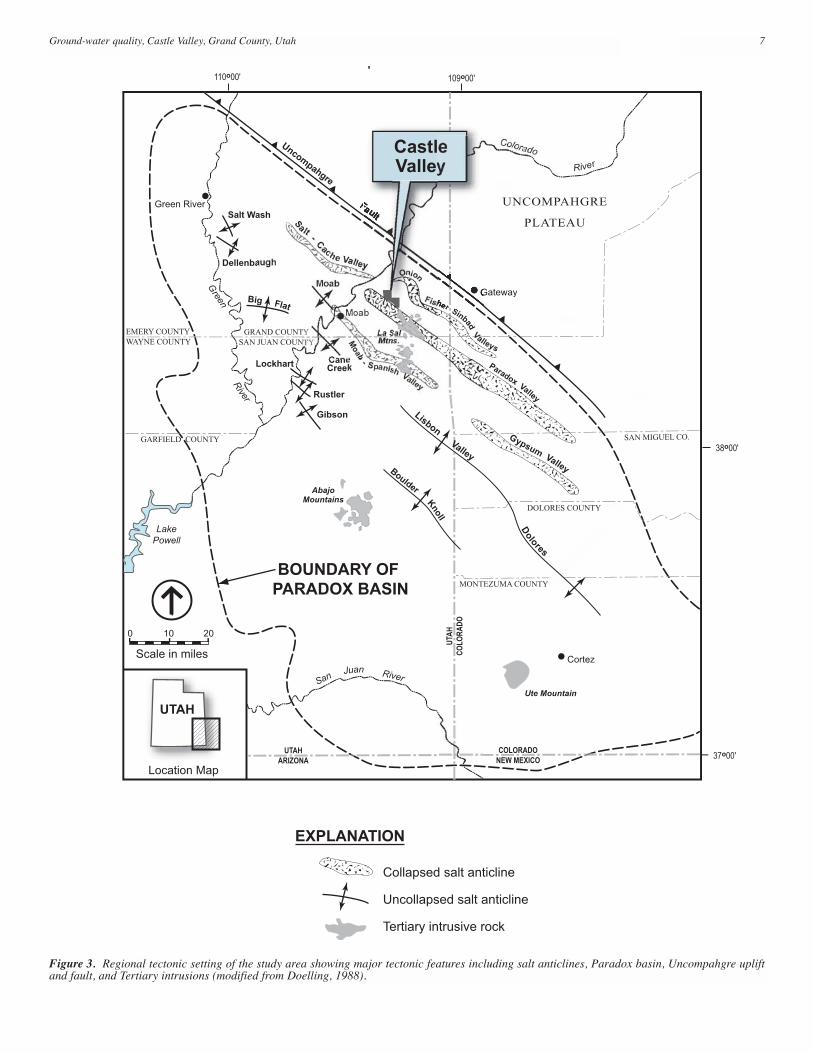
Figure 3. Regional tectonic setting of the study area showing major tectonic features including salt anticlines, Paradox basin, Uncompahgre upliftand fault, and Tertiary intrusions (modified from Doelling, 1988).
8U
tah Geological Survey
Water Quality2 Geologic Unit
(aquifer)
Thickness1
in feet (m)
Lithology General Hydrologic
Characteristics
Yield
(gallons per
minute) Total Dissolved Solids
(mg/L) Chemistry Type
Cedar Mountain Formation
120-200 (37-61)
Interbedded sandstone, conglomerate, and mudstone
Sandstone and conglomerate yield small amounts of water to wells
and springs
Springs: < 1
Wells: <1
Spring: 1,020
Well: 1,470
Calcium magnesium sodium sulfate bicarbonate
Brushy Basin Member
of Morrison Formation
295-450
(90-135)
Mudstone to fine-grained
sandstone
Yields small amounts of water to
wells and springs
Springs: < 1
Wells: < 1
Spring: 1,020
Calcium magnesium sodium
sulfate bicarbonate
Salt Wash Member of
Morrison Formation
130-300
(40-90)
Interbedded sandstone,
conglomerate, and mudstone
Sandstone and conglomerate yield
small amounts of water to wells and springs
Springs: < 1
Wells: < 1
Spring: 1,160 Calcium magnesium sodium
sulfate bicarbonate
Moab Member of
Curtis Formation3
70-110
(21-34)
Cross-bedded, well-sorted, fine- to
medium-grained sandstone,
moderately indurated with calcite cement
Yields abundant water to springs
and wells
Springs: 0.1-11.1
Springs: 143-157
Calcium carbonate; hard to very
hard
Slick Rock Member of
Entrada Sandstone
180-400
(55-122)
Cross-bedded, well-sorted, fine- to
medium-grained sandstone, weakly to moderately indurated
with calcite cement
Yields moderately abundant water
to springs and wells
— Well: 300 Calcium carbonate; hard to very
hard
Navajo Sandstone 165-800
(50-244)
Cross-bedded, well-sorted, fine-
grained sandstone, weakly to moderately indurated with calcite
cement
Yields abundant water to springs
and wells
Springs: <1-5
Springs: 102-350
Well: 210-360
Calcium bicarbonate to calcium
magnesium bicarbonate
Wingate Sandstone 250-400 (76-122)
Cross-bedded, well-sorted, fine-grained sandstone, indurated with
calcite cement
Yields moderately abundant water to springs and wells
Springs: 10-240 Springs: 161-174
Well4: 280-45,000
Calcium magnesium bicarbonate; moderately hard to
hard
Arkosic member of Cutler Formation
0-4,000 (0-1,220)
Cross-bedded, medium- to coarse-grained sandstone and minor
conglomerate
Yields small amounts of water to wells
Wells: 1-40 Wells: 1,420-3,450 Calcium magnesium sulfate; very hard
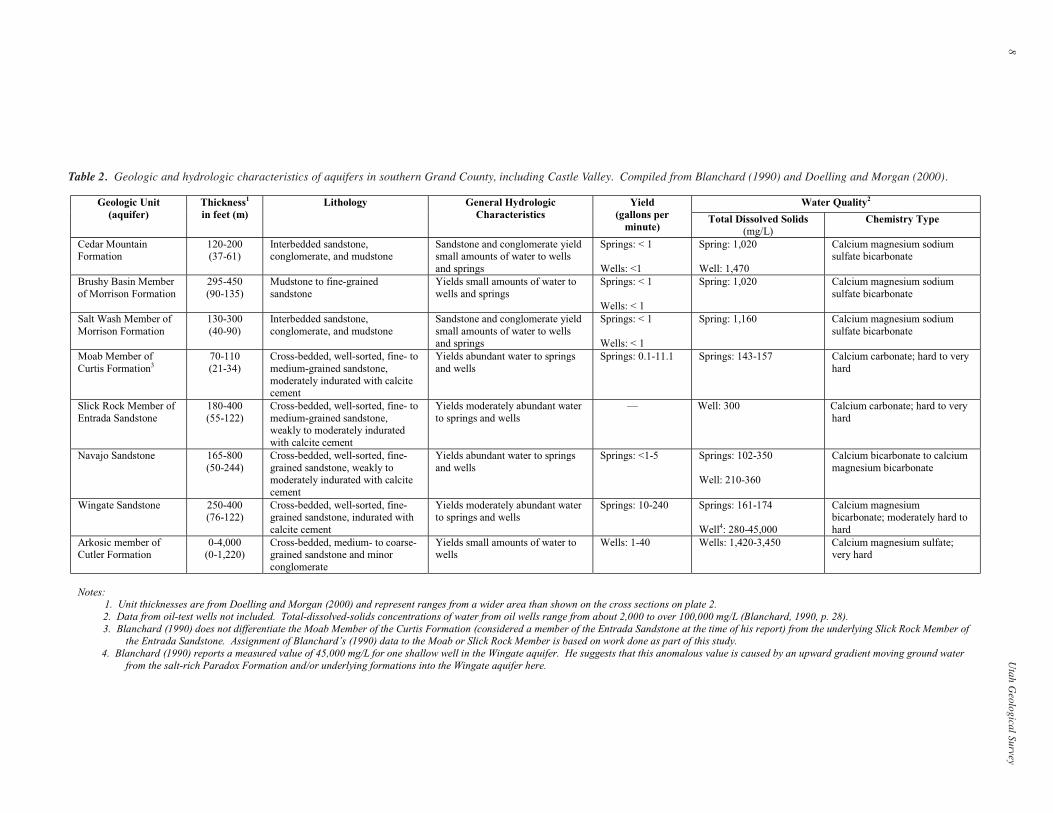
Notes: 1. Unit thicknesses are from Doelling and Morgan (2000) and represent ranges from a wider area than shown on the cross sections on plate 2. 2. Data from oil-test wells not included. Total-dissolved-solids concentrations of water from oil wells range from about 2,000 to over 100,000 mg/L (Blanchard, 1990, p. 28). 3. Blanchard (1990) does not differentiate the Moab Member of the Curtis Formation (considered a member of the Entrada Sandstone at the time of his report) from the underlying Slick Rock Member of
the Entrada Sandstone. Assignment of Blanchard’s (1990) data to the Moab or Slick Rock Member is based on work done as part of this study. 4. Blanchard (1990) reports a measured value of 45,000 mg/L for one shallow well in the Wingate aquifer. He suggests that this anomalous value is caused by an upward gradient moving ground water
from the salt-rich Paradox Formation and/or underlying formations into the Wingate aquifer here.
Table 2. Geologic and hydrologic characteristics of aquifers in southern Grand County, including Castle Valley. Compiled from Blanchard (1990) and Doelling and Morgan (2000).
unconfined (Snyder, 1996a, b). Wells depths in valley fillrange from 58 to 248 feet (18-79 m) and are typically lessthan 150 feet (45 m) below the land surface (appendix A).
Thickness
Plate 3 illustrates the thickness of unconsolidated valley-fill deposits in Castle Valley. The 25-, 50-, and 100-foot con-tours (8-, 15-, and 31-m contours, respectively) define a "Y"shape, with the lower arm pointing northwest along CastleCreek and the upper arms diverging from northwest ofRound Mountain and following Pinhook Creek and upperCastle Creek. The thickest deposits form a narrow troughover 350 feet (107 m) thick below Castle Creek in sections 8,9, and 15, T. 25 S., R. 23 E., Salt Lake Base Line and Merid-ian (SLBM), and deposits southeast of this trough below thecentral part of the valley are up to 250 feet (76 m) thick.Elsewhere in the valley, unconsolidated deposits are general-ly less than 150 feet (46 m) thick with numerous buriedbedrock ridges and small, deep troughs. The most prominentburied ridge is in sections 7 and 17, T. 25 S., R. 23 E., SLBM,where it strikes northwest and is bounded to the northeastand southwest by narrow troughs 150 to 250 feet (46-76-m)thick. The shapes of these second-order features are not wellconstrained, and some may be artifacts of the driller's inter-pretation of relatively soft sedimentary rocks as unconsoli-dated deposits or large slide blocks as bedrock. The thick-ness of alluvial-fan deposits along the valley margins is high-ly variable, and in many places between the 0- and 25-foot (0and 8 m) contours, it may locally exceed 25 feet (8 m) or thinto zero.
The isopach map was constructed from water-welldriller's logs and detailed logs of water-well cuttings by Wal-lace (2002). The majority of wells are in the northwestern
third of the valley, so the contours are best constrained there.The comparatively simple structure southeast of this area islikely a result of sparse well coverage. For this reason, themaximum valley-fill thickness between Round Mountainand the area of greatest residential development is poorlyconstrained.
The Geyser Creek Fanglomerate consists of poorly tomoderately consolidated conglomerate and sandstone, and isnot included with the valley-fill deposits on plate 3 becauseits hydraulic conductivity is likely significantly lower thanthat of the unconsolidated Quaternary deposits. The GeyserCreek Fanglomerate may, however, underlie unconsolidateddeposits below northwestern Castle Valley, and could havebeen interpreted as gravel, conglomerate, or bedrock in thedrillers' logs, depending on its degree of cementation. Theisopach contours may, therefore, locally include someGeyser Creek Fanglomerate. Some well logs show "con-glomerate" below unconsolidated deposits; this "conglomer-ate" may represent the Geyser Creek Fanglomerate oryounger, partially cemented stream deposits, or both. Thesewells are aligned in a narrow belt below the valley centernorthwest of Round Mountain (plate 3), suggesting thecourse of a former stream draining the valley.
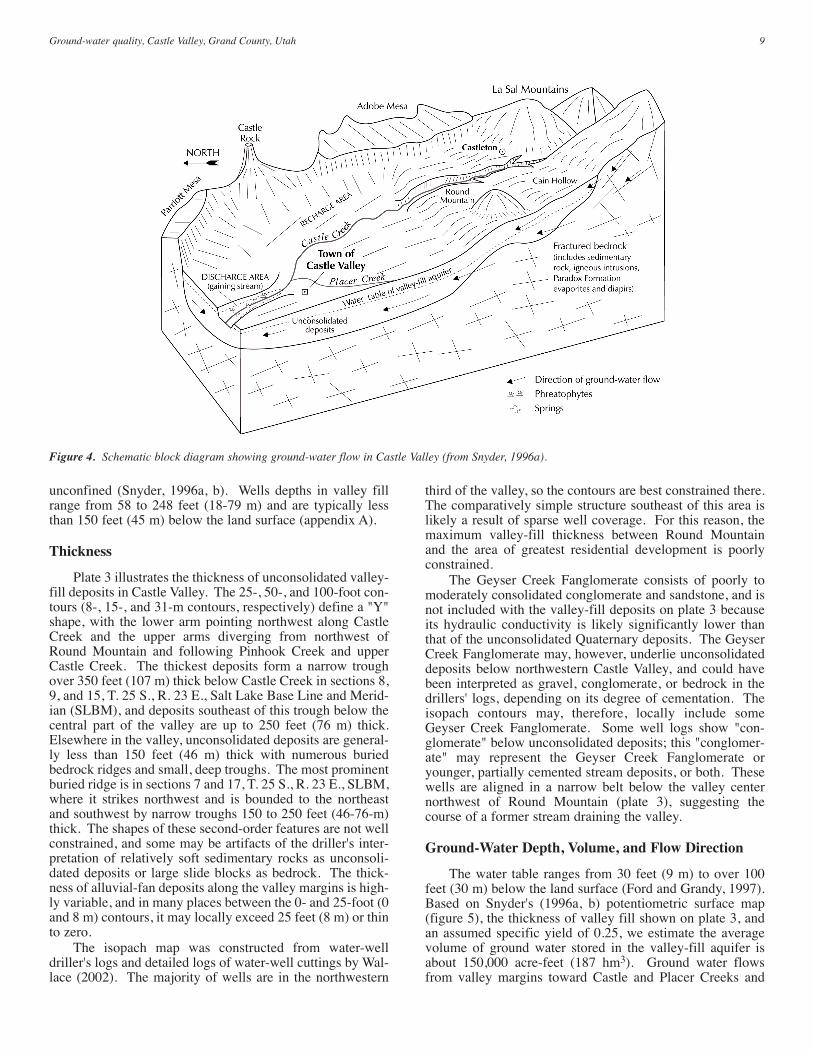
Ground-Water Depth, Volume, and Flow Direction
The water table ranges from 30 feet (9 m) to over 100feet (30 m) below the land surface (Ford and Grandy, 1997).Based on Snyder's (1996a, b) potentiometric surface map(figure 5), the thickness of valley fill shown on plate 3, andan assumed specific yield of 0.25, we estimate the averagevolume of ground water stored in the valley-fill aquifer isabout 150,000 acre-feet (187 hm3). Ground water flowsfrom valley margins toward Castle and Placer Creeks and
9Ground-water quality, Castle Valley, Grand County, Utah
Figure 4. Schematic block diagram showing ground-water flow in Castle Valley (from Snyder, 1996a).
10 Utah Geological Survey
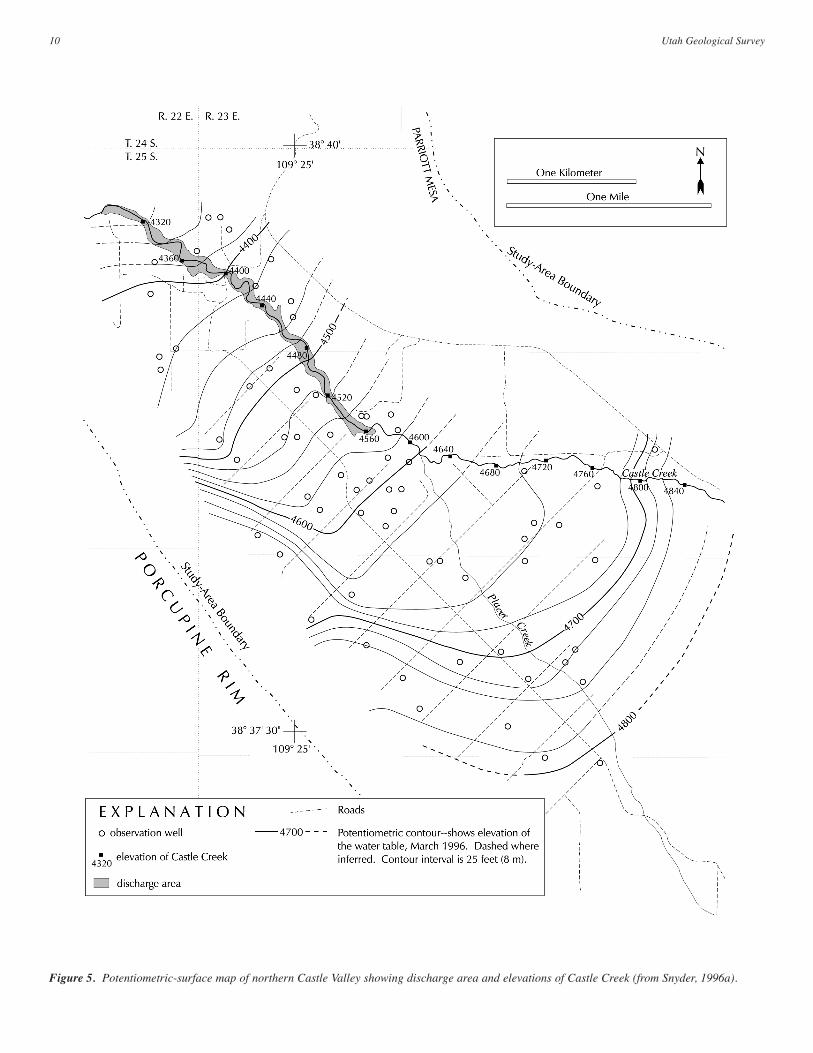
Figure 5. Potentiometric-surface map of northern Castle Valley showing discharge area and elevations of Castle Creek (from Snyder, 1996a).
then generally to the northwest parallel to Castle and PlacerCreeks toward the Colorado River (figure 5). The hydraulicgradient is estimated to be 0.027 (Town of Castle Valley,2000) to the northwest parallel to the flows of Castle Creekand Placer Creek (figure 5).
Recharge and Discharge
Castle and Placer Creeks, which originate high in the LaSal Mountains, are sources of recharge to the valley-fillaquifer (Snyder, 1996a, b). As Castle Creek flows across thecoarse-grained valley fill along most of its course, much ofthe flow percolates into the aquifer (Ford and Grandy, 1997);it acts as the primary source of recharge in the valley. CastleCreek is a losing stream and most of the valley is a primaryrecharge area, except near the town of Castle Valley wherethe stream channel is incised up to 40 feet (12 m) into the val-ley fill and has intersected the water table, forming a smalldischarge area (Snyder, 1996a, b) (figures 4 and 5). Othersources of recharge include (1) direct infiltration of precipi-tation, especially in the higher parts of the valley, (2) seepageof irrigation water, and (3) subsurface inflow from adjacentfractured bedrock aquifers (Snyder, 1996a, b). Discharge isfrom (1) wells, (2) evapotranspiration, especially along lowerCastle Creek, and (3) underflow to the Colorado River (Sny-der, 1996a, b). An annual water budget has not been devel-oped for the Castle Valley valley-fill aquifer system.
Relationship of Geology to Ground-Water Quality
Ground-water quality in Castle Valley is generally goodand is suitable for most uses. Most wells in Castle Valley arecompleted in either the Cutler aquifer or the unconsolidatedvalley-fill aquifer. Ground-water quality in both aquifers isinfluenced by proximity to various bedrock units, with theParadox Formation having the strongest influence.
The Cutler aquifer in Castle Valley typically containscalcium-magnesium-sulfate- or calcium-magnesium-sod-ium-sulfate-type water (Blanchard, 1990). Ground waterfrom wells completed in the Cutler Formation is generallyhigher in TDS concentration than ground water from wellscompleted in adjacent valley fill (Snyder, 1996a, b). Thelowest TDS values come from the shallower wells in easternCastle Valley that may be receiving some recharge from thevalley-fill aquifer; the highest values come from wells at thebase of Porcupine Rim where gypsum along drainages mayindicate proximity to Paradox Formation evaporites (Snyder,1996a, b). Blanchard (1990) reported that ground-watersamples from three wells in the Cutler Formation near thetown of Castle Valley had TDS concentrations ranging from1,420 mg/L to 3,450 mg/L, and that two of these wellsexceeded the ground-water quality (health) standard of 10micrograms per liter for selenium (the wells yielded 21 and30µg/L selenium; the standard is presently 50 microgramsper liter). Ford and Grandy (1997) reported that ground-water samples from wells completed in the Cutler aquifer inCastle Valley had specific-conductance values ranging from835 to 4,650 micromhos per centimeter at 25°C. However,Ford and Grandy (1995) did not find high selenium concen-trations in any of the wells they sampled. Snyder (1996a, b)noted that most of the ground water yielded to wells from theCutler aquifer fell within Class II, but that some wells yield-
ed Class III ground water in the northern part of the valley.Snyder (1996a, b) attributed the poor-quality ground water inthe Cutler aquifer to be the result of some combination ofthree possible factors: (1) long residence time and flow path,(2) dissolved fine-grained constituents, such as evaporites, ofthe Cutler Formation, and (3) hydraulic connection to theParadox Formation evaporites beneath the Cutler Formation.
Ford and Grandy (1995) reported that specific-conduc-tance values for samples from eight valley-fill aquifer wellsin Castle Valley ranged from 357 to 1,960 micromhos percentimeter at 25°C. Ground water from wells and springs inthe valley-fill aquifer exhibits a general down-valley increasein dissolved solids (Weir and others, 1983; Ford, 1994; Sny-der, 1996a, b). Higher quality ground water (less than 1,000micromhos/cm) along Castle and Placer Creeks confirms thatCastle Creek is a principal source, and Placer Creek a subor-dinate source of recharge to the valley-fill aquifer (Snyder,1996a, b; Doelling and Ross, 1998). Lower-quality groundwater (greater than 2,000 micromhos/cm) from valley-fillwells and springs, and from Castle Creek in the far north-western part of Castle Valley, is probably due to a localhydraulic connection to water in the Paradox Formation(Snyder, 1996a, b; Doelling and Ross, 1998). Snyder(1996a, b) attributed the down-valley increase in TDS con-centrations in the valley-fill aquifer to recharge from the Cut-ler and Paradox Formations which contain poorer-qualitywater.
Ford and Grandy (1995) reported nitrate concentrationsof less than 1 mg/L for ground-water samples from wellscompleted in the Castle Valley valley-fill aquifer. Addition-ally, Ford and Grandy (1995) found no fecal coliform in theeight valley-fill wells sampled in Castle Valley.
GROUND-WATER QUALITYCLASSIFICATION
Introduction
Ground-water quality classification, based primarily onTDS (table 1), is a tool for local governments in Utah to usefor managing potential ground-water contamination sourcesand for protecting the quality of their ground-waterresources. Information regarding ground-water quality clas-sification, including what is required to classify ground-water quality and why ground-water quality classificationshould be considered as a tool to protect ground-water qual-ity, is presented in the Utah Division of Water Quality's(1998) Aquifer Classification Guidance Document and Loweand Wallace (1999a, b).
Results
2000-2003 Data for Valley-Fill Aquifer
Data sources: As part of this ground-water quality classifi-cation, we sampled ground water from 40 wells in October2001, and had the samples analyzed for general chemistryand nutrients by the Utah Department of Epidemiology andLaboratory Services; of these 40 wells, ground water from 10wells was analyzed for organics and pesticides and groundwater from 5 wells was analyzed for radionuclides (appendix
11Ground-water quality, Castle Valley, Grand County, Utah
A). We also measured specific conductance of water fromanother five wells and four surface-water sites in February2003; because of an apparent hydraulic connection betweenground and surface water in the Castle Valley valley-fillaquifer, surface-water quality is likely representative ofground-water quality. These data were augmented by anoth-er 43 wells sampled in September 2000 and analyzed forspecific conductance, pesticides, and nutrients (appendix A)by the Utah Department of Agriculture and Food (Quilter,2001), and specific-conductance and TDS concentration datafrom ground water from 6 wells measured by the Utah Divi-sion of Water Rights between 1991 and 1996 (appendix A)(Ford and Grandy, 1997). Data reported by the Utah Divi-sion of Water Rights were also analyzed by the Utah Depart-ment of Epidemiology and Laboratory Services.
Total-dissolved-solids concentrations: The Utah WaterQuality Board's drinking-water quality (health) standard forTDS is 2,000 mg/L for public-supply wells (appendix B).The secondary ground-water quality standard is 500 mg/L(U.S. Environmental Protection Agency, 2002) (appendix B),and is primarily due to imparting a potential unpleasant tasteto the water (Bjorklund and McGreevy, 1971). Plate 4 showsthe distribution of TDS in Castle Valley's valley-fill aquifer.Based on data from ground-water samples from 54 wells andthe 4 surface-water sites, TDS concentrations in the valley-fill aquifer range from 204 to 2,442 mg/L. Only 17 wellsexceed 1,000 mg/L TDS and the overall average TDS con-centration of the 54 wells is 785 mg/L (appendix A, plate 4).
The higher TDS concentrations exist along the northwestmargins of Castle Valley (plate 4) where the Cutler Forma-tion is encountered at relatively shallow depths and wherenegligible mixing of ground and surface water occurs. Rel-atively high TDS concentrations are also present aroundCastleton and at the northwest end of the valley (figure 1,plate 4) where the Paradox Formation is exposed (plate 1).Nitrate concentrations: The ground-water quality (health)standard for nitrate is 10 mg/L (appendix B) (U.S. Environ-mental Protection Agency, 2002). More than 10 mg/L ofnitrate in drinking water can result in a condition known asmethoglobinemia, or "blue baby syndrome" (Comley, 1945)in infants under six months and can be life threatening with-out immediate medical attention (U.S. Environmental Pro-tection Agency, 2002). This condition is characterized by areduced ability for blood to carry oxygen. Based on datafrom ground-water samples from 52 wells, nitrate-as-nitro-gen concentrations range from less than 0.1 to 4.27 mg/L.Six wells yield ground water above 1 mg/L and the overallaverage nitrate concentration for the 52 wells is 0.52 mg/L(appendix A). No apparent trend in the distribution of nitrateconcentrations exists (plate 5); the highest concentrations(1.54 and 4.27 mg/L) are likely attributed to proximity to sta-bles/corrals.
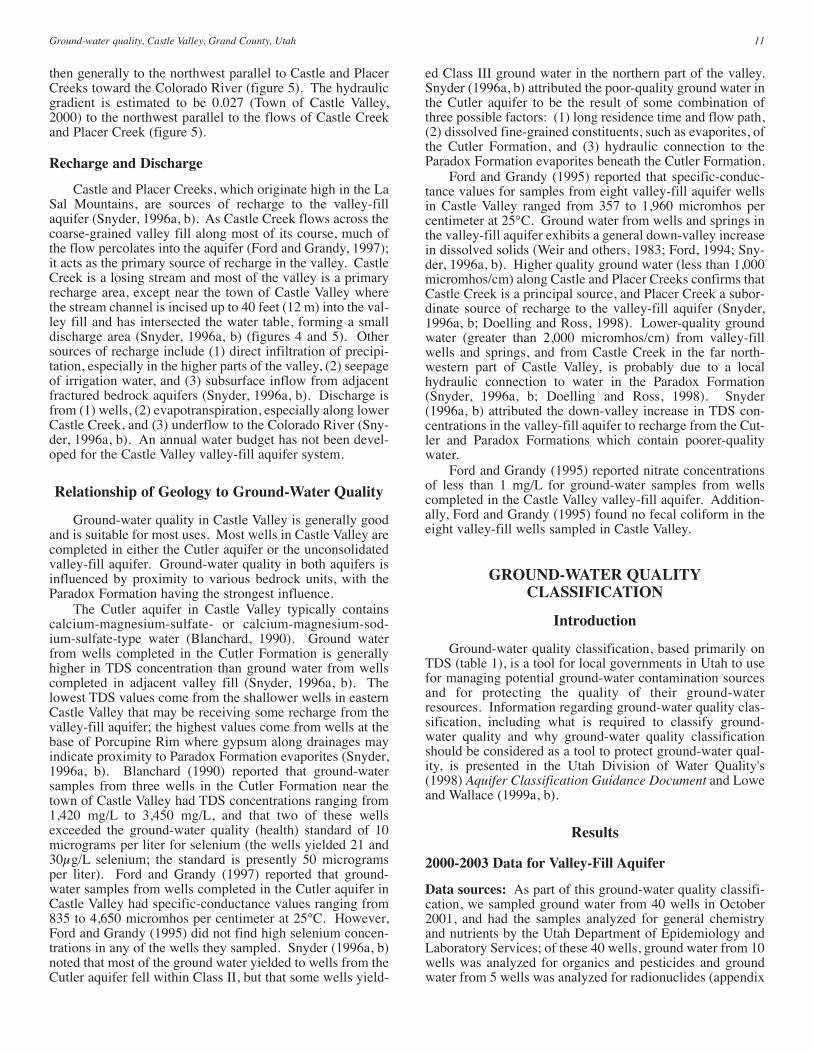
Other constituents: Based on the data presented in appen-dix A, no wells exceeded primary water-quality standards forany chemical constituent, and no pesticides were detected(Quilter, 2001). However, one well exceeded the secondaryground-water quality standards for iron and chloride, and 25wells exceeded the secondary ground-water quality standardfor sulfate (figure 6, appendix A).
The secondary ground-water quality standard for iron is300µg/L (appendix B) (U.S. Environmental Protection
Agency, 2002), primarily to avoid objectionable staining toplumbing fixtures, other household surfaces, and laundry(Fetter, 1980; Hem, 1989). Water high in dissolved iron canalso lead to the growth of iron bacteria which may lead to theclogging of water mains, recirculating systems, and some-times wells (Driscoll, 1986). At concentrations over 1.8mg/L, iron imparts a metallic taste to drinking water (Fetter,1980). Concentrations of dissolved iron in Castle Valley'sprincipal aquifer from ground-water samples from 52 wellsrange from less than 20 to 330 µg/L, with an average (back-ground) dissolved-iron concentration of 53.6 µg/L. A total of30 wells yielded ground water that was below the detectionlimit for dissolved iron of 20 µg/L (appendix A) for theanalysis method listed in table 2. The location of the onewell that yielded water exceeding the secondary ground-water quality standard for iron is shown on figure 6.
The secondary ground-water quality standard for sulfateis 250 mg/L (appendix B) (U.S. Environmental ProtectionAgency, 2002), primarily because of odor/taste problems andbecause high-sulfate water can have a laxative effect (Fetter,1980). Concentrations of dissolved sulfate in Castle Valley'sprincipal aquifer range from 39.6 to 1,350 mg/L, with anaverage (background) sulfate concentration of 340 mg/L. Nowells yielded ground water below the detection limit for sul-fate of 10 mg/L (appendix A) for the analysis method listedin appendix B. Twenty-five wells yielded water samples thatexceed the secondary ground-water quality standard for sul-fate (figure 6). Geologic provenance (source rock for valley-fill sediment) likely is an important factor determining thedistribution of sulfate in the valley-fill aquifer; metallic sul-fides in both igneous and sedimentary rocks are commonsources of sulfur in its reduced form (Hem, 1989), as is gyp-sum which is found in the Paradox Formation.
The secondary ground-water quality standard for chlo-ride is 250 mg/L (appendix B) (U.S. Environmental Protec-tion Agency, 2002), primarily because of the potential forimparting a salty taste to drinking water (Hem, 1989). Chlo-ride at concentrations over 500 mg/L can cause corrosion towells and plumbing (Driscoll, 1986). Concentrations of dis-solved chloride in Castle Valley's principal aquifer (figure 6)range from 13.7 to 282 mg/L, with an average (background)chloride concentration of 68.2 mg/L. No wells yieldedground water below the detection limit for chloride of 3mg/L (appendix A) for the analysis method listed in appen-dix B. One well yielded a water sample that exceeds the sec-ondary ground-water quality standard for chloride (figure 6).Geologic provenance likely is an important factor determin-ing the distribution of chloride in the valley-fill aquifer;although chloride is present at low concentrations in manyrock types, it is more common in sedimentary rocks, espe-cially evaporites (Hem, 1989). The Paradox Formation is aknown source of chloride (Sumsion, 1971).
Resulting Ground-Water Quality Classification
Shown on plate 6 is our ground-water quality classifica-tion for the northwestern part (40 percent) of the valley-fillaquifer in Castle Valley, approved by the Utah Water QualityBoard on December 5, 2003. The classification is based ondata from 54 wells presented in appendix A and discussedabove, and on TDS values converted from specific-conduc-tance data for 14 wells and 4 surface-water sites reported by
12 Utah Geological Survey
13Ground-water quality, Castle Valley, Grand County, Utah
Figure 6. Water wells having chemical constituents that exceed secondary drinking-water standards in Castle Valley, Grand County, Utah. One wellhas elevated chloride and iron concentrations and 25 wells have elevated sulfate concentrations.
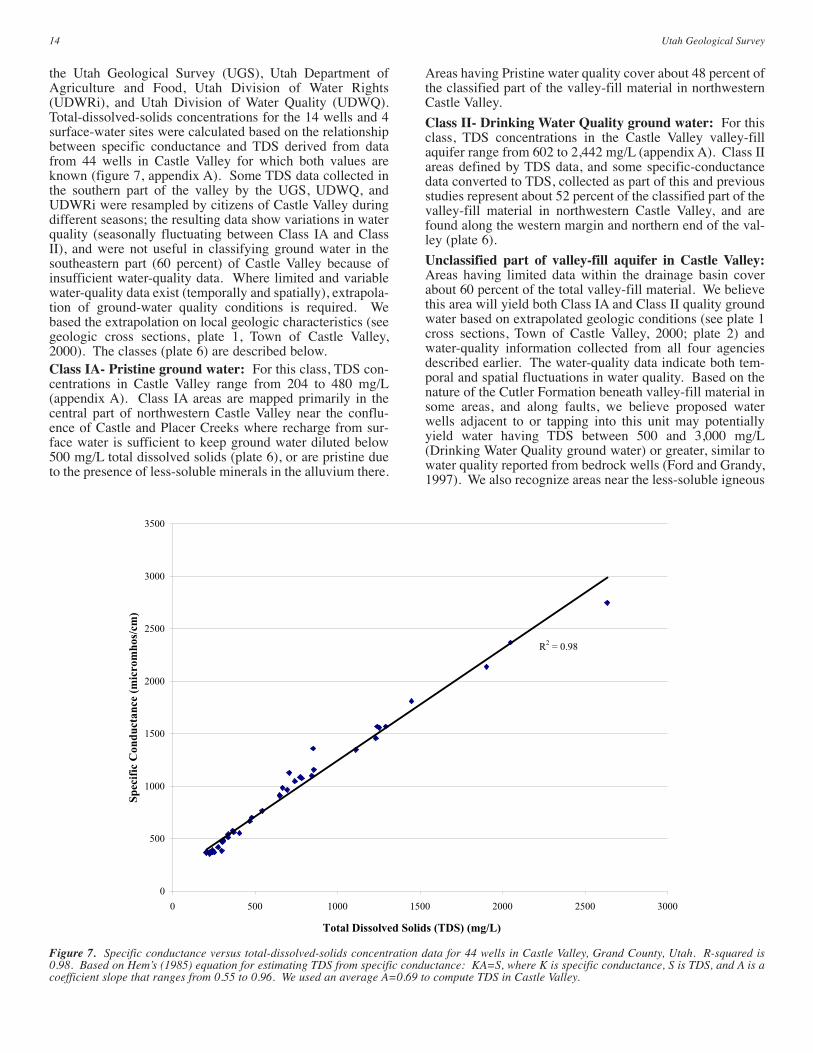
the Utah Geological Survey (UGS), Utah Department ofAgriculture and Food, Utah Division of Water Rights(UDWRi), and Utah Division of Water Quality (UDWQ).Total-dissolved-solids concentrations for the 14 wells and 4surface-water sites were calculated based on the relationshipbetween specific conductance and TDS derived from datafrom 44 wells in Castle Valley for which both values areknown (figure 7, appendix A). Some TDS data collected inthe southern part of the valley by the UGS, UDWQ, andUDWRi were resampled by citizens of Castle Valley duringdifferent seasons; the resulting data show variations in waterquality (seasonally fluctuating between Class IA and ClassII), and were not useful in classifying ground water in thesoutheastern part (60 percent) of Castle Valley because ofinsufficient water-quality data. Where limited and variablewater-quality data exist (temporally and spatially), extrapola-tion of ground-water quality conditions is required. Webased the extrapolation on local geologic characteristics (seegeologic cross sections, plate 1, Town of Castle Valley,2000). The classes (plate 6) are described below.Class IA- Pristine ground water: For this class, TDS con-centrations in Castle Valley range from 204 to 480 mg/L(appendix A). Class IA areas are mapped primarily in thecentral part of northwestern Castle Valley near the conflu-ence of Castle and Placer Creeks where recharge from sur-face water is sufficient to keep ground water diluted below500 mg/L total dissolved solids (plate 6), or are pristine dueto the presence of less-soluble minerals in the alluvium there.
Areas having Pristine water quality cover about 48 percent ofthe classified part of the valley-fill material in northwesternCastle Valley.
Class II- Drinking Water Quality ground water: For thisclass, TDS concentrations in the Castle Valley valley-fillaquifer range from 602 to 2,442 mg/L (appendix A). Class IIareas defined by TDS data, and some specific-conductancedata converted to TDS, collected as part of this and previousstudies represent about 52 percent of the classified part of thevalley-fill material in northwestern Castle Valley, and arefound along the western margin and northern end of the val-ley (plate 6).
Unclassified part of valley-fill aquifer in Castle Valley:Areas having limited data within the drainage basin coverabout 60 percent of the total valley-fill material. We believethis area will yield both Class IA and Class II quality groundwater based on extrapolated geologic conditions (see plate 1cross sections, Town of Castle Valley, 2000; plate 2) andwater-quality information collected from all four agenciesdescribed earlier. The water-quality data indicate both tem-poral and spatial fluctuations in water quality. Based on thenature of the Cutler Formation beneath valley-fill material insome areas, and along faults, we believe proposed waterwells adjacent to or tapping into this unit may potentiallyyield water having TDS between 500 and 3,000 mg/L(Drinking Water Quality ground water) or greater, similar towater quality reported from bedrock wells (Ford and Grandy,1997). We also recognize areas near the less-soluble igneous
14 Utah Geological Survey
R2 = 0.98
0
500
1000
1500
2000
2500
3000
3500
0 500 1000 1500 2000 2500 3000
Total Dissolved Solids (TDS) (mg/L)
Sp
ecif
ic C
on
du
cta
nce
(m
icro
mh
os/
cm)
Figure 7. Specific conductance versus total-dissolved-solids concentration data for 44 wells in Castle Valley, Grand County, Utah. R-squared is0.98. Based on Hem’s (1985) equation for estimating TDS from specific conductance: KA=S, where K is specific conductance, S is TDS, and A is acoefficient slope that ranges from 0.55 to 0.96. We used an average A=0.69 to compute TDS in Castle Valley.
rocks of the La Sal Mountains, especially in the extremesoutheast part of the valley, as well as areas near CastleCreek, may yield water having TDS less than 500 mg/L(Pristine ground water) (plate 5). However, insufficient dataare available to bring a proposed ground-water quality clas-sification before the Utah Water Quality Board.
Land-Use Planning Considerations
Current beneficial uses of ground water: Ground water,most of which is from the valley-fill aquifer, is the mostimportant source of water in Castle Valley. All of the domes-tic (culinary) water and, on average, 50 percent of the irriga-tion water used in Castle Valley is from ground-watersources (Casey Ford, Utah Division of Water Rights, verbalcommunication, July 29, 2002). Castle Valley has 270approved water wells, one of which is a public-supply wellthat serves a private school community (Mark Jensen, Divi-sion of Drinking Water, verbal communication, August 2002)accommodating up to 25 attendees during the school year.The locations of all water-supply wells are shown on plate 6.The results of the ground-water quality classification forCastle Valley indicate the valley-fill aquifer contains mostlyhigh-quality ground-water resources that warrant protection.
Potential for ground-water quality degradation: Wemapped potential ground-water contaminant sources includ-ing facilities related to mining, agricultural practices, andjunkyard/salvage areas (appendix C, plate 7). A primaryobjective was to identify potential contaminant sources toestablish a relationship between water quality and land-usepractices. We mapped 85 potential contaminant sources inthe following categories:
(1) mining, which includes abandoned and activegravel mining operations,
(2) agricultural sites, which consist of irrigated andnon-irrigated farms, active and abandonedanimal feed lots, corrals, stables/barnyards,and animal wastes, including wastes domi-nantly produced from feeding facilities,waste transported by runoff, and excrementon grazing or pasture land,
(3) junkyard/salvage areas that potentially con-tribute metals, solvents, and petroleum prod-ucts,
(4) government facility/equipment storage associ-ated with a variety of sources such as saltstorage facilities, transportation/equipmentstorage, and mosquito abatement equipmentthat may contribute metals, solvents, andpetroleum,
(5) cemeteries, nurseries, greenhouses, and a golfcourse that may contribute chemical preserv-atives, fertilizer, and pesticides,
(6) storage tanks that may contribute pollutantssuch as fuel and oil, and
(7) oil and gas wells that may also contribute pol-lutants such as petroleum and oil.
In addition to the above-described potential contami-nants, plate 7 shows the distribution of septic tank soil-ab-sorption systems in Castle Valley. Castle Valley currentlyhas approximately 235 septic-tank systems (Jim Adamson,Southeastern Utah District Health Department, written com-munication, June 2002). Septic-tank systems may contributecontaminants such as nitrate and solvents. All approvedwater wells, shown on plate 6, are also considered potentialcontaminant sources because of the potential for substancesto be placed in or poured down them. Possible land-use planning applications of this ground-water quality classification: Ground-water quality classifi-cation is a tool that can be used in Utah to manage potentialground-water contamination sources and protect the qualityof ground-water resources. As such, the wide range of land-use planning applications of this tool have not been fullyexplored. Ground-water quality classification has been usedin Heber Valley in Wasatch County and Ogden Valley inWeber County, in concert with septic-tank density/water-quality degradation studies (Hansen, Allen, and Luce, Inc.,1994; Wallace and Lowe, 1998a, 1999; Lowe and Wallace,2001), to determine appropriate sizes of lots using septic-tank systems for wastewater disposal.
One possible application of the ground-water qualityclassification presented above is using the classification inconjunction with the septic-tank density/water-quality degra-dation analysis presented below to set areal maximum densi-ties for development using septic-tank systems for waste-water disposal in Castle Valley. Additional potential usesinclude using ground-water quality classification as a basisfor prohibiting the dumping of poor-quality water and otherliquid or solid wastes into creek beds or canals and ditches.Ground-water quality classification can also be used in con-junction with the existing Sole Source Aquifer designation toenhance restrictions to the siting of new potential pollutionsources in the valley-fill portion of the Castle Valley drainagebasin.
SEPTIC-TANK DENSITY/WATER-QUALITYDEGRADATION ANALYSIS
Introduction
Land-use planners have long used septic-tank suitabilitymaps to determine where these systems will likely percolatewithin an acceptable range. However, they are now becom-ing aware that percolation alone does not remediate manyconstituents found in wastewater, including nitrate. Ammo-nium from septic-tank effluent under aerobic conditions canconvert to nitrate, contaminating ground water and posingpotential health risks to humans (primarily very younginfants). The U.S. Environmental Protection Agency's max-imum contaminant level for drinking water (Utah ground-water quality standard) for nitrate is 10 mg/L. With contin-ued population growth and installation of septic tank soil-absorption systems in new developments, the potential fornitrate contamination will increase. One way to evaluate thepotential impact of septic-tank systems on ground-waterquality is to perform a mass-balance calculation (Hansen,Allen, and Luce, Inc., 1994; Zhan and McKay, 1998; Loweand Wallace, 1999c, d; Wallace and Lowe, 1999; Lowe and
15Ground-water quality, Castle Valley, Grand County, Utah
others, 2000). This type of analysis may be used as a grossmodel for evaluating the possible impact of proposed devel-opments using septic-tank systems for wastewater disposalon ground-water quality, allowing planners to more effec-tively determine appropriate average septic-system densities.
Ground-Water Contamination fromSeptic-Tank Systems
Pathogens
As the effluent from a septic tank soil-absorption systemleaves the drain field and percolates into the underlying soil,it can have high concentrations of pathogens, such as virusesand bacteria. Organisms such as bacteria can be mechani-cally filtered by fine-grained soils and are typically removedafter traveling a relatively short distance in the unsaturatedzone. However, in coarse-grained soils, or soils containingpreferential flow paths like cracks, worm burrows, or rootholes, these pathogens can reach the water table. Livingpathogens can travel up to 40 feet (12 m) in the unsaturatedzone in some soils (Franks, 1972). Some viruses can surviveup to 250 days (U.S. Environmental Protection Agency,1987), which is the minimum ground-water time of travel forpublic water-supply wells or springs to be separated frompotential biological contamination sources.
Household and Industrial Chemicals
Many household and industrial chemicals (table 3) arecommonly disposed of through septic systems and, unlessthey volatilize easily, are not remediated by percolationthrough soils in the unsaturated zone. Contamination fromthese chemicals can be minimized by reducing their disposalvia septic-tank systems, maximizing the potential for dilutionof those chemicals that do reach ground water (Lowe andWallace, 1999e).
Phosphate
Phosphate, typically derived from organic material orsome detergents, is discharged from septic-tank systems(Fetter, 1980). While phosphate (and phosphorus) is a majorfactor in causing eutrophication of surface waters (Fetter,1980), it is generally not associated with water-quality de-gradation from septic-tank systems (Lowe and Wallace,1999e). Phosphates are removed from septic-tank systemeffluent by adsorption onto fine-grained soil particles and byprecipitation with calcium and iron (Fetter, 1980). In mostsoils, complete removal of phosphate is common (Franks,1972).
Nitrate
Ammonia and organic nitrogen are commonly present ineffluent from septic-tank systems (table 3), mostly from thehuman urinary system. Typically, almost all ammonia is con-verted into nitrate before leaving the septic tank soil-absorp-tion system drain field. Once nitrate passes below the zoneof aerobic bacteria and the roots of plants, there is negligibleattenuation as it travels farther through the soil (Franks,1972). Once in ground water, nitrate becomes mobile and
can persist in the environment for long periods of time.Areas having high densities of septic-tank systems risk ele-vated nitrate concentrations reaching unacceptable levels. Inthe early phases of ground-water quality degradation associ-ated with septic-tank systems, nitrate is likely to be the onlypollutant detected (Deese, 1986). Regional nitrate contami-nation from septic-tank discharge has been documented onLong Island, New York, where many densely populated areaswithout sewer systems existed (Fetter, 1980).
A typical single-family septic-tank system in Castle Val-ley discharges about 171 gallons (747 L) of effluent per daycontaining nitrate concentrations of around 54.4 mg/L; seediscussion below. The U.S. Environmental Protection Ag-ency maximum contaminant level for drinking water(ground-water quality [health] standard) for nitrate is 10mg/L. Therefore, distances between septic-tank system drainfields and sources of culinary water must be sufficient toallow dilution of nitrate in the effluent to levels below theground-water quality standard.
We consider nitrate to be the key indicator for use indetermining the number or density of septic-tank systemsthat should be allowed in Castle Valley. Projected nitrate
16 Utah Geological Survey
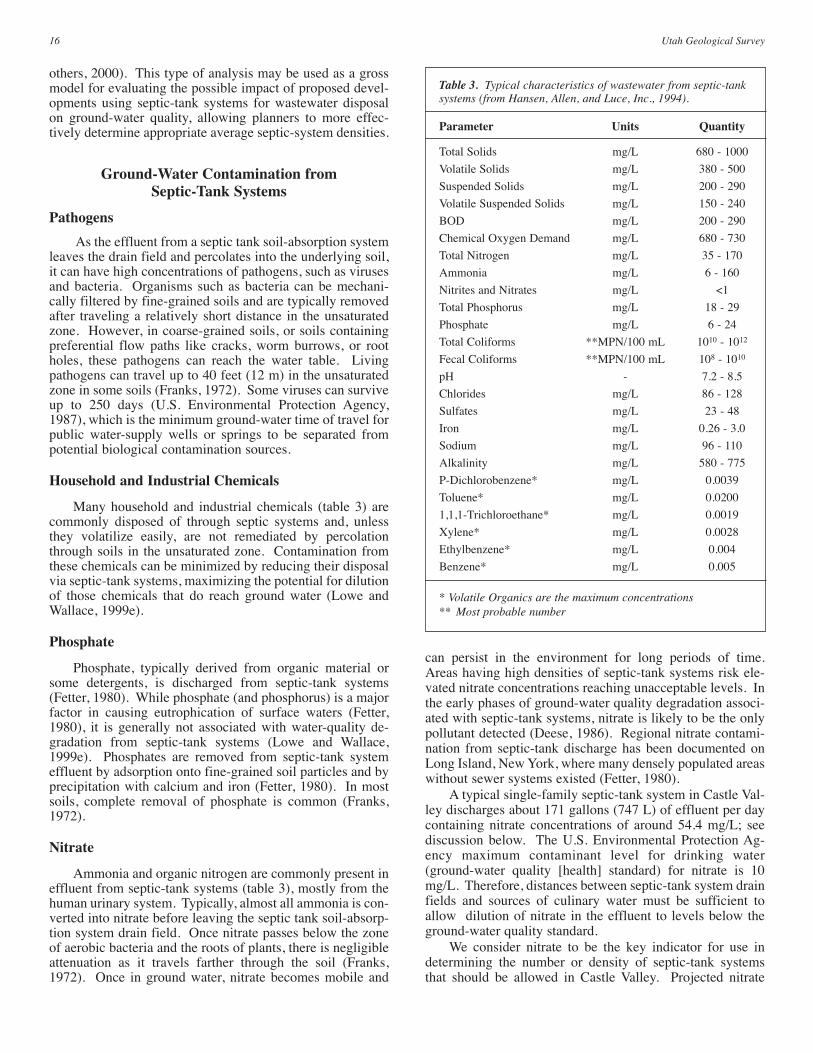
Table 3. Typical characteristics of wastewater from septic-tanksystems (from Hansen, Allen, and Luce, Inc., 1994).
Parameter Units Quantity
Total Solids mg/L 680 - 1000
Volatile Solids mg/L 380 - 500
Suspended Solids mg/L 200 - 290
Volatile Suspended Solids mg/L 150 - 240
BOD mg/L 200 - 290
Chemical Oxygen Demand mg/L 680 - 730
Total Nitrogen mg/L 35 - 170
Ammonia mg/L 6 - 160
Nitrites and Nitrates mg/L <1
Total Phosphorus mg/L 18 - 29
Phosphate mg/L 6 - 24
Total Coliforms **MPN/100 mL 1010 - 1012
Fecal Coliforms **MPN/100 mL 108 - 1010
pH - 7.2 - 8.5
Chlorides mg/L 86 - 128
Sulfates mg/L 23 - 48
Iron mg/L 0.26 - 3.0
Sodium mg/L 96 - 110
Alkalinity mg/L 580 - 775
P-Dichlorobenzene* mg/L 0.0039
Toluene* mg/L 0.0200
1,1,1-Trichloroethane* mg/L 0.0019
Xylene* mg/L 0.0028
Ethylbenzene* mg/L 0.004
Benzene* mg/L 0.005
* Volatile Organics are the maximum concentrations** Most probable number
concentrations in all or parts of aquifers can be estimated forincreasing septic-tank system densities using a mass-balanceapproach.
The Mass-Balance Approach
General Methods
We use a mass-balance approach for water-quality de-gradation assessments because it has been used elsewhere inthe western United States for land-use planning purposes(Hansen, Allen, and Luce, Inc., 1994; Wallace and Lowe,1998a, b, c, 1999; Zhan and McKay, 1998; Lowe and Wal-lace, 1999c, d; Lowe and others, 2000), is easily applied, andrequires few data. In the mass-balance approach to computeprojected nitrate concentrations, the average nitrogen massexpected from projected new septic tanks is added to theexisting, ambient (background) mass of nitrogen in groundwater and then diluted with the known (or estimated) ground-water flow available for mixing, plus water that is added tothe system by septic tanks. We used a discharge of 171 gal-lons (747 L) of effluent per day for a domestic home basedon a per capita indoor usage of 70 gallons (265 L) per day(Utah Division of Water Resources, 2001a; 2001b, p. 28) byGrand County's average 2.44 person household (U.S. CensusBureau, 2002). We used an estimated nitrogen loading of54.4 mg/L of effluent per domestic septic tank for nitrogenloadings based on (1) an average number of people perhousehold of 2.44, (2) an average nitrogen loading of 17 g Nper capita per day (Kaplan, 1988, p. 149), and (3) an assumedretainment of 15 percent of the nitrogen in the septic tank (tobe removed later during pumping) (Andreoli and others,1979, in Kaplan, 1988, p. 148); this number is close to Bau-man and Schafer's (1985, in Kaplan, 1988, p. 147) nitrogenconcentration in septic-tank effluent of 62 ± 21 mg/L basedon the averaged means from 20 previous studies. Ground-water flow available for mixing, the major control on nitrateconcentration in aquifers when using the mass-balanceapproach (Lowe and Wallace, 1997), was determined usingthe ground-water flow model of Downs and Lasswell (undat-ed).
Limitations
All mass-balance approaches have limitations (see, forexample, Zhan and McKay [1998]). We identify the follow-ing limitations to our application of the mass-balanceapproach:
1. Calculations are typically based on a short-term hydrologic budget, a limited number ofaquifer tests, and limited water-gradient data.
2. Background nitrate concentration is attrib-uted to natural sources, agricultural practices,and use of septic-tank systems, but projectednitrate concentrations used in this approachare based on septic-tank systems only and donot include nitrate from other potentialsources (such as lawn and garden fertilizer).
3. Calculations do not account for localized,high-concentration nitrate plumes associated
with individual or clustered septic-tank sys-tems, and also assume that the septic-tankeffluent from existing homes is in a steady-state condition with the aquifer.
4. The approach assumes negligible denitrifica-tion.
5. The approach assumes uniform, instantan-eous ground-water mixing for the entireaquifer or entire mixing zone below the site.
6. Calculations do not account for changes inground-water conditions due to ground-waterwithdrawal from wells (see Recharge andDischarge section above).
7. Calculations are based on aquifer parametersthat must be extrapolated to larger areaswhere they may not be entirely representa-tive.
8. Calculations may be based on existing datathat do not represent the entire valley.
Although many caveats to applying this mass-balanceapproach exist, we think it is useful in land-use planningbecause it provides a general basis for making recommenda-tions for septic-tank-system densities. In addition, theapproach is cost-effective and easily applied with limitedinformation.
Ground-Water Flow Calculations
Introduction
We used the GMS ground-water modeling system, ap-plied to a modified three-dimensional, steady-state MOD-FLOW model of Downs and Lasswell (undated), to deter-mine the available ground-water flow in the saturated,unconsolidated valley-fill deposits in Castle Valley. Wemodified the model by incorporating hydraulic conductivi-ties determined from an aquifer test in the valley. The modelsimulated unconfined conditions, withdrawal from wells,evapotranspiration, seepage to and from streams, arealrecharge, seepage to drains, and seepage from consolidatedrock.
Computer Modeling
We used Downs and Lasswell's (undated) numericalmodel of ground-water flow in Castle Valley to simulateground-water flow in the unconsolidated valley-fill aquifer,because it provides the best representation currently avail-able of the Castle Valley valley-fill aquifer. The ground-water flow model extends from the surface-water divide inthe La Sal Mountains to the Colorado River, and covers anarea of about 110 square miles (280 km2). Because of its rec-tangular construction, the model area is larger than the 56-square-mile (145 km2) Castle Valley drainage basin, but thisdoes not affect the results of the mass-balance analysis. Themodel simulates ground-water flow by approximating thedifferential equation for steady-state flow of water in anaquifer, in this case, both fractured rock and unconsolidatedvalley fill in the drainage basin. Application of the model tothe valley-fill aquifer requires estimates of recharge, dis-
17Ground-water quality, Castle Valley, Grand County, Utah
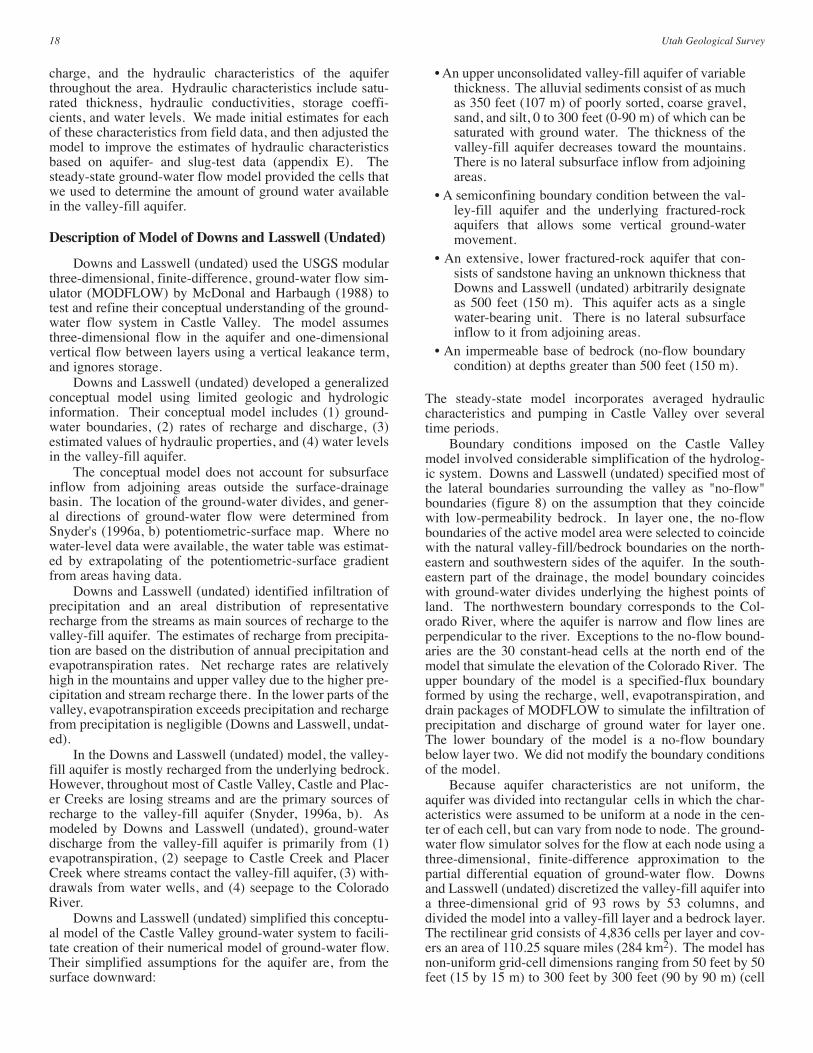
charge, and the hydraulic characteristics of the aquiferthroughout the area. Hydraulic characteristics include satu-rated thickness, hydraulic conductivities, storage coeffi-cients, and water levels. We made initial estimates for eachof these characteristics from field data, and then adjusted themodel to improve the estimates of hydraulic characteristicsbased on aquifer- and slug-test data (appendix E). Thesteady-state ground-water flow model provided the cells thatwe used to determine the amount of ground water availablein the valley-fill aquifer.
Description of Model of Downs and Lasswell (Undated)
Downs and Lasswell (undated) used the USGS modularthree-dimensional, finite-difference, ground-water flow sim-ulator (MODFLOW) by McDonal and Harbaugh (1988) totest and refine their conceptual understanding of the ground-water flow system in Castle Valley. The model assumesthree-dimensional flow in the aquifer and one-dimensionalvertical flow between layers using a vertical leakance term,and ignores storage.
Downs and Lasswell (undated) developed a generalizedconceptual model using limited geologic and hydrologicinformation. Their conceptual model includes (1) ground-water boundaries, (2) rates of recharge and discharge, (3)estimated values of hydraulic properties, and (4) water levelsin the valley-fill aquifer.
The conceptual model does not account for subsurfaceinflow from adjoining areas outside the surface-drainagebasin. The location of the ground-water divides, and gener-al directions of ground-water flow were determined fromSnyder's (1996a, b) potentiometric-surface map. Where nowater-level data were available, the water table was estimat-ed by extrapolating of the potentiometric-surface gradientfrom areas having data.
Downs and Lasswell (undated) identified infiltration ofprecipitation and an areal distribution of representativerecharge from the streams as main sources of recharge to thevalley-fill aquifer. The estimates of recharge from precipita-tion are based on the distribution of annual precipitation andevapotranspiration rates. Net recharge rates are relativelyhigh in the mountains and upper valley due to the higher pre-cipitation and stream recharge there. In the lower parts of thevalley, evapotranspiration exceeds precipitation and rechargefrom precipitation is negligible (Downs and Lasswell, undat-ed).
In the Downs and Lasswell (undated) model, the valley-fill aquifer is mostly recharged from the underlying bedrock.However, throughout most of Castle Valley, Castle and Plac-er Creeks are losing streams and are the primary sources ofrecharge to the valley-fill aquifer (Snyder, 1996a, b). Asmodeled by Downs and Lasswell (undated), ground-waterdischarge from the valley-fill aquifer is primarily from (1)evapotranspiration, (2) seepage to Castle Creek and PlacerCreek where streams contact the valley-fill aquifer, (3) with-drawals from water wells, and (4) seepage to the ColoradoRiver.
Downs and Lasswell (undated) simplified this conceptu-al model of the Castle Valley ground-water system to facili-tate creation of their numerical model of ground-water flow.Their simplified assumptions for the aquifer are, from thesurface downward:
• An upper unconsolidated valley-fill aquifer of variablethickness. The alluvial sediments consist of as muchas 350 feet (107 m) of poorly sorted, coarse gravel,sand, and silt, 0 to 300 feet (0-90 m) of which can besaturated with ground water. The thickness of thevalley-fill aquifer decreases toward the mountains.There is no lateral subsurface inflow from adjoiningareas.
• A semiconfining boundary condition between the val-ley-fill aquifer and the underlying fractured-rockaquifers that allows some vertical ground-watermovement.
• An extensive, lower fractured-rock aquifer that con-sists of sandstone having an unknown thickness thatDowns and Lasswell (undated) arbitrarily designateas 500 feet (150 m). This aquifer acts as a singlewater-bearing unit. There is no lateral subsurfaceinflow to it from adjoining areas.
• An impermeable base of bedrock (no-flow boundarycondition) at depths greater than 500 feet (150 m).
The steady-state model incorporates averaged hydrauliccharacteristics and pumping in Castle Valley over severaltime periods.
Boundary conditions imposed on the Castle Valleymodel involved considerable simplification of the hydrolog-ic system. Downs and Lasswell (undated) specified most ofthe lateral boundaries surrounding the valley as "no-flow"boundaries (figure 8) on the assumption that they coincidewith low-permeability bedrock. In layer one, the no-flowboundaries of the active model area were selected to coincidewith the natural valley-fill/bedrock boundaries on the north-eastern and southwestern sides of the aquifer. In the south-eastern part of the drainage, the model boundary coincideswith ground-water divides underlying the highest points ofland. The northwestern boundary corresponds to the Col-orado River, where the aquifer is narrow and flow lines areperpendicular to the river. Exceptions to the no-flow bound-aries are the 30 constant-head cells at the north end of themodel that simulate the elevation of the Colorado River. Theupper boundary of the model is a specified-flux boundaryformed by using the recharge, well, evapotranspiration, anddrain packages of MODFLOW to simulate the infiltration ofprecipitation and discharge of ground water for layer one.The lower boundary of the model is a no-flow boundarybelow layer two. We did not modify the boundary conditionsof the model.
Because aquifer characteristics are not uniform, theaquifer was divided into rectangular cells in which the char-acteristics were assumed to be uniform at a node in the cen-ter of each cell, but can vary from node to node. The ground-water flow simulator solves for the flow at each node using athree-dimensional, finite-difference approximation to thepartial differential equation of ground-water flow. Downsand Lasswell (undated) discretized the valley-fill aquifer intoa three-dimensional grid of 93 rows by 53 columns, anddivided the model into a valley-fill layer and a bedrock layer.The rectilinear grid consists of 4,836 cells per layer and cov-ers an area of 110.25 square miles (284 km2). The model hasnon-uniform grid-cell dimensions ranging from 50 feet by 50feet (15 by 15 m) to 300 feet by 300 feet (90 by 90 m) (cell
18 Utah Geological Survey
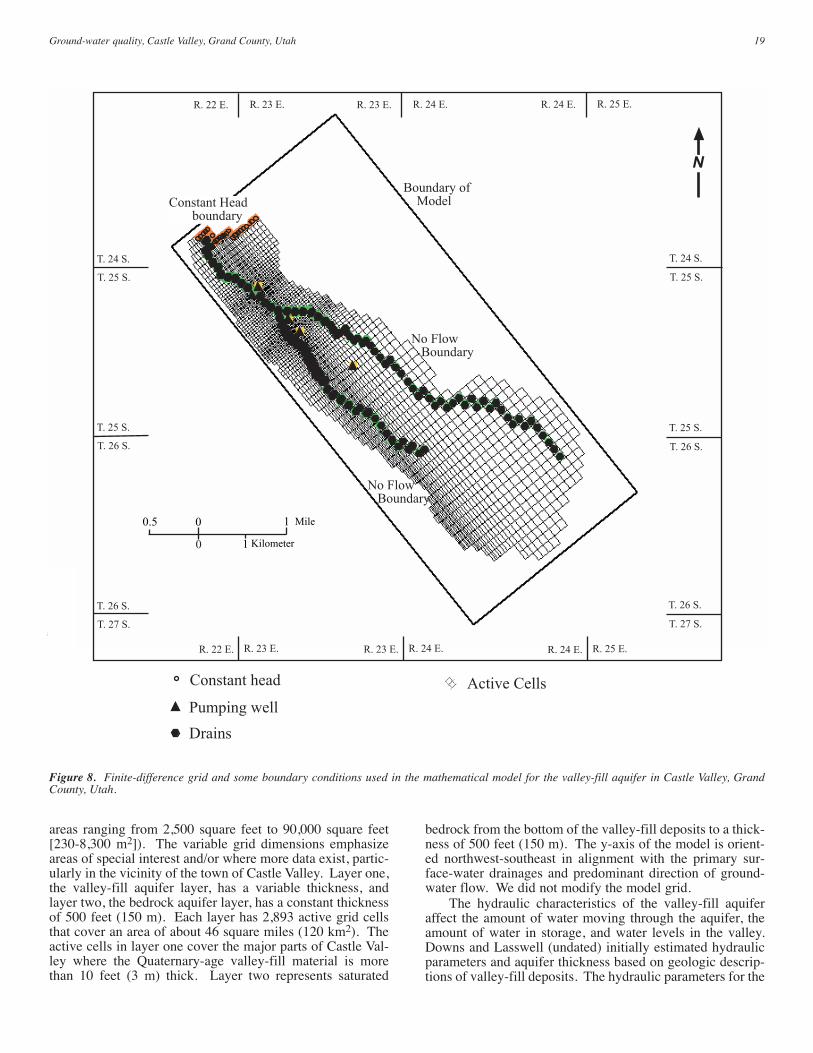
areas ranging from 2,500 square feet to 90,000 square feet[230-8,300 m2]). The variable grid dimensions emphasizeareas of special interest and/or where more data exist, partic-ularly in the vicinity of the town of Castle Valley. Layer one,the valley-fill aquifer layer, has a variable thickness, andlayer two, the bedrock aquifer layer, has a constant thicknessof 500 feet (150 m). Each layer has 2,893 active grid cellsthat cover an area of about 46 square miles (120 km2). Theactive cells in layer one cover the major parts of Castle Val-ley where the Quaternary-age valley-fill material is morethan 10 feet (3 m) thick. Layer two represents saturated
bedrock from the bottom of the valley-fill deposits to a thick-ness of 500 feet (150 m). The y-axis of the model is orient-ed northwest-southeast in alignment with the primary sur-face-water drainages and predominant direction of ground-water flow. We did not modify the model grid.
The hydraulic characteristics of the valley-fill aquiferaffect the amount of water moving through the aquifer, theamount of water in storage, and water levels in the valley.Downs and Lasswell (undated) initially estimated hydraulicparameters and aquifer thickness based on geologic descrip-tions of valley-fill deposits. The hydraulic parameters for the
19Ground-water quality, Castle Valley, Grand County, Utah
N
No Flow Boundary
Constant head
Pumping well
Drains
Active Cells
No Flow Boundary
Constant Head boundary
Boundary of Model
0
0.5 0 1 Mile
1 Kilometer
T. 26 S.
T. 27 S.
T. 24 S.
T. 25 S.
T. 25 S.
T. 26 S.
T. 26 S.
T. 27 S.
T. 25 S.
T. 26 S.
T. 24 S.
T. 25 S.
R. 24 E. R. 25 E.R. 23 E. R. 24 E.R. 22 E. R. 23 E.
R. 22 E. R. 23 E. R. 23 E. R. 24 E. R. 24 E. R. 25 E.
Figure 8. Finite-difference grid and some boundary conditions used in the mathematical model for the valley-fill aquifer in Castle Valley, GrandCounty, Utah.
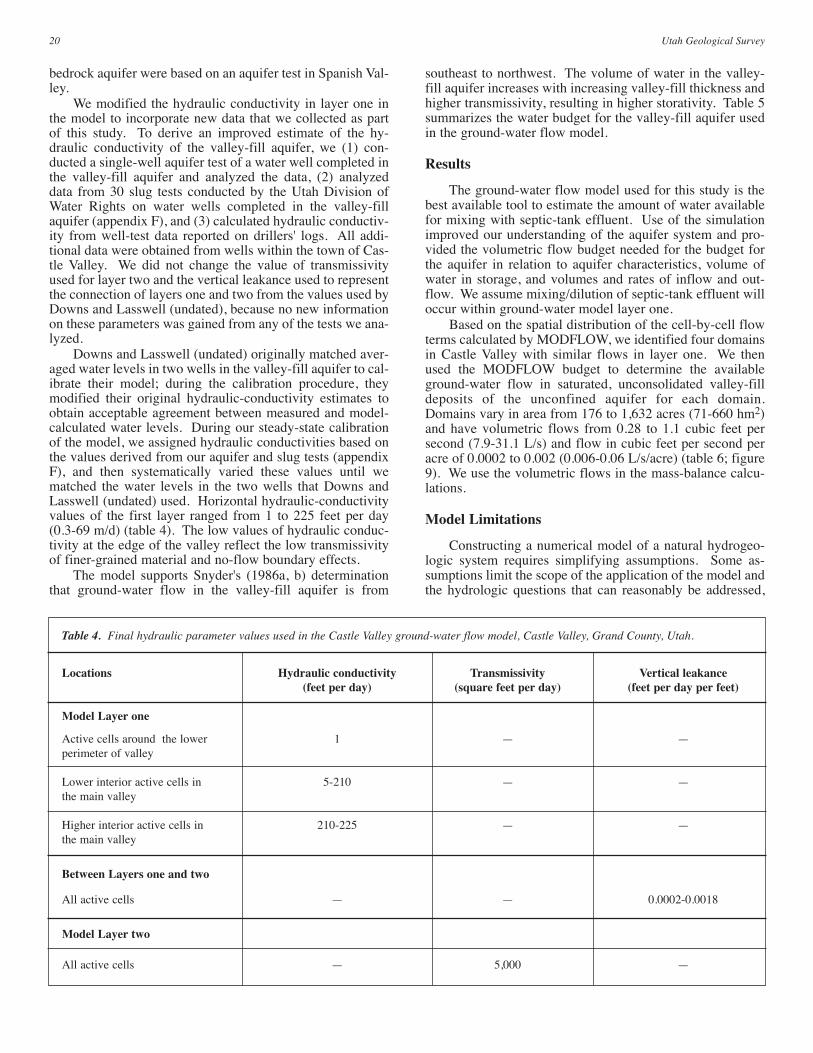
bedrock aquifer were based on an aquifer test in Spanish Val-ley.
We modified the hydraulic conductivity in layer one inthe model to incorporate new data that we collected as partof this study. To derive an improved estimate of the hy-draulic conductivity of the valley-fill aquifer, we (1) con-ducted a single-well aquifer test of a water well completed inthe valley-fill aquifer and analyzed the data, (2) analyzeddata from 30 slug tests conducted by the Utah Division ofWater Rights on water wells completed in the valley-fillaquifer (appendix F), and (3) calculated hydraulic conductiv-ity from well-test data reported on drillers' logs. All addi-tional data were obtained from wells within the town of Cas-tle Valley. We did not change the value of transmissivityused for layer two and the vertical leakance used to representthe connection of layers one and two from the values used byDowns and Lasswell (undated), because no new informationon these parameters was gained from any of the tests we ana-lyzed.
Downs and Lasswell (undated) originally matched aver-aged water levels in two wells in the valley-fill aquifer to cal-ibrate their model; during the calibration procedure, theymodified their original hydraulic-conductivity estimates toobtain acceptable agreement between measured and model-calculated water levels. During our steady-state calibrationof the model, we assigned hydraulic conductivities based onthe values derived from our aquifer and slug tests (appendixF), and then systematically varied these values until wematched the water levels in the two wells that Downs andLasswell (undated) used. Horizontal hydraulic-conductivityvalues of the first layer ranged from 1 to 225 feet per day(0.3-69 m/d) (table 4). The low values of hydraulic conduc-tivity at the edge of the valley reflect the low transmissivityof finer-grained material and no-flow boundary effects.
The model supports Snyder's (1986a, b) determinationthat ground-water flow in the valley-fill aquifer is from
southeast to northwest. The volume of water in the valley-fill aquifer increases with increasing valley-fill thickness andhigher transmissivity, resulting in higher storativity. Table 5summarizes the water budget for the valley-fill aquifer usedin the ground-water flow model.
Results
The ground-water flow model used for this study is thebest available tool to estimate the amount of water availablefor mixing with septic-tank effluent. Use of the simulationimproved our understanding of the aquifer system and pro-vided the volumetric flow budget needed for the budget forthe aquifer in relation to aquifer characteristics, volume ofwater in storage, and volumes and rates of inflow and out-flow. We assume mixing/dilution of septic-tank effluent willoccur within ground-water model layer one.
Based on the spatial distribution of the cell-by-cell flowterms calculated by MODFLOW, we identified four domainsin Castle Valley with similar flows in layer one. We thenused the MODFLOW budget to determine the availableground-water flow in saturated, unconsolidated valley-filldeposits of the unconfined aquifer for each domain.Domains vary in area from 176 to 1,632 acres (71-660 hm2)and have volumetric flows from 0.28 to 1.1 cubic feet persecond (7.9-31.1 L/s) and flow in cubic feet per second peracre of 0.0002 to 0.002 (0.006-0.06 L/s/acre) (table 6; figure9). We use the volumetric flows in the mass-balance calcu-lations.
Model Limitations
Constructing a numerical model of a natural hydrogeo-logic system requires simplifying assumptions. Some as-sumptions limit the scope of the application of the model andthe hydrologic questions that can reasonably be addressed,
20 Utah Geological Survey
Table 4. Final hydraulic parameter values used in the Castle Valley ground-water flow model, Castle Valley, Grand County, Utah.
Locations Hydraulic conductivity Transmissivity Vertical leakance(feet per day) (square feet per day) (feet per day per feet)
Model Layer one
Active cells around the lower 1 — —perimeter of valley
Lower interior active cells in 5-210 — —the main valley
Higher interior active cells in 210-225 — —the main valley
Between Layers one and two
All active cells — — 0.0002-0.0018
Model Layer two
All active cells — 5,000 —
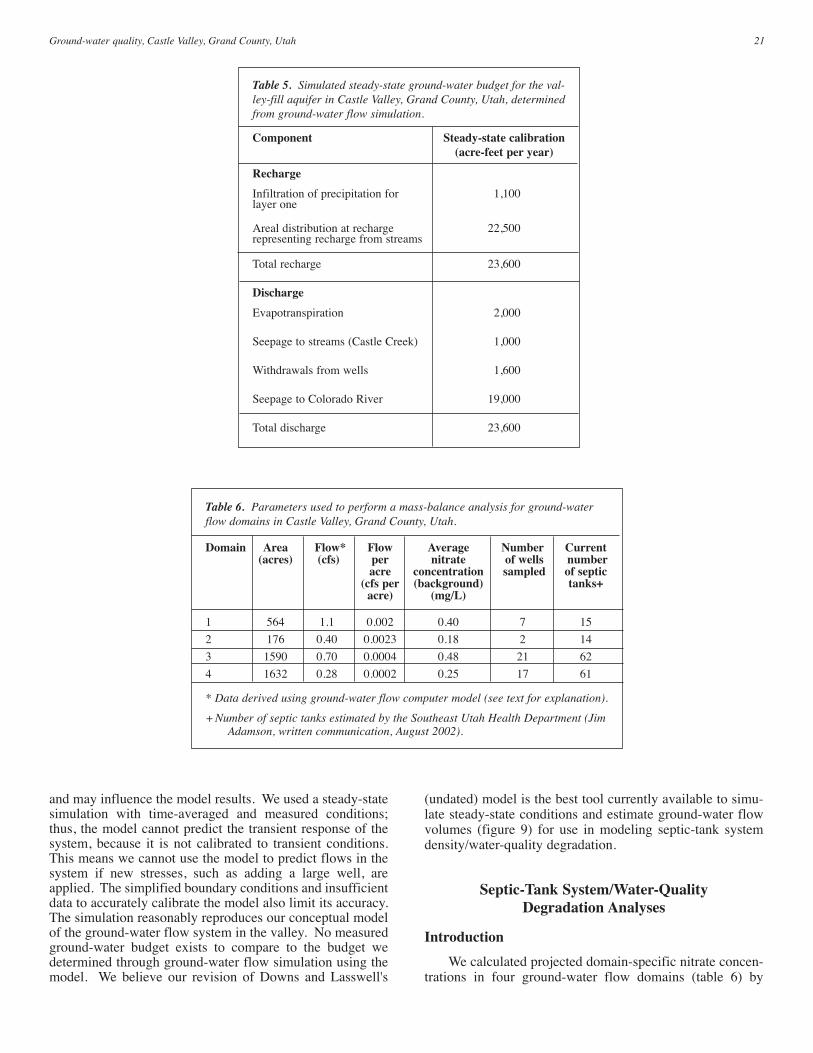
and may influence the model results. We used a steady-statesimulation with time-averaged and measured conditions;thus, the model cannot predict the transient response of thesystem, because it is not calibrated to transient conditions.This means we cannot use the model to predict flows in thesystem if new stresses, such as adding a large well, areapplied. The simplified boundary conditions and insufficientdata to accurately calibrate the model also limit its accuracy.The simulation reasonably reproduces our conceptual modelof the ground-water flow system in the valley. No measuredground-water budget exists to compare to the budget wedetermined through ground-water flow simulation using themodel. We believe our revision of Downs and Lasswell's
(undated) model is the best tool currently available to simu-late steady-state conditions and estimate ground-water flowvolumes (figure 9) for use in modeling septic-tank systemdensity/water-quality degradation.
Septic-Tank System/Water-QualityDegradation Analyses
Introduction
We calculated projected domain-specific nitrate concen-trations in four ground-water flow domains (table 6) by
21Ground-water quality, Castle Valley, Grand County, Utah
Table 5. Simulated steady-state ground-water budget for the val-ley-fill aquifer in Castle Valley, Grand County, Utah, determinedfrom ground-water flow simulation.
Component Steady-state calibration(acre-feet per year)
Recharge
Infiltration of precipitation for 1,100layer one
Areal distribution at recharge 22,500representing recharge from streams
Total recharge 23,600
Discharge
Evapotranspiration 2,000
Seepage to streams (Castle Creek) 1,000
Withdrawals from wells 1,600
Seepage to Colorado River 19,000
Total discharge 23,600
Table 6. Parameters used to perform a mass-balance analysis for ground-waterflow domains in Castle Valley, Grand County, Utah.
Domain Area Flow* Flow Average Number Current(acres) (cfs) per nitrate of wells number
acre concentration sampled of septic(cfs per (background) tanks+
acre) (mg/L)
1 564 1.1 0.002 0.40 7 15
2 176 0.40 0.0023 0.18 2 14
3 1590 0.70 0.0004 0.48 21 62
4 1632 0.28 0.0002 0.25 17 61
* Data derived using ground-water flow computer model (see text for explanation).
+Number of septic tanks estimated by the Southeast Utah Health Department (Jim Adamson, written communication, August 2002).
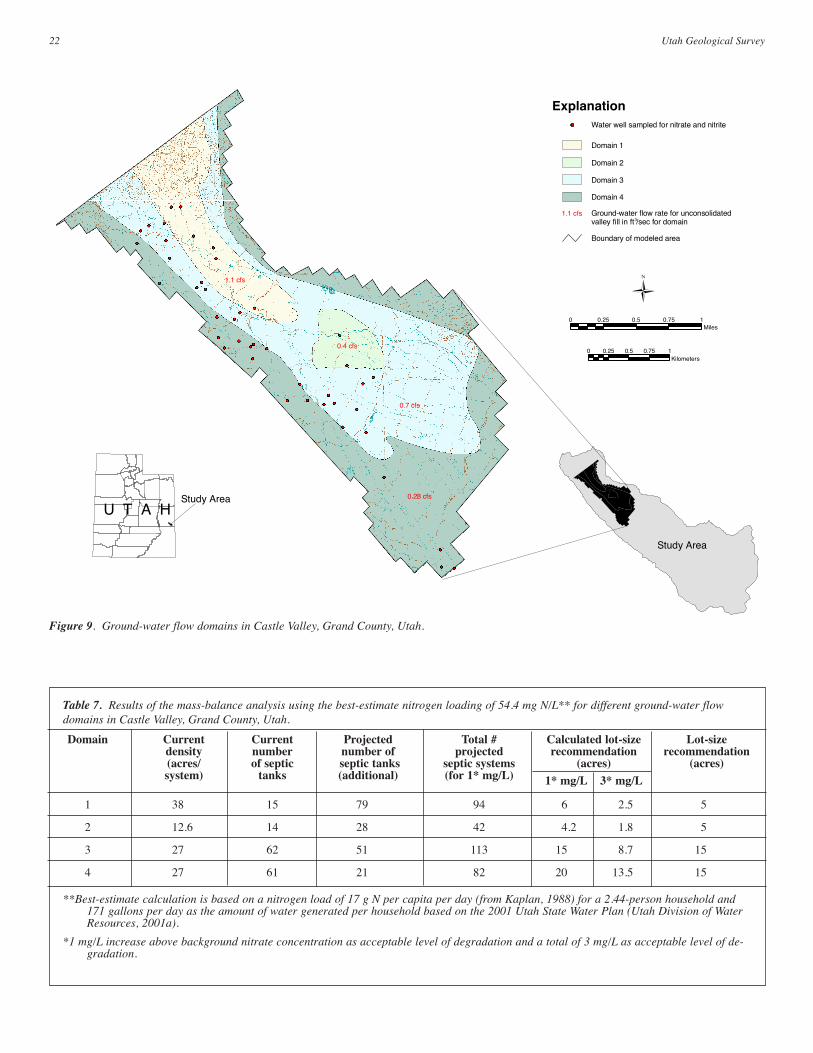
22 Utah Geological Survey
Table 7. Results of the mass-balance analysis using the best-estimate nitrogen loading of 54.4 mg N/L** for different ground-water flowdomains in Castle Valley, Grand County, Utah.
Domain Current Current Projected Total # Calculated lot-size Lot-sizedensity number number of projected recommendation recommendation(acres/ of septic septic tanks septic systems (acres) (acres)system) tanks (additional) (for 1* mg/L) 1* mg/L 3* mg/L
1 38 15 79 94 6 2.5 5
2 12.6 14 28 42 4.2 1.8 5
3 27 62 51 113 15 8.7 15
4 27 61 21 82 20 13.5 15
**Best-estimate calculation is based on a nitrogen load of 17 g N per capita per day (from Kaplan, 1988) for a 2.44-person household and 171 gallons per day as the amount of water generated per household based on the 2001 Utah State Water Plan (Utah Division of Water Resources, 2001a).
*1 mg/L increase above background nitrate concentration as acceptable level of degradation and a total of 3 mg/L as acceptable level of de-gradation.
1.1 cfs
0.4 cfs
0.7 cfs
0.28 cfs
Miles0 0.25 0.5 0.75 1
Kilometers0 0.25 0.5 0.75 1
Explanation
Domain 1
Boundary of modeled area
Domain 2
Domain 3
Domain 4
Water well sampled for nitrate and nitrite
1.1 cfs
Study AreaU T A H
Ground-water flow rate for unconsolidated valley fill in ft /sec for domain3
Study Area
Figure 9. Ground-water flow domains in Castle Valley, Grand County, Utah.
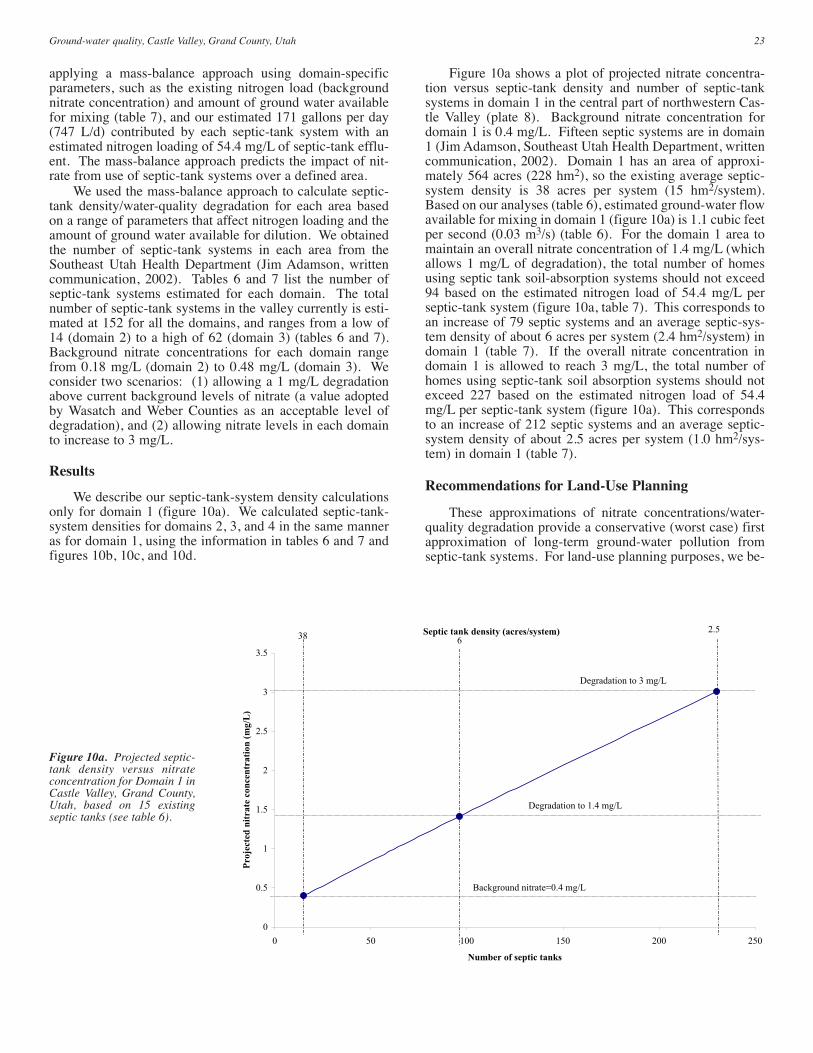
applying a mass-balance approach using domain-specificparameters, such as the existing nitrogen load (backgroundnitrate concentration) and amount of ground water availablefor mixing (table 7), and our estimated 171 gallons per day(747 L/d) contributed by each septic-tank system with anestimated nitrogen loading of 54.4 mg/L of septic-tank efflu-ent. The mass-balance approach predicts the impact of nit-rate from use of septic-tank systems over a defined area.
We used the mass-balance approach to calculate septic-tank density/water-quality degradation for each area basedon a range of parameters that affect nitrogen loading and theamount of ground water available for dilution. We obtainedthe number of septic-tank systems in each area from theSoutheast Utah Health Department (Jim Adamson, writtencommunication, 2002). Tables 6 and 7 list the number ofseptic-tank systems estimated for each domain. The totalnumber of septic-tank systems in the valley currently is esti-mated at 152 for all the domains, and ranges from a low of14 (domain 2) to a high of 62 (domain 3) (tables 6 and 7).Background nitrate concentrations for each domain rangefrom 0.18 mg/L (domain 2) to 0.48 mg/L (domain 3). Weconsider two scenarios: (1) allowing a 1 mg/L degradationabove current background levels of nitrate (a value adoptedby Wasatch and Weber Counties as an acceptable level ofdegradation), and (2) allowing nitrate levels in each domainto increase to 3 mg/L.
Results
We describe our septic-tank-system density calculationsonly for domain 1 (figure 10a). We calculated septic-tank-system densities for domains 2, 3, and 4 in the same manneras for domain 1, using the information in tables 6 and 7 andfigures 10b, 10c, and 10d.
Figure 10a shows a plot of projected nitrate concentra-tion versus septic-tank density and number of septic-tanksystems in domain 1 in the central part of northwestern Cas-tle Valley (plate 8). Background nitrate concentration fordomain 1 is 0.4 mg/L. Fifteen septic systems are in domain1 (Jim Adamson, Southeast Utah Health Department, writtencommunication, 2002). Domain 1 has an area of approxi-mately 564 acres (228 hm2), so the existing average septic-system density is 38 acres per system (15 hm2/system).Based on our analyses (table 6), estimated ground-water flowavailable for mixing in domain 1 (figure 10a) is 1.1 cubic feetper second (0.03 m3/s) (table 6). For the domain 1 area tomaintain an overall nitrate concentration of 1.4 mg/L (whichallows 1 mg/L of degradation), the total number of homesusing septic tank soil-absorption systems should not exceed94 based on the estimated nitrogen load of 54.4 mg/L perseptic-tank system (figure 10a, table 7). This corresponds toan increase of 79 septic systems and an average septic-sys-tem density of about 6 acres per system (2.4 hm2/system) indomain 1 (table 7). If the overall nitrate concentration indomain 1 is allowed to reach 3 mg/L, the total number ofhomes using septic-tank soil absorption systems should notexceed 227 based on the estimated nitrogen load of 54.4mg/L per septic-tank system (figure 10a). This correspondsto an increase of 212 septic systems and an average septic-system density of about 2.5 acres per system (1.0 hm2/sys-tem) in domain 1 (table 7).
Recommendations for Land-Use Planning
These approximations of nitrate concentrations/water-quality degradation provide a conservative (worst case) firstapproximation of long-term ground-water pollution fromseptic-tank systems. For land-use planning purposes, we be-
23Ground-water quality, Castle Valley, Grand County, Utah
Septic tank density (acres/system)
0
0.5
1
1.5
2
2.5
3
3.5
0 50 100 150 200 250
Number of septic tanks
Pro
ject
ed n
itra
te c
on
cen
tra
tio
n (
mg
/L)
386
Background nitrate=0.4 mg/L
Degradation to 1.4 mg/L
Degradation to 3 mg/L
2.5
Figure 10a. Projected septic-tank density versus nitrateconcentration for Domain 1 inCastle Valley, Grand County,Utah, based on 15 existingseptic tanks (see table 6).
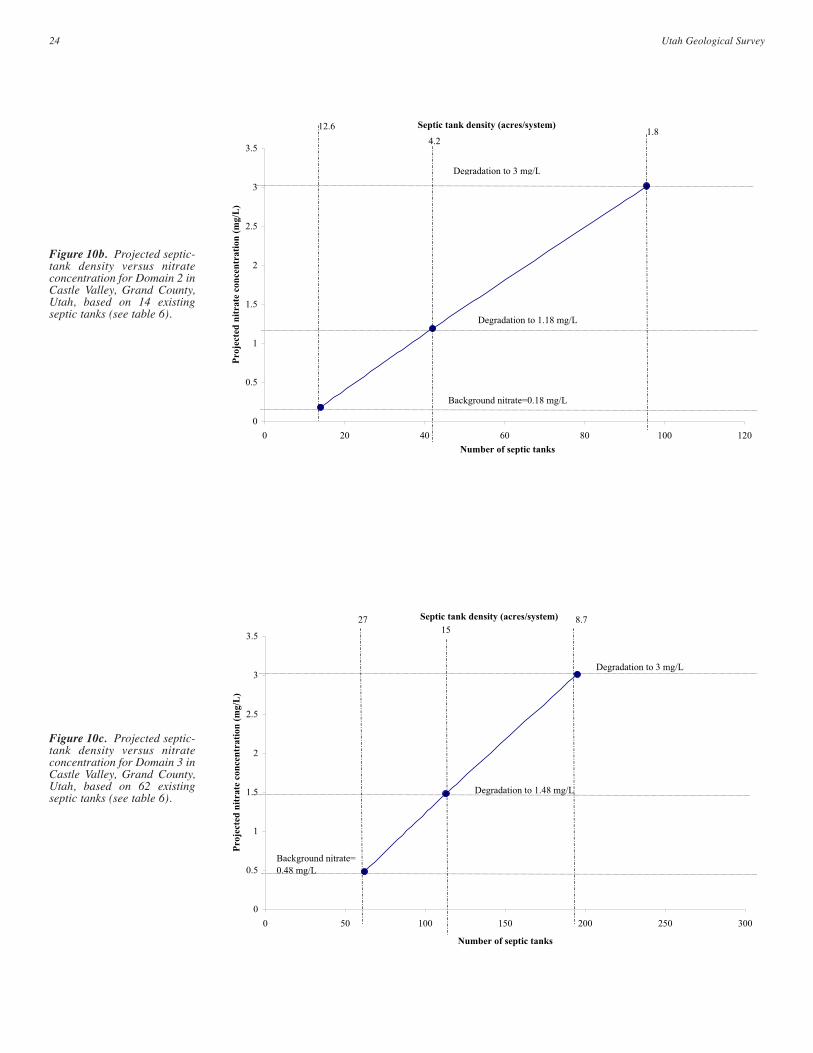
24 Utah Geological Survey
Septic tank density (acres/system)
0
0.5
1
1.5
2
2.5
3
3.5
0 20 40 60 80 100 120
Number of septic tanks
Pro
ject
ed n
itra
te c
on
cen
trati
on
(m
g/L
)
12.6
4.2
Background nitrate=0.18 mg/L
Degradation to 1.18 mg/L
Degradation to 3 mg/L
1.8
Figure 10b. Projected septic-tank density versus nitrateconcentration for Domain 2 inCastle Valley, Grand County,Utah, based on 14 existingseptic tanks (see table 6).
Septic tank density (acres/system)
0
0.5
1
1.5
2
2.5
3
3.5
0 50 100 150 200 250 300
Number of septic tanks
Pro
ject
ed n
itra
te c
on
cen
trati
on
(m
g/L
)
Background nitrate=
0.48 mg/L
27 8.715
Degradation to 1.48 mg/L
Degradation to 3 mg/L
Figure 10c. Projected septic-tank density versus nitrateconcentration for Domain 3 inCastle Valley, Grand County,Utah, based on 62 existingseptic tanks (see table 6).
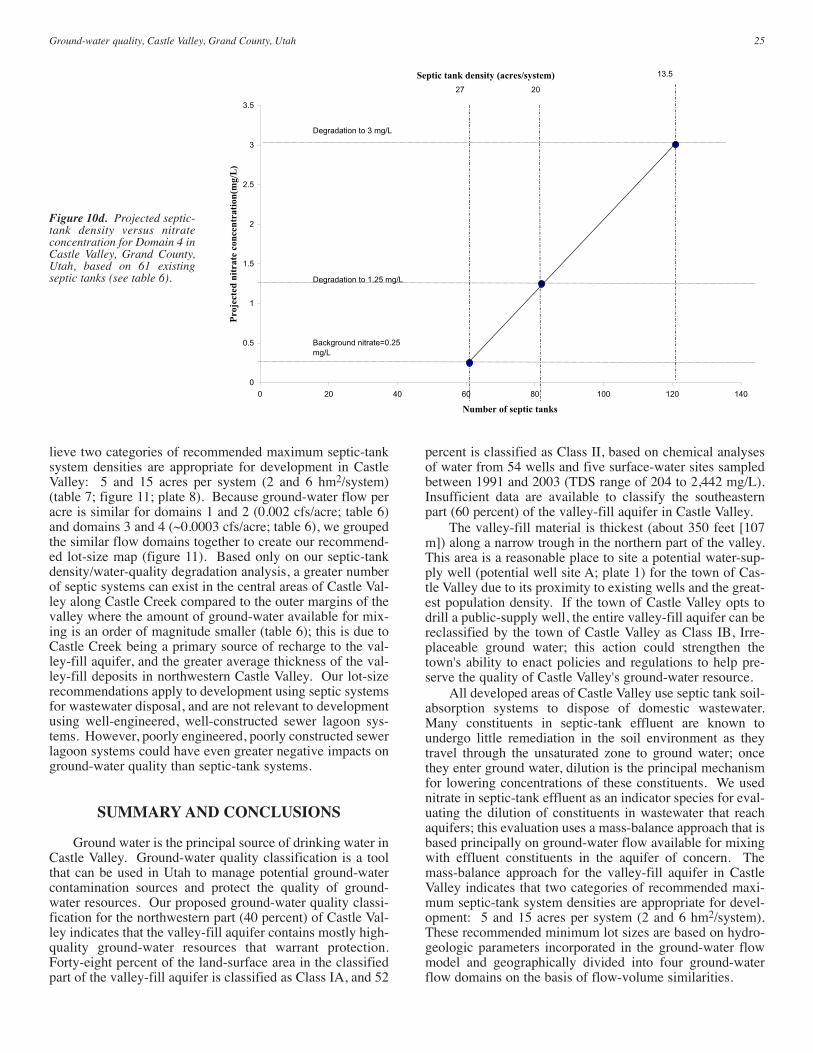
lieve two categories of recommended maximum septic-tanksystem densities are appropriate for development in CastleValley: 5 and 15 acres per system (2 and 6 hm2/system)(table 7; figure 11; plate 8). Because ground-water flow peracre is similar for domains 1 and 2 (0.002 cfs/acre; table 6)and domains 3 and 4 (~0.0003 cfs/acre; table 6), we groupedthe similar flow domains together to create our recommend-ed lot-size map (figure 11). Based only on our septic-tankdensity/water-quality degradation analysis, a greater numberof septic systems can exist in the central areas of Castle Val-ley along Castle Creek compared to the outer margins of thevalley where the amount of ground-water available for mix-ing is an order of magnitude smaller (table 6); this is due toCastle Creek being a primary source of recharge to the val-ley-fill aquifer, and the greater average thickness of the val-ley-fill deposits in northwestern Castle Valley. Our lot-sizerecommendations apply to development using septic systemsfor wastewater disposal, and are not relevant to developmentusing well-engineered, well-constructed sewer lagoon sys-tems. However, poorly engineered, poorly constructed sewerlagoon systems could have even greater negative impacts onground-water quality than septic-tank systems.
SUMMARY AND CONCLUSIONS
Ground water is the principal source of drinking water inCastle Valley. Ground-water quality classification is a toolthat can be used in Utah to manage potential ground-watercontamination sources and protect the quality of ground-water resources. Our proposed ground-water quality classi-fication for the northwestern part (40 percent) of Castle Val-ley indicates that the valley-fill aquifer contains mostly high-quality ground-water resources that warrant protection.Forty-eight percent of the land-surface area in the classifiedpart of the valley-fill aquifer is classified as Class IA, and 52
percent is classified as Class II, based on chemical analysesof water from 54 wells and five surface-water sites sampledbetween 1991 and 2003 (TDS range of 204 to 2,442 mg/L).Insufficient data are available to classify the southeasternpart (60 percent) of the valley-fill aquifer in Castle Valley.
The valley-fill material is thickest (about 350 feet [107m]) along a narrow trough in the northern part of the valley.This area is a reasonable place to site a potential water-sup-ply well (potential well site A; plate 1) for the town of Cas-tle Valley due to its proximity to existing wells and the great-est population density. If the town of Castle Valley opts todrill a public-supply well, the entire valley-fill aquifer can bereclassified by the town of Castle Valley as Class IB, Irre-placeable ground water; this action could strengthen thetown's ability to enact policies and regulations to help pre-serve the quality of Castle Valley's ground-water resource.
All developed areas of Castle Valley use septic tank soil-absorption systems to dispose of domestic wastewater.Many constituents in septic-tank effluent are known toundergo little remediation in the soil environment as theytravel through the unsaturated zone to ground water; oncethey enter ground water, dilution is the principal mechanismfor lowering concentrations of these constituents. We usednitrate in septic-tank effluent as an indicator species for eval-uating the dilution of constituents in wastewater that reachaquifers; this evaluation uses a mass-balance approach that isbased principally on ground-water flow available for mixingwith effluent constituents in the aquifer of concern. Themass-balance approach for the valley-fill aquifer in CastleValley indicates that two categories of recommended maxi-mum septic-tank system densities are appropriate for devel-opment: 5 and 15 acres per system (2 and 6 hm2/system).These recommended minimum lot sizes are based on hydro-geologic parameters incorporated in the ground-water flowmodel and geographically divided into four ground-waterflow domains on the basis of flow-volume similarities.
25Ground-water quality, Castle Valley, Grand County, Utah
Septic tank density (acres/system)
0
0.5
1
1.5
2
2.5
3
3.5
0 20 40 60 80 100 120 140
Number of septic tanks
Pro
ject
ed n
itra
te c
on
cen
tra
tio
n(m
g/L
)
Degradation to 1.25 mg/L
Background nitrate=0.25
mg/L
Degradation to 3 mg/L
27 20
13.5
Figure 10d. Projected septic-tank density versus nitrateconcentration for Domain 4 inCastle Valley, Grand County,Utah, based on 61 existingseptic tanks (see table 6).
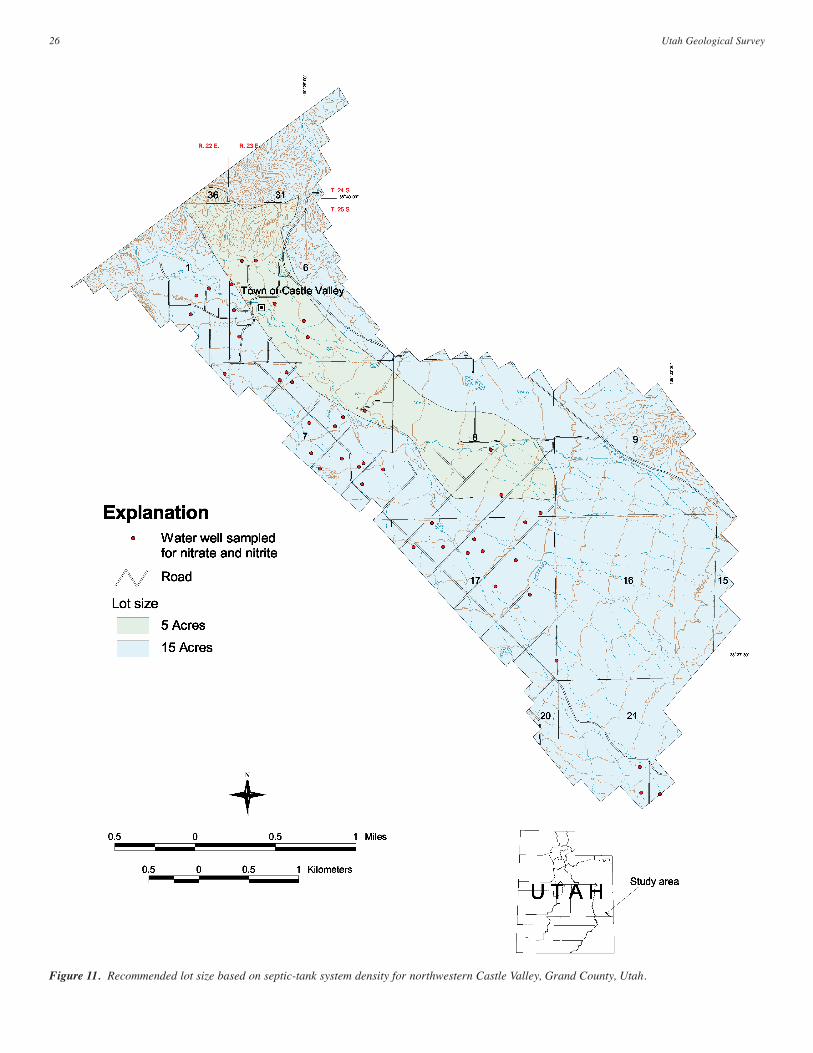
26 Utah Geological Survey
Figure 11. Recommended lot size based on septic-tank system density for northwestern Castle Valley, Grand County, Utah.
ACKNOWLEDGMENTS
This study was funded by the U.S. Environmental Pro-tection Agency, Permanent Community Impact Fund Board,Utah Division of Water Resources, Grand County WaterConservancy District, Utah Geological Survey, and Schooland Institutional Trust Lands Administration. The UtahDivision of Agriculture and Food contributed water-qualitysampling and analysis for this project. We thank Jim Adam-son, Southeast Utah Health Department, for supplying esti-mates of the number of septic-tank systems in each of ourground-water flow domains. Bruce Keeler, mayor of town ofCastle Valley, was instrumental in helping us get the funding
for this project. John Groo helped coordinate obtaining per-mission from valley well owners; we thank well owners forallowing us to sample their wells. We thank Kim Nay, UtahGeological Survey, for preparing the figures for this paper.We thank Richard Muza, U.S. Environmental ProtectionAgency, Region VIII; Candace Cady, Utah Division of WaterQuality; Todd Jarvis, Montgomery Watson Americas; EricMillis, Utah Division of Water Resources; Casey Ford, UtahDivision of Water Rights; and Mike Hylland, HellmutDoelling, Kimm Harty, Grant Willis, Rick Allis, and MichaelRoss of the Utah Geological Survey for their reviews andhelpful comments.
27Ground-water quality, Castle Valley, Grand County, Utah
Andreoli, A., and others, 1979, Nitrogen removal in a subsur-face disposal system: Journal of Water Pollution ControlFederation No. 51, p. 851-855.
Ashcroft, G.L., Jensen, D.T., and Brown, J.L., 1992, Utah cli-mate: Logan, Utah Climate Center, Utah State University,125 p.
Bauman, B.J., and Schafer, W.M., 1985, Estimating groundwa-ter quality impacts from on-site sewage treatment systems,in Proceedings of the Fourth National Symposium on Indi-vidual and Small Community Sewage Systems: AmericanSociety of Agricultural Engineers Publication 07-85, p.285-294.
Bjorklund, L.J., and McGreevey, L.J., 1971, Ground-waterresources of Cache Valley, Utah and Idaho: Utah Depart-ment of Natural Resources Technical Publication No. 36,72 p.
Blanchard, P.J., 1990, Ground-water conditions in the GrandCounty area, Utah, with emphasis on the Mill Creek-Span-ish Valley area: Utah Department of Natural ResourcesTechnical Publication 100, 69 p.
Bouwer, H., and Rice, R.C., 1976, A slug test for determininghydraulic conductivity of unconfined aquifers with com-pletely or partially penetrating wells: Water ResourceResearch, v. 12, no. 3, p. 423-428.
Comley, H.H., 1945, Cyanosis in infants caused by nitrates inwell water: Journal of American Medical Association, v.129, p. 112.
Deese, P.L., 1986, An evaluation of septic leachate detection:U.S. Environmental Protection Agency Project SummaryEPA/600/52-86/052, 2 p.
Demographic and Economic Analysis Section, 2001, Utah dataguide, spring 2001: Salt Lake City, Utah Governor's Officeof Planning and Budget, 16 p.
Doelling, H.H., 2001, Geologic map of the Moab and easternpart of the San Rafael Desert 30' x 60' quadrangles, Grandand Emery Counties, Utah, and Mesa County, Colorado:Utah Geological Survey Map 180, 3 plates, scale1:100,000.
2002, Geologic map of the Fisher Towers quadrangle, GrandCounty, Utah: Utah Geological Survey Map 183, 22 p.,scale 1:24,000.
Doelling, H.H., and Morgan, C.D., 2000, Geologic map of theMerrimac Butte quadrangle, Grand County, Utah: UtahGeological Survey Map 178, 22 p., scale 1:24,000.
Doelling, H.H., and Ross, M.L., 1998, Geologic map of the Big
Bend quadrangle, Grand County, Utah: Utah GeologicalSurvey Map 171, 29 p., scale 1:24,000.
Downs, Wayne, and Lasswell, M.F., undated, Castle Valley,Grand County, Utah, Groundwater Modeling System(GMS) hydrogeologic model: Provo, Utah, unpublishedBrigham Young University report, 17 p.
Driscoll, F.G., 1986, Groundwater and wells: St. Paul, Min-nesota, Johnson Filtration Systems, Inc., 1089 p.
Eisinger, Chris, and Lowe, Mike, 1999, A summary of theground-water resources and geohydrology of Grand Coun-ty, Utah: Utah Geological Survey Circular 99, 19 p.
Fetter, C.W., Jr., 1980, Applied hydrogeology: Columbus,Ohio, Charles E. Merrill Publishing Company, 488 p.
Ford, C.E., 1994, Castle Valley ground water study progressreport: Price, Utah, unpublished Utah Division of WaterRights report, 12 p.
Ford, C.E., and Grandy, A., 1995, Castle Valley ground waterstudy progress report: Salt Lake City, unpublished UtahDivision of Water Rights report, 7 p.
—1997, Records of well water levels and water quality in allu-vial and bedrock aquifers, Castle Creek seepage study, pre-cipitation, and water uses for Castle Valley, Grand County,Utah: Utah Department of Natural Resources Division ofWater Rights Hydrologic Data Report No. 1, 53 p.
Franks, A.L., 1972, Geology for individual sewage disposal sys-tems: California Geology, v. 25, no. 9, p. 195-203.
Freethey, G.W., and Cordy, G.E., 1991, Geohydrology of Meso-zoic rocks in the Upper Colorado River Basin in Arizona,Colorado, New Mexico, Utah, and Wyoming, excluding theSan Juan Basin: U.S. Geological Survey ProfessionalPaper 1411-C, 118 p.
Freeze, R.A., and Cherry, J.C., 1979, Groundwater: EnglewoodCliffs, New Jersey, Prentice Hall, 604 p.
Hansen, Allen, and Luce, Inc., 1994, Hydrogeologic/water qual-ity study, Wasatch County, Utah: Salt Lake City, unpub-lished consultant's report, p. III-1 - III-18.
Harper, M.L., 1960, The areal geology of Castle Valley, Utah:Lubbock, Texas Tech University, M.S. thesis, 121 p., scale1:12,000.
Hem, J.D., 1989, Study and interpretation of the chemical char-acteristics of natural water: U.S. Geological Survey Water-Supply Paper 2254, 263 p.
Hintze, L.F., 1988, Geologic history of Utah: Brigham YoungUniversity Geology Studies, Special Publication 7, 202 p.(Reprinted 1993.)
REFERENCES
Hydrosolve, Inc., 1996, User's guide, AQTESOLV for Win-dows: Reston, Virginia, Hydrosolve, Inc., variously pagi-nated.
Kaplan, O.B., 1988, Septic systems handbook: Chelsea, Michi-gan, Lewis Publishers, Inc., 290 p.
Lowe, Mike, and Wallace, Janae, 1997, The hydrogeology ofOgden Valley, Weber County, Utah, and potential implica-tions of increased septic-tank soil-absorption system densi-ty: Geological Society of America Abstracts with Programs,v. 29, no. 6, p. A-386.
—1999a, Preserving the quality of Utah's ground-waterresources through aquifer classification: Utah GeologicalSurvey, Survey Notes, v. 31, no. 2, p. 1-4.
—1999b, Protecting ground-water quality through aquifer clas-sification--examples from Cache, Ogden, and Tooele Val-leys, Utah, in Spangler, L.E., and Allen, C.J., editors, Geol-ogy of northern Utah and vicinity: Utah Geological Asso-ciation Publication 27, p. 275-313.
—1999c, A mass-balance approach for recommending septic-tank system density/lot size based on nitrate loading -- threeUtah examples: Geological Society of America Abstractswith Programs, v. 31, no. 4, p. A-22.
—1999d, A mass-balance approach for using nitrate loading torecommend septic-tank system density/lot size -- three Utahexamples: Association of Engineering Geologists 42ndAnnual Meeting Program with Abstracts, Salt Lake City,Utah, p. 75.
—1999e, The hydrogeology of Ogden Valley, Weber County,Utah, and recommended waste-water management prac-tices to protect ground-water quality, in Spangler, L.E., andAllen, C.J., editors, Geology of northern Utah and vicinity:Utah Geological Association Publication 27, p. 313-336.
—2001, Protecting ground-water resources through ground-water-quality classification examples from three northernUtah valleys: Geological Society of America Abstractswith Programs, v. 33, no. 5, p. A-16.
—2003, Petition for ground-water quality classification, CastleValley, Grand County, Utah: Salt Lake City, unpublishedpetition submitted to the Utah Division of Water Quality,23 p.
Lowe, Mike, Wallace, Janae, and Bishop, C.E., 2000, Septic-tank density analysis for three areas in Cedar Valley, IronCounty, Utah a case study for evaluations of proposed sub-divisions in Cedar Valley: Utah Geological Survey Water-Resource Bulletin 27, 66 p.
McDonald, M.G., and Harbaugh, A.W., 1988, A modular three-dimensional finite-difference ground-water flow model:U.S. Geological Survey, Techniques of Water-ResourcesInvestigations 06-A1, 576 p.
Mulvey, W.E., 1992, Geologic hazards of Castle Valley, GrandCounty, Utah: Utah Geological Survey Open-File Report238, 31 p., scale 1:24,000.
Quilter, M.C., 2001, State Ground-Water Program 2000: SaltLake City, unpublished Utah Department of Agricultureand Food report, 87 p.
Shoemaker, E.M., 1952, Preliminary geologic map of the Sin-bad Valley-Fisher Valley anticline, Colorado and Utah:U.S. Geological Survey Open-File Report 52-138, scale1:31,680.
Snyder, N.P., 1996a, Recharge area and water quality of the val-ley-fill aquifer, Castle Valley, Grand County, Utah: UtahGeological Survey Report of Investigation 229, 22 p.
—1996b, Recharge area and water quality of the valley-fillaquifer, Castle Valley, Grand County, Utah, in Huffman,
A.C., Jr., Lund, W.R., and Godwin, L.H., editors, Geologyand resources of the Paradox Basin: Utah Geological Asso-ciation Guidebook 25, p. 395-404.
Stokes, W.L., 1977, Subdivisions of the major physiographicprovinces in Utah: Utah Geology, v. 4, no. 1, p. 1-17.
Sumsion, C.T., 1971, Geology and water resources of the Span-ish Valley area, Grand and San Juan Counties, Utah: UtahDepartment of Natural Resources Technical PublicationNo. 32, 45 p.
Theis, C.V., 1935, The relation between the lowering of thepiezometric surface and the rate and duration of dischargeof a well using groundwater storage: American Geophysi-cal Union Transactions, v. 16, p. 519-524.
—1963, Estimating the transmissivity of a water-table aquiferfrom specific capacity of a well: U.S. Geological SurveyWater Supply Paper 1464, 693 p.
Town of Castle Valley, 2000, Sole Source Aquifer designationpetition for the Castle Valley aquifer system: Salt LakeCity, unpublished petition prepared with assistance fromMontgomery Watson submitted to the U.S. EnvironmentalProtection Agency, Region VIII, 17 p.
U.S. Census Bureau, 2002, State and county quick facts, GrandCounty: Online, http://quickfacts.census.gov/qfd/states/49/49019.html, accessed November 19, 2002.
U.S. Environmental Protection Agency, 1987, Guidelines fordelineation of wellhead protection areas: U.S. Environ-mental Protection Agency document no. EPA 440/6-87-010, variously paginated.
—2002, Current drinking water standards: Online, http://www.epa.gov/safewater/mcl.html, accessed November 18, 2002.
U.S. Geological Survey, 2000, A compilation of technical water,water quality, environmental, and water-related terms: On-line, http://www.state.nv.us/cnr/ndwp/dict-1/wwords-s.pdf,accessed September 2002.
Utah Division of Water Quality, 1998, Aquifer classificationguidance document: Salt Lake City, unpublished UtahDivision of Water Quality report, 9 p.
Utah Division of Water Resources, 2001a, Utah's waterresources planning for the future: Salt Lake City, UtahDepartment of Natural Resources, 72 p.
—2001b, Municipal and industrial water supply and uses in theBear River basin: Salt Lake City, Utah Department of Nat-ural Resources, 113 p.
Wallace, Janae, 2002, Geologic logs of water wells, Utah:Online, http://nrwrt1.nr.state.ut.us/cgi-bin/geolog.exe,accessed November 19, 2002.
Wallace, Janae, and Lowe, Mike, 1998a, The potential impact ofseptic tank soil-absorption systems on water quality in theprincipal valley-fill aquifer, Ogden Valley, Weber County,Utah assessment and guidelines: Utah Geological SurveyReport of Investigation 237, 11 p.
—1998b, The potential impact of septic tank soil-absorptionsystems on water quality in the principal valley-fill aquifer,Tooele Valley, Tooele County, Utah assessment and guide-lines: Utah Geological Survey Report of Investigation 235,10 p.
—1998c, The potential impact of septic tank soil-absorptionsystems on water quality in the principal valley-fill aquifer,Cedar Valley, Iron County, Utah assessment and guidelines:Utah Geological Survey Report of Investigation 239, 11 p.
—1999, A mass-balance approach for recommending septic-tank-soil-absorption system density/lot-size requirementsbased on potential water-quality degradation due to nitrateexamples from three Utah valleys, in Spangler, L.E., and
28 Utah Geological Survey

29Ground-water quality, Castle Valley, Grand County, Utah
Allen, C.J., editors, Geology of northern Utah and vicinity:Utah Geological Association Publication 27, p. 267-274.
Weir, J.E., Maxfield, E.B., and Zimmerman, E.A., 1983,Regional hydrology of the Delores River basin easternParadox Basin, Colorado and Utah: U.S. Geological Survey
Water-Resources Investigations Report 83-4217, 53 p.Zhan, Honbin, and McKay, W.A., 1998, An assessment of
nitrate occurrence and transport in Washoe Valley, Nevada:Environmental and Engineering Geoscience, v. 4, no. 4, p.479-489.

APPENDICES
APPENDIX A
WATER QUALITY DATA
(Site ID numbers shown on plate 6)
30 Utah Geological Survey
Site ID
Data source2
Well Depth (feet)
SampleDate
NitrogenNO2 + NO3
dissolved (mg/L)
Nitrate as N (mg/L)
Solids, sum of
constituents, dissolved (mg/
L)1
Field Tempera-
ture,(°C)
Field, Specific Conductance
(μmhos)
Lab, Specific Conduct-
ance(μmhos)
pH,Field
pH,Lab
Field,Dissolv-
ed Oxygen
Alpha, gross(pCi/L)
Aluminum, dissolved
(μg/L)Ammonia
(mg/L)
Arsenic, dissolved(μg/L)
Barium, dissolved(μg/L)
Bicarbon-ate
(mg/L)
Cadmium, dissolved(μg/L)
Calcium, dissolved
(mg/L)
Carbon dioxide(mg/L)
Carbonate(mg/L)
Chloride(mg/L)
Chromium, dissolved(μg/L)
Carbonate(CO3)Solids(mg/L)
Copper, dissolved(μg/L)
Hydroxide(mg/L)
Iron, dissolved(μg/L)
Lead, dissolved(μg/L)
Magnesium, dissolved
(mg/L)
Manganese, dissolved(μg/L)
Mercury, dissolved(μg/L)
Phosphate, total
(mg/L)
Potassium, dissolved
(mg/L)
Selenium, dissolved(μg/L)
Silver, dissolved(μg/L)
Sodium, dissolved
(mg/L)Sulfate(mg/L)
TotalAlkalinity(mg/L)
TotalHardness
(mg/L)
TotalSuspended
Solids(mg/L)
Turbidity,(NTU)
Uranium-238,
(μg/L)
Zinc, dissolved(μg/L)
B(mg/L)
Be(μg/L)
Co(μg/L)
Li(mg/L)
Mo(mg/L)
Ni(mg/L)
S(mg/L)
Silicon(mg/L)
Strontium(mg/L)
V(mg/L)
Coliform(positive)
E coli(positive)
Alachlor(μg/L)
Atrazine(μg/L)
Benzo (a)
pyrene(μg/L)
Bis (2-ethyl-hexyl) adipate(μg/L)
Bis (2-ehtylhexyl) phthalate(μg/L)
Chlordane T
(μg/L)Dicamba(μg/L)
Endrin(μg/L)
Heptachlor(μg/L)
Heptachlor Epoxide(μg/L)
Hexa-chloro-
benzene(μg/L)
Hexa-chloro-
cyclopenta-diene
(μg/L)Lindane(μg/L)
Metho-xychlor(μg/L)
Pentachloro-phenol(μg/L)
Simazine(μg/L)
Toxa-phene(μg/L)
2,4-Dinitrotu-
luene(μg/L)
2,4,5-TP
(Silvex)(μg/L)
2,6-Dinitrotu-
luene(μg/L)
4,4' DDE(μg/L)
Aceto-chlor
(μg/L)EPTC(μg/L)
Molinate(μg/L)
Terbacil(μg/L)
Alpha-Chlordane
(μg/L)
Gamma-Chlordane
(μg/L)Gamma-Lindane
Trans-Nonchlor(μg/L)
Chloro-biphenyl(μg/L)
Di-chloro-biphenyl(μg/L)
Hepta-chloro-
biphenyl(μg/L)
Hexa-chloro-
biphenyl(μg/L)
Octa-chloro-
biphenyl(μg/L)
Pentachloro-biphenyl(μg/L)
Picloram(μg/L)
Tetrea-chloro-
biphenyl(μg/L)
Trichloro-biphenyl(μg/L)
3-Keto Carbofuran
(μg/L)Aldrin(μg/L)
Bromacil(μg/L)
Butachlor(μg/L)
Cyanazine(μg/L)
Dieldrin(μg/L)
Metala-chlor
(μg/L)Metribuzin
(μg/L)Prometon
(μg/L)
Propa-chlor
(μg/L)Trifuralin(μg/L)
Aldicarb sulfone(μg/L)
Aldicarb sulfoxide(μg/L)
Aldicarb(μg/L)
Carbofuran(μg/L)
Oxamyl(μg/L)
Carbaryl(μg/L)
3-Hydroxy-carbofuran
(μg/L)Methomyl
(μg/L) 9 UGS 102 10/22/2001 0.38 - 772 14.8 899 1059 7.5 8.03 5.8 <2 - - <5.0 12.2 152 <1.0 138 2 0 47.7 <5.0 75 <12.0 0 <20.0 8.5 35.9 <5.0 <0.2 <0.02 2.81 2.7 <2.0 40.7 355.0 125 492.0 <4.0 3.07 3.8 <30.0 - - - - - - - - - - - - U U U U U - - U U U U U U U U U U U U U U U U U U U U - U U U U U U U U U U U U U U U U U U U U U U U U U U U U U9 UDAF " Sept.2000 - 0 - 16.6 929 - 7.74 - - - -0.1 - -0.1 -0.1 2.4638 -0.1 115.3102 - 0 40.3976 -0.1 - -0.1 - 89 -0.1 30.6217 0.0335 - -0.1 2.3492 -0.1 - 34.3451 - - 8.534029 - - - -0.1 -0.1 -0.1 -0.1 -0.1 -0.1 -0.1 99.3574 - - -0.1 1 0 U U - - - U U U U U U U - U - U U U U - - - - - - U U U - - - - - - U U - - U U - - - U - - U - - U U U U U - U U 10 UGS 180 10/24/2001 0.37 - 468 14.7 580 670 7.8 8.19 6.2 - <30.0 - <5.0 15.8 157 <1.0 77 2 0 28.9 <5.0 77 <12.0 0 34.8 <3.0 24 <5.0 <0.2 <0.02 1.56 1.9 <2.0 28.4 185.0 128 290.9 <4.0 0.244 - 56.7 - - - - - - - - - - - - - - - - - - - - - - - - - - - - - - - - - - - - - - - - - - - - - - - - - - - - - - - - - - - - - - - - - - - - -10 UDAF " Sept.2000 - 2.3 - 16.3 696 - 7.68 - - - -0.1 - -0.1 21 2.6578 -0.1 83.6345 - 0 28.2246 -0.1 - -0.1 - 49 -0.1 23.3137 -0.1 - -0.1 2.0369 -0.1 - 26.3997 - - 6.254281 - - - 0.0789 -0.1 -0.1 -0.1 -0.1 -0.1 -0.1 61.7728 - - -0.1 1 0 U U - - - U U U U U U U - U - U U U U - - - - - - U U U - - - - - - U U - - U U - - - U - - U - - U U U U U - U U 11 UGS 71 10/24/2001 0.33 - 308 13.7 410 479 7.8 8.24 6.5 - <30.0 - <5.0 26.7 157 <1.0 52.1 1 0 118 <5.0 77 <12.0 0 <20.0 <3.0 17.5 <5.0 <0.2 <0.02 1.28 1.7 <2.0 21.5 91.0 129 202.0 <4.0 0.068 - <30.0 - - - - - - - - - - - - - - - - - - - - - - - - - - - - - - - - - - - - - - - - - - - - - - - - - - - - - - - - - - - - - - - - - - - - -11 UDAF " Sept.2000 - 0.9 - 16 508 - 7.73 - - - -0.1 - -0.1 31 2.8906 -0.1 57.0768 - 0 20.5789 -0.1 - -0.1 - -0.1 -0.1 17.4437 -0.1 - -0.1 1.8662 -0.1 - 20.7211 - - 4.357924 - - - -0.1 -0.1 -0.1 -0.1 -0.1 -0.1 -0.1 31.9598 - - -0.1 0 0 U U - - - - - - - - - U - U - U U U U - - - - - - U U U - - - - - - U U - - U U - - - U - - U - - U U U U U - U U12 UGS 120 10/24/2001 0.36 - 480 14.2 597 703 7.8 8.03 6 - <30.0 - <5.0 14.4 156 <1.0 79.6 2 0 30.7 <5.0 77 <12.0 0 132.0 <3.0 24.8 7.0 <0.2 <0.02 1.6 1.7 <2.0 29.1 194.0 128 300.6 <4.0 1.22 - 92.1 - - - - - - - - - - - - - - - - - - - - - - - - - - - - - - - - - - - - - - - - - - - - - - - - - - - - - - - - - - - - - - - - - - - - - 12 UDAF " Sept.2000 - 0.7 - 19.3 737 - 7.67 - - - -0.1 - -0.1 -0.1 2.3668 -0.1 87.9078 - 0 29.898 -0.1 - -0.1 - 146 -0.1 24.5741 -0.1 - -0.1 2.1546 -0.1 - 27.6432 - - 6.577889 - - - 0.0954 -0.1 -0.1 -0.1 -0.1 -0.1 -0.1 68.2588 - - -0.1 1 0 U U - - - - U U U U U U - U - U U U U - - - - - - U U U - - - - - - U U - - U U - - - U - - U - - U U U U U - U U35 UGS 140 10/23/2001 0.39 - 1232 14.6 1290 1460 7.4 7.85 5 - <30.0 - <5.0 8.7 150 <1.0 220 3 0 79.6 <5.0 74 <12.0 0 56.2 <3.0 51.2 <5.0 <0.2 <0.02 3.01 3.6 <2.0 55.7 619.0 123 759.6 <4.0 2.51 - <30.0 - - - - - - - - - - - - U U U U U - - U U U U U U U U U U U U U U U U U U U U - U U U U U U U U U U U U U U U U U U U U U U U U U U U U U 35 UDAF " Sept.2000 - 0.6 - 18.7 1549 - 7.72 - - - -0.1 - -0.1 -0.1 2.4444 -0.1 239.1445 - 0 74.8882 -0.1 - -0.1 - 145 -0.1 51.0685 -0.1 - -0.1 3.4432 -0.1 - 54.7818 - - 16.97152 - - - 0.0604 0.104 -0.1 -0.1 -0.1 0.0145 -0.1 210.698 - - -0.1 1 0 U U - - - - - - - - - U - U - U U U U - - - - - - U U U - - - - - - U U - - U U - - - U - - U - - U U U U U - U U48 UGS 195 10/23/2001 <0.1 - 2020 15.9 1920 2250 7.3 7.89 4.1 - <30.0 - <5.0 7.1 153 <1.0 341 3 0 121 <5.0 75 <12.0 0 48.8 <3.0 78.7 21.7 <0.2 <0.02 4.24 2.7 <2.0 85.5 1050.0 125 1174.6 <4.0 2.16 - <30.0 - - - - - - - - - - - - - - - - - - - - - - - - - - - - - - - - - - - - - - - - - - - - - - - - - - - - - - - - - - - - - - - - - - - - - 48 UDAF " Sept.2000 - 1.1 - 16.4 2300 - 7.44 - - - -0.1 - -0.1 -0.1 2.4638 -0.1 397.3475 - 0 112.678 -0.1 - -0.1 - 60 -0.1 76.844 -0.1 - -0.1 5.1199 -0.1 - 83.307 - - 27.7305 - - - -0.1 0.1963 -0.1 -0.1 -0.1 0.0243 -0.1 356.641 - - -0.1 1 0 U U - - - U U U U U U U - U - U U U U - - - - - - U U U - - - - - - U U - - U U - - - U - - U - - U U U U U - U U51 UGS 339? 10/24/2001 0.73 - 336 16.1 432 514 7.8 8.11 5.2 - <30.0 - <5.0 23.3 156 <1.0 55.6 2 0 19.8 <5.0 77 <12.0 0 <20.0 <3.0 18.6 <5.0 <0.2 <0.02 1.34 1.6 <2.0 22.1 106.0 128 215.3 <4.0 1.31 - 121 - - - - - - - - - - - - - - - - - - - - - - - - - - - - - - - - - - - - - - - - - - - - - - - - - - - - - - - - - - - - - - - - - - - - - 51 UDAF " Sept.2000 - 1.3 - 19.6 539 - 8 - - - -0.1 - -0.1 29 2.5414 -0.1 59.519 - 0 21.3197 -0.1 - -0.1 - -0.1 -0.1 17.9034 -0.1 - -0.1 1.7349 -0.1 - 20.7963 - - 4.527626 - - - -0.1 -0.1 -0.1 -0.1 -0.1 -0.1 -0.1 37.9138 - - -0.1 0 0 U U - - - - U U U U U U - U - U U U U - - - - - - U U U - - - - - - U U - - U U - - - U - - U - - U U U U U - U U53 UGS 168 10/24/2001 0.31 - 276 13.3 364 422 7.7 8.31 8 - <30.0 - <5.0 33.0 150 <1.0 44.8 1 0 20.3 <5.0 74 <12.0 0 33.8 <3.0 15.6 <5.0 <0.2 <0.02 1.23 1.5 <2.0 20.5 71.1 123 176.0 <4.0 0.441 - 39.6 - - - - - - - - - - - - - - - - - - - - - - - - - - - - - - - - - - - - - - - - - - - - - - - - - - - - - - - - - - - - - - - - - - - - - 53 UDAF " Sept.2000 - 1.3 - 16.4 450 - 8.08 - - - -0.1 - -0.1 37 2.425 -0.1 48.0393 - 0 19.4886 -0.1 - -0.1 - 21 -0.1 15.0778 -0.1 - -0.1 1.6749 -0.1 - 19.8119 - - 3.691058 - - - 0.0557 -0.1 -0.1 -0.1 -0.1 -0.1 -0.1 23.6778 - - -0.1 1 0 U U - - - U U U U U U U - U - U U U U - - - - - - U U U - - - - - - U U - - U U - - - U - - U - - U U U U U - U U56 UGS 136 10/23/2001 <0.1 - 1292 15.2 1320 1570 7.5 7.96 6.2 - <30.0 - <5.0 8.9 148 <1.0 217 3 0 82.7 <5.0 73 <12.0 0 73.4 <3.0 53 5.4 <0.2 <0.02 2.89 3.7 <2.0 60.0 670.0 121 759.5 <4.0 1.53 - <30.0 - - - - - - - - - - - - - - - - - - - - - - - - - - - - - - - - - - - - - - - - - - - - - - - - - - - - - - - - - - - - - - - - - - - - - 56 UDAF " Sept.2000 - 0.9 - 15.8 1637 - 7.75 - - - -0.1 - -0.1 -0.1 2.3668 -0.1 248.5809 - 0 81.0857 -0.1 - -0.1 - 95 -0.1 51.1173 -0.1 - -0.1 3.5693 -0.1 - 57.165 - - 17.52621 - - - -0.1 0.11 -0.1 -0.1 -0.1 0.0154 -0.1 222.449 - - -0.1 1 0 U U - - - U U U U U U U - U - U U U U - - - - - - U U U - - - - - - U U - - U U - - - U - - U - - U U U U U - U U59 UGS 168 10/24/2001 0.31 - 2138 16.8 2040 2320 7.3 7.83 5.4 - <30.0 - <5.0 7.6 153 <1.0 340 4 0 21.1 <5.0 75 <12.0 0 20.2 <3.0 91.1 <5.0 <0.2 <0.02 4.56 2.5 <2.0 93.9 1090.0 125 1223.1 <4.0 2.33 - 81.8 - - - - - - - - - - - - - - - - - - - - - - - - - - - - - - - - - - - - - - - - - - - - - - - - - - - - - - - - - - - - - - - - - - - - - 59 UDAF " Sept.2000 - 0.9 - 7.5 2370 - 7.5 - - - -0.1 - -0.1 -0.1 2.425 -0.1 400.403 - 0 120.249 -0.1 - -0.1 - -0.1 -0.1 84.0629 -0.1 - -0.1 5.3031 -0.1 - 86.1146 - - 28.33134 - - - -0.1 0.2038 -0.1 -0.1 -0.1 0.0252 -0.1 372.0773 - - -0.1 0 0 U U - - - U U U U U U U - U - U U U U - - - - - - U U U - - - - - - U U - - U U - - - U - - U - - U U U U U - U U77 UGS 122 10/24/2001 <0.1 - 370 13.5 482 564 7.6 8.2 4.9 - <30.0 - <5.0 20.6 155 <1.0 63.3 2 0 110 <5.0 76 <12.0 0 <20.0 <3.0 21.1 5.7 <0.2 <0.02 1.41 1.8 <2.0 24.6 132.0 127 244.7 <4.0 1.08 - 44.7 - - - - - - - - - - - - - - - - - - - - - - - - - - - - - - - - - - - - - - - - - - - - - - - - - - - - - - - - - - - - - - - - - - - - - 77 UDAF " Sept.2000 - 1.2 - 16.2 652 - 7.56 - - - -0.1 - -0.1 26 2.5414 -0.1 77.1224 - 0 19.3162 -0.1 - -0.1 - -0.1 -0.1 22.5006 -0.1 - -0.1 2.0274 -0.1 - 24.6045 - - 5.825906 - - - -0.1 -0.1 -0.1 -0.1 -0.1 -0.1 -0.1 54.6643 - - -0.1 0 0 U U - - - U U U U U U U - U - U U U U - - - - - - U U U - - - - - - U U - - U U - - - U - - U - - U U U U U - U U78 UGS 139 10/24/2001 0.29 - 650 13.5 802 911 7.6 8.03 5.8 - <30.0 - <5.0 12.4 155 <1.0 111 2 0 41.2 <5.0 76 <12.0 0 <20.0 <3.0 33.4 <5.0 <0.2 <0.02 2.02 2.2 <2.0 37.6 325.0 127 414.4 <4.0 0.208 - 34.9 - - - - - - - - - - - - - - - - - - - - - - - - - - - - - - - - - - - - - - - - - - - - - - - - - - - - - - - - - - - - - - - - - - - - - 78 UDAF " Sept.2000 - 0.9 - 18.3 942 - 7.45 - - - -0.1 - -0.1 -0.1 2.2892 -0.1 118.4668 - 0 39.2276 -0.1 - -0.1 - -0.1 -0.1 31.5892 -0.1 - -0.1 2.6134 -0.1 - 34.1208 - - 8.775205 - - - 0.0445 -0.1 -0.1 -0.1 -0.1 -0.1 -0.1 103.002 - - -0.1 0 0 U U - - - U U U U U U U - U - U U U U - - - - - - U U U - - - - - - U U - - U U - - - U - - U - - U U U U U - U U83 UGS 105 10/22/2001 0.32 - 272 15 213 389 7.8 8.14 4.7 <2 - - <5.0 32.0 153 <1.0 48.7 2 0 17.8 <5.0 75 <12.0 0 <20.0 <3.0 15.7 <5.0 <0.2 <0.02 1.5 1.6 <2.0 19.5 63.5 125 186.1 <4.0 0.515 3.0 <30.0 - - - - - - - - - - - - U U U U U - - U U U U U U U U U U U U U U U U U U U U - U U U U U U U U U U U U U U U U U U U U U U U U U U U U U 83 UDAF " Sept.2000 - 1 - 14.2 455 - 8.04 - - - -0.1 - -0.1 40 2.425 -0.1 49.3899 - 0 4.9671 -0.1 - -0.1 - -0.1 -0.1 15.4598 -0.1 - -0.1 1.695 -0.1 - 18.55 - - 3.79238 - - - -0.1 -0.1 -0.1 -0.1 -0.1 -0.1 -0.1 23.889 - - -0.1 0 0 U U - - - U U U U U U U - U - U U U U - - - - - - U U U - - - - - - U U - - U U - - - U - - U - - U U U U U - U U86 UGS 158 10/23/2001 0.31 - 1252 16.4 1324 1560 7.4 7.88 5.8 - <30.0 - <5.0 10.5 152 <1.0 213 3 0 88.4 <5.0 75 31.1 0 44.2 <3.0 54.8 <5.0 <0.2 <0.02 2.9 3.4 <2.0 60.4 648.0 124 756.9 <4.0 3.14 - 70.1 - - - - - - - - - - - - - - - - - - - - - - - - - - - - - - - - - - - - - - - - - - - - - - - - - - - - - - - - - - - - - - - - - - - - - 86 UDAF " Sept.2000 - 0.9 - 16.2 1654 - 7.86 - - - -0.1 - -0.1 -0.1 2.425 -0.1 244.8204 - 0 81.4335 -0.1 - -0.1 - 63 -0.1 52.247 -0.1 - -0.1 3.6544 -0.1 - 58.0932 - - 17.37236 - - - -0.1 0.1282 -0.1 -0.1 -0.1 0.0159 -0.1 223.654 - - -0.1 0 0 U U - - - U U U U U U U - U - U U U U - - - - - - U U U - - - - - - U U - - U U - - - U - - U - - U U U U U - U U141 UDWRi 130 12/20/1995 - 0.31 280* - - 400 - - - - <0.15 - <1.0 - 176.90 <0.05 45.24 - - 20.30 <0.02 - <0.05 - <0.05 <0.2 14.33 <0.02 - <2 <4.0 <1.0 - 21.37 - - - - - - <0.03 <0.15 - <0.05 - <0.05 <0.15 17.7 6.13 0.64 - - - - - - - - - - - - - - - - - - - - - - - - - - - - - - - - - - - - - - - - - - - - - - - - - - - - - - - - - - - - 147 UGS 169 10/24/2001 0.27 - 666 18.2 855 987 7.6 8.0 5.2 - <30.0 - <5.0 14.0 166 <1.0 84.6 3 0 92 <5.0 82 <12.0 0 <20.0 <3.0 35.4 <5.0 <0.2 <0.02 2.75 2.0 <2.0 73.6 266.0 136 356.7 <4.0 17.53 - 52.8 - - - - - - - - - - - - - - - - - - - - - - - - - - - - - - - - - - - - - - - - - - - - - - - - - - - - - - - - - - - - - - - - - - - - -147 UDAF " Sept.2000 - 1.4 - 20.7 1038 - 7.7 - - - -0.1 - -0.1 25 3.007 -0.1 100.7467 - 0 81.708 -0.1 - -0.1 - -0.1 -0.1 32.0406 -0.1 - -0.1 3.123 -0.1 - 66.4589 - - 7.765339 - - - -0.1 -0.1 -0.1 -0.1 -0.1 0.0106 -0.1 95.9232 - - -0.1 0 0 U U - - - U U U U U U U - U - U U U U - - - - - - U U U - - - - - - U U - - U U - - - U - - U - - U U U U U - U U 158 UGS 121 10/24/2001 <0.1 - 406 14.4 468 555 7.7 8.17 5.9 - <30.0 - <5.0 22.4 156 <1.0 60.4 2 0 21.3 7.2 77 <12.0 0 <20.0 <3.0 21.2 <5.0 <0.2 <0.02 1.41 1.7 <2.0 22.0 129.0 128 237.9 <4.0 0.144 - <30.0 - - - - - - - - - - - - - - - - - - - - - - - - - - - - - - - - - - - - - - - - - - - - - - - - - - - - - - - - - - - - - - - - - - - - -158 UDAF " Sept.2000 - 0.9 - 17.1 559 - 8.02 - - - -0.1 - -0.1 28 2.5414 -0.1 63.1285 - 0 21.6743 -0.1 - -0.1 - -0.1 -0.1 19.8259 -0.1 - -0.1 1.8619 -0.1 - 21.364 - - 4.851135 - - - -0.1 -0.1 -0.1 -0.1 -0.1 -0.1 -0.1 46.0819 - - -0.1 0 0 U U - - - - U U U U U U - U - U U U U - - - - - - U U U - - - - - - U U - - U U - - - U - - U - - U U U U U - U U 161 UGS 115 10/22/2001 0.14 - 2058 17.2 2000 2210 7.3 7.83 4.8 <2 - - <5.0 7.7 153 <1.0 373 4 0 140 <5.0 75 <12.0 0 200.0 <3.0 72.6 21.8 <0.2 <0.02 4.45 5.4 <2.0 87.7 1000.0 126 1229.3 <4.0 2.44 2.6 44 - - - - - - - - - - - - U U U U U - - U U U U U U U U U U U U U U U U U U U U - U U U U U U U U U U U U U U U U U U U U U U U U U U U U U161 UDAF " Sept.2000 - 1.1 - 22.1 2300 - 7.42 - - - -0.1 - -0.1 -0.1 2.5996 -0.1 411.5598 - 0 132.954 -0.1 - -0.1 - 338 -0.1 66.6532 0.0256 - -0.1 5.0628 -0.1 - 84.3347 - - 27.96567 - - - 0.2481 0.2052 -0.1 -0.1 -0.1 0.0289 -0.1 382.998 - - -0.1 0 0 U U - - - - - - - - - U - U - U U U U - - - - - - U U U - - - - - - U U - - U U - - - U - - U - - U U U U U - U U 180 UGS 132 10/24/2001 0.27 - 1902 17.4 1830 2140 7.1 7.76 2.4 - <30.0 - <5.0 8.1 153 <1.0 321 4 0 112 <5.0 75 <12.0 0 <20.0 <3.0 70.9 <5.0 <0.2 <0.02 3.93 2.6 <2.0 79.1 746.0 125 1092.6 <4.0 0.68 - 59.8 - - - - - - - - - - - - - - - - - - - - - - - - - - - - - - - - - - - - - - - - - - - - - - - - - - - - - - - - - - - - - - - - - - - - -180 UDAF " Sept.2000 - 0.8 - 21.6 1997 - 7.45 - - - -0.1 - -0.1 -0.1 2.5414 -0.1 344.9332 - 0 98.1642 -0.1 - -0.1 - 33 -0.1 59.164 -0.1 - -0.1 4.4914 -0.1 - 69.4668 - - 23.63142 - - - 0.0643 0.176 -0.1 -0.1 -0.1 0.0237 -0.1 324.197 - - -0.1 1 0 U U - - - U U U U U U U - U - U U U U - - - - - - U U U - - - - - - U U - - U U - - - U - - U - - U U U U U - U U 188 UGS 125 10/24/2001 <0.1 - 338 15.4 434 543 7.8 8.12 6.1 - <30.0 - <5.0 28.1 145 <1.0 49.5 2 0 42 <5.0 71 <12.0 0 26.1 <3.0 16.5 <5.0 <0.2 <0.02 1.37 1.8 <2.0 38.2 93.5 119 191.4 <4.0 0.689 - <30.0 - - - - - - - - - - - - - - - - - - - - - - - - - - - - - - - - - - - - - - - - - - - - - - - - - - - - - - - - - - - - - - - - - - - - -188 UDAF 125 Sept.2000 - 0.9 - 19.7 541 - 8.04 - - - -0.1 - -0.1 32 2.3668 -0.1 52.7036 - 0 40.0954 -0.1 - -0.1 - 49 -0.1 15.8931 -0.1 - -0.1 2.191 -0.1 - 35.5355 - - 4.011503 - - - -0.1 -0.1 -0.1 -0.1 -0.1 -0.1 -0.1 31.8239 - - -0.1 0 0 U U - - - U U U U U U U - U - U U U U - - - - - - U U U - - - - - - U U - - U U - - - U - - U - - U U U U U - U U 193 UGS 367 2/28/2003 - - 466* - 675 - - - - - - - - - - - - - - - - - - - - - - - - - - - - - - - - - - - - - - - - - - - - - - - - - - - - - - - - - - - - - - - - - - - - - - - - - - - - - - - - - - - - - - - - - - - - - - - - - - - - - - - - - 201 UGS 155 10/24/2001 0.11 - 242 14.6 321 379 7.9 8.18 5.5 - <30.0 - <5.0 37.7 137 <1.0 40.5 1 0 21.1 <5.0 68 <12.0 0 <20.0 <3.0 12.9 <5.0 <0.2 <0.02 1.31 1.4 <2.0 20.9 53.3 113 154.1 <4.0 0.748 - <30.0 - - - - - - - - - - - - - - - - - - - - - - - - - - - - - - - - - - - - - - - - - - - - - - - - - - - - - - - - - - - - - - - - - - - - -201 UDAF " 9/27/2000 - 0.8 - 20.5 540 - 8 - - - -0.1 - -0.1 34 2.3862 -0.1 51.1229 - 0 39.1837 -0.1 - -0.1 - 22 -0.1 16.003 -0.1 - -0.1 1.9733 -0.1 - 33.1339 - - 3.925491 - - - -0.1 -0.1 -0.1 -0.1 -0.1 -0.1 -0.1 31.7555 - - -0.1 0 0 U U - - - U U U U U U U - U - U U U U - - - - - - U U U - - - - - - U U - - U U - - - U - - U - - U U U U U - U U 204 UGS 125 10/24/2001 0.34 - 228 15.9 336 372 7.8 8.2 6.6 - <30.0 - <5.0 42.0 149 <1.0 38.6 2 0 16.2 <5.0 73 <12.0 0 <20.0 <3.0 13.4 <5.0 <0.2 <0.02 1.14 1.5 <2.0 18.2 49.1 122 151.4 <4.0 0.684 - <30.0 - - - - - - - - - - - - - - - - - - - - - - - - - - - - - - - - - - - - - - - - - - - - - - - - - - - - - - - - - - - - - - - - - - - - -204 UDAF " 9/27/2000 - 1.1 - 14.7 394 - 8.02 - - - -0.1 - -0.1 47 2.3668 -0.1 40.5804 - 0 18.8967 -0.1 - -0.1 - -0.1 -0.1 12.6014 -0.1 - -0.1 1.5897 -0.1 - 17.851 - - 3.110047 - - - -0.1 -0.1 -0.1 -0.1 -0.1 -0.1 -0.1 17.8021 - - -0.1 0 0 U U - - - U U U U U U U - U - U U U U - - - - - - U U U - - - - - - U U - - U U - - - U - - U - - U U U U U - U U 206 UDAF 300 9/27/2000 - .3 434* 16.1 620 - 7.92 - - - -0.1 - -0.1 32 2.4832 -0.1 64.5589 - 0 25.3543 -0.1 - -0.1 - -0.1 -0.1 24.205 -0.1 - -0.1 2.0656 -0.1 - 23.0704 - - 5.190871 - - - -0.1 -0.1 -0.1 -0.1 -0.1 -0.1 -0.1 57.0696 - - -0.1 0 0 U U - - - U U U U U U U - U - U U U U - - - - - - U U U - - - - - - U U - - U U - - - U - - U - - U U U U U - U U230 UGS 125 10/24/2001 0.77 - 230 14.7 316 374 8 8.24 3.2 - <30.0 - <5.0 42.7 150 <1.0 39.5 1 0 16.9 <5.0 74 53.1 0 <20.0 <3.0 13.8 <5.0 <0.2 <0.02 1.15 1.5 <2.0 18.2 52.6 123 155.3 <4.0 0.497 - 118 - - - - - - - - - - - - - - - - - - - - - - - - - - - - - - - - - - - - - - - - - - - - - - - - - - - - - - - - - - - - - - - - - - - - - 230 UDAF " Sept.2000 - 1.1 - 17.8 389 - 7.97 - - - -0.1 - -0.1 47 2.4444 -0.1 42.3269 - 0 16.4211 -0.1 - -0.1 - 21 -0.1 13.2263 -0.1 - -0.1 1.7798 -0.1 - 17.7995 - - 3.248725 - - - 0.0496 -0.1 -0.1 -0.1 -0.1 -0.1 -0.1 15.9744 - - -0.1 0 0 U U - - - - U U U U U U - U - U U U U - - - - - - U U U - - - - - - U U - - U U - - - U - - U - - U U U U U - U U235 UGS 132 10/22/2001 0.26 - 238 16.4 342 386 7.9 8.24 5.4 <2 - - <5.0 34.3 141 <1.0 42.2 1 0 24 <5.0 69 <12.0 0 <20.0 <3.0 12.9 <5.0 <0.2 <0.02 1.48 1.8 <2.0 24.0 47.4 116 158.4 <4.0 0.214 3.0 54.8 - - - - - - - - - - - - U U U U U - - U U U U U U U U U U U U U U U U U U U U - U U U U U U U U U U U U U U U U U U U U U U U U U U U U U 235 UDAF " Sept.2000 - 0.9 - 15 400 - 8.17 - - - -0.1 - -0.1 41 2.2504 -0.1 42.0019 - 0 31.1719 -0.1 - -0.1 - -0.1 -0.1 12.7256 -0.1 - -0.1 1.7858 -0.1 - 23.6453 - - 3.200439 - - - -0.1 -0.1 -0.1 -0.1 -0.1 -0.1 -0.1 18.9453 - - -0.1 0 0 U U - - - U U U U U U U - U - U U U U - - - - - - U U U - - - - - - U U - - U U - - - U - - U - - U U U U U - U U237 UGS 202 2/28/2003 - - 345* - 500 - - - - - - - - - - - - - - - - - - - - - - - - - - - - - - - - - - - - - - - - - - - - - - - - - - - - - - - - - - - - - - - - - - - - - - - - - - - - - - - - - - - - - - - - - - - - - - - - - - - - - - - - -238 UGS 185 2/28/2003 - - 500* - 725 - - - - - - - - - - - - - - - - - - - - - - - - - - - - - - - - - - - - - - - - - - - - - - - - - - - - - - - - - - - - - - - - - - - - - - - - - - - - - - - - - - - - - - - - - - - - - - - - - - - - - - - - - -244 UGS 142 10/23/2001 0.68 - 208 13.8 315 377 7.9 8.16 6.1 - <30.0 - <5.0 41.0 142 <1.0 38 2 0 19.2 <5.0 70 <12.0 0 <20.0 <3.0 13.1 <5.0 <0.2 <0.02 1.12 1.5 <2.0 19.4 48.4 116 148.7 <4.0 0.722 - 173.0 - - - - - - - - - - - - - - - - - - - - - - - - - - - - - - - - - - - - - - - - - - - - - - - - - - - - - - - - - - - - - - - - - - - - - 244 UDAF " Sept.2000 - 1 - 15.8 385 - 8.06 - - - -0.1 - -0.1 98 2.1728 -0.1 40.2772 - 0 18.8403 -0.1 - -0.1 - 78 -0.1 12.8552 -0.1 - -0.1 1.6686 -0.1 - 18.9251 - - 3.107158 - - - 0.3481 -0.1 -0.1 -0.1 -0.1 -0.1 -0.1 16.3995 - - -0.1 0 0 U U - - - U U U U U U U - U - U U U U - - - - - - U U U - - - - - - U U - - U U - - - U - - U - - U U U U U - U U244 UGS " 2/29/03 - - - 15 300 - - 248 UDAF 140 9/27/2000 - .3 279* 17.4 399 - 7.95 - - - -0.1 - -0.1 51 2.5026 -0.1 44.2699 - 0 14.4695 -0.1 - -0.1 - 35 -0.1 13.5783 -0.1 - -0.1 1.8143 -0.1 - 16.2893 - - 3.382936 - - - -0.1 -0.1 -0.1 -0.1 -0.1 -0.1 -0.1 17.1239 - - -0.1 0 0 U U - - - U U U U U U U - U - U U U U - - - - - - U U U - - - - - - U U - - U U - - - U - - U - - U U U U U - U U 275 UGS 135 2/28/2003 - - 207* - 300 - - - - - - - - - - - - - - - - - - - - - - - - - - - - - - - - - - - - - - - - - - - - - - - - - - - - - - - - - - - - - - - - - - - - - - - - - - - - - - - - - - - - - - - - - - - - - - - - - - - - - - - - -279 UGS 126 10/22/2001 0.52 - 226 15.2 315 358 7.7 8.35 5.8 <2 - - <5.0 44.2 143 <1.0 40.5 1 0 16 <5.0 70 <12.0 0 <20.0 <3.0 12.9 <5.0 <0.2 <0.02 1.39 1.5 <2.0 18.5 39.6 117 154.1 <4.0 1.87 2.7 110.0 - - - - - - - - - - - - U U U U U - - U U U U U U U U U U U U U U U U U U U U - U U U U U U U U U U U U U U U U U U U U U U U U U U U U U279 UDAF " Sept.2000 - 0.9 - 18.5 387 - 8.16 - - - -0.1 - -0.1 49 2.2892 -0.1 40.5575 - 0 17.2554 -0.1 - -0.1 - 51 -0.1 12.6805 -0.1 - -0.1 1.4484 -0.1 - 17.9719 - - 3.113333 - - - 0.088 -0.1 -0.1 -0.1 -0.1 -0.1 -0.1 14.6619 - - -0.1 0 0 U U - - - - - - - - - U - U - U U U U - - - - - - U U U - - - - - - U U - - U U - - - U - - U - - U U U U U - U U 297 UDAF unknown 9/28/2000 - 0.9 676* 15.1 - 965 - 7.76 - - -0.1 - -0.1 0.037 3.647 -0.1 94.223 - 0 72.067 -0.1 0 -0.1 - -0.1 -0.1 30.679 -0.1 - -0.1 4.998 -0.1 - 67.658 - - 7.3 - - - - 0.089 -0.1 -0.1 -0.1 0.014 -0.1 76.628 - - -0.1 0 0 U U - - - U U U U U U U - - - U U U U - - - - - - U U U - - - - - - U U - - U U - - - U - - U - - U U U U U - U U298 UDAF unknown 9/28/2000 - 0.8 1234* 14.9 - 1762 - 7.41 - - -0.1 - -0.1 -0.1 4.035 -0.1 291.961 - 0 87.698 -0.1 0 -0.1 - 0.092 -0.1 44.024 -0.1 - -0.1 2.399 -0.1 - 82.476 - - 19.6 - - - - 0.096 -0.1 -0.1 -0.1 0.024 -0.1 247.963 - - -0.1 1 0 U U - - - U U U U U U U - - - U U U U - - - - - - U U U - - - - - - U U - - U U - - - U - - U - - U U U U U - U U 300 UDAF 150? 9/28/2000 - 3.5 721* 18.9 - 1031 - 7.92 - - -0.1 - -0.1 0.051 3.24 -0.1 114.261 - 0 61.135 -0.1 0 -0.1 - -0.1 -0.1 39.176 -0.1 - -0.1 2.406 -0.1 - 55.473 - - 9 - - - - 0.127 -0.1 -0.1 -0.1 0.018 -0.1 103.239 - - -0.1 0 0 U U - - - U U U U U U U - - - U U U U - - - - - - U U U - - - - - - U U - - U U - - - U - - U - - U U U U U - U U305 UDWRi 135 12/10/1991 0.437 - 232 11.6 - 376 - 8.0 - - - <0.05 <0.005 0.045 152.00 <0.001 43.00 2 0 13.95 <0.005 - <0.02 0 0.07 <0.005 13.00 <0.005 <0.0002 0.02 1.4 <0.005 <0.002 17.00 50 125 160.8 <3.0 0.4 - 0.720 - - - - - - - - - - - - - - - - - - - - - - - - - - - - - - - - - - - - - - - - - - - - - - - - - - - - - - - - - - - - - - - - - - - - - 328 UGS 248 10/23/2001 0.26 - 240 14.3 331 371 7.8 8.02 7 - <30.0 - <5.0 41.2 154 <1.0 45.1 2 0 15.6 <5.0 76 <12.0 0 <20.0 <3.0 14.1 <5.0 <0.2 <0.02 1.48 1.8 <2.0 16.8 47.6 127 170.5 <4.0 0.224 - 92.3 - - - - - - - - - - - - U U U U U - - U U U U U U U U U U U U U U U U U U U U - U U U U U U U U U U U U U U U U U U U U U U U U U U U U U328 UDAF " Sept.2000 - 1 - 21.2 418 - 8.01 - - - -0.1 - -0.1 42 2.5414 -0.1 47.1656 - 0 15.6235 -0.1 - -0.1 - 25 -0.1 15.1481 -0.1 - -0.1 1.691 -0.1 - 18.3482 - - 3.644076 - - - 0.0877 -0.1 -0.1 -0.1 -0.1 -0.1 -0.1 21.173 - - -0.1 0 0 U U - - - U U U U U U U - U - U U U U - - - - - - U U U - - - - - - U U - - U U - - - U - - U - - U U U U U - U U 338 UDWRi 230 12/20/1995 - 0.16 1400* - - 2000 - - - - <0.15 - <1.0 - 176.90 <0.05 249.34 - - 151.0 <0.02 - <0.05 - <0.05 <0.2 65.72 <0.02 - <2 <4.0 <1.0 - 85.80 - - - - - - <0.03 <0.15 - <0.05 - <0.05 <0.15 247.13 6.67 4.65 - - - - - - - - - - - - - - - - - - - - - - - - - - - - - - - - - - - - - - - - - - - - - - - - - - - - - - - - - - - -352 UGS 135 10/23/2001 0.25 - 204 13.6 307 367 7.7 8.28 6.7 - <30.0 - <5.0 45.9 151 <1.0 39.5 1 0 14.6 <5.0 74 <12.0 0 <20.0 <3.0 13.5 <5.0 <0.2 <0.02 1.14 1.5 <2.0 15.8 43.5 124 154.1 <4.0 1.33 - <30.0 - - - - - - - - - - - - - - - - - - - - - - - - - - - - - - - - - - - - - - - - - - - - - - - - - - - - - - - - - - - - - - - - - - - - - 352 UDAF " Sept.2000 - 0.7 - 14.6 377 - 8.09 - - - -0.1 - -0.1 174 2.425 -0.1 44.4749 - 0 14.9473 -0.1 - -0.1 - 132 -0.1 13.5744 -0.1 - -0.1 1.5415 -0.1 - 17.2066 - - 3.394696 - - - -0.1 -0.1 -0.1 -0.1 -0.1 -0.1 -0.1 16.023 - - -0.1 1 0 U U - - - U U U U U U U - U - U U U U - - - - - - U U U - - - - - - U U - - U U - - - U - - U - - U U U U U - U U358 UGS 110 10/23/2001 0.26 - 222 12.5 315 371 7.7 8.19 6.5 - <30.0 - <5.0 48.3 156 <1.0 40 2 0 15.6 <5.0 77 <12.0 0 <20.0 <3.0 13.6 <5.0 <0.2 <0.02 1.2 1.5 <2.0 16.3 44.7 128 155.8 <4.0 0.314 - <30.0 - - - - - - - - - - - - - - - - - - - - - - - - - - - - - - - - - - - - - - - - - - - - - - - - - - - - - - - - - - - - - - - - - - - - - 358 UDAF " Sept.2000 - 1 - 14 388 - 8.02 - - - -0.1 - -0.1 51 2.7548 -0.1 43.0833 - 0 15.262 -0.1 - -0.1 - -0.1 -0.1 13.1884 -0.1 - -0.1 1.5237 -0.1 - 15.3712 - - 3.290743 - - - -0.1 -0.1 -0.1 -0.1 -0.1 -0.1 -0.1 14.4594 - - -0.1 0 0 U U - - - U U U U U U U - U - U U U U - - - - - - U U U - - - - - - U U - - U U - - - U - - U - - U U U U U - U U359 UGS 105 10/23/2001 <0.1 - 252 12.8 345 372 7.7 8.14 6.6 - <30.0 - <5.0 39.7 166 <1.0 48.5 2 0 13.7 <5.0 82 <12.0 0 <20.0 <3.0 15 <5.0 <0.2 <0.02 1.67 1.4 <2.0 15.5 47.7 136 182.7 <4.0 0.093 - <30.0 - - - - - - - - - - - - U U U U U - - U U U U U U U U U U U U U U U U U U U U - U U U U U U U U U U U U U U U U U U U U U U U U U U U U U 359 UDAF " Sept.2000 - 1.3 - 14.8 447 - 7.95 - - - -0.1 - -0.1 47 2.91 -0.1 52.6847 - 0 13.13 -0.1 - -0.1 - -0.1 -0.1 16.0705 -0.1 - -0.1 1.6226 -0.1 - 14.9693 - - 4.020772 - - - -0.1 -0.1 -0.1 -0.1 -0.1 -0.1 -0.1 20.8566 - - -0.1 0 0 U U - - - U U U U U U U - U - U U U U - - - - - - U U U - - - - - - U U - - U U - - - U - - U - - U U U U U - U U387 UGS 129 10/22/2001 0.32 - 852 14.9 1318 1360 7 7.76 4.5 - <30.0 - <5.0 <5.0 170 <1.0 44 5 0 282 <5.0 84 <12.0 0 330.0 <3.0 12.3 <5.0 <0.2 <0.02 12.3 2.6 <2.0 31.1 80.4 140 160.4 <4.0 2.97 - <30.0 - - - - - - - - - - - - U U U U U - - U U U U U U U U U U U U U U U U U U U U - U U U U U U U U U U U U U U U U U U U U U U U U U U U U U387 UDAF " Sept.2000 - 1.1 - 17.1 1105 - 7.39 - - - -0.1 - -0.1 -0.1 4.9664 -0.1 149.9904 - 0 44.4307 -0.1 - -0.1 - 62 -0.1 43.1819 -0.1 - -0.1 3.1044 -0.1 - 41.3593 - - 11.29663 - - - -0.1 -0.1 -0.1 -0.1 -0.1 0.0143 -0.1 98.5294 - - -0.1 1 0 U U - - - U U U U U U U - U - U U U U - - - - - - U U U - - - - - - U U - - U U - - - U - - U - - U U U U U - U U 390 UGS 100 10/24/2001 0.4 - 844 13.6 992 1100 7.2 7.98 4.4 - <30.0 - <5.0 16.1 270 <1.0 135 5 0 59.9 <5.0 133 <12.0 0 63.3 <3.0 45.1 <5.0 <0.2 <0.02 2.68 3.0 <2.0 48.3 339.0 221 522.4 <4.0 4.18 - 36.8 - - - - - - - - - - - - - - - - - - - - - - - - - - - - - - - - - - - - - - - - - - - - - - - - - - - - - - - - - - - - - - - - - - - - -390 UDAF " Sept.2000 - 1 - 16.4 1176 - 7.47 - - - -0.1 - -0.1 20 4.5978 -0.1 156.2959 - 0 56.3546 -0.1 - -0.1 - 74 -0.1 43.9795 -0.1 - -0.1 3.0563 -0.1 - 45.2208 - - 11.71201 - - - 0.0588 -0.1 -0.1 -0.1 -0.1 0.012 -0.1 113.377 - - -0.1 1 0 U U - - - U U U U U U U - U - U U U U - - - - - - U U U - - - - - - U U - - U U - - - U - - U - - U U U U U - U U 391 UGS 68 10/24/2001 0.58 - 742 14.2 884 1049 7.6 7.95 4.3 - <30.0 - <5.0 12.9 194 <1.0 111 3 0 69.7 <5.0 96 <12.0 0 116.0 <3.0 35.2 10.7 <0.2 <0.02 2.68 3.2 <2.0 59.3 304.0 159 421.8 <4.0 1.76 - <30.0 - - - - - - - - - - - - - - - - - - - - - - - - - - - - - - - - - - - - - - - - - - - - - - - - - - - - - - - - - - - - - - - - - - - - -391 UDAF 68 9/27/2000 - 0.7 - 15.9 1011 - 7.92 - - - -0.1 - -0.1 20 3.1234 -0.1 118.1622 - 0 61.9822 -0.1 - -0.1 - 102 -0.1 34.4874 -0.1 - -0.1 3.1403 -0.1 - 49.9981 - - 8.926877 - - - 0.0431 -0.1 -0.1 -0.1 -0.1 -0.1 -0.1 98.5109 - - -0.1 0 0 U U - - - U U U U U U U - U - U U U U - - - - - - U U U - - - - - - U U - - U U - - - U - - U - - U U U U U - U U 394 UGS 103 10/24/2001 <0.1 - 694 15.2 836 967 7.7 7.9 6 - <30.0 - <5.0 16.8 202 <1.0 103 4 0 70 <5.0 99 <12.0 0 <20.0 <3.0 31.8 <5.0 <0.2 <0.02 2.61 3.6 <2.0 58.9 267.0 166 387.8 <6.0 6.04 - <30.0 - - - - - - - - - - - - - - - - - - - - - - - - - - - - - - - - - - - - - - - - - - - - - - - - - - - - - - - - - - - - - - - - - - - - -394 UDAF " Sept.2000 - 0.9 - 16.5 993 - 7.62 - - - -0.1 - -0.1 23 3.2592 -0.1 111.6382 - 0 66.6706 -0.1 - -0.1 - 45 -0.1 30.3978 -0.1 - -0.1 3.0547 -0.1 - 52.1356 - - 8.306199 - - - -0.1 -0.1 -0.1 -0.1 -0.1 -0.1 -0.1 85.1191 - - -0.1 1 0 U U - - - U U U U U U U - U - U U U U - - - - - - U U U - - - - - - U U - - U U - - - U - - U - - U U U U U - U U 413 UGS 85 10/24/2001 0.59 - 2440 16.4 2340 2980 7.3 7.88 5.4 - <30.0 - <5.0 7.2 136 <1.0 343 3 0 172 <5.0 67 <12.0 0 83.1 <3.0 127 <5.0 <0.2 <0.02 8.29 9.9 <2.0 135.0 832.0 112 1378.3 <4.0 0.414 - 31.9 - - - - - - - - - - - - - - - - - - - - - - - - - - - - - - - - - - - - - - - - - - - - - - - - - - - - - - - - - - - - - - - - - - - - -413 UDAF " 9/27/2000 - 0.8 - 21 2800 - 7.83 - - - -0.1 - -0.1 -0.1 2.1728 -0.1 396.0642 - 0 160.641 -0.1 - -0.1 - 159 -0.1 132.5929 -0.1 - -0.1 9.5087 -0.1 - 136.29 - - 30.91562 - - - 0.15 0.2811 -0.1 -0.1 -0.1 0.0421 -0.1 448.636 - - -0.1 0 0 U U - - - U U U U U U U - U - U U U U - - - - - - U U U - - - - - - U U - - U U - - - U - - U - - U U U U U - U U 417 UGS 100 10/25/2001 1.54 - 708 11.2 969 1130 7.4 8.01 6.1 - <30.0 - <5.0 <5.0 174 <1.0 <1 3 0 52.5 <5.0 86 <12.0 0 <20.0 <3.0 <1 <5.0 <0.2 <0.02 1.55 2.7 <2.0 270.0 339.0 143 6.6 <4.0 0.713 - 145.0 - - - - - - - - - - - - - - - - - - - - - - - - - - - - - - - - - - - - - - - - - - - - - - - - - - - - - - - - - - - - - - - - - - - - -420 UDWRi 40 12/10/1991 0.661 - 648 13.8 - 915 - 6.1 - - - <0.05 <0.005 0.020 193.00 <0.001 100.00 7 0 42.18 <0.005 - <0.02 0 <0.05 <0.005 31.00 0.0068 0.00025 <0.01 2/6 <0.005 <0.002 43.00 260 158 377.0 <3.0 0.6 - 0.037 - - - - - - - - - - - - - - - - - - - - - - - - - - - - - - - - - - - - - - - - - - - - - - - - - - - - - - - - - - - - - - - - - - - - - 432 UDAF 121 9/27/2000 0.1 - 629* 20.4 898 - 9.33 - - - -0.1 - -0.1 -0.1 2.5608 -0.1 10.2168 - 0 139.31 -0.1 - -0.1 - 120 -0.1 17.8796 0.0228 - -0.1 14.1741 -0.1 - 151.256 - - 1.643064 - - - -0.1 -0.1 -0.1 -0.1 -0.1 0.0189 -0.1 35.9902 - - -0.1 1 0 U U - - - U U U U U U U - U - U U U U - - - - - - U U U - - - - - - U U - - U U - - - U - - U - - U U U U U - U U435 UGS 95 10/24/2001 0.41 - 2048 15.2 2070 2370 7.3 7.81 6.3 - <30.0 - <5.0 7.5 193 <1.0 273 5 0 162 12.7 95 <12.0 0 80.0 <3.0 104 <5.0 <0.2 <0.02 7.94 4.4 <2.0 146.0 752.0 158 1109.0 <4.0 0.61 - <30.0 - - - - - - - - - - - - - - - - - - - - - - - - - - - - - - - - - - - - - - - - - - - - - - - - - - - - - - - - - - - - - - - - - - - - - 435 UDAF " Sept.2000 - 0.9 - 17.9 2400 - 7.43 - - - -0.1 - -0.1 -0.1 3.0846 -0.1 331.6192 - 0 152.367 -0.1 - -0.1 - 32 -0.1 116.5061 -0.1 - -0.1 9.1845 -0.1 - 155.867 - - 26.20616 - - - -0.1 0.1598 -0.1 -0.1 -0.1 0.0302 -0.1 343.196 - - -0.1 0 0 U U - - - U U U U U U U - U - U U U U - - - - - - U U U - - - - - - U U - - U U - - - U - - U - - U U U U U - U U436 UDWRi 130 12/20/1995 - 0.21 1841* - - 2630 - - - - <0.15 - <1.0 0.015 262.30 <0.05 486.13 - - 85.10 <0.02 - <0.05 - <0.05 <0.2 80.29 <0.02 - - 8 <1.0 - 64.66 - - - - - - <0.03 <0.15 - <0.05 - <0.05 <0.15 449.68 10.69 8.09 - - - - - - - - - - - - - - - - - - - - - - - - - - - - - - - - - - - - - - - - - - - - - - - - - - - - - - - - - - - -442 UGS 145 10/24/2001 0.34 - 2442 14.5 2380 2680 7.1 7.58 4 - <30.0 - <5.0 8.0 272 <1.0 331 11 0 179 29.6 134 <12.0 0 48.4 <3.0 117 7.4 <0.2 <0.02 5.22 3.5 <2.0 168.0 834.0 223 1307.2 <4.0 2.04 - 48.2 - - - - - - - - - - - - - - - - - - - - - - - - - - - - - - - - - - - - - - - - - - - - - - - - - - - - - - - - - - - - - - - - - - - - -442 UDAF " Sept.2000 - 0.8 - 16.3 2740 - 7.78 - - - -0.1 - -0.1 -0.1 4.4426 -0.1 373.3287 - 0 189.48 -0.1 - -0.1 - 305 -0.1 120.9806 0.0436 - -0.1 6.5286 -0.1 - 167.572 - - 28.90698 - - - 0.0451 0.1999 -0.1 -0.1 -0.1 0.0387 -0.1 407.115 - - -0.1 0 0 U U - - - U U U U U U U - U - U U U U - - - - - - U U U - - - - - - U U - - U U - - - U - - U - - U U U U U - U U446 UGS 305 10/23/2001 0.51 - 1448 16 1630 1810 7.2 8.01 2.5 - <30.0 - <5.0 8.3 232 <1.0 184 4 0 176 <5.0 114 27.7 0 140.0 <3.0 77.8 23.4 <0.2 <0.02 11.2 6.0 <2.0 135.0 621.0 190 779.2 <4.0 6.7 - 41.2 - - - - - - - - - - - - U U U U U - - U U U U U U U U U U U U U U U U U U U U - U U U U U U U U U U U U U U U U U U U U U U U U U U U U U446 UDAF " Sept.2000 - 0.6 - 17.5 1956 - 7.72 - - - -0.1 - -0.1 -0.1 3.7636 -0.1 193.2984 - 0 159.823 -0.1 - -0.1 - 28 -0.1 73.0968 -0.1 - -0.1 12.4331 -0.1 - 135.462 - - 15.57867 - - - 0.0631 0.282 -0.1 -0.1 -0.1 0.0275 -0.1 208.289 - - -0.1 0 0 U U - - - - - - - - - U - U - U U U U - - - - - - U U U - - - - - - U U - - U U - - - U - - U - - U U U U U - U U 448 UGS 58 10/24/2001 0.6 - 1850 14.2 1840 2120 7.1 7.65 5.4 - <30.0 - <5.0 16.0 278 <1.0 297 10 0 113 11.3 137 <12.0 0 55.8 <3.0 77.7 6.2 <0.2 <0.02 4.24 3.8 <2.0 97.8 461.0 228 1060.7 <4.0 1.11 - <30.0 - - - - - - - - - - - - - - - - - - - - - - - - - - - - - - - - - - - - - - - - - - - - - - - - - - - - - - - - - - - - - - - - - - - - - 448 UDAF " Sept.2000 - 0.6 - 16.6 1906 - 7.39 - - - -0.1 - -0.1 20 4.4232 -0.1 282.1229 - 0 118.237 -0.1 - -0.1 - 23 -0.1 61.3487 -0.1 - -0.1 4.5516 -0.1 - 99.8784 - - 20.08606 - - - 0.0692 0.0854 -0.1 -0.1 -0.1 0.0189 -0.1 230.993 - - -0.1 1 0 U U - - - U U U U U U U - U - U U U U - - - - - - U U U - - - - - - U U - - U U - - - U - - U - - U U U U U - U U 998 UGS 120 10/25/2001 4.27 - 856 13.4 1001 1160 7.3 8.09 7 - <30.0 - <5.0 45.7 232 <1.0 119 3 0 52.4 <5.0 114 331.0 0 <20.0 <3.0 48.5 <5.0 <0.2 <0.02 2.28 5.8 <2.0 71.8 358.0 190 496.5 <4.0 0.126 - <30.0 - - - - - - - - - - - - - - - - - - - - - - - - - - - - - - - - - - - - - - - - - - - - - - - - - - - - - - - - - - - - - - - - - - - - -999 UGS 70 10/25/2001 0.93 - 364 15.2 485 577 7.6 8.14 5.7 - <30.0 - <5.0 35.1 160 <1.0 56.6 2 0 38.7 <5.0 79 <12.0 0 <20.0 <3.0 17.4 <5.0 <0.2 <0.02 1.5 1.5 <2.0 39.5 105.0 131 212.8 <4.0 0.506 - <30.0 - - - - - - - - - - - - - - - - - - - - - - - - - - - - - - - - - - - - - - - - - - - - - - - - - - - - - - - - - - - - - - - - - - - - -999 UDAF " Sept.2000 - 0.6 - 27.9 531 - 7.81 - - - -0.1 - -0.1 39 2.5608 -0.1 54.91 - 0 33.1311 -0.1 - 25 - 66 -0.1 15.1649 1.8004 - -0.1 -0.1 -0.1 - 34.5023 - - 4.097947 - - - -0.1 -0.1 -0.1 -0.1 -0.1 -0.1 -0.1 31.0263 - - -0.1 1 0 U U - - - U U U U U U U - U - U U U U - - - - - - U U U - - - - - - U U - - U U - - - U - - U - - U U U U U - U U1000 UDWRi 83 12/20/1995 - - 671* - - - - - - - - - - - - - - - - - - - - - - - - - - - - - - - - - - - - - - - - - - - - - - - - - - - - - - - - - - - - - - - - - - - - - - - - - - - - - - - - - - - - - - - - - - - - - - - - - - - - - - - - - - -1001 DWQ CREEK 3/13/1978 - 0.7 602 - - - - - - - - - - - - - - - - - - - - - - - - - - - - - - - - - - - - - - - - - - - - - - - - - - - - - - - - - - - - - - - - - - - - - - - - - - - - - - - - - - - - - - - - - - - - - - - - - - - - - - - - - - -1002 UGS SPRING 2/28/2003 - - 690* - 1000 - - - - - - - - - - - - - - - - - - - - - - - - - - - - - - - - - - - - - - - - - - - - - - - - - - - - - - - - - - - - - - - - - - - - - - - - - - - - - - - - - - - - - - - - - - - - - - - - - - - - - - - - -1003 UGS CREEK 2/28/2003 - - 483* - 700 - - - - - - - - - - - - - - - - - - - - - - - - - - - - - - - - - - - - - - - - - - - - - - - - - - - - - - - - - - - - - - - - - - - - - - - - - - - - - - - - - - - - - - - - - - - - - - - - - - - - - - - - -1004 UGS 93 2/28/2003 - - 1415* - 2050 - - - - - - - - - - - - - - - - - - - - - - - - - - - - - - - - - - - - - - - - - - - - - - - - - - - - - - - - - - - - - - - - - - - - - - - - - - - - - - - - - - - - - - - - - - - - - - - - - - - - - - - - -1005 UGS CREEK 2/28/2003 - - 466* - 675 - - - - - - - - - - - - - - - - - - - - - - - - - - - - - - - - - - - - - - - - - - - - - - - - - - - - - - - - - - - - - - - - - - - - - - - - - - - - - - - - - - - - - - - - - - - - - - - - - - - - - - - - -1006 UGS CREEK 2/28/2003 - - 449* - 650 - - - - - - - - - - - - - - - - - - - - - - - - - - - - - - - - - - - - - - - - - - - - - - - - - - - - - - - - - - - - - - - - - - - - - - - - - - - - - - - - - - - - - - - - - - - - - - - - - - - - - - - - -2001 CCV 116 Jul-03 - - 484 - - - - - - - - - - - - - - - - - - - - - - - - - - - - - - - - - - - - - - - - - - - - - - - - - - - - - - - - - - - - - - - - - - - - - - - - - - - - - - - - - - - - - - - - - - - - - - - - - - - - - - - - - - - -2002 CCV unknown Jul-03 - - 674 - - - - - - - - - - - - - - - - - - - - - - - - - - - - - - - - - - - - - - - - - - - - - - - - - - - - - - - - - - - - - - - - - - - - - - - - - - - - - - - - - - - - - - - - - - - - - - - - - - - - - - - - - - -2003 CCV SPRING Jul-03 - - 826 - - - - - - - - - - - - - - - - - - - - - - - - - - - - - - - - - - - - - - - - - - - - - - - - - - - - - - - - - - - - - - - - - - - - - - - - - - - - - - - - - - - - - - - - - - - - - - - - - - - - - - - - - - -2004 CCV SPRING Jul-03 - - 188 - - - - - - - - - - - - - - - - - - - - - - - - - - - - - - - - - - - - - - - - - - - - - - - - - - - - - - - - - - - - - - - - - - - - - - - - - - - - - - - - - - - - - - - - - - - - - - - - - - - - - - - - - - -2005 CCV 300 Jul-03 - - 286 - - - - - - - - - - - - - - - - - - - - - - - - - - - - - - - - - - - - - - - - - - - - - - - - - - - - - - - - - - - - - - - - - - - - - - - - - - - - - - - - - - - - - - - - - - - - - - - - - - - - - - - - - - -2006 CCV unknown Jul-03 - - 1944 - - - - - - - - - - - - - - - - - - - - - - - - - - - - - - - - - - - - - - - - - - - - - - - - - - - - - - - - - - - - - - - - - - - - - - - - - - - - - - - - - - - - - - - - - - - - - - - - - - - - - - - - - - -2007 CCV SPRING Jul-03 - - 1364 - - - - - - - - - - - - - - - - - - - - - - - - - - - - - - - - - - - - - - - - - - - - - - - - - - - - - - - - - - - - - - - - - - - - - - - - - - - - - - - - - - - - - - - - - - - - - - - - - - - - - - - - - - -2008 CCV SPRING Jul-03 - - 188 - - - - - - - - - - - - - - - - - - - - - - - - - - - - - - - - - - - - - - - - - - - - - - - - - - - - - - - - - - - - - - - - - - - - - - - - - - - - - - - - - - - - - - - - - - - - - - - - - - - - - - - - - - -2009 CCV 150 Jul-03 - - 660 - - - - - - - - - - - - - - - - - - - - - - - - - - - - - - - - - - - - - - - - - - - - - - - - - - - - - - - - - - - - - - - - - - - - - - - - - - - - - - - - - - - - - - - - - - - - - - - - - - - - - - - - - - -2010 CCV 150 Jul-03 - - 438 - - - - - - - - - - - - - - - - - - - - - - - - - - - - - - - - - - - - - - - - - - - - - - - - - - - - - - - - - - - - - - - - - - - - - - - - - - - - - - - - - - - - - - - - - - - - - - - - - - - - - - - - - - -2011 CCV CREEK Jul-03 - - 576 - - - - - - - - - - - - - - - - - - - - - - - - - - - - - - - - - - - - - - - - - - - - - - - - - - - - - - - - - - - - - - - - - - - - - - - - - - - - - - - - - - - - - - - - - - - - - - - - - - - - - - - - - - -2012 CCV SPRING Jul-03 - - 284 - - - - - - - - - - - - - - - - - - - - - - - - - - - - - - - - - - - - - - - - - - - - - - - - - - - - - - - - - - - - - - - - - - - - - - - - - - - - - - - - - - - - - - - - - - - - - - - - - - - - - - - - - - -2013 CCV SPRING Jul-03 - - 382 - - - - - - - - - - - - - - - - - - - - - - - - - - - - - - - - - - - - - - - - - - - - - - - - - - - - - - - - - - - - - - - - - - - - - - - - - - - - - - - - - - - - - - - - - - - - - - - - - - - - - - - - - - -2014 CCV 125 Jul-03 - - 386 - - - - - - - - - - - - - - - - - - - - - - - - - - - - - - - - - - - - - - - - - - - - - - - - - - - - - - - - - - - - - - - - - - - - - - - - - - - - - - - - - - - - - - - - - - - - - - - - - - - - - - - - - - -2015 CCV 236 Jul-03 - - 392 - - - - - - - - - - - - - - - - - - - - - - - - - - - - - - - - - - - - - - - - - - - - - - - - - - - - - - - - - - - - - - - - - - - - - - - - - - - - - - - - - - - - - - - - - - - - - - - - - - - - - - - - - - -2016 CCV SPRING Jul-03 - - 308 - - - - - - - - - - - - - - - - - - - - - - - - - - - - - - - - - - - - - - - - - - - - - - - - - - - - - - - - - - - - - - - - - - - - - - - - - - - - - - - - - - - - - - - - - - - - - - - - - - - - - - - - - - -2017 CCV SPRING Jul-03 - - 284 - - - - - - - - - - - - - - - - - - - - - - - - - - - - - - - - - - - - - - - - - - - - - - - - - - - - - - - - - - - - - - - - - - - - - - - - - - - - - - - - - - - - - - - - - - - - - - - - - - - - - - - - - - -
1indicates TDS value converted from specific conductance2UGS=Utah Geological SurveyUDAF=Utah Department of Agriculture and FoodUDWRi=Utah Division of Water RightsDWQ=Utah Division of Water QualityCCV=Citizens of Castle Valley
-0.1 A "-" indicates no dataAll wells except UDAF wells were analyzed by Utah State Health Lab
file:///C|/Documents%20and%20Settings/jstringf/Desktop/Page.htm6/24/2004 5:21:02 AM
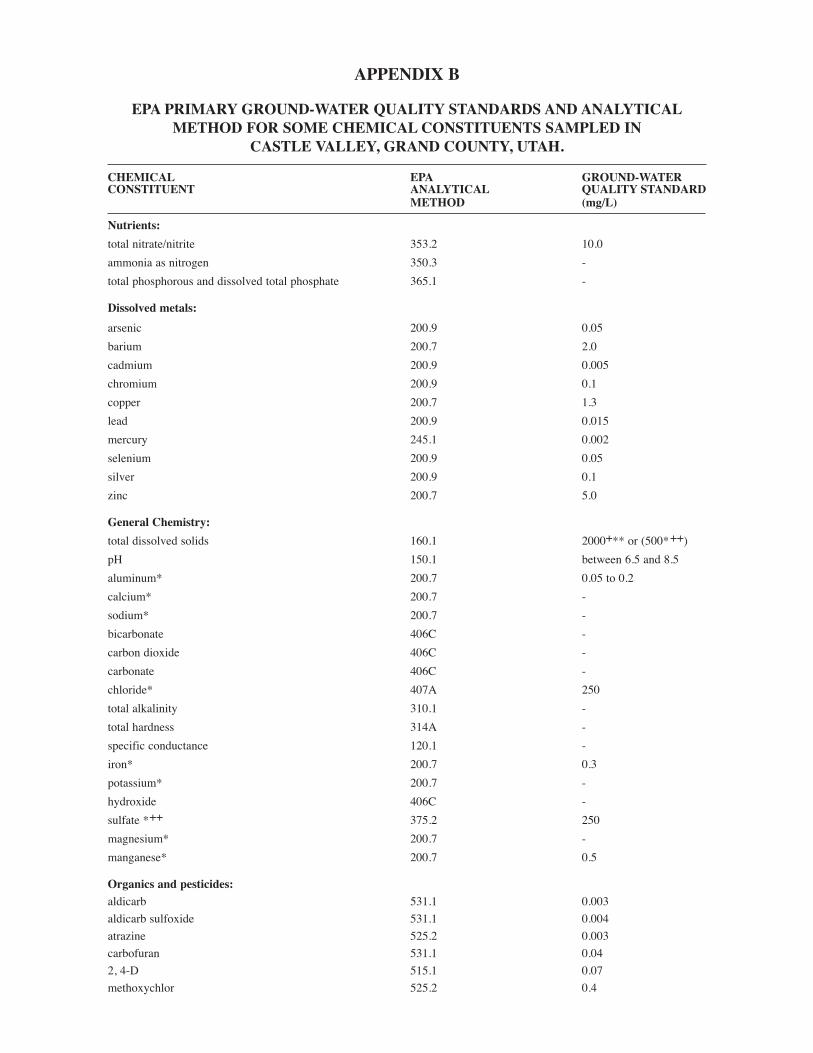
APPENDIX B
EPA PRIMARY GROUND-WATER QUALITY STANDARDS AND ANALYTICALMETHOD FOR SOME CHEMICAL CONSTITUENTS SAMPLED IN
CASTLE VALLEY, GRAND COUNTY, UTAH.
CHEMICAL EPA GROUND-WATERCONSTITUENT ANALYTICAL QUALITY STANDARD
METHOD (mg/L)
Nutrients:
total nitrate/nitrite 353.2 10.0
ammonia as nitrogen 350.3 -
total phosphorous and dissolved total phosphate 365.1 -
Dissolved metals:
arsenic 200.9 0.05
barium 200.7 2.0
cadmium 200.9 0.005
chromium 200.9 0.1
copper 200.7 1.3
lead 200.9 0.015
mercury 245.1 0.002
selenium 200.9 0.05
silver 200.9 0.1
zinc 200.7 5.0
General Chemistry:
total dissolved solids 160.1 2000+** or (500*++)
pH 150.1 between 6.5 and 8.5
aluminum* 200.7 0.05 to 0.2
calcium* 200.7 -
sodium* 200.7 -
bicarbonate 406C -
carbon dioxide 406C -
carbonate 406C -
chloride* 407A 250
total alkalinity 310.1 -
total hardness 314A -
specific conductance 120.1 -
iron* 200.7 0.3
potassium* 200.7 -
hydroxide 406C -
sulfate *++ 375.2 250
magnesium* 200.7 -
manganese* 200.7 0.5
Organics and pesticides:
aldicarb 531.1 0.003
aldicarb sulfoxide 531.1 0.004
atrazine 525.2 0.003
carbofuran 531.1 0.04
2, 4-D 515.1 0.07
methoxychlor 525.2 0.4
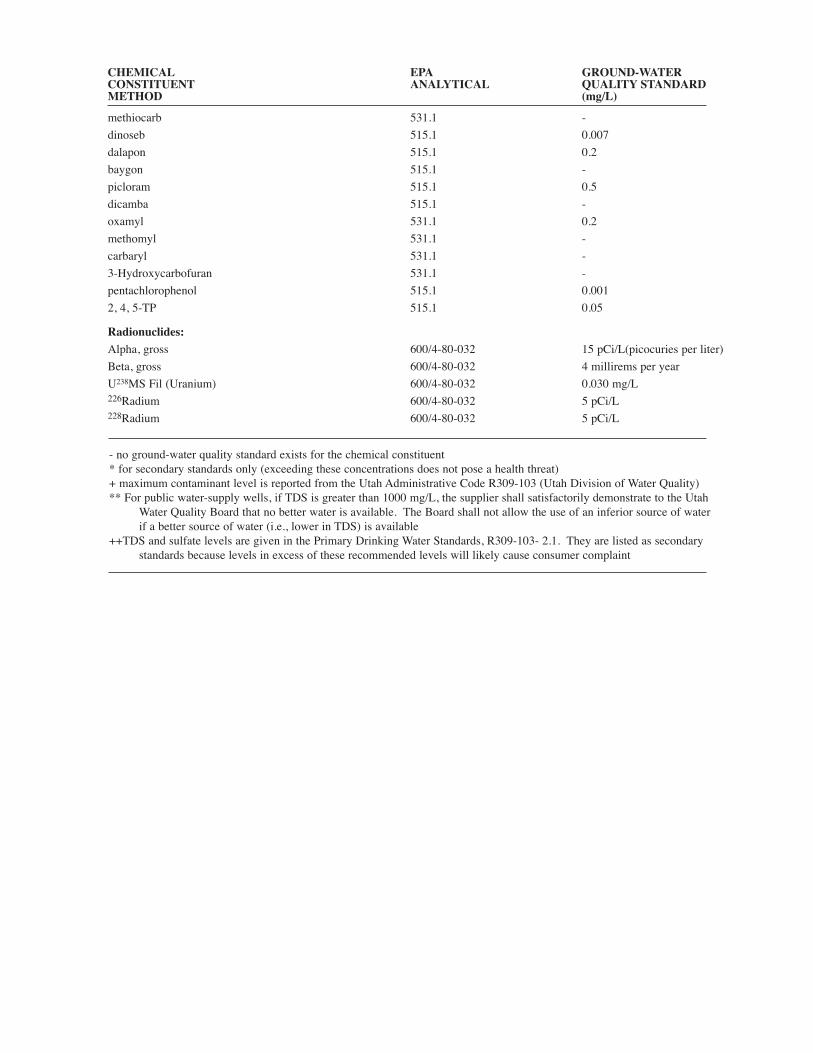
CHEMICAL EPA GROUND-WATERCONSTITUENT ANALYTICAL QUALITY STANDARDMETHOD (mg/L)
methiocarb 531.1 -
dinoseb 515.1 0.007
dalapon 515.1 0.2
baygon 515.1 -
picloram 515.1 0.5
dicamba 515.1 -
oxamyl 531.1 0.2
methomyl 531.1 -
carbaryl 531.1 -
3-Hydroxycarbofuran 531.1 -
pentachlorophenol 515.1 0.001
2, 4, 5-TP 515.1 0.05
Radionuclides:
Alpha, gross 600/4-80-032 15 pCi/L(picocuries per liter)
Beta, gross 600/4-80-032 4 millirems per year
U238MS Fil (Uranium) 600/4-80-032 0.030 mg/L226Radium 600/4-80-032 5 pCi/L228Radium 600/4-80-032 5 pCi/L
- no ground-water quality standard exists for the chemical constituent* for secondary standards only (exceeding these concentrations does not pose a health threat)+ maximum contaminant level is reported from the Utah Administrative Code R309-103 (Utah Division of Water Quality)** For public water-supply wells, if TDS is greater than 1000 mg/L, the supplier shall satisfactorily demonstrate to the Utah
Water Quality Board that no better water is available. The Board shall not allow the use of an inferior source of waterif a better source of water (i.e., lower in TDS) is available
++TDS and sulfate levels are given in the Primary Drinking Water Standards, R309-103- 2.1. They are listed as secondarystandards because levels in excess of these recommended levels will likely cause consumer complaint
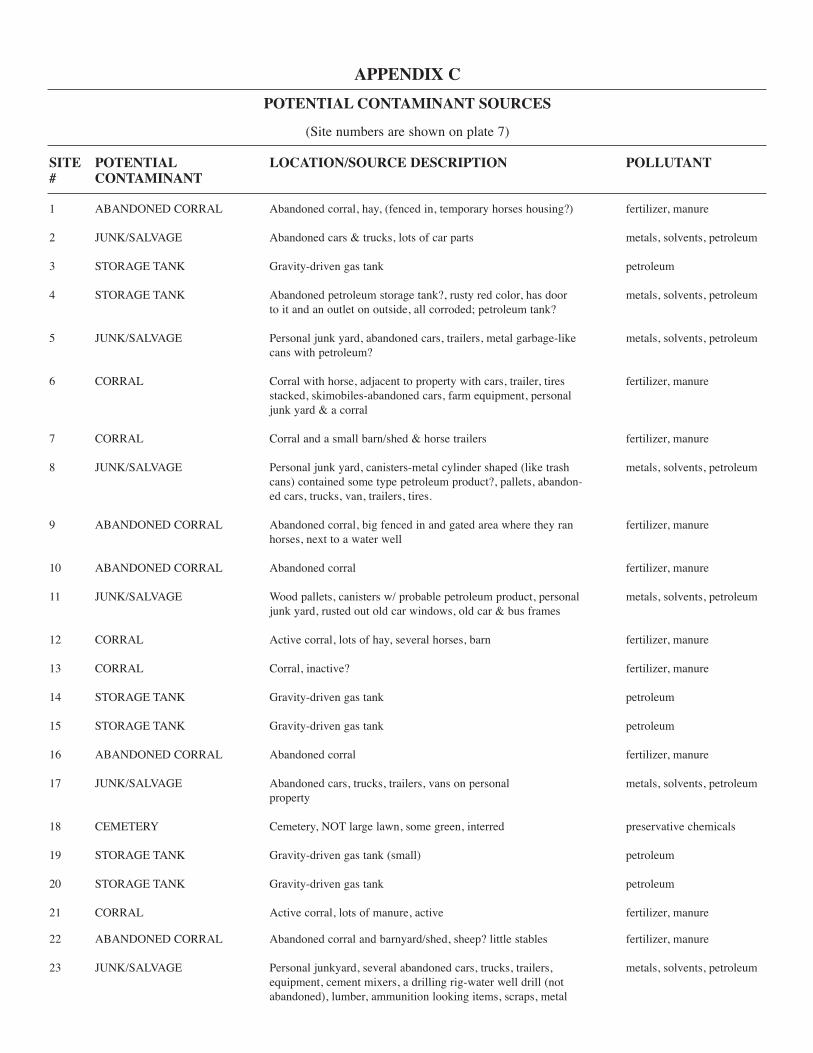
APPENDIX C
POTENTIAL CONTAMINANT SOURCES
(Site numbers are shown on plate 7)
SITE POTENTIAL LOCATION/SOURCE DESCRIPTION POLLUTANT# CONTAMINANT
1 ABANDONED CORRAL Abandoned corral, hay, (fenced in, temporary horses housing?) fertilizer, manure
2 JUNK/SALVAGE Abandoned cars & trucks, lots of car parts metals, solvents, petroleum
3 STORAGE TANK Gravity-driven gas tank petroleum
4 STORAGE TANK Abandoned petroleum storage tank?, rusty red color, has door metals, solvents, petroleumto it and an outlet on outside, all corroded; petroleum tank?
5 JUNK/SALVAGE Personal junk yard, abandoned cars, trailers, metal garbage-like metals, solvents, petroleumcans with petroleum?
6 CORRAL Corral with horse, adjacent to property with cars, trailer, tires fertilizer, manurestacked, skimobiles-abandoned cars, farm equipment, personaljunk yard & a corral
7 CORRAL Corral and a small barn/shed & horse trailers fertilizer, manure
8 JUNK/SALVAGE Personal junk yard, canisters-metal cylinder shaped (like trash metals, solvents, petroleumcans) contained some type petroleum product?, pallets, abandon-ed cars, trucks, van, trailers, tires.
9 ABANDONED CORRAL Abandoned corral, big fenced in and gated area where they ran fertilizer, manurehorses, next to a water well
10 ABANDONED CORRAL Abandoned corral fertilizer, manure
11 JUNK/SALVAGE Wood pallets, canisters w/ probable petroleum product, personal metals, solvents, petroleumjunk yard, rusted out old car windows, old car & bus frames
12 CORRAL Active corral, lots of hay, several horses, barn fertilizer, manure
13 CORRAL Corral, inactive? fertilizer, manure
14 STORAGE TANK Gravity-driven gas tank petroleum
15 STORAGE TANK Gravity-driven gas tank petroleum
16 ABANDONED CORRAL Abandoned corral fertilizer, manure
17 JUNK/SALVAGE Abandoned cars, trucks, trailers, vans on personal metals, solvents, petroleumproperty
18 CEMETERY Cemetery, NOT large lawn, some green, interred preservative chemicals
19 STORAGE TANK Gravity-driven gas tank (small) petroleum
20 STORAGE TANK Gravity-driven gas tank petroleum
21 CORRAL Active corral, lots of manure, active fertilizer, manure
22 ABANDONED CORRAL Abandoned corral and barnyard/shed, sheep? little stables fertilizer, manure
23 JUNK/SALVAGE Personal junkyard, several abandoned cars, trucks, trailers, metals, solvents, petroleumequipment, cement mixers, a drilling rig-water well drill (notabandoned), lumber, ammunition looking items, scraps, metal
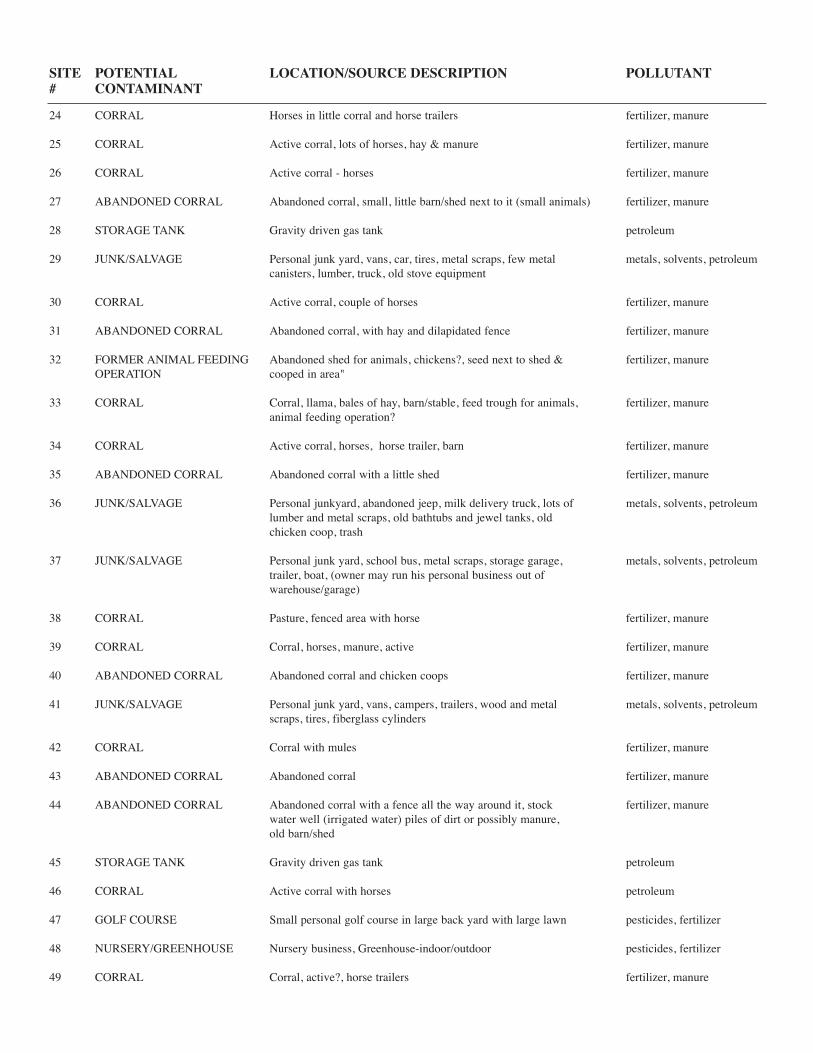
SITE POTENTIAL LOCATION/SOURCE DESCRIPTION POLLUTANT# CONTAMINANT
24 CORRAL Horses in little corral and horse trailers fertilizer, manure
25 CORRAL Active corral, lots of horses, hay & manure fertilizer, manure
26 CORRAL Active corral - horses fertilizer, manure
27 ABANDONED CORRAL Abandoned corral, small, little barn/shed next to it (small animals) fertilizer, manure
28 STORAGE TANK Gravity driven gas tank petroleum
29 JUNK/SALVAGE Personal junk yard, vans, car, tires, metal scraps, few metal metals, solvents, petroleumcanisters, lumber, truck, old stove equipment
30 CORRAL Active corral, couple of horses fertilizer, manure
31 ABANDONED CORRAL Abandoned corral, with hay and dilapidated fence fertilizer, manure
32 FORMER ANIMAL FEEDING Abandoned shed for animals, chickens?, seed next to shed & fertilizer, manureOPERATION cooped in area"
33 CORRAL Corral, llama, bales of hay, barn/stable, feed trough for animals, fertilizer, manureanimal feeding operation?
34 CORRAL Active corral, horses, horse trailer, barn fertilizer, manure
35 ABANDONED CORRAL Abandoned corral with a little shed fertilizer, manure
36 JUNK/SALVAGE Personal junkyard, abandoned jeep, milk delivery truck, lots of metals, solvents, petroleumlumber and metal scraps, old bathtubs and jewel tanks, oldchicken coop, trash
37 JUNK/SALVAGE Personal junk yard, school bus, metal scraps, storage garage, metals, solvents, petroleumtrailer, boat, (owner may run his personal business out of warehouse/garage)
38 CORRAL Pasture, fenced area with horse fertilizer, manure
39 CORRAL Corral, horses, manure, active fertilizer, manure
40 ABANDONED CORRAL Abandoned corral and chicken coops fertilizer, manure
41 JUNK/SALVAGE Personal junk yard, vans, campers, trailers, wood and metal metals, solvents, petroleumscraps, tires, fiberglass cylinders
42 CORRAL Corral with mules fertilizer, manure
43 ABANDONED CORRAL Abandoned corral fertilizer, manure
44 ABANDONED CORRAL Abandoned corral with a fence all the way around it, stock fertilizer, manurewater well (irrigated water) piles of dirt or possibly manure,old barn/shed
45 STORAGE TANK Gravity driven gas tank petroleum
46 CORRAL Active corral with horses petroleum
47 GOLF COURSE Small personal golf course in large back yard with large lawn pesticides, fertilizer
48 NURSERY/GREENHOUSE Nursery business, Greenhouse-indoor/outdoor pesticides, fertilizer
49 CORRAL Corral, active?, horse trailers fertilizer, manure
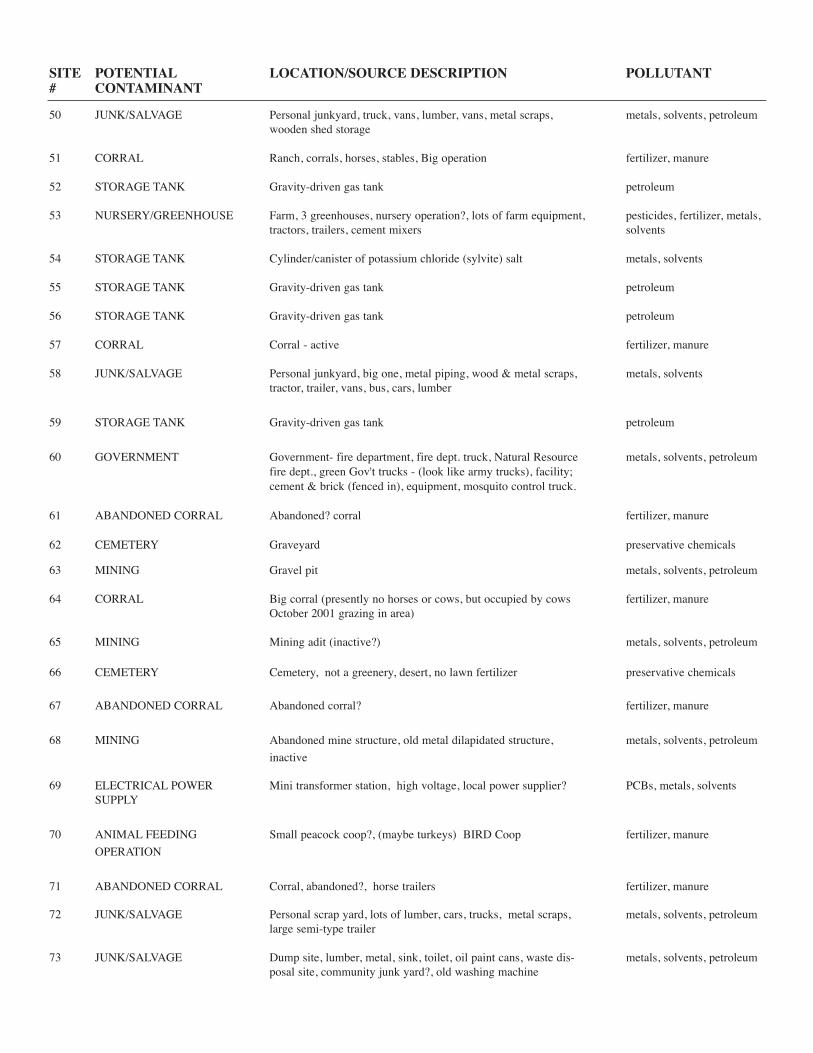
SITE POTENTIAL LOCATION/SOURCE DESCRIPTION POLLUTANT# CONTAMINANT
50 JUNK/SALVAGE Personal junkyard, truck, vans, lumber, vans, metal scraps, metals, solvents, petroleumwooden shed storage
51 CORRAL Ranch, corrals, horses, stables, Big operation fertilizer, manure
52 STORAGE TANK Gravity-driven gas tank petroleum
53 NURSERY/GREENHOUSE Farm, 3 greenhouses, nursery operation?, lots of farm equipment, pesticides, fertilizer, metals,tractors, trailers, cement mixers solvents
54 STORAGE TANK Cylinder/canister of potassium chloride (sylvite) salt metals, solvents
55 STORAGE TANK Gravity-driven gas tank petroleum
56 STORAGE TANK Gravity-driven gas tank petroleum
57 CORRAL Corral - active fertilizer, manure
58 JUNK/SALVAGE Personal junkyard, big one, metal piping, wood & metal scraps, metals, solventstractor, trailer, vans, bus, cars, lumber
59 STORAGE TANK Gravity-driven gas tank petroleum
60 GOVERNMENT Government- fire department, fire dept. truck, Natural Resource metals, solvents, petroleumfire dept., green Gov't trucks - (look like army trucks), facility;cement & brick (fenced in), equipment, mosquito control truck.
61 ABANDONED CORRAL Abandoned? corral fertilizer, manure
62 CEMETERY Graveyard preservative chemicals
63 MINING Gravel pit metals, solvents, petroleum
64 CORRAL Big corral (presently no horses or cows, but occupied by cows fertilizer, manureOctober 2001 grazing in area)
65 MINING Mining adit (inactive?) metals, solvents, petroleum
66 CEMETERY Cemetery, not a greenery, desert, no lawn fertilizer preservative chemicals
67 ABANDONED CORRAL Abandoned corral? fertilizer, manure
68 MINING Abandoned mine structure, old metal dilapidated structure, metals, solvents, petroleum
inactive
69 ELECTRICAL POWER Mini transformer station, high voltage, local power supplier? PCBs, metals, solventsSUPPLY
70 ANIMAL FEEDING Small peacock coop?, (maybe turkeys) BIRD Coop fertilizer, manure
OPERATION
71 ABANDONED CORRAL Corral, abandoned?, horse trailers fertilizer, manure
72 JUNK/SALVAGE Personal scrap yard, lots of lumber, cars, trucks, metal scraps, metals, solvents, petroleumlarge semi-type trailer
73 JUNK/SALVAGE Dump site, lumber, metal, sink, toilet, oil paint cans, waste dis- metals, solvents, petroleumposal site, community junk yard?, old washing machine
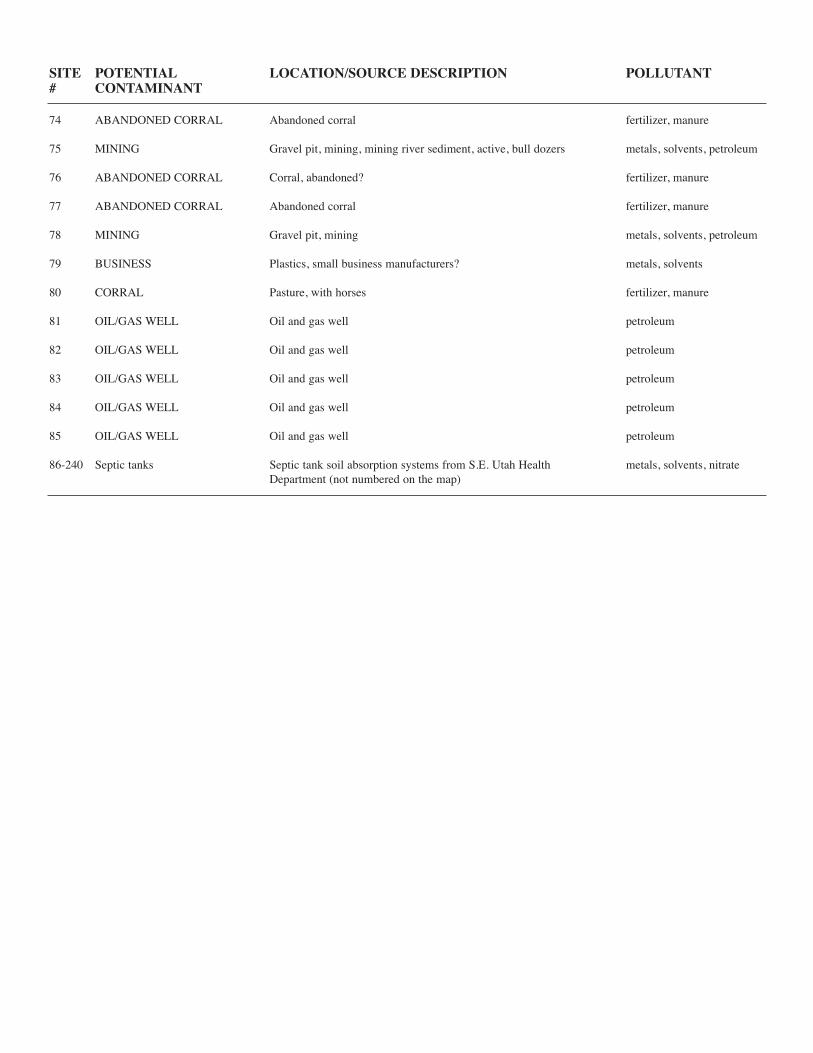
SITE POTENTIAL LOCATION/SOURCE DESCRIPTION POLLUTANT# CONTAMINANT
74 ABANDONED CORRAL Abandoned corral fertilizer, manure
75 MINING Gravel pit, mining, mining river sediment, active, bull dozers metals, solvents, petroleum
76 ABANDONED CORRAL Corral, abandoned? fertilizer, manure
77 ABANDONED CORRAL Abandoned corral fertilizer, manure
78 MINING Gravel pit, mining metals, solvents, petroleum
79 BUSINESS Plastics, small business manufacturers? metals, solvents
80 CORRAL Pasture, with horses fertilizer, manure
81 OIL/GAS WELL Oil and gas well petroleum
82 OIL/GAS WELL Oil and gas well petroleum
83 OIL/GAS WELL Oil and gas well petroleum
84 OIL/GAS WELL Oil and gas well petroleum
85 OIL/GAS WELL Oil and gas well petroleum
86-240 Septic tanks Septic tank soil absorption systems from S.E. Utah Health metals, solvents, nitrateDepartment (not numbered on the map)
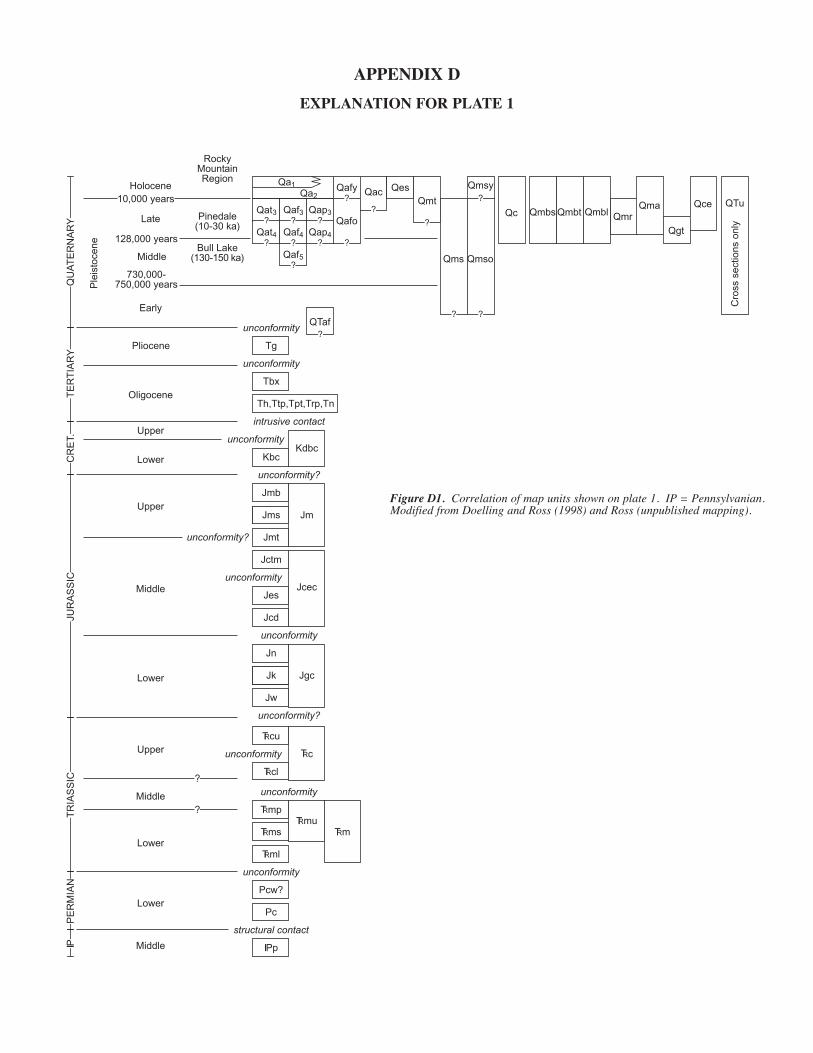
APPENDIX D
EXPLANATION FOR PLATE 1
Holocene10,000 years
Ple
isto
cene
128,000 years
Late
Middle
730,000-750,000 years
Early
RockyMountainRegion
Pinedale(10-30 ka)
Bull Lake(130-150 ka) Qmso
Qmbs Qmbt QmrQma
Qms
Qat3Qafo
Qac Qes
Qaf3 Qap3
Qat4 Qaf4 Qap4
Qa1Qa2
Qafy
?
?
Qmt
Pliocene Tg
Tbx
Th,Ttp,Tpt,Trp,Tn
KbcKdbc
intrusive contact
unconformity
unconformity
unconformity
unconformity?
unconformity?
Jmb
Jms
Jmt
Jm
Jctm
Jes
Jcd
Jcecunconformity
JgcJk
Jn
Jw
unconformity
unconformity?
TRc
TRcu
TRcl
TRmp
TRmsTRmu
TRml
Pcw?
Pc
IPp
unconformity
structural contact
unconformity
unconformity
QU
AT
ER
NA
RY
TE
RT
IAR
YC
RE
T.JU
RA
SS
ICT
RIA
SS
ICP
ER
MIA
NIP
Upper
Lower
Upper
Middle
Lower
Upper
Middle
Lower
?
?
Lower
Middle
Qc
Qgt
Qce
QTaf
?
?
?
?
?
?
?
?
?
?
?
Qmbl
Oligocene
Qaf5?
TRm
?
QTu
Cro
ss s
ectio
ns o
nly
Qmsy
Figure D1. Correlation of map units shown on plate 1. IP = Pennsylvanian.Modified from Doelling and Ross (1998) and Ross (unpublished mapping).
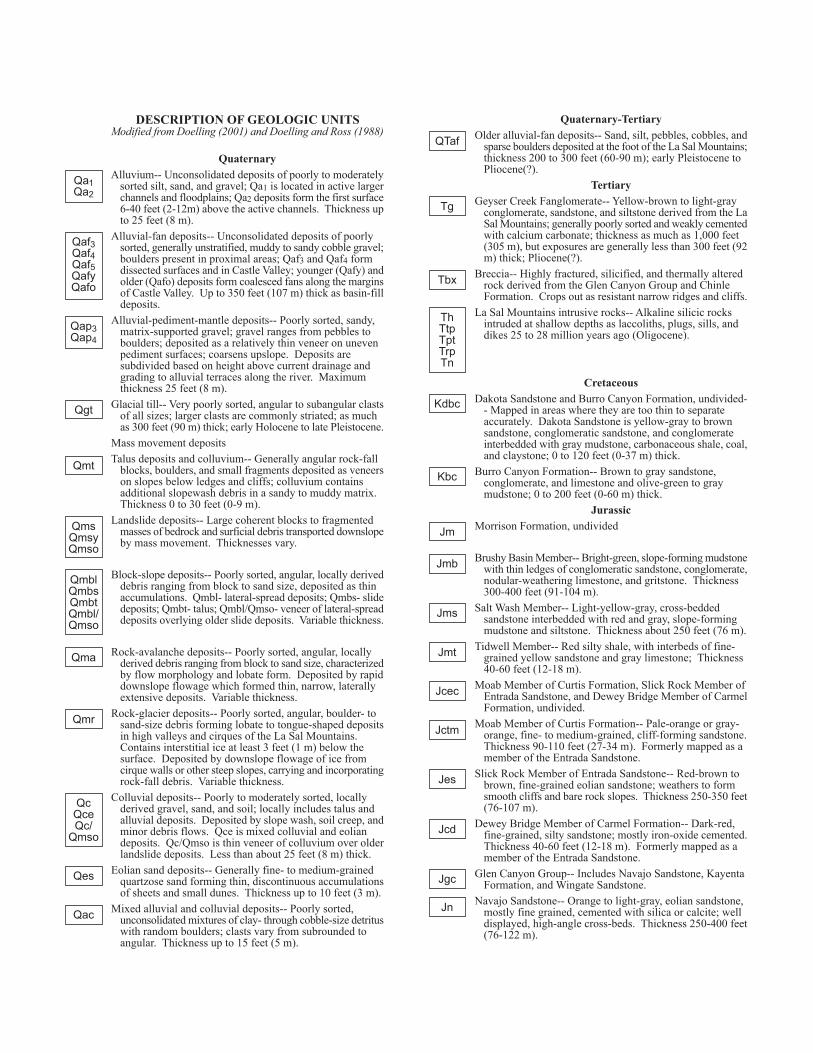
DESCRIPTION OF GEOLOGIC UNITSModified from Doelling (2001) and Doelling and Ross (1988)
QuaternaryAlluvium-- Unconsolidated deposits of poorly to moderately
sorted silt, sand, and gravel; Qa1 is located in active largerchannels and floodplains; Qa2 deposits form the first surface6-40 feet (2-12m) above the active channels. Thickness upto 25 feet (8 m).
Alluvial-fan deposits-- Unconsolidated deposits of poorlysorted, generally unstratified, muddy to sandy cobble gravel;boulders present in proximal areas; Qaf3 and Qaf4 formdissected surfaces and in Castle Valley; younger (Qafy) andolder (Qafo) deposits form coalesced fans along the marginsof Castle Valley. Up to 350 feet (107 m) thick as basin-filldeposits.
Alluvial-pediment-mantle deposits-- Poorly sorted, sandy,matrix-supported gravel; gravel ranges from pebbles toboulders; deposited as a relatively thin veneer on unevenpediment surfaces; coarsens upslope. Deposits aresubdivided based on height above current drainage andgrading to alluvial terraces along the river. Maximumthickness 25 feet (8 m).
Glacial till-- Very poorly sorted, angular to subangular clastsof all sizes; larger clasts are commonly striated; as muchas 300 feet (90 m) thick; early Holocene to late Pleistocene.
Mass movement depositsTalus deposits and colluvium-- Generally angular rock-fall
blocks, boulders, and small fragments deposited as veneerson slopes below ledges and cliffs; colluvium containsadditional slopewash debris in a sandy to muddy matrix.Thickness 0 to 30 feet (0-9 m).
Landslide deposits-- Large coherent blocks to fragmentedmasses of bedrock and surficial debris transported downslopeby mass movement. Thicknesses vary.
Block-slope deposits-- Poorly sorted, angular, locally deriveddebris ranging from block to sand size, deposited as thinaccumulations. Qmbl- lateral-spread deposits; Qmbs- slidedeposits; Qmbt- talus; Qmbl/Qmso- veneer of lateral-spreaddeposits overlying older slide deposits. Variable thickness.
Rock-avalanche deposits-- Poorly sorted, angular, locallyderived debris ranging from block to sand size, characterizedby flow morphology and lobate form. Deposited by rapiddownslope flowage which formed thin, narrow, laterallyextensive deposits. Variable thickness.
Rock-glacier deposits-- Poorly sorted, angular, boulder- tosand-size debris forming lobate to tongue-shaped depositsin high valleys and cirques of the La Sal Mountains.Contains interstitial ice at least 3 feet (1 m) below thesurface. Deposited by downslope flowage of ice fromcirque walls or other steep slopes, carrying and incorporatingrock-fall debris. Variable thickness.
Colluvial deposits-- Poorly to moderately sorted, locallyderived gravel, sand, and soil; locally includes talus andalluvial deposits. Deposited by slope wash, soil creep, andminor debris flows. Qce is mixed colluvial and eoliandeposits. Qc/Qmso is thin veneer of colluvium over olderlandslide deposits. Less than about 25 feet (8 m) thick.
Eolian sand deposits-- Generally fine- to medium-grainedquartzose sand forming thin, discontinuous accumulationsof sheets and small dunes. Thickness up to 10 feet (3 m).
Mixed alluvial and colluvial deposits-- Poorly sorted,unconsolidated mixtures of clay- through cobble-size detrituswith random boulders; clasts vary from subrounded toangular. Thickness up to 15 feet (5 m).
Quaternary-TertiaryOlder alluvial-fan deposits-- Sand, silt, pebbles, cobbles, and
sparse boulders deposited at the foot of the La Sal Mountains;thickness 200 to 300 feet (60-90 m); early Pleistocene toPliocene(?).
TertiaryGeyser Creek Fanglomerate-- Yellow-brown to light-gray
conglomerate, sandstone, and siltstone derived from the LaSal Mountains; generally poorly sorted and weakly cementedwith calcium carbonate; thickness as much as 1,000 feet(305 m), but exposures are generally less than 300 feet (92m) thick; Pliocene(?).
Breccia-- Highly fractured, silicified, and thermally alteredrock derived from the Glen Canyon Group and ChinleFormation. Crops out as resistant narrow ridges and cliffs.
La Sal Mountains intrusive rocks-- Alkaline silicic rocksintruded at shallow depths as laccoliths, plugs, sills, anddikes 25 to 28 million years ago (Oligocene).
CretaceousDakota Sandstone and Burro Canyon Formation, undivided-
- Mapped in areas where they are too thin to separateaccurately. Dakota Sandstone is yellow-gray to brownsandstone, conglomeratic sandstone, and conglomerateinterbedded with gray mudstone, carbonaceous shale, coal,and claystone; 0 to 120 feet (0-37 m) thick.
Burro Canyon Formation-- Brown to gray sandstone,conglomerate, and limestone and olive-green to graymudstone; 0 to 200 feet (0-60 m) thick.
JurassicMorrison Formation, undivided
Brushy Basin Member-- Bright-green, slope-forming mudstonewith thin ledges of conglomeratic sandstone, conglomerate,nodular-weathering limestone, and gritstone. Thickness300-400 feet (91-104 m).
Salt Wash Member-- Light-yellow-gray, cross-beddedsandstone interbedded with red and gray, slope-formingmudstone and siltstone. Thickness about 250 feet (76 m).
Tidwell Member-- Red silty shale, with interbeds of fine-grained yellow sandstone and gray limestone; Thickness40-60 feet (12-18 m).
Moab Member of Curtis Formation, Slick Rock Member ofEntrada Sandstone, and Dewey Bridge Member of CarmelFormation, undivided.
Moab Member of Curtis Formation-- Pale-orange or gray-orange, fine- to medium-grained, cliff-forming sandstone.Thickness 90-110 feet (27-34 m). Formerly mapped as amember of the Entrada Sandstone.
Slick Rock Member of Entrada Sandstone-- Red-brown tobrown, fine-grained eolian sandstone; weathers to formsmooth cliffs and bare rock slopes. Thickness 250-350 feet(76-107 m).
Dewey Bridge Member of Carmel Formation-- Dark-red,fine-grained, silty sandstone; mostly iron-oxide cemented.Thickness 40-60 feet (12-18 m). Formerly mapped as amember of the Entrada Sandstone.
Glen Canyon Group-- Includes Navajo Sandstone, KayentaFormation, and Wingate Sandstone.
Navajo Sandstone-- Orange to light-gray, eolian sandstone,mostly fine grained, cemented with silica or calcite; welldisplayed, high-angle cross-beds. Thickness 250-400 feet(76-122 m).
Qa1Qa2
Qaf3Qaf4Qaf5QafyQafo
Tbx
Tg
ThTtpTptTrpTn
Kbc
Kdbc
Jmb
Jms
Jmt
Jctm
Jcd
Jn
Jes
QTaf
Qap3Qap4
Qgt
Qmt
QmsQmsyQmso
QmblQmbsQmbtQmbl/Qmso
Qma
Qmr
QcQceQc/
Qmso
Qes
Qac
Jm
Jcec
Jgc
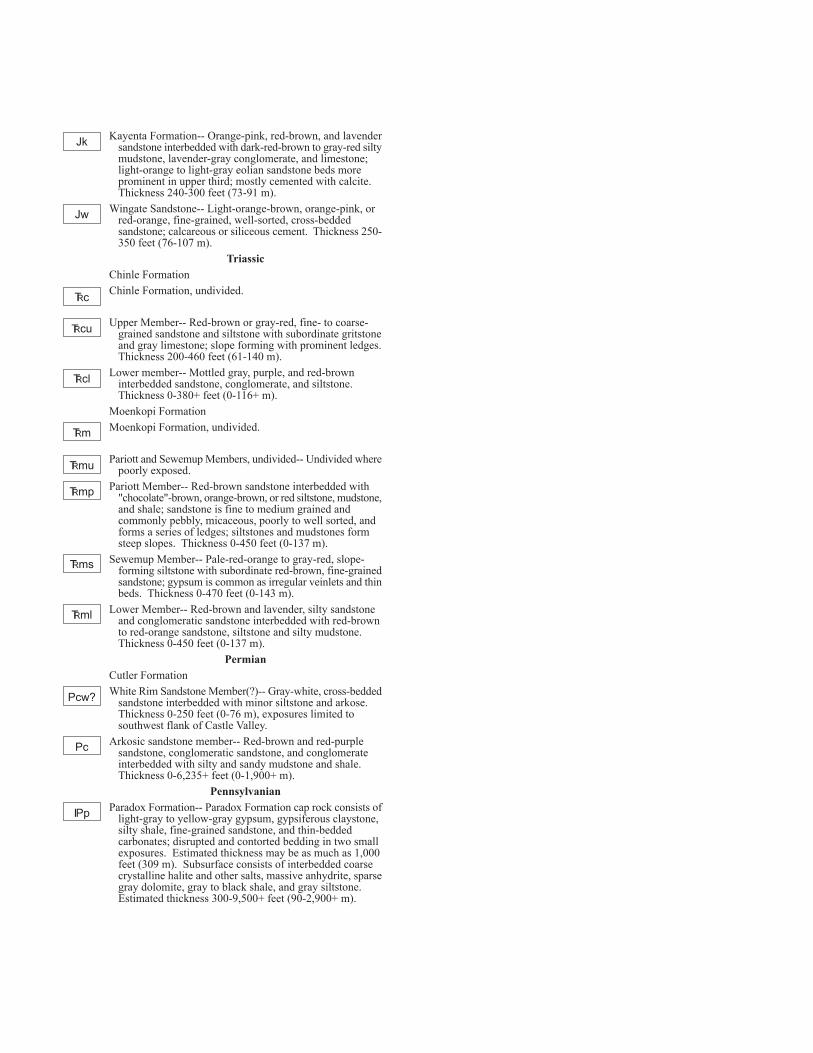
Kayenta Formation-- Orange-pink, red-brown, and lavendersandstone interbedded with dark-red-brown to gray-red siltymudstone, lavender-gray conglomerate, and limestone;light-orange to light-gray eolian sandstone beds moreprominent in upper third; mostly cemented with calcite.Thickness 240-300 feet (73-91 m).
Wingate Sandstone-- Light-orange-brown, orange-pink, orred-orange, fine-grained, well-sorted, cross-beddedsandstone; calcareous or siliceous cement. Thickness 250-350 feet (76-107 m).
TriassicChinle FormationChinle Formation, undivided.
Upper Member-- Red-brown or gray-red, fine- to coarse-grained sandstone and siltstone with subordinate gritstoneand gray limestone; slope forming with prominent ledges.Thickness 200-460 feet (61-140 m).
Lower member-- Mottled gray, purple, and red-browninterbedded sandstone, conglomerate, and siltstone.Thickness 0-380+ feet (0-116+ m).
Moenkopi FormationMoenkopi Formation, undivided.
Pariott and Sewemup Members, undivided-- Undivided wherepoorly exposed.
Pariott Member-- Red-brown sandstone interbedded with"chocolate"-brown, orange-brown, or red siltstone, mudstone,and shale; sandstone is fine to medium grained andcommonly pebbly, micaceous, poorly to well sorted, andforms a series of ledges; siltstones and mudstones formsteep slopes. Thickness 0-450 feet (0-137 m).
Sewemup Member-- Pale-red-orange to gray-red, slope-forming siltstone with subordinate red-brown, fine-grainedsandstone; gypsum is common as irregular veinlets and thinbeds. Thickness 0-470 feet (0-143 m).
Lower Member-- Red-brown and lavender, silty sandstoneand conglomeratic sandstone interbedded with red-brownto red-orange sandstone, siltstone and silty mudstone.Thickness 0-450 feet (0-137 m).
PermianCutler FormationWhite Rim Sandstone Member(?)-- Gray-white, cross-bedded
sandstone interbedded with minor siltstone and arkose.Thickness 0-250 feet (0-76 m), exposures limited tosouthwest flank of Castle Valley.
Arkosic sandstone member-- Red-brown and red-purplesandstone, conglomeratic sandstone, and conglomerateinterbedded with silty and sandy mudstone and shale.Thickness 0-6,235+ feet (0-1,900+ m).
PennsylvanianParadox Formation-- Paradox Formation cap rock consists of
light-gray to yellow-gray gypsum, gypsiferous claystone,silty shale, fine-grained sandstone, and thin-beddedcarbonates; disrupted and contorted bedding in two smallexposures. Estimated thickness may be as much as 1,000feet (309 m). Subsurface consists of interbedded coarsecrystalline halite and other salts, massive anhydrite, sparsegray dolomite, gray to black shale, and gray siltstone.Estimated thickness 300-9,500+ feet (90-2,900+ m).
TRcu
TRcl
TRmu
TRmp
TRms
TRm
Pc
IPp
Pcw?
TRml
Jw
TRc
Jk
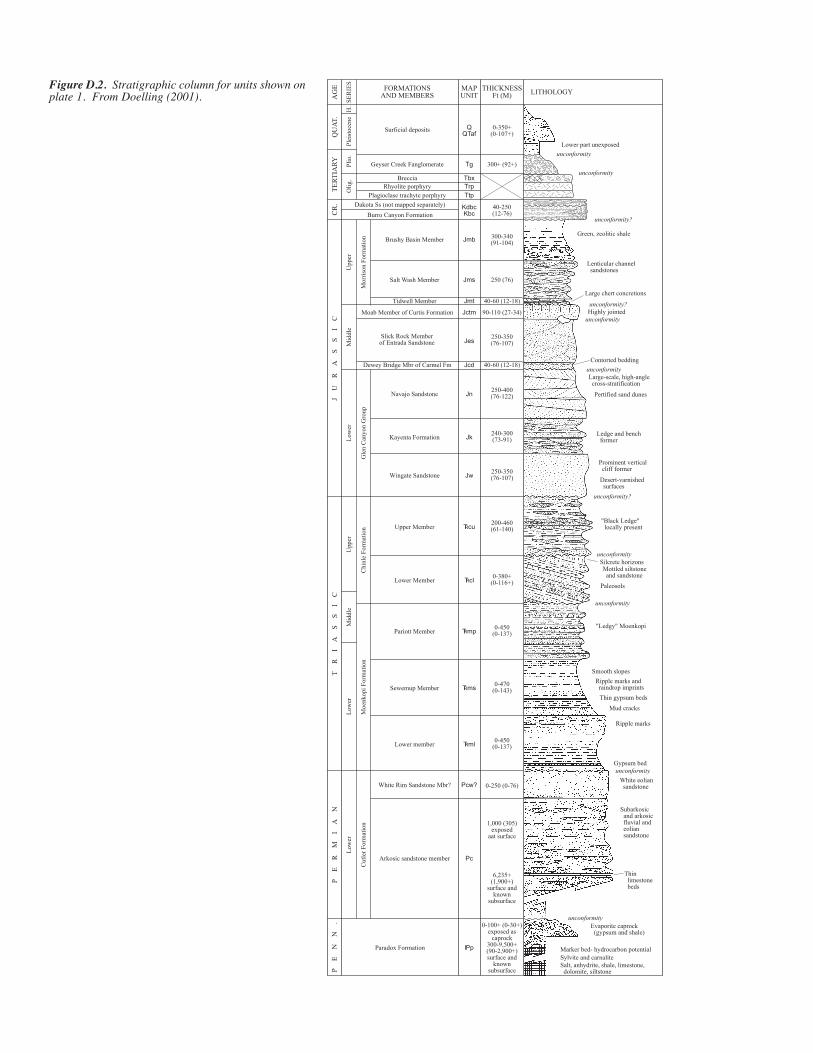
Moe
nkop
i For
mat
ion
CR
.T
ER
TIA
RY
JU
RA
SS
IC
TR
IA
SS
IC
PE
RM
IA
NP
EN
N.
FORMATIONSAND MEMBERS
SER
IES
AG
E THICKNESSFt (M) LITHOLOGYMAP
UNIT
QU
AT.
0-350+(0-107+)
300+ (92+)
Surficial deposits
Geyser Creek Fanglomerate
Breccia
Burro Canyon Formation
Brushy Basin Member
Salt Wash Member
Tidwell Member
Moab Member of Curtis Formation
Slick Rock Memberof Entrada Sandstone
300-340(91-104)
250 (76)
40-60 (12-18)
250-350(76-107)
Navajo Sandstone
Kayenta Formation
Wingate Sandstone
Lower member
White Rim Sandstone Mbr?
250-400(76-122)
240-300(73-91)
250-350(76-107)
0-450(0-137)
0-250 (0-76)
Arkosic sandstone member
1,000 (305)exposed
aat surface
Paradox Formation
0-100+ (0-30+)exposed as
caprock300-9,500+(90-2,900+)surface and
knownsubsurface
Cut
ler
Form
atio
n
Sewemup Member0-470
(0-143)
Pariott Member0-450
(0-137)
Lower Member0-380+
(0-116+)
Chi
nle
Form
atio
n Upper Member200-460(61-140)
Dewey Bridge Mbr of Carmel Fm 40-60 (12-18)G
len
Can
yon
Gro
up
90-110 (27-34)
Rhyolite porphyryPlagioclase trachyte porphyry
Mor
riso
n Fo
rmat
ion
Mid
dle
Upp
er
40-250(12-76)
Dakota Ss (not mapped separately)
6,235+(1,900+)
surface andknown
subsurface
Low
erM
iddl
eU
pper
Low
erL
ower
Plio
.O
lig.
Plei
stoc
ene
H.
Lower part unexposed
unconformity
unconformity?
Green, zeolitic shale
Lenticular channel sandstones
Large chert concretions
unconformity?Highly jointed
Contorted bedding
unconformityLarge-scale, high-angle cross-stratification
Pertified sand dunes
Ledge and bench former
Prominent vertical cliff former
Desert-varnished surfaces
unconformity?
"Black Ledge" locally present
unconformitySilcrete horizonsMottled siltstone and sandstone
Paleosols
unconformity
"Ledgy" Moenkopi
Smooth slopes
Ripple marks and raindrop imprints
Thin gypsum beds
Mud cracks
Ripple marks
Gypsum bedunconformity
White eolian sandstone
Subarkosic and arkosic fluvial and eolian sandstone
Thin limestone beds
unconformityEvaporite caprock (gypsum and shale)
Marker bed- hydrocarbon potentialSylvite and carnaliteSalt, anhydrite, shale, limestone, dolomite, siltstone
unconformity
unconformity
QQTaf
Tg
Tbx
KdbcKbc
Jmb
Jms
Jmt
Jn
Jes
Jk
Jw
TRml
Pc
IPp
Pcw?
TRms
TRmp
TRcl
TRcu
Jcd
Jctm
TrpTtp
Figure D.2. Stratigraphic column for units shown onplate 1. From Doelling (2001).
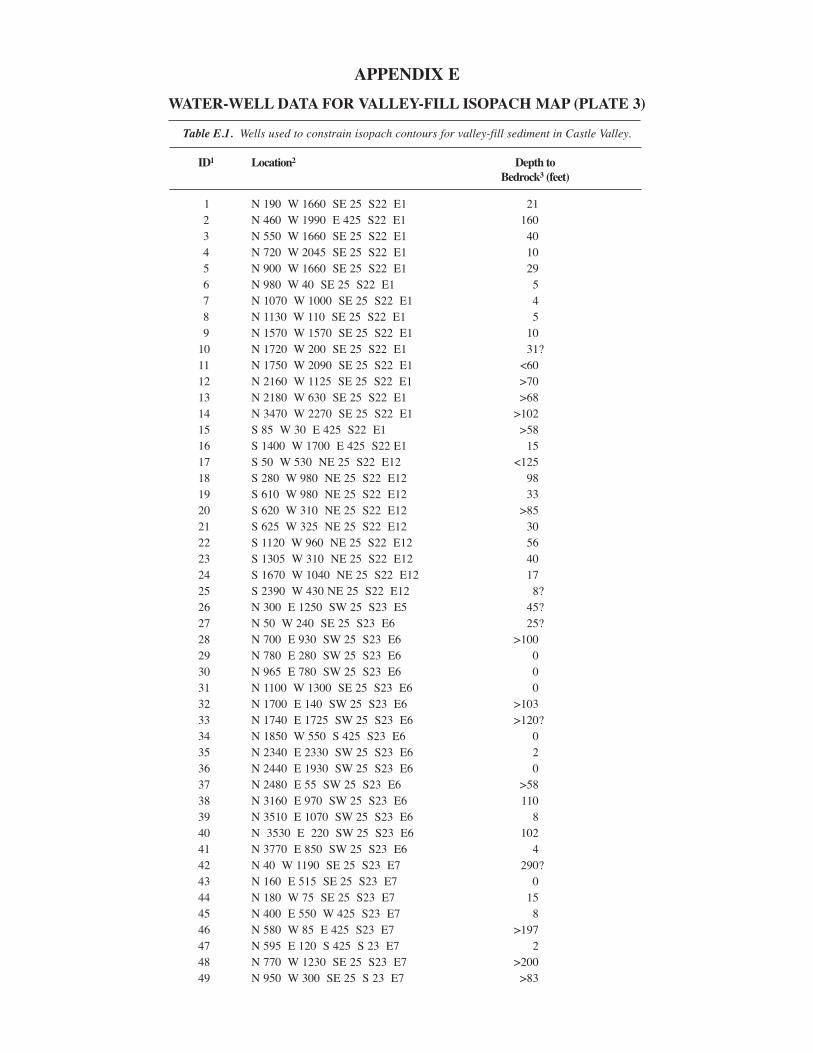
APPENDIX E
WATER-WELL DATA FOR VALLEY-FILL ISOPACH MAP (PLATE 3)
Table E.1. Wells used to constrain isopach contours for valley-fill sediment in Castle Valley.
ID1 Location2 Depth toBedrock3 (feet)
1 N 190 W 1660 SE 25 S22 E1 212 N 460 W 1990 E 425 S22 E1 1603 N 550 W 1660 SE 25 S22 E1 404 N 720 W 2045 SE 25 S22 E1 105 N 900 W 1660 SE 25 S22 E1 296 N 980 W 40 SE 25 S22 E1 57 N 1070 W 1000 SE 25 S22 E1 48 N 1130 W 110 SE 25 S22 E1 59 N 1570 W 1570 SE 25 S22 E1 10
10 N 1720 W 200 SE 25 S22 E1 31?11 N 1750 W 2090 SE 25 S22 E1 <6012 N 2160 W 1125 SE 25 S22 E1 >7013 N 2180 W 630 SE 25 S22 E1 >6814 N 3470 W 2270 SE 25 S22 E1 >10215 S 85 W 30 E 425 S22 E1 >5816 S 1400 W 1700 E 425 S22 E1 1517 S 50 W 530 NE 25 S22 E12 <12518 S 280 W 980 NE 25 S22 E12 9819 S 610 W 980 NE 25 S22 E12 3320 S 620 W 310 NE 25 S22 E12 >8521 S 625 W 325 NE 25 S22 E12 3022 S 1120 W 960 NE 25 S22 E12 5623 S 1305 W 310 NE 25 S22 E12 4024 S 1670 W 1040 NE 25 S22 E12 1725 S 2390 W 430 NE 25 S22 E12 8?26 N 300 E 1250 SW 25 S23 E5 45?27 N 50 W 240 SE 25 S23 E6 25?28 N 700 E 930 SW 25 S23 E6 >10029 N 780 E 280 SW 25 S23 E6 030 N 965 E 780 SW 25 S23 E6 031 N 1100 W 1300 SE 25 S23 E6 032 N 1700 E 140 SW 25 S23 E6 >10333 N 1740 E 1725 SW 25 S23 E6 >120?34 N 1850 W 550 S 425 S23 E6 035 N 2340 E 2330 SW 25 S23 E6 236 N 2440 E 1930 SW 25 S23 E6 037 N 2480 E 55 SW 25 S23 E6 >5838 N 3160 E 970 SW 25 S23 E6 11039 N 3510 E 1070 SW 25 S23 E6 840 N 3530 E 220 SW 25 S23 E6 10241 N 3770 E 850 SW 25 S23 E6 442 N 40 W 1190 SE 25 S23 E7 290?43 N 160 E 515 SE 25 S23 E7 044 N 180 W 75 SE 25 S23 E7 1545 N 400 E 550 W 425 S23 E7 846 N 580 W 85 E 425 S23 E7 >19747 N 595 E 120 S 425 S 23 E7 248 N 770 W 1230 SE 25 S23 E7 >20049 N 950 W 300 SE 25 S 23 E7 >83
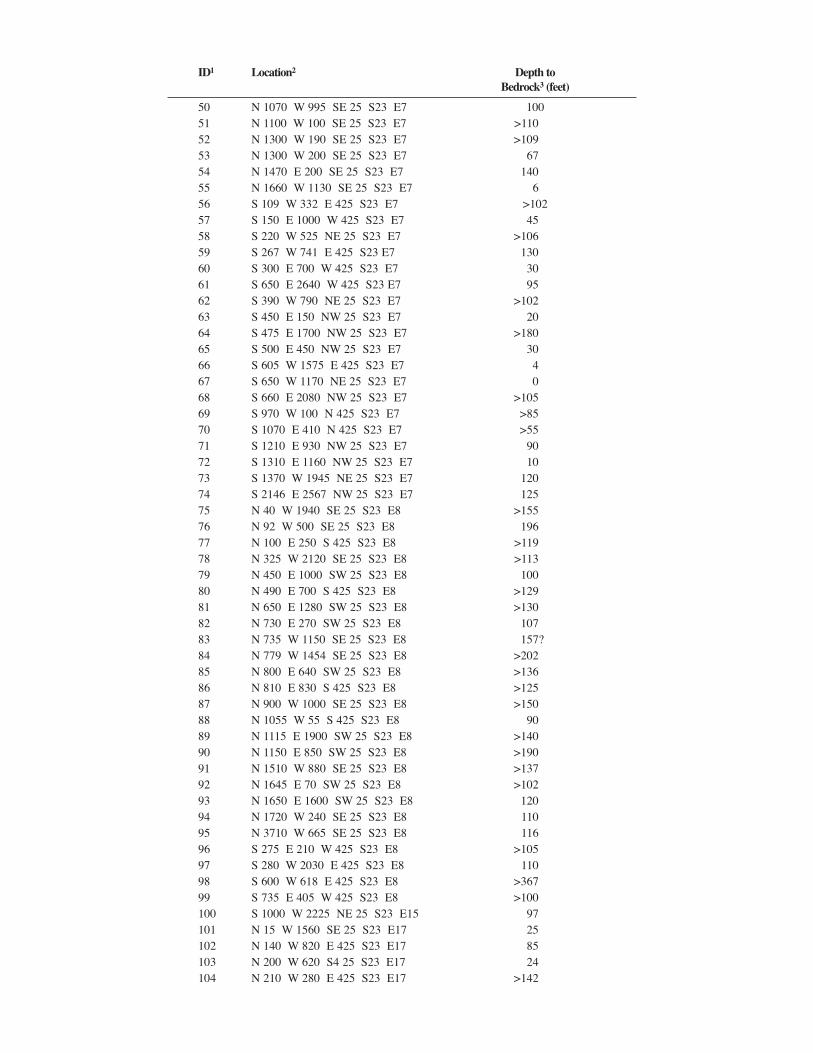
ID1 Location2 Depth toBedrock3 (feet)
50 N 1070 W 995 SE 25 S23 E7 10051 N 1100 W 100 SE 25 S23 E7 >11052 N 1300 W 190 SE 25 S23 E7 >10953 N 1300 W 200 SE 25 S23 E7 6754 N 1470 E 200 SE 25 S23 E7 14055 N 1660 W 1130 SE 25 S23 E7 656 S 109 W 332 E 425 S23 E7 >10257 S 150 E 1000 W 425 S23 E7 4558 S 220 W 525 NE 25 S23 E7 >10659 S 267 W 741 E 425 S23 E7 13060 S 300 E 700 W 425 S23 E7 3061 S 650 E 2640 W 425 S23 E7 9562 S 390 W 790 NE 25 S23 E7 >10263 S 450 E 150 NW 25 S23 E7 2064 S 475 E 1700 NW 25 S23 E7 >18065 S 500 E 450 NW 25 S23 E7 3066 S 605 W 1575 E 425 S23 E7 467 S 650 W 1170 NE 25 S23 E7 068 S 660 E 2080 NW 25 S23 E7 >10569 S 970 W 100 N 425 S23 E7 >8570 S 1070 E 410 N 425 S23 E7 >5571 S 1210 E 930 NW 25 S23 E7 9072 S 1310 E 1160 NW 25 S23 E7 1073 S 1370 W 1945 NE 25 S23 E7 12074 S 2146 E 2567 NW 25 S23 E7 12575 N 40 W 1940 SE 25 S23 E8 >15576 N 92 W 500 SE 25 S23 E8 19677 N 100 E 250 S 425 S23 E8 >11978 N 325 W 2120 SE 25 S23 E8 >11379 N 450 E 1000 SW 25 S23 E8 10080 N 490 E 700 S 425 S23 E8 >12981 N 650 E 1280 SW 25 S23 E8 >13082 N 730 E 270 SW 25 S23 E8 10783 N 735 W 1150 SE 25 S23 E8 157?84 N 779 W 1454 SE 25 S23 E8 >20285 N 800 E 640 SW 25 S23 E8 >13686 N 810 E 830 S 425 S23 E8 >12587 N 900 W 1000 SE 25 S23 E8 >15088 N 1055 W 55 S 425 S23 E8 9089 N 1115 E 1900 SW 25 S23 E8 >14090 N 1150 E 850 SW 25 S23 E8 >19091 N 1510 W 880 SE 25 S23 E8 >13792 N 1645 E 70 SW 25 S23 E8 >10293 N 1650 E 1600 SW 25 S23 E8 12094 N 1720 W 240 SE 25 S23 E8 11095 N 3710 W 665 SE 25 S23 E8 11696 S 275 E 210 W 425 S23 E8 >10597 S 280 W 2030 E 425 S23 E8 11098 S 600 W 618 E 425 S23 E8 >36799 S 735 E 405 W 425 S23 E8 >100100 S 1000 W 2225 NE 25 S23 E15 97101 N 15 W 1560 SE 25 S23 E17 25102 N 140 W 820 E 425 S23 E17 85103 N 200 W 620 S4 25 S23 E17 24104 N 210 W 280 E 425 S23 E17 >142
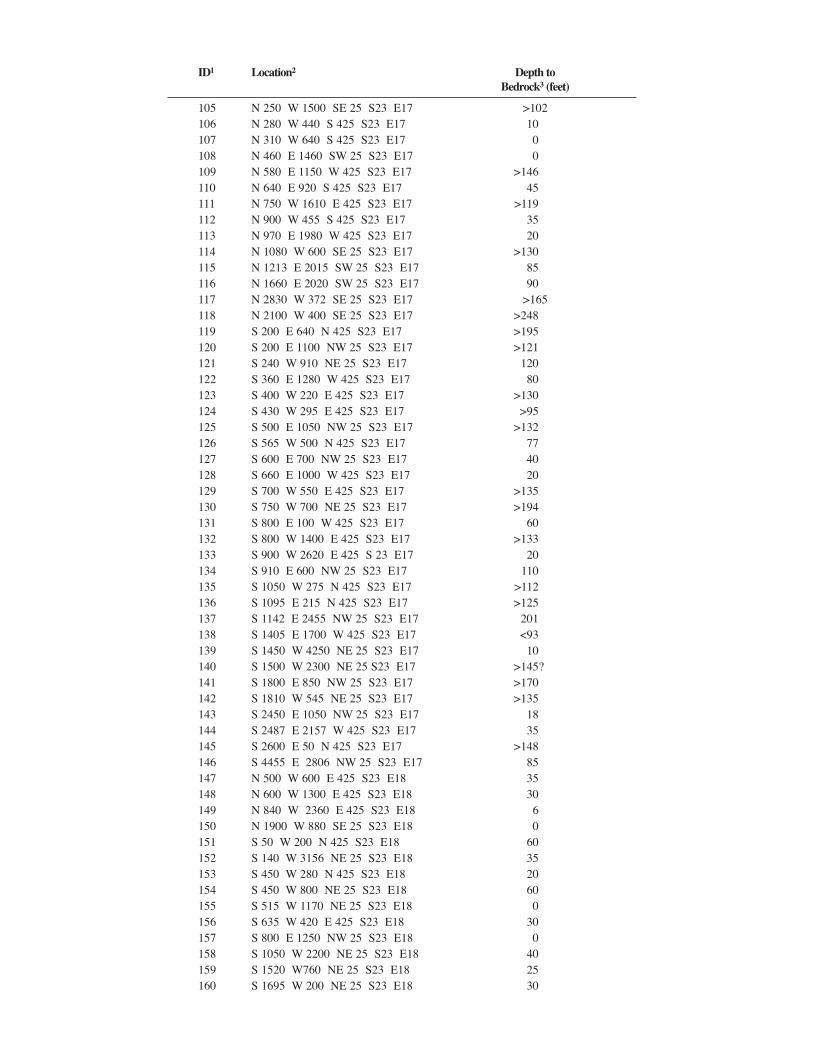
ID1 Location2 Depth toBedrock3 (feet)
105 N 250 W 1500 SE 25 S23 E17 >102106 N 280 W 440 S 425 S23 E17 10107 N 310 W 640 S 425 S23 E17 0108 N 460 E 1460 SW 25 S23 E17 0109 N 580 E 1150 W 425 S23 E17 >146110 N 640 E 920 S 425 S23 E17 45111 N 750 W 1610 E 425 S23 E17 >119112 N 900 W 455 S 425 S23 E17 35113 N 970 E 1980 W 425 S23 E17 20114 N 1080 W 600 SE 25 S23 E17 >130115 N 1213 E 2015 SW 25 S23 E17 85116 N 1660 E 2020 SW 25 S23 E17 90117 N 2830 W 372 SE 25 S23 E17 >165118 N 2100 W 400 SE 25 S23 E17 >248119 S 200 E 640 N 425 S23 E17 >195120 S 200 E 1100 NW 25 S23 E17 >121121 S 240 W 910 NE 25 S23 E17 120122 S 360 E 1280 W 425 S23 E17 80123 S 400 W 220 E 425 S23 E17 >130124 S 430 W 295 E 425 S23 E17 >95125 S 500 E 1050 NW 25 S23 E17 >132126 S 565 W 500 N 425 S23 E17 77127 S 600 E 700 NW 25 S23 E17 40128 S 660 E 1000 W 425 S23 E17 20129 S 700 W 550 E 425 S23 E17 >135130 S 750 W 700 NE 25 S23 E17 >194131 S 800 E 100 W 425 S23 E17 60132 S 800 W 1400 E 425 S23 E17 >133133 S 900 W 2620 E 425 S 23 E17 20134 S 910 E 600 NW 25 S23 E17 110135 S 1050 W 275 N 425 S23 E17 >112136 S 1095 E 215 N 425 S23 E17 >125137 S 1142 E 2455 NW 25 S23 E17 201138 S 1405 E 1700 W 425 S23 E17 <93139 S 1450 W 4250 NE 25 S23 E17 10140 S 1500 W 2300 NE 25 S23 E17 >145?141 S 1800 E 850 NW 25 S23 E17 >170142 S 1810 W 545 NE 25 S23 E17 >135143 S 2450 E 1050 NW 25 S23 E17 18144 S 2487 E 2157 W 425 S23 E17 35145 S 2600 E 50 N 425 S23 E17 >148146 S 4455 E 2806 NW 25 S23 E17 85147 N 500 W 600 E 425 S23 E18 35148 N 600 W 1300 E 425 S23 E18 30149 N 840 W 2360 E 425 S23 E18 6150 N 1900 W 880 SE 25 S23 E18 0151 S 50 W 200 N 425 S23 E18 60152 S 140 W 3156 NE 25 S23 E18 35153 S 450 W 280 N 425 S23 E18 20154 S 450 W 800 NE 25 S23 E18 60155 S 515 W 1170 NE 25 S23 E18 0156 S 635 W 420 E 425 S23 E18 30157 S 800 E 1250 NW 25 S23 E18 0158 S 1050 W 2200 NE 25 S23 E18 40159 S 1520 W760 NE 25 S23 E18 25160 S 1695 W 200 NE 25 S23 E18 30
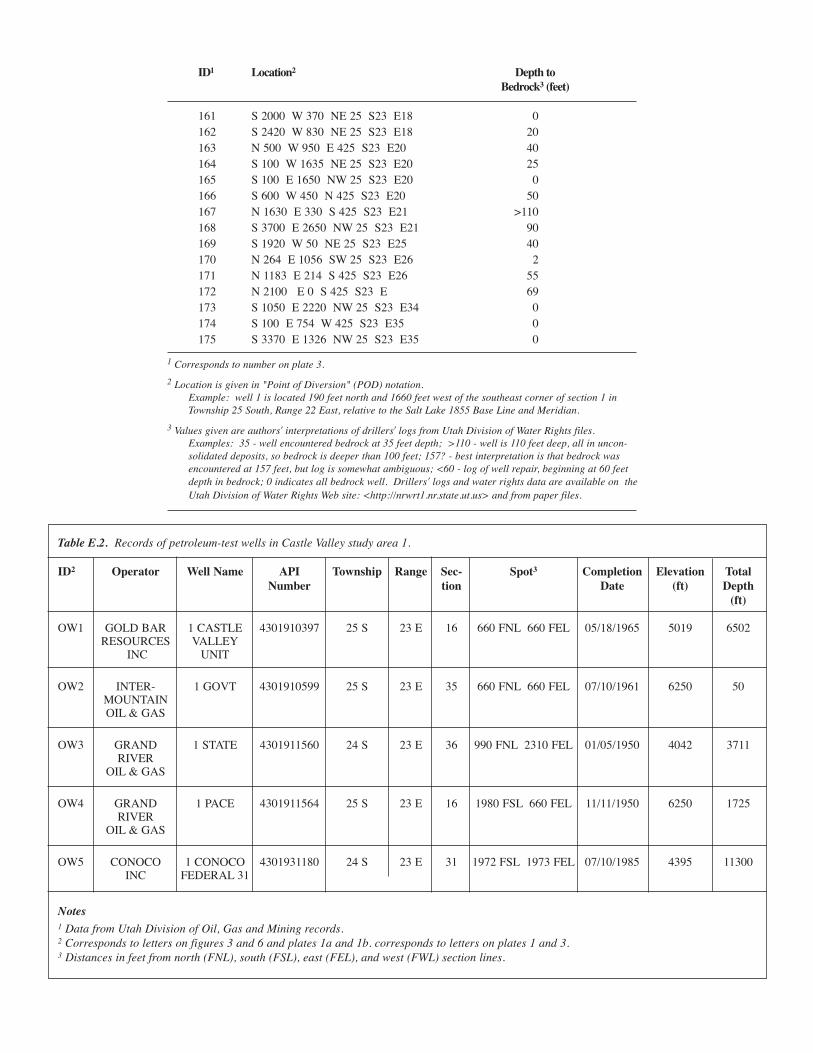
ID1 Location2 Depth toBedrock3 (feet)
161 S 2000 W 370 NE 25 S23 E18 0162 S 2420 W 830 NE 25 S23 E18 20163 N 500 W 950 E 425 S23 E20 40164 S 100 W 1635 NE 25 S23 E20 25165 S 100 E 1650 NW 25 S23 E20 0166 S 600 W 450 N 425 S23 E20 50167 N 1630 E 330 S 425 S23 E21 >110168 S 3700 E 2650 NW 25 S23 E21 90169 S 1920 W 50 NE 25 S23 E25 40170 N 264 E 1056 SW 25 S23 E26 2171 N 1183 E 214 S 425 S23 E26 55172 N 2100 E 0 S 425 S23 E 69173 S 1050 E 2220 NW 25 S23 E34 0174 S 100 E 754 W 425 S23 E35 0175 S 3370 E 1326 NW 25 S23 E35 0
1 Corresponds to number on plate 3.
2 Location is given in "Point of Diversion" (POD) notation.Example: well 1 is located 190 feet north and 1660 feet west of the southeast corner of section 1 inTownship 25 South, Range 22 East, relative to the Salt Lake 1855 Base Line and Meridian.
3 Values given are authors′ interpretations of drillers′ logs from Utah Division of Water Rights files.Examples: 35 - well encountered bedrock at 35 feet depth; >110 - well is 110 feet deep, all in uncon-solidated deposits, so bedrock is deeper than 100 feet; 157? - best interpretation is that bedrock wasencountered at 157 feet, but log is somewhat ambiguous; <60 - log of well repair, beginning at 60 feetdepth in bedrock; 0 indicates all bedrock well. Drillers′ logs and water rights data are available on theUtah Division of Water Rights Web site: <http://nrwrt1.nr.state.ut.us> and from paper files.
Table E.2. Records of petroleum-test wells in Castle Valley study area 1.
ID2 Operator Well Name API Township Range Sec- Spot3 Completion Elevation Total Number tion Date (ft) Depth
(ft)
OW1 GOLD BAR 1 CASTLE 4301910397 25 S 23 E 16 660 FNL 660 FEL 05/18/1965 5019 6502RESOURCES VALLEY
INC UNIT
OW2 INTER- 1 GOVT 4301910599 25 S 23 E 35 660 FNL 660 FEL 07/10/1961 6250 50MOUNTAINOIL & GAS
OW3 GRAND 1 STATE 4301911560 24 S 23 E 36 990 FNL 2310 FEL 01/05/1950 4042 3711RIVER
OIL & GAS
OW4 GRAND 1 PACE 4301911564 25 S 23 E 16 1980 FSL 660 FEL 11/11/1950 6250 1725RIVER
OIL & GAS
OW5 CONOCO 1 CONOCO 4301931180 24 S 23 E 31 1972 FSL 1973 FEL 07/10/1985 4395 11300INC FEDERAL 31
Notes1 Data from Utah Division of Oil, Gas and Mining records.2 Corresponds to letters on figures 3 and 6 and plates 1a and 1b. corresponds to letters on plates 1 and 3.3 Distances in feet from north (FNL), south (FSL), east (FEL), and west (FWL) section lines.
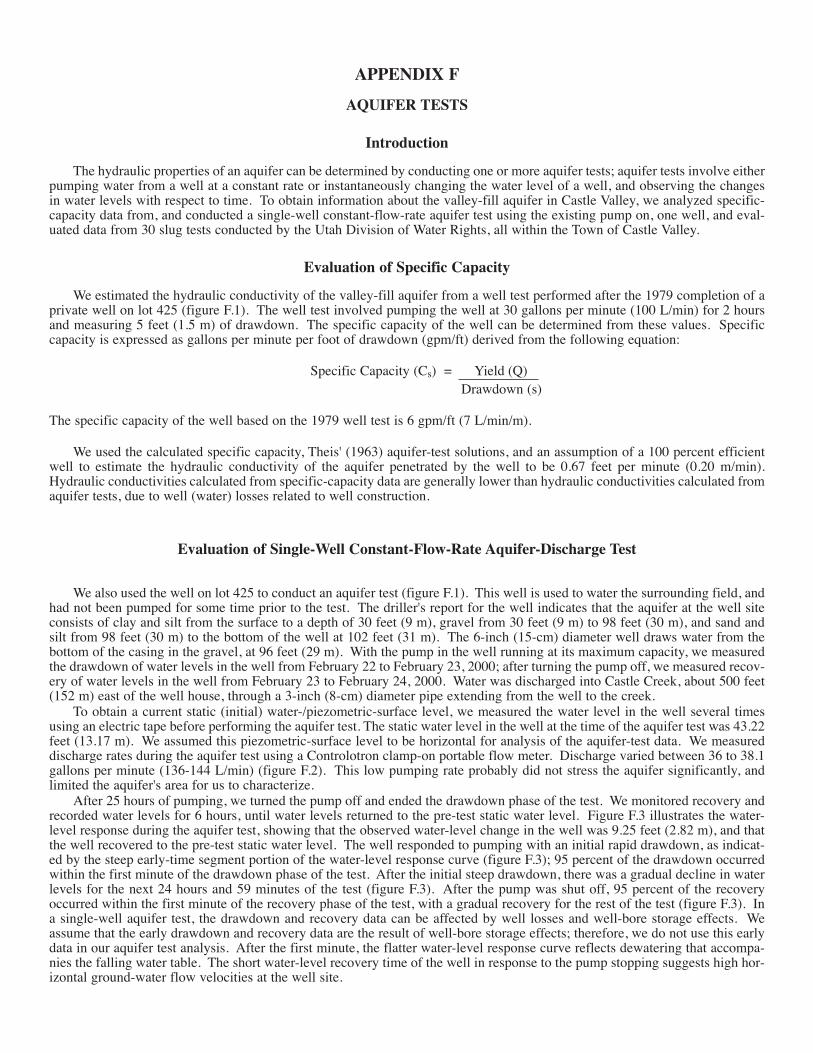
APPENDIX F
AQUIFER TESTS
Introduction
The hydraulic properties of an aquifer can be determined by conducting one or more aquifer tests; aquifer tests involve eitherpumping water from a well at a constant rate or instantaneously changing the water level of a well, and observing the changesin water levels with respect to time. To obtain information about the valley-fill aquifer in Castle Valley, we analyzed specific-capacity data from, and conducted a single-well constant-flow-rate aquifer test using the existing pump on, one well, and eval-uated data from 30 slug tests conducted by the Utah Division of Water Rights, all within the Town of Castle Valley.
Evaluation of Specific Capacity
We estimated the hydraulic conductivity of the valley-fill aquifer from a well test performed after the 1979 completion of aprivate well on lot 425 (figure F.1). The well test involved pumping the well at 30 gallons per minute (100 L/min) for 2 hoursand measuring 5 feet (1.5 m) of drawdown. The specific capacity of the well can be determined from these values. Specificcapacity is expressed as gallons per minute per foot of drawdown (gpm/ft) derived from the following equation:
Specific Capacity (Cs) = Yield (Q)Drawdown (s)
The specific capacity of the well based on the 1979 well test is 6 gpm/ft (7 L/min/m).
We used the calculated specific capacity, Theis' (1963) aquifer-test solutions, and an assumption of a 100 percent efficientwell to estimate the hydraulic conductivity of the aquifer penetrated by the well to be 0.67 feet per minute (0.20 m/min).Hydraulic conductivities calculated from specific-capacity data are generally lower than hydraulic conductivities calculated fromaquifer tests, due to well (water) losses related to well construction.
Evaluation of Single-Well Constant-Flow-Rate Aquifer-Discharge Test
We also used the well on lot 425 to conduct an aquifer test (figure F.1). This well is used to water the surrounding field, andhad not been pumped for some time prior to the test. The driller's report for the well indicates that the aquifer at the well siteconsists of clay and silt from the surface to a depth of 30 feet (9 m), gravel from 30 feet (9 m) to 98 feet (30 m), and sand andsilt from 98 feet (30 m) to the bottom of the well at 102 feet (31 m). The 6-inch (15-cm) diameter well draws water from thebottom of the casing in the gravel, at 96 feet (29 m). With the pump in the well running at its maximum capacity, we measuredthe drawdown of water levels in the well from February 22 to February 23, 2000; after turning the pump off, we measured recov-ery of water levels in the well from February 23 to February 24, 2000. Water was discharged into Castle Creek, about 500 feet(152 m) east of the well house, through a 3-inch (8-cm) diameter pipe extending from the well to the creek.
To obtain a current static (initial) water-/piezometric-surface level, we measured the water level in the well several timesusing an electric tape before performing the aquifer test. The static water level in the well at the time of the aquifer test was 43.22feet (13.17 m). We assumed this piezometric-surface level to be horizontal for analysis of the aquifer-test data. We measureddischarge rates during the aquifer test using a Controlotron clamp-on portable flow meter. Discharge varied between 36 to 38.1gallons per minute (136-144 L/min) (figure F.2). This low pumping rate probably did not stress the aquifer significantly, andlimited the aquifer's area for us to characterize.
After 25 hours of pumping, we turned the pump off and ended the drawdown phase of the test. We monitored recovery andrecorded water levels for 6 hours, until water levels returned to the pre-test static water level. Figure F.3 illustrates the water-level response during the aquifer test, showing that the observed water-level change in the well was 9.25 feet (2.82 m), and thatthe well recovered to the pre-test static water level. The well responded to pumping with an initial rapid drawdown, as indicat-ed by the steep early-time segment portion of the water-level response curve (figure F.3); 95 percent of the drawdown occurredwithin the first minute of the drawdown phase of the test. After the initial steep drawdown, there was a gradual decline in waterlevels for the next 24 hours and 59 minutes of the test (figure F.3). After the pump was shut off, 95 percent of the recoveryoccurred within the first minute of the recovery phase of the test, with a gradual recovery for the rest of the test (figure F.3). Ina single-well aquifer test, the drawdown and recovery data can be affected by well losses and well-bore storage effects. Weassume that the early drawdown and recovery data are the result of well-bore storage effects; therefore, we do not use this earlydata in our aquifer test analysis. After the first minute, the flatter water-level response curve reflects dewatering that accompa-nies the falling water table. The short water-level recovery time of the well in response to the pump stopping suggests high hor-izontal ground-water flow velocities at the well site.
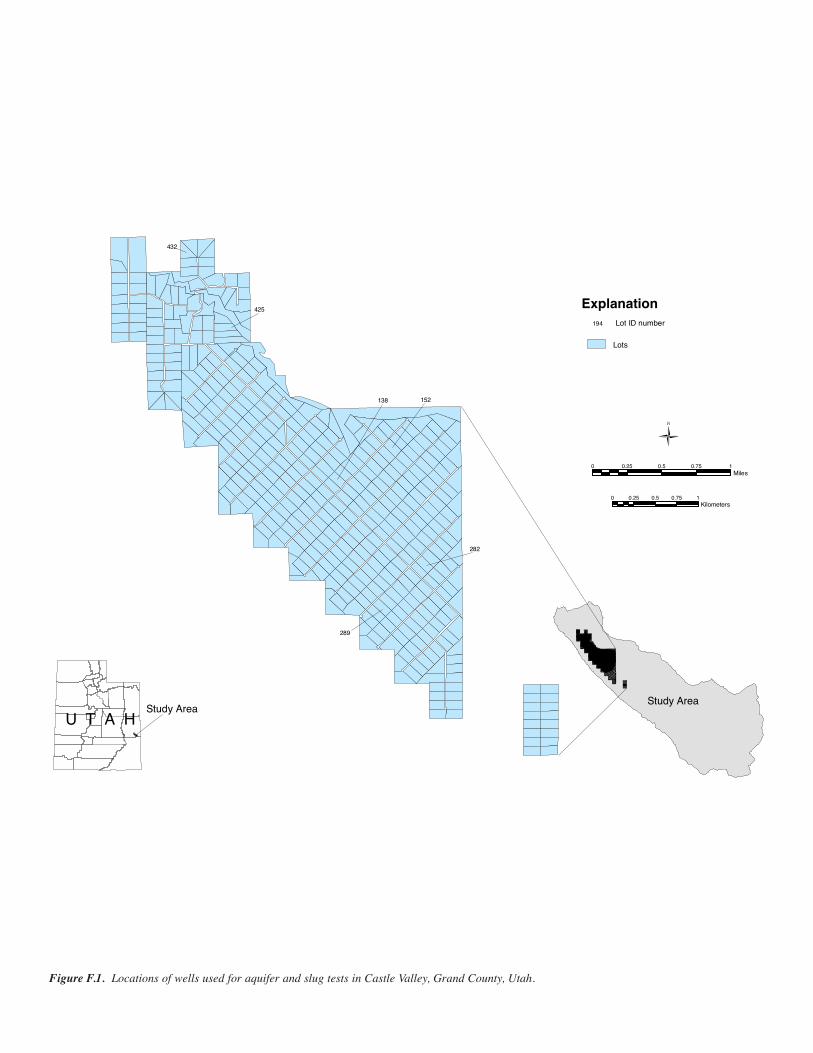
432
425
138 152
282
289
Study Area
Kilometers0 0.25 0.5 0.75 1
Miles0 0.25 0.5 0.75 1
Explanation
Lots
194 Lot ID number
Study AreaU T A H
Figure F.1. Locations of wells used for aquifer and slug tests in Castle Valley, Grand County, Utah.
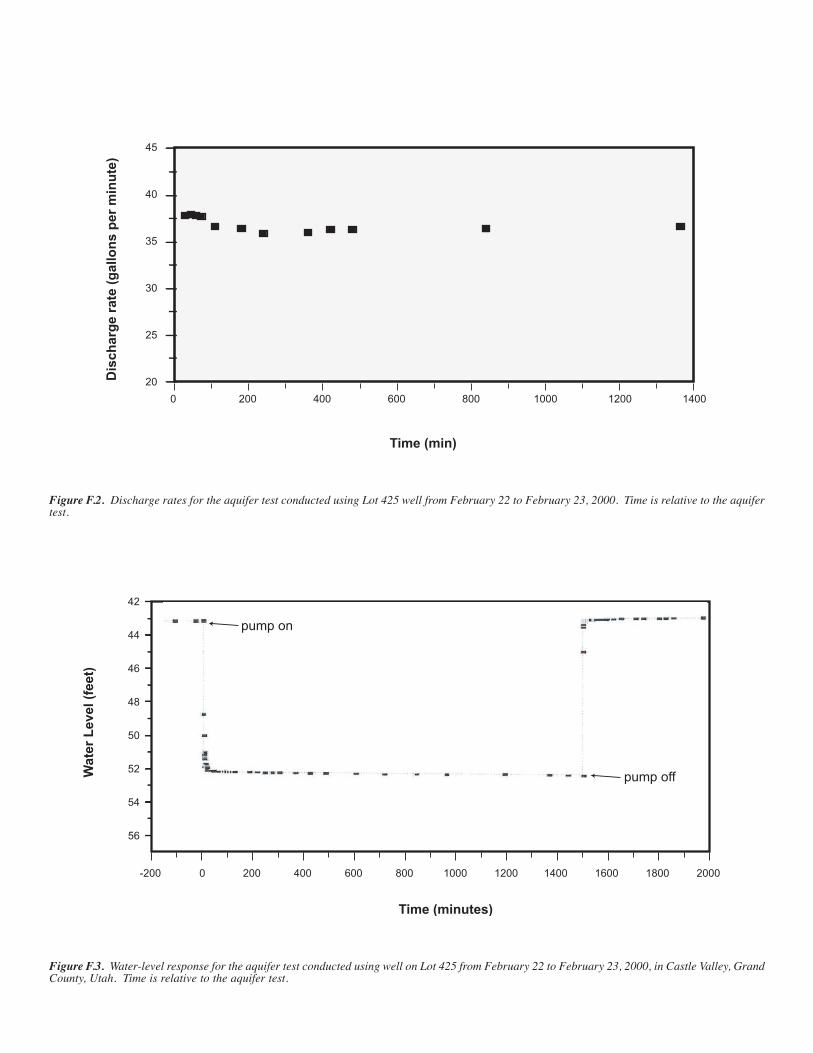
45
40
35
30
25
20
Time (min)
Dis
ch
arg
e r
ate
(g
all
on
s p
er
min
ute
)
0 200 400 600 800 1000 1200 1400
42
44
46
48
50
52
54
56
Time (minutes)
Wa
ter
Le
ve
l (f
ee
t)
-200 0 200 400 600 800 1000 1200 1400 1600 1800 2000
pump on
pump off
Figure F.2. Discharge rates for the aquifer test conducted using Lot 425 well from February 22 to February 23, 2000. Time is relative to the aquifertest.
Figure F.3. Water-level response for the aquifer test conducted using well on Lot 425 from February 22 to February 23, 2000, in Castle Valley, GrandCounty, Utah. Time is relative to the aquifer test.
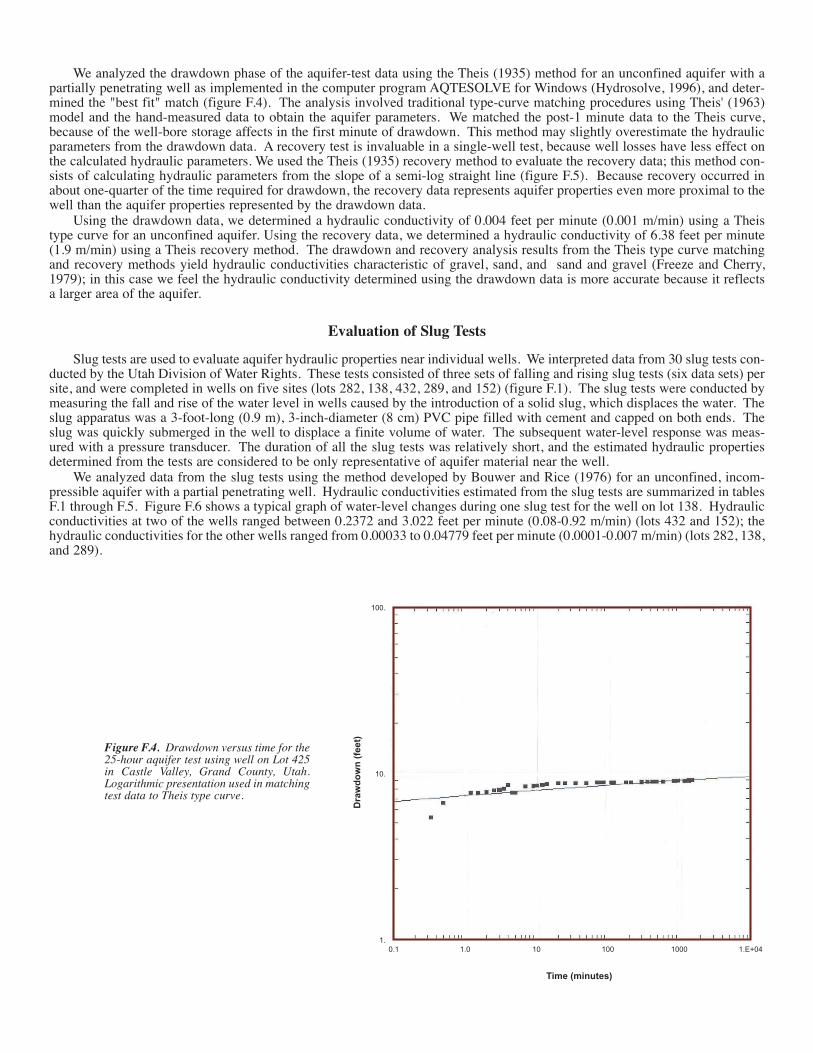
We analyzed the drawdown phase of the aquifer-test data using the Theis (1935) method for an unconfined aquifer with apartially penetrating well as implemented in the computer program AQTESOLVE for Windows (Hydrosolve, 1996), and deter-mined the "best fit" match (figure F.4). The analysis involved traditional type-curve matching procedures using Theis' (1963)model and the hand-measured data to obtain the aquifer parameters. We matched the post-1 minute data to the Theis curve,because of the well-bore storage affects in the first minute of drawdown. This method may slightly overestimate the hydraulicparameters from the drawdown data. A recovery test is invaluable in a single-well test, because well losses have less effect onthe calculated hydraulic parameters. We used the Theis (1935) recovery method to evaluate the recovery data; this method con-sists of calculating hydraulic parameters from the slope of a semi-log straight line (figure F.5). Because recovery occurred inabout one-quarter of the time required for drawdown, the recovery data represents aquifer properties even more proximal to thewell than the aquifer properties represented by the drawdown data.
Using the drawdown data, we determined a hydraulic conductivity of 0.004 feet per minute (0.001 m/min) using a Theistype curve for an unconfined aquifer. Using the recovery data, we determined a hydraulic conductivity of 6.38 feet per minute(1.9 m/min) using a Theis recovery method. The drawdown and recovery analysis results from the Theis type curve matchingand recovery methods yield hydraulic conductivities characteristic of gravel, sand, and sand and gravel (Freeze and Cherry,1979); in this case we feel the hydraulic conductivity determined using the drawdown data is more accurate because it reflectsa larger area of the aquifer.
Evaluation of Slug Tests
Slug tests are used to evaluate aquifer hydraulic properties near individual wells. We interpreted data from 30 slug tests con-ducted by the Utah Division of Water Rights. These tests consisted of three sets of falling and rising slug tests (six data sets) persite, and were completed in wells on five sites (lots 282, 138, 432, 289, and 152) (figure F.1). The slug tests were conducted bymeasuring the fall and rise of the water level in wells caused by the introduction of a solid slug, which displaces the water. Theslug apparatus was a 3-foot-long (0.9 m), 3-inch-diameter (8 cm) PVC pipe filled with cement and capped on both ends. Theslug was quickly submerged in the well to displace a finite volume of water. The subsequent water-level response was meas-ured with a pressure transducer. The duration of all the slug tests was relatively short, and the estimated hydraulic propertiesdetermined from the tests are considered to be only representative of aquifer material near the well.
We analyzed data from the slug tests using the method developed by Bouwer and Rice (1976) for an unconfined, incom-pressible aquifer with a partial penetrating well. Hydraulic conductivities estimated from the slug tests are summarized in tablesF.1 through F.5. Figure F.6 shows a typical graph of water-level changes during one slug test for the well on lot 138. Hydraulicconductivities at two of the wells ranged between 0.2372 and 3.022 feet per minute (0.08-0.92 m/min) (lots 432 and 152); thehydraulic conductivities for the other wells ranged from 0.00033 to 0.04779 feet per minute (0.0001-0.007 m/min) (lots 282, 138,and 289).
100.
10.
1.
Time (minutes)
Dra
wd
ow
n (
fee
t)
0.1 1.0 10 100 1000 1.E+04
Figure F.4. Drawdown versus time for the25-hour aquifer test using well on Lot 425in Castle Valley, Grand County, Utah.Logarithmic presentation used in matchingtest data to Theis type curve.
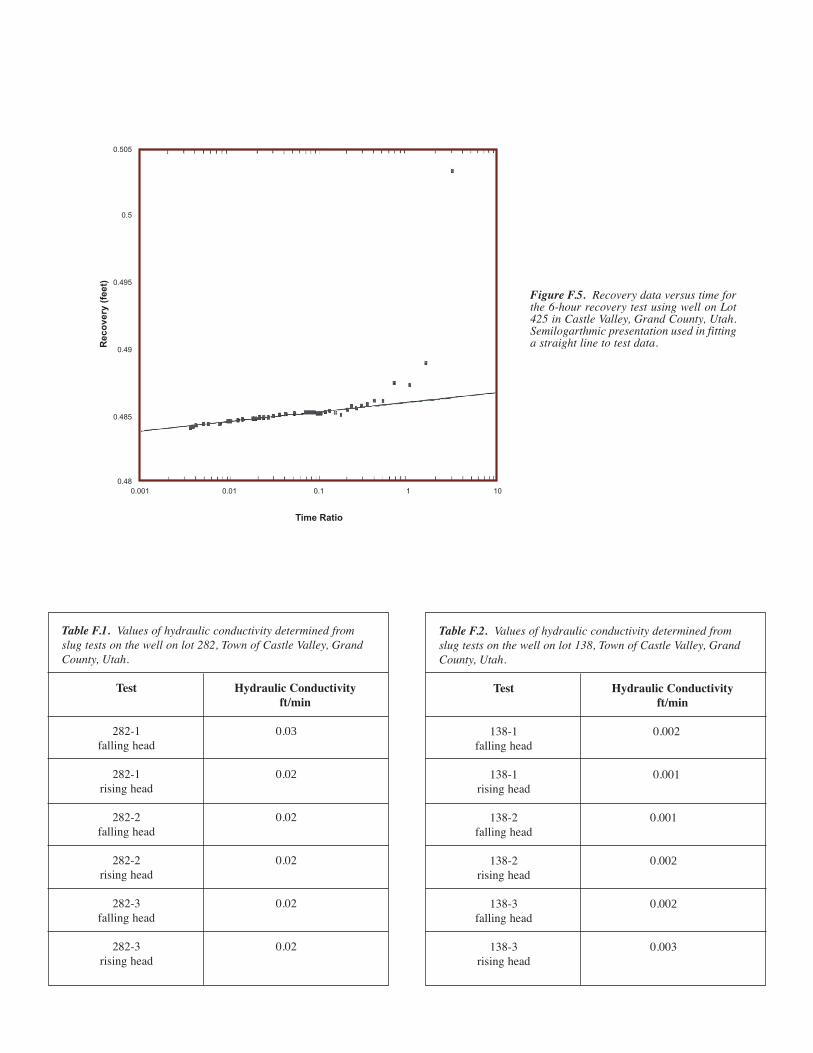
Table F.1. Values of hydraulic conductivity determined fromslug tests on the well on lot 282, Town of Castle Valley, GrandCounty, Utah.
Test Hydraulic Conductivityft/min
282-1 0.03falling head
282-1 0.02rising head
282-2 0.02falling head
282-2 0.02rising head
282-3 0.02falling head
282-3 0.02rising head
Table F.2. Values of hydraulic conductivity determined fromslug tests on the well on lot 138, Town of Castle Valley, GrandCounty, Utah.
Test Hydraulic Conductivityft/min
138-1 0.002falling head
138-1 0.001rising head
138-2 0.001falling head
138-2 0.002rising head
138-3 0.002falling head
138-3 0.003rising head
0.505
0.5
0.495
0.49
0.485
0.48
Time Ratio
Re
co
ve
ry (
fee
t)
0.001 0.01 0.1 1 10
Figure F.5. Recovery data versus time forthe 6-hour recovery test using well on Lot425 in Castle Valley, Grand County, Utah.Semilogarthmic presentation used in fittinga straight line to test data.
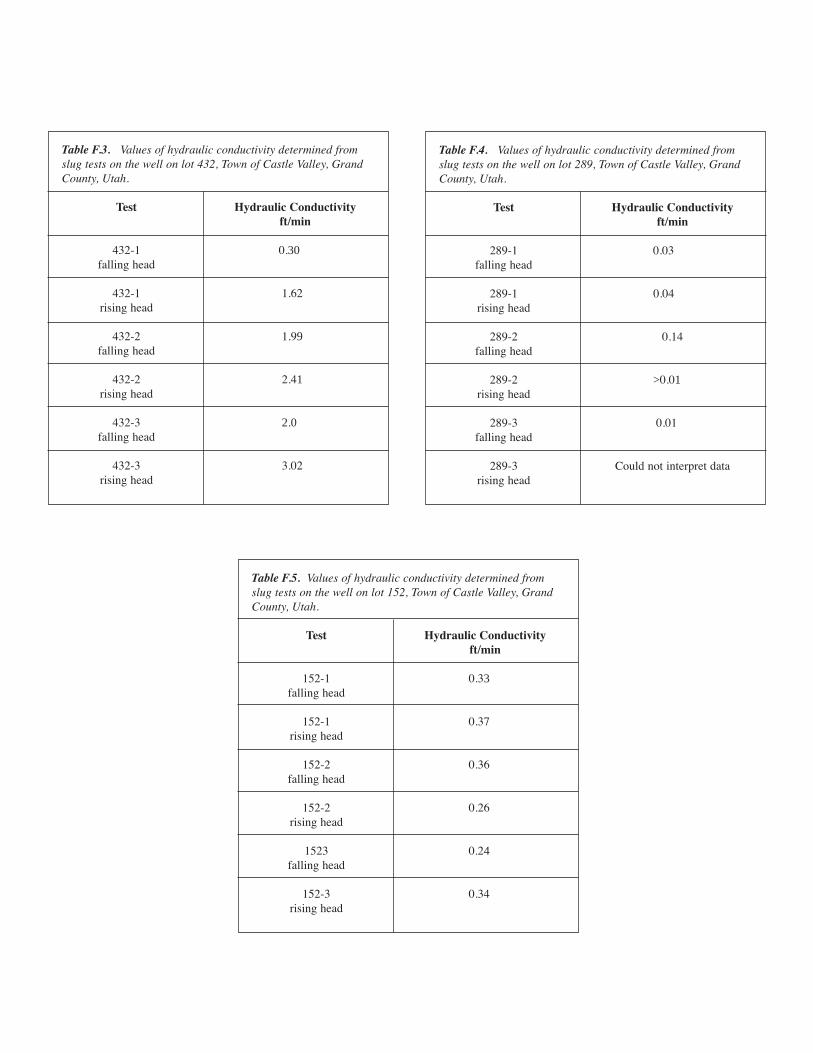
Table F.5. Values of hydraulic conductivity determined fromslug tests on the well on lot 152, Town of Castle Valley, GrandCounty, Utah.
Test Hydraulic Conductivityft/min
152-1 0.33falling head
152-1 0.37rising head
152-2 0.36falling head
152-2 0.26rising head
1523 0.24falling head
152-3 0.34rising head
Table F.3. Values of hydraulic conductivity determined fromslug tests on the well on lot 432, Town of Castle Valley, GrandCounty, Utah.
Test Hydraulic Conductivityft/min
432-1 0.30falling head
432-1 1.62rising head
432-2 1.99falling head
432-2 2.41rising head
432-3 2.0falling head
432-3 3.02rising head
Table F.4. Values of hydraulic conductivity determined fromslug tests on the well on lot 289, Town of Castle Valley, GrandCounty, Utah.
Test Hydraulic Conductivityft/min
289-1 0.03falling head
289-1 0.04rising head
289-2 0.14falling head
289-2 >0.01rising head
289-3 0.01falling head
289-3 Could not interpret datarising head
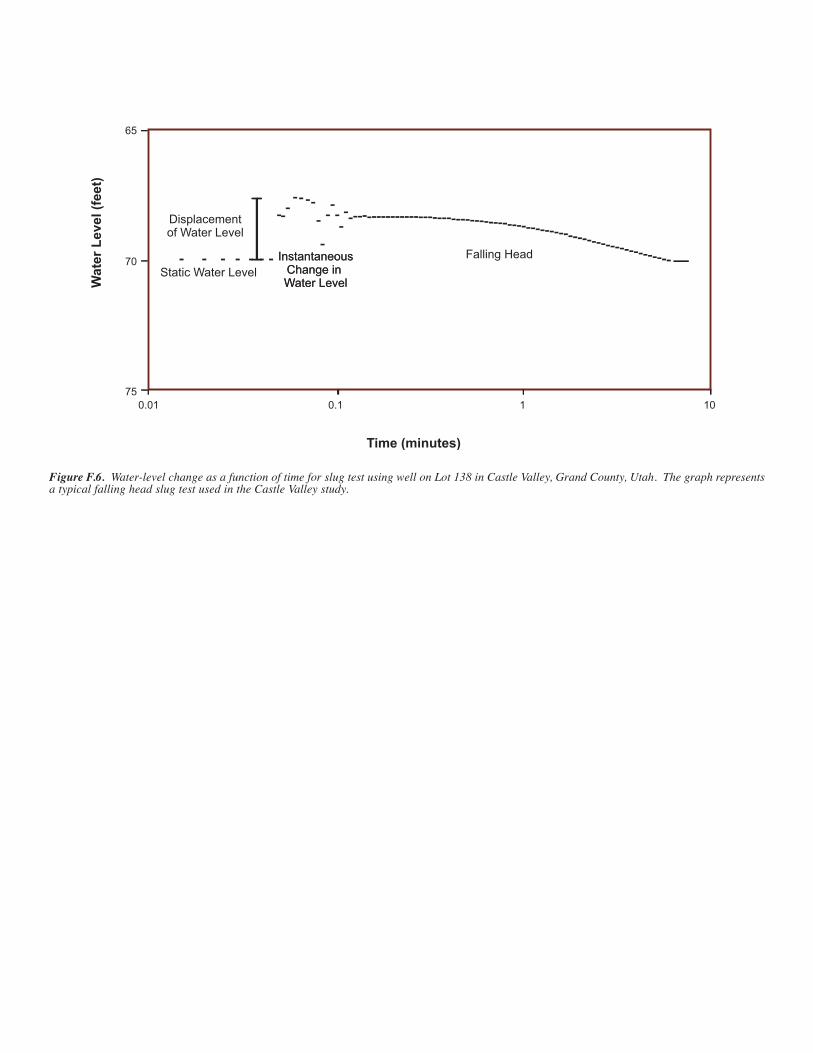
65
70
75
Time (minutes)
Wate
r L
evel (f
eet)
0.01 0.1 1 10
Falling Head
Static Water Level
Displacementof Water Level
InstantaneousChange in Water Level
InstantaneousChange in Water Level
InstantaneousChange in Water Level
Figure F.6. Water-level change as a function of time for slug test using well on Lot 138 in Castle Valley, Grand County, Utah. The graph representsa typical falling head slug test used in the Castle Valley study.
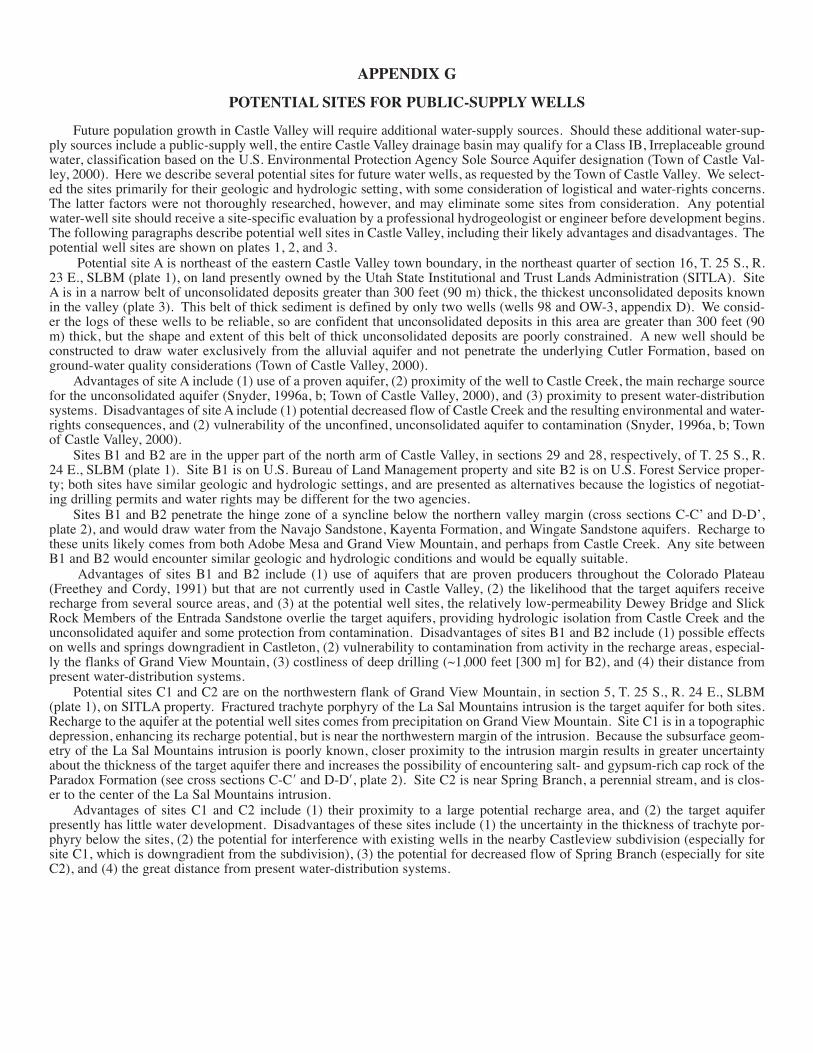
APPENDIX G
POTENTIAL SITES FOR PUBLIC-SUPPLY WELLS
Future population growth in Castle Valley will require additional water-supply sources. Should these additional water-sup-ply sources include a public-supply well, the entire Castle Valley drainage basin may qualify for a Class IB, Irreplaceable groundwater, classification based on the U.S. Environmental Protection Agency Sole Source Aquifer designation (Town of Castle Val-ley, 2000). Here we describe several potential sites for future water wells, as requested by the Town of Castle Valley. We select-ed the sites primarily for their geologic and hydrologic setting, with some consideration of logistical and water-rights concerns.The latter factors were not thoroughly researched, however, and may eliminate some sites from consideration. Any potentialwater-well site should receive a site-specific evaluation by a professional hydrogeologist or engineer before development begins.The following paragraphs describe potential well sites in Castle Valley, including their likely advantages and disadvantages. Thepotential well sites are shown on plates 1, 2, and 3.
Potential site A is northeast of the eastern Castle Valley town boundary, in the northeast quarter of section 16, T. 25 S., R.23 E., SLBM (plate 1), on land presently owned by the Utah State Institutional and Trust Lands Administration (SITLA). SiteA is in a narrow belt of unconsolidated deposits greater than 300 feet (90 m) thick, the thickest unconsolidated deposits knownin the valley (plate 3). This belt of thick sediment is defined by only two wells (wells 98 and OW-3, appendix D). We consid-er the logs of these wells to be reliable, so are confident that unconsolidated deposits in this area are greater than 300 feet (90m) thick, but the shape and extent of this belt of thick unconsolidated deposits are poorly constrained. A new well should beconstructed to draw water exclusively from the alluvial aquifer and not penetrate the underlying Cutler Formation, based onground-water quality considerations (Town of Castle Valley, 2000).
Advantages of site A include (1) use of a proven aquifer, (2) proximity of the well to Castle Creek, the main recharge sourcefor the unconsolidated aquifer (Snyder, 1996a, b; Town of Castle Valley, 2000), and (3) proximity to present water-distributionsystems. Disadvantages of site A include (1) potential decreased flow of Castle Creek and the resulting environmental and water-rights consequences, and (2) vulnerability of the unconfined, unconsolidated aquifer to contamination (Snyder, 1996a, b; Townof Castle Valley, 2000).
Sites B1 and B2 are in the upper part of the north arm of Castle Valley, in sections 29 and 28, respectively, of T. 25 S., R.24 E., SLBM (plate 1). Site B1 is on U.S. Bureau of Land Management property and site B2 is on U.S. Forest Service proper-ty; both sites have similar geologic and hydrologic settings, and are presented as alternatives because the logistics of negotiat-ing drilling permits and water rights may be different for the two agencies.
Sites B1 and B2 penetrate the hinge zone of a syncline below the northern valley margin (cross sections C-C’ and D-D’,plate 2), and would draw water from the Navajo Sandstone, Kayenta Formation, and Wingate Sandstone aquifers. Recharge tothese units likely comes from both Adobe Mesa and Grand View Mountain, and perhaps from Castle Creek. Any site betweenB1 and B2 would encounter similar geologic and hydrologic conditions and would be equally suitable.
Advantages of sites B1 and B2 include (1) use of aquifers that are proven producers throughout the Colorado Plateau(Freethey and Cordy, 1991) but that are not currently used in Castle Valley, (2) the likelihood that the target aquifers receiverecharge from several source areas, and (3) at the potential well sites, the relatively low-permeability Dewey Bridge and SlickRock Members of the Entrada Sandstone overlie the target aquifers, providing hydrologic isolation from Castle Creek and theunconsolidated aquifer and some protection from contamination. Disadvantages of sites B1 and B2 include (1) possible effectson wells and springs downgradient in Castleton, (2) vulnerability to contamination from activity in the recharge areas, especial-ly the flanks of Grand View Mountain, (3) costliness of deep drilling (~1,000 feet [300 m] for B2), and (4) their distance frompresent water-distribution systems.
Potential sites C1 and C2 are on the northwestern flank of Grand View Mountain, in section 5, T. 25 S., R. 24 E., SLBM(plate 1), on SITLA property. Fractured trachyte porphyry of the La Sal Mountains intrusion is the target aquifer for both sites.Recharge to the aquifer at the potential well sites comes from precipitation on Grand View Mountain. Site C1 is in a topographicdepression, enhancing its recharge potential, but is near the northwestern margin of the intrusion. Because the subsurface geom-etry of the La Sal Mountains intrusion is poorly known, closer proximity to the intrusion margin results in greater uncertaintyabout the thickness of the target aquifer there and increases the possibility of encountering salt- and gypsum-rich cap rock of theParadox Formation (see cross sections C-C′ and D-D′, plate 2). Site C2 is near Spring Branch, a perennial stream, and is clos-er to the center of the La Sal Mountains intrusion.
Advantages of sites C1 and C2 include (1) their proximity to a large potential recharge area, and (2) the target aquiferpresently has little water development. Disadvantages of these sites include (1) the uncertainty in the thickness of trachyte por-phyry below the sites, (2) the potential for interference with existing wells in the nearby Castleview subdivision (especially forsite C1, which is downgradient from the subdivision), (3) the potential for decreased flow of Spring Branch (especially for siteC2), and (4) the great distance from present water-distribution systems.
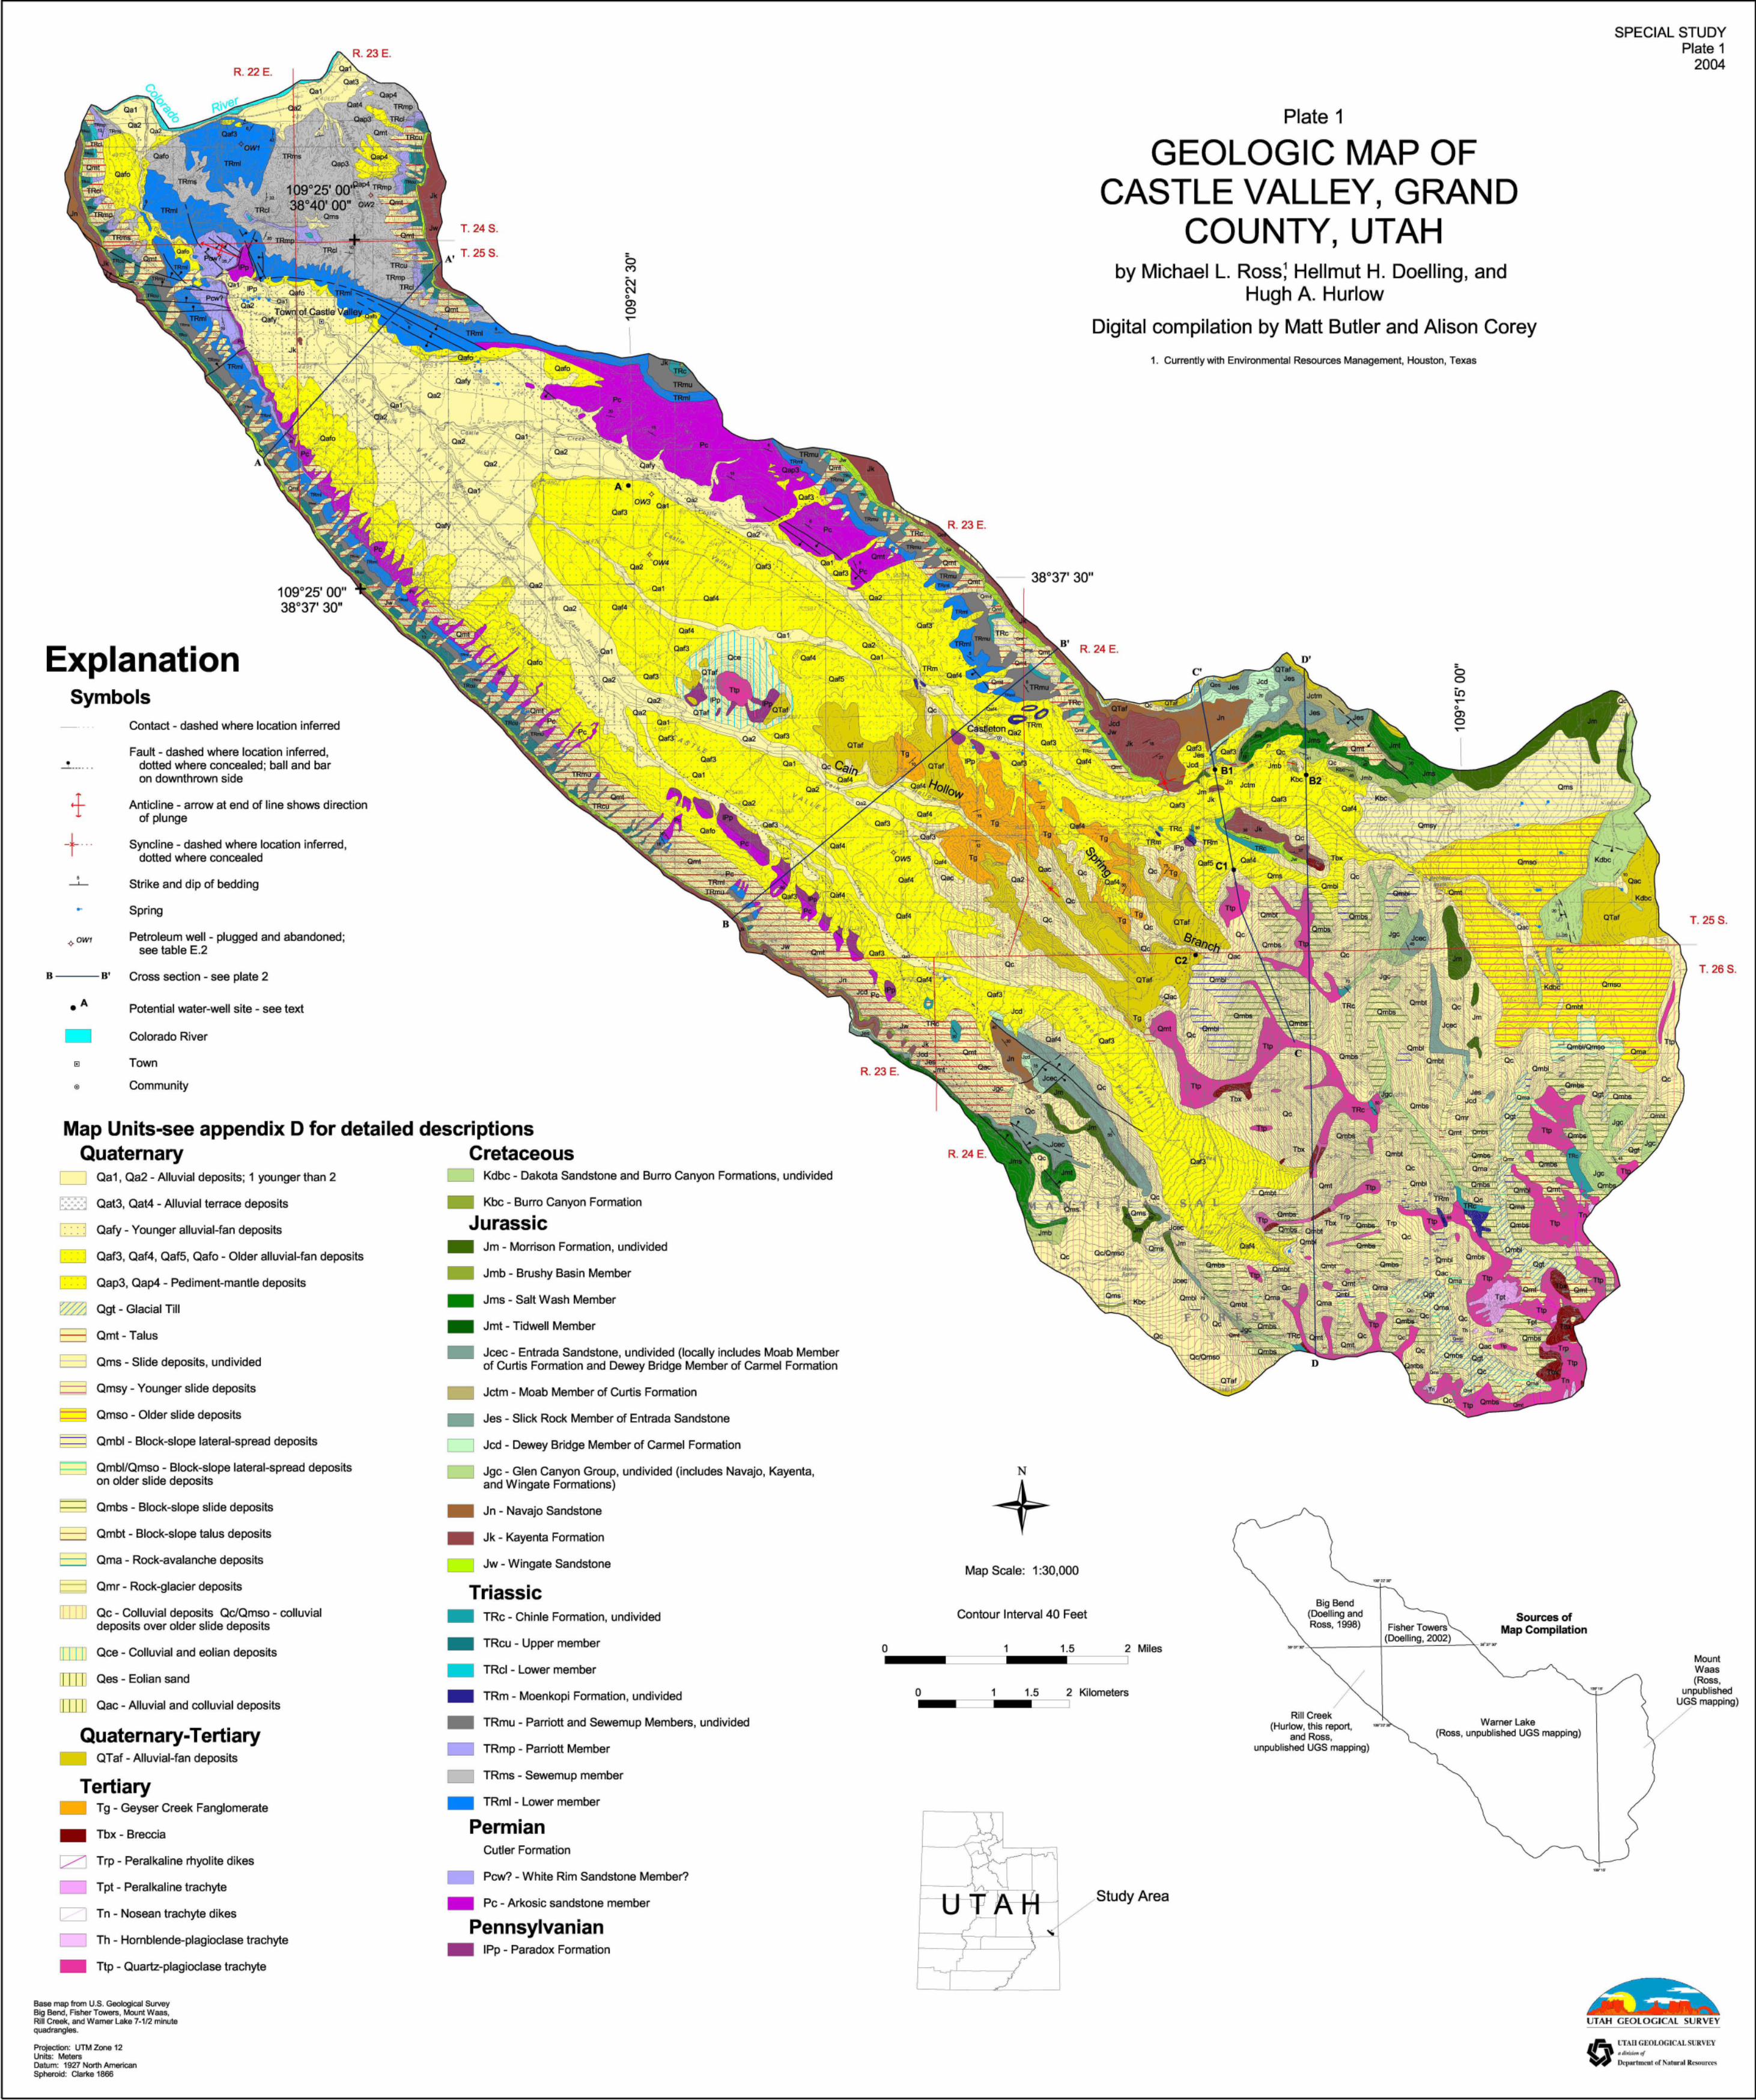
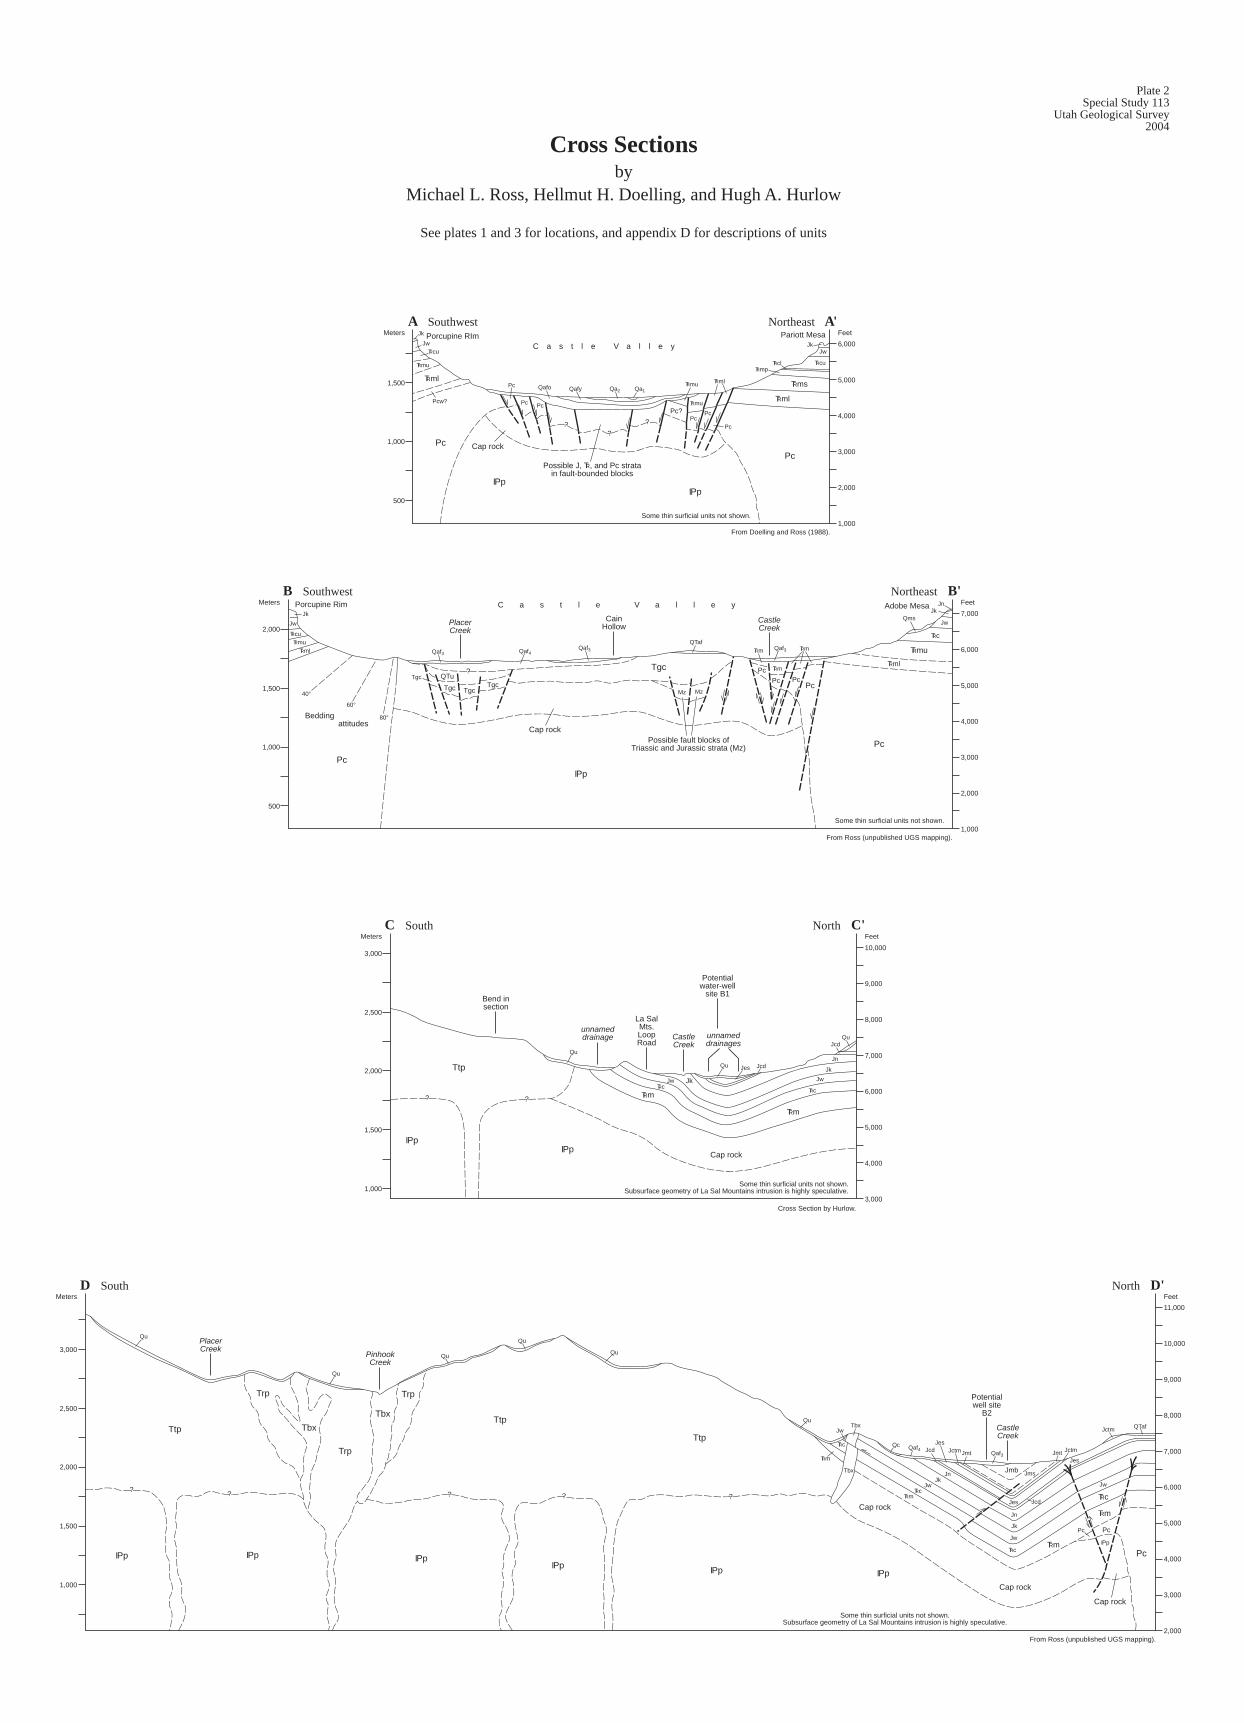
??
? ? ? ? ?
Cross Sectionsby
Michael L. Ross, Hellmut H. Doelling, and Hugh A. Hurlow
See plates 1 and 3 for locations, and appendix D for descriptions of units
Plate 2Special Study 113
Utah Geological Survey2004
North D'D South
Northeast B'B Southwest
Northeast A'A Southwest
North C'C South
8,000
7,000
6,000
5,000
4,000
3,000
9,000
10,000
11,000
2,000
CastleCreek
PinhookCreek
PlacerCreek
Jk
Jw
TRcTRm
Jn
Jcd
Qu
Qu
Qu Qu
Qu
Tbx
Ttp
Ttp
Trp
TrpTrp
TbxTbx
Ttp
IPp IPp IPpIPp IPp
Potentialwell site
B2
Pc
IPp
Pc
TRm
TRc
Jw
Pc
IPp
JnJk
JwTRc
TRm
Tbx
QcTRc
Jw
TRmQaf3
Qaf4 Jcd JctmJmt Jmt JctmJes
Jes
Jctm QTaf
Qu
Jmb Jms2,000
1,500
1,000
2,500
3,000
Cap rock
Cap rock
Feet
Cap rock
Jes
Meters
From Ross (unpublished UGS mapping).
Some thin surficial units not shown.Subsurface geometry of La Sal Mountains intrusion is highly speculative.
6,000
5,000
4,000
3,000
2,000
1,000
1,500
1,000
500
2,000
Jk
Jw
TRcuTRmu
Pc
TRml
IPp
Pc
PcPcPc
Pc TRm
TRm Qaf3 TRm
Jk
Jw
TRc
TRmu
Jn
TRml
QmsCastleCreek
CainHollowPlacer
Creek
Qaf3Qaf3 Qaf4
QTaf
C a s t l e V a l l e y
?
Tgc TgcTgc
QTu
Cap rockPossible fault blocks of
Triassic and Jurassic strata (Mz)
Bedding attitudes
40°
60°
80°
Tgc
Porcupine Rim Adobe Mesa
Mz Mz
7,000
FeetMeters
Tgc
Some thin surficial units not shown.
From Ross (unpublished UGS mapping).
6,000
5,000
4,000
3,000
2,000
1,000
1,500
1,000
500
Jk
JwTRcu
TRmu
TRml
Pcw?
Pc
Pc
Qafy Qa2 Qa1Qafo
Possible J, TR, and Pc stratain fault-bounded blocks
Pc?TRmu
TRml
TRms
TRclTRmp
JkJw
TRcu
Pariott Mesa
IPpIPp
C a s t l e V a l l e yPorcupine RIm
Cap rock
??
?
Meters Feet
Pc
Pc
Pc
TRml
PcPc
Pc
TRmu
Some thin surficial units not shown.
From Doelling and Ross (1988).
8,000
7,000
6,000
5,000
4,000
3,000
9,000
10,000
Some thin surficial units not shown.Subsurface geometry of La Sal Mountains intrusion is highly speculative.
Bend insection
unnameddrainage
La SalMts.LoopRoad
CastleCreek
Potentialwater-well
site B1
unnameddrainages
IPpIPp
Ttp
Cap rock
JkJwTRc
TRm
Jk
Jw
TRc
TRm
JnQu
Qu
QuJcd
Jes
Feet
2,000
1,500
1,000
2,500
3,000
Meters
Cross Section by Hurlow.
Jcd
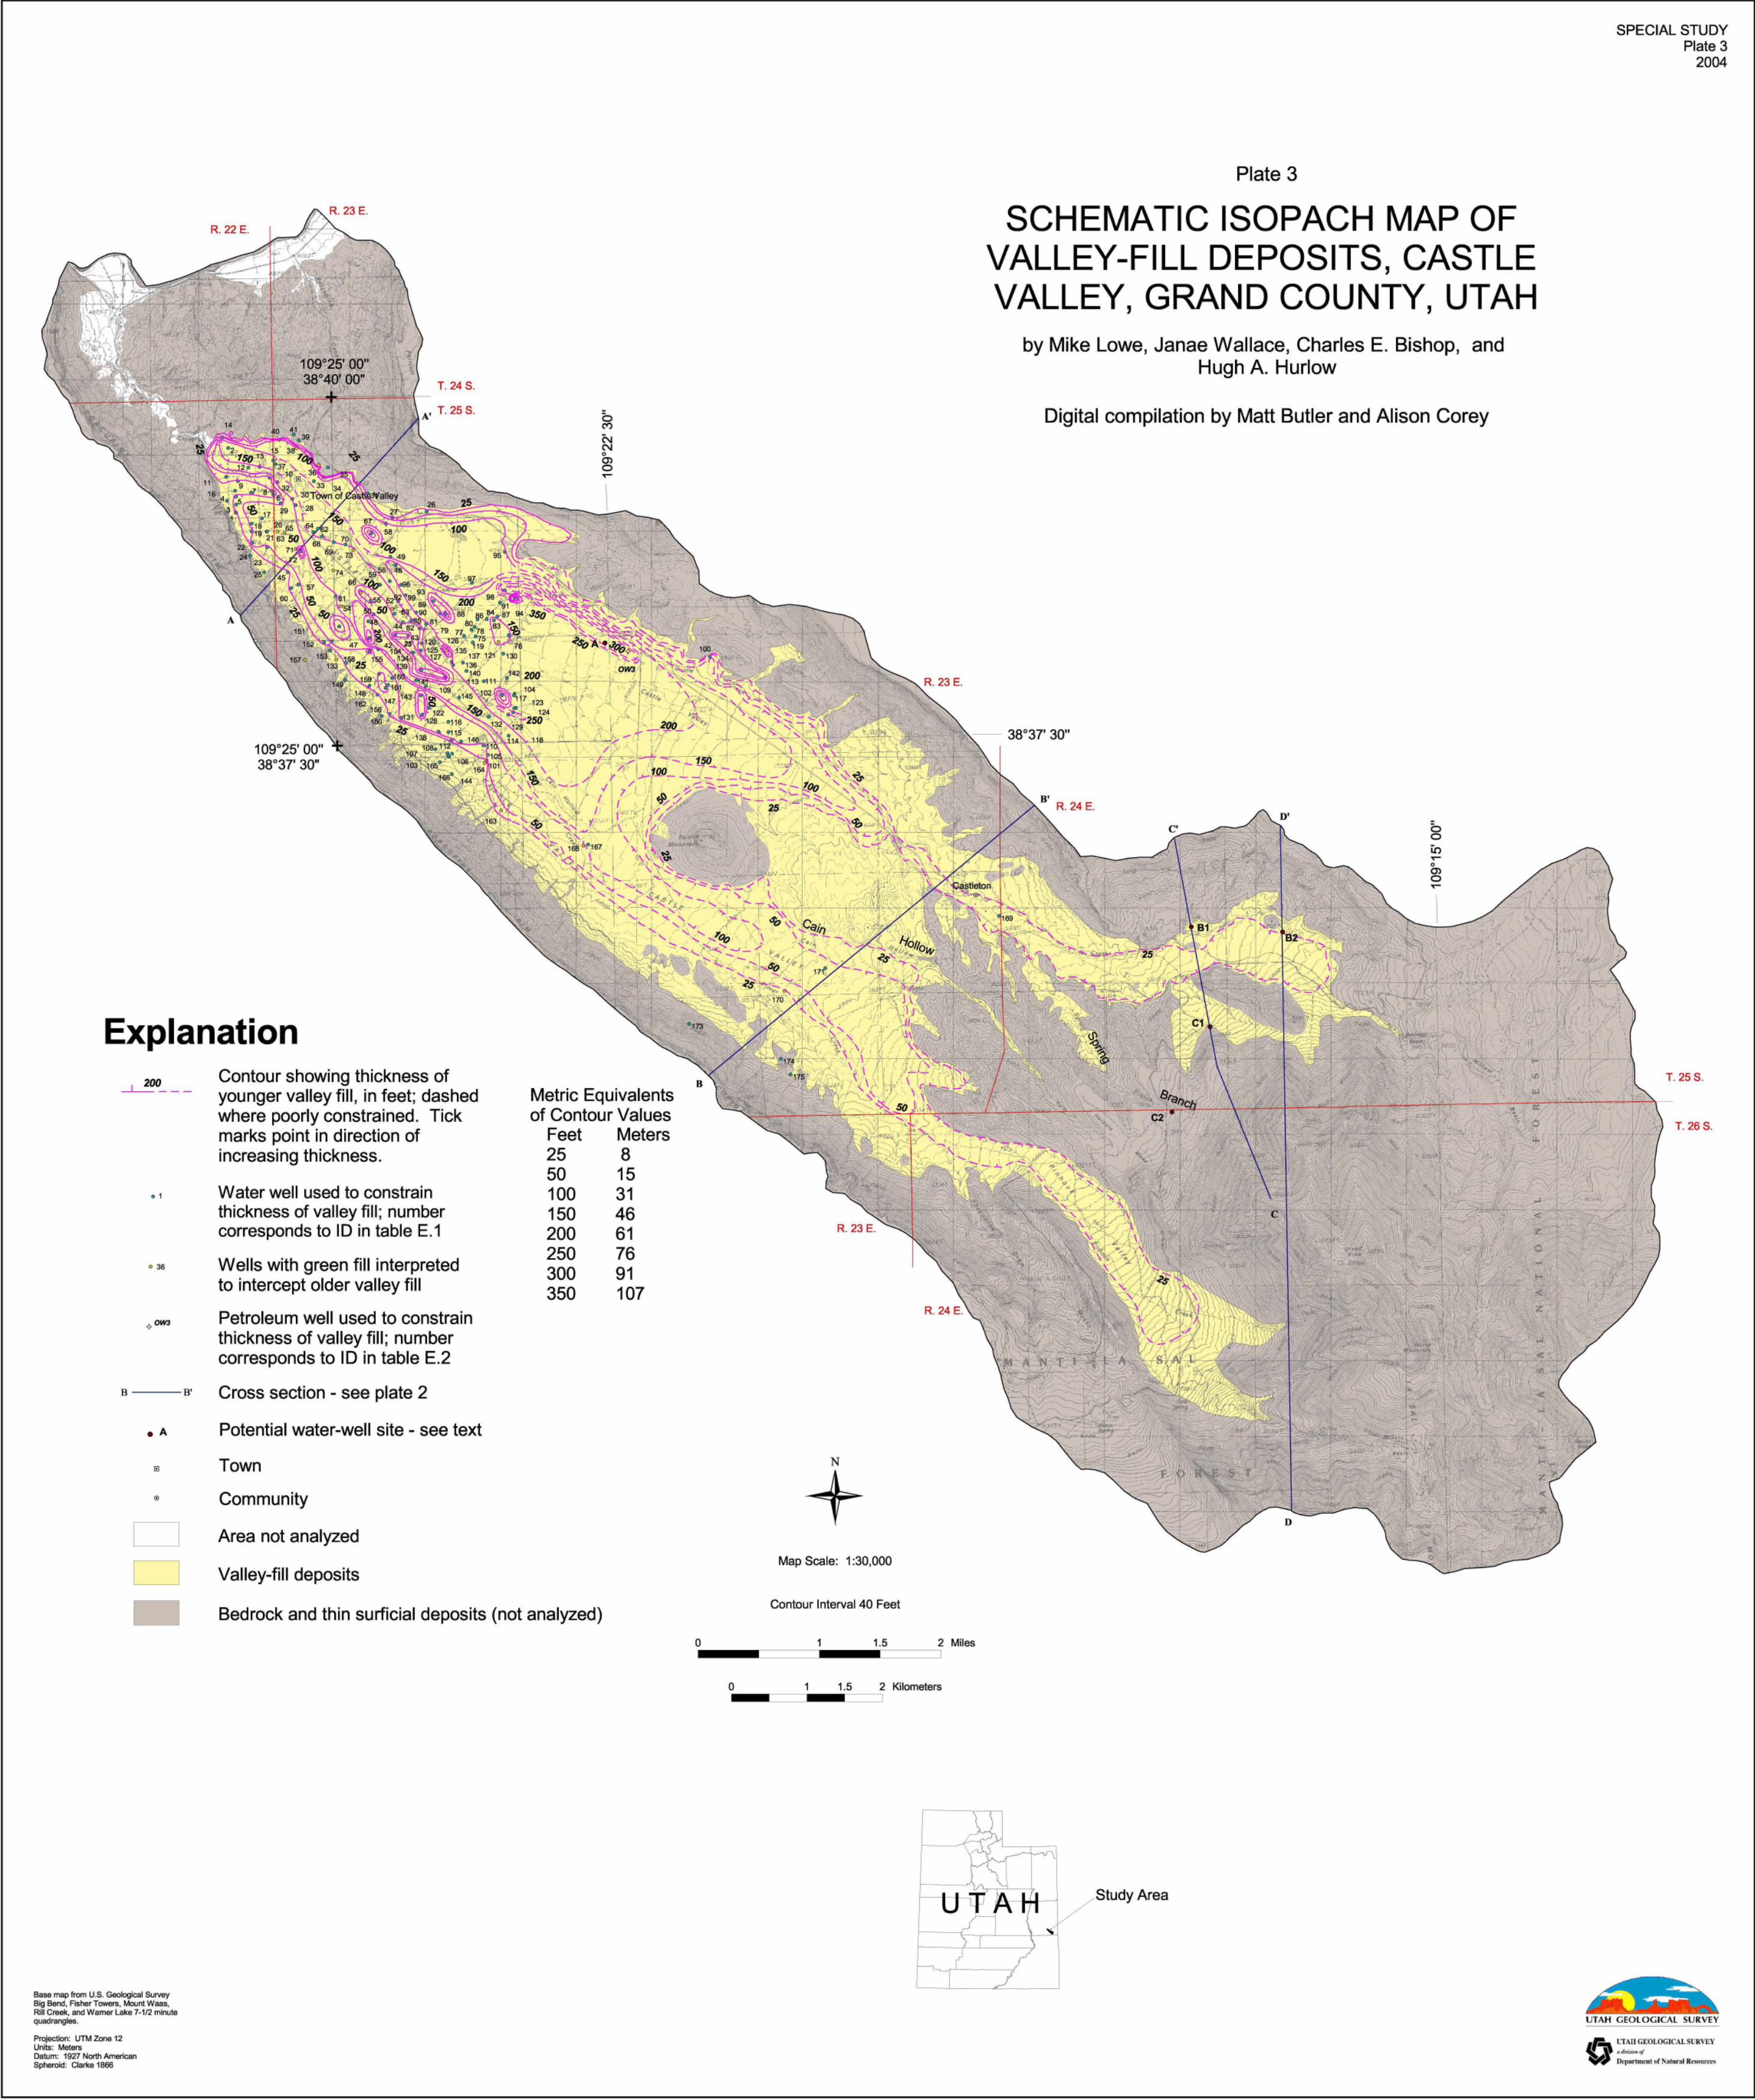
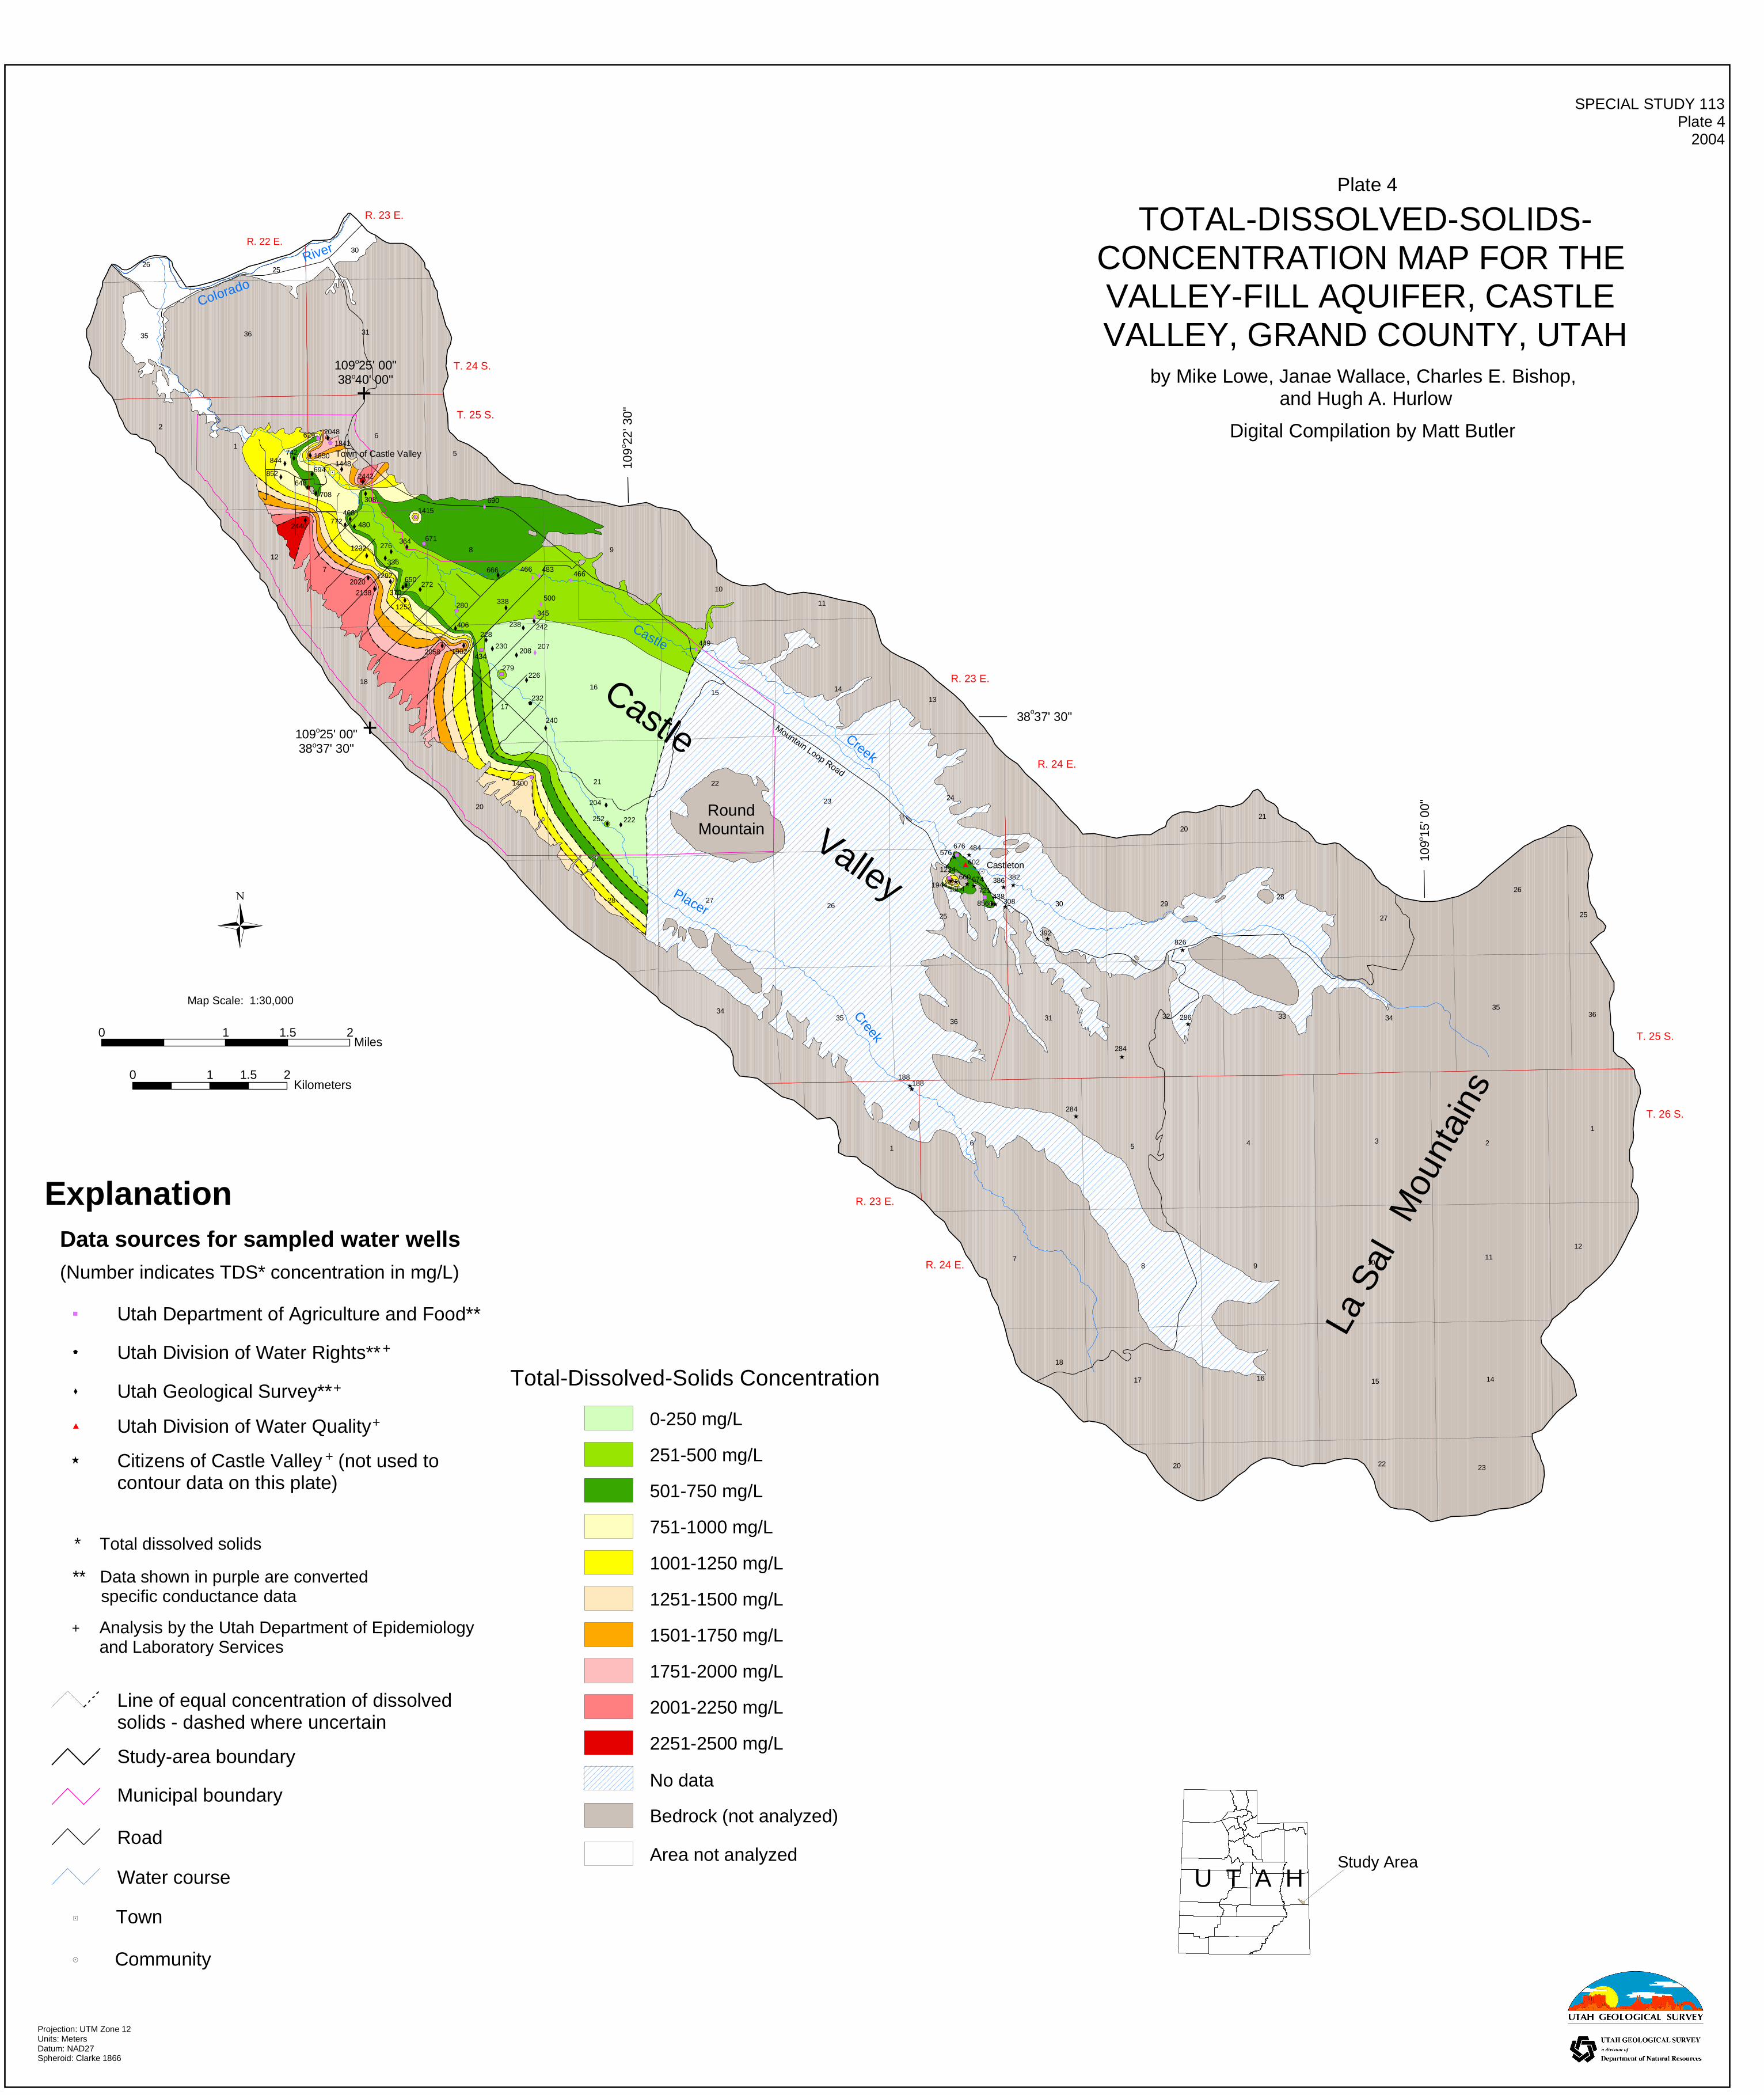
11
1841
2048629
1850742844
648
6948521448
2442
308
468
2440
708
671364
480772
1232 276
336666
280
272650
1252
370
12922020
2138
2058 1902
406
338
242238228
230208
226279
232
240
434
1400
204
222252
676
602
721
1234
856
35 36 31
30
2526
2
1
6
5
98
7
12
18
17
1615 14
20
21 22
23 24
13
28 2726
25
30 29
20
21
28
27
3435 36 31 32 33 34
34561
78 9 10
11
2
35
26
25
36
1
12
2322
1617
18
20
R. 22 E.
R. 23 E.
T. 24 S.
T. 25 S.
R. 23 E.
R. 24 E.
T. 25 S.
T. 26 S.
10
Castle
Creek
109
22' 3
0"o
38 37' 30"o
109
15' 0
0"o
Colorado
River
PlacerCreek
Castleton
Town of Castle Valley
Mountain Loop Road
15 14
109 25' 00"38 37' 30"o
o
109 25' 00"38 40' 00"o
o
109 25' 00"38 40' 00"o
o
109 25' 00"38 37' 30"o
o
RoundMountain
La S
al
Castle
Valley
R. 23 E.
R. 24 E.
6901415
466483466
500
345
449207
576484
386 382
438308
392
660 674
188188
284
284
286
826
1944 1364
Mou
ntai
ns
Explanation
Line of equal concentration of dissolved solids - dashed where uncertain
Water course
Data sources for sampled water wells
Utah Department of Agriculture and Food**
(Number indicates TDS* concentration in mg/L)
Municipal boundary
Road
Study-area boundary
** Data shown in purple are converted specific conductance data
* Total dissolved solids
Map Scale: 1:30,000
Town
Plate 4
Digital Compilation by Matt Butler
TOTAL-DISSOLVED-SOLIDS-CONCENTRATION MAP FOR THE VALLEY-FILL AQUIFER, CASTLE VALLEY, GRAND COUNTY, UTAH
by Mike Lowe, Janae Wallace, Charles E. Bishop, and Hugh A. Hurlow
Projection: UTM Zone 12Units: MetersDatum: NAD27Spheroid: Clarke 1866
SPECIAL STUDY 113 Plate 4
2004
Utah Division of Water Rights**+
Utah Division of Water Quality +
+ Analysis by the Utah Department of Epidemiology and Laboratory Services
Citizens of Castle Valley (not used tocontour data on this plate)
Total-Dissolved-Solids Concentration
0-250 mg/L
251-500 mg/L
501-750 mg/L
751-1000 mg/L
1001-1250 mg/L
1251-1500 mg/L
1501-1750 mg/L
1751-2000 mg/L
2001-2250 mg/L
2251-2500 mg/L
Bedrock (not analyzed)
Area not analyzed
No data
Utah Geological Survey**+
+
Community
Study AreaU T A H
Miles0 1 1.5 2
Kilometers0 1 1.5 2
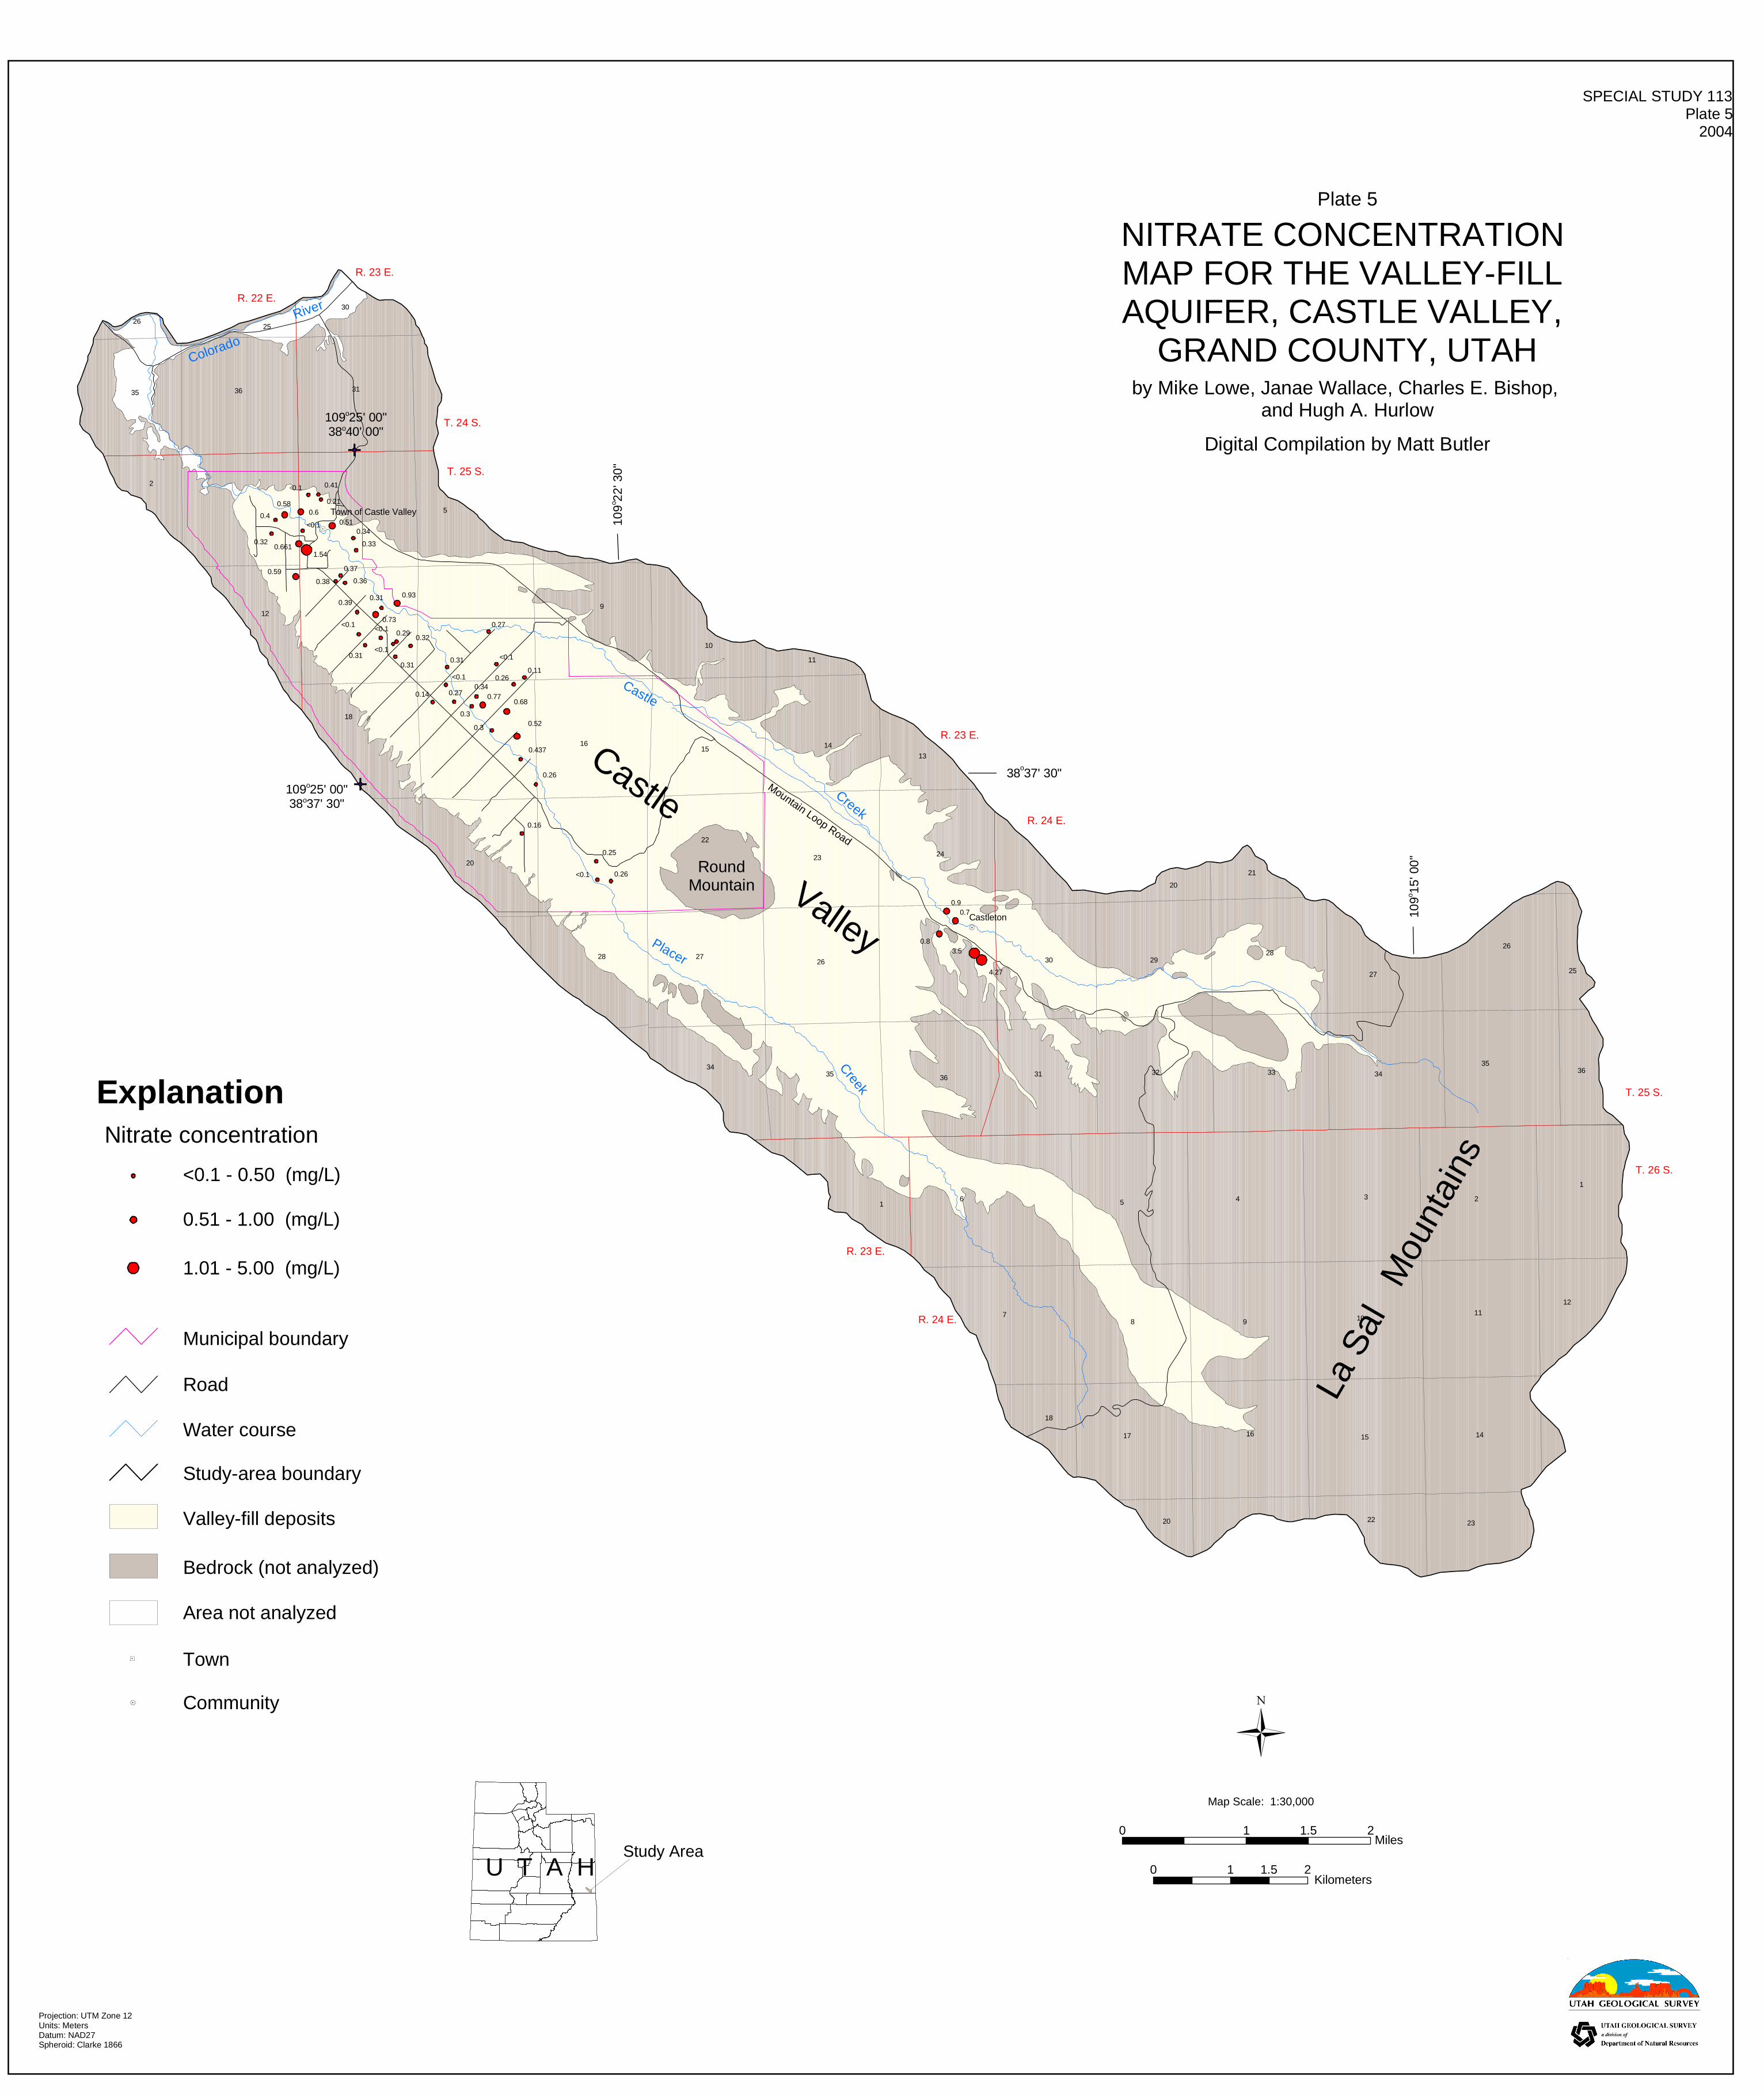
11
35 36 31
30
2526
2
5
912
18
1615 14
20
22
23 24
13
28 2726 30 29
20
21
28
27
3435 36 31 32 33 34
34561
78 9 10
11
2
35
26
25
36
1
12
2322
1617
18
20
R. 22 E.
R. 23 E.
T. 24 S.
T. 25 S.
R. 23 E.
R. 24 E.
T. 25 S.
T. 26 S.
10
Castle
Creek
109
22' 3
0"o
38 37' 30"o
109
15' 0
0"o
Colorado
River
0.90.7
0.83.5
4.27
0.26<0.1
0.25
0.16
0.26
0.437
0.1 0.41
0.21
0.60.58
0.4
0.32
<0.1 0.510.34
0.33
1.540.661
0.59 0.37
0.360.38
0.930.31
0.73
0.39
<0.1
0.31
<0.10.32
0.29
<0.1
0.31
0.27
0.31 <0.1
<0.10.11
0.26
0.680.270.14
0.340.77
0.3
0.3 0.52
Placer
CreekCastleton
Mountain Loop Road
15 14
109 25' 00"38 37' 30"o
o
109 25' 00"38 40' 00"o
o
Town of Castle Valley
RoundMountain
Castle
Valley
R. 23 E.
R. 24 E.La
Sal
Mou
ntai
ns
Explanation
Water course
Nitrate concentration
Municipal boundary
Road
<0.1 - 0.50 (mg/L)
0.51 - 1.00 (mg/L)
1.01 - 5.00 (mg/L)
Valley-fill deposits
Bedrock (not analyzed)
Study-area boundary
Map Scale: 1:30,000
Town
Area not analyzed
Plate 5
Digital Compilation by Matt Butler
NITRATE CONCENTRATION MAP FOR THE VALLEY-FILL AQUIFER, CASTLE VALLEY,
GRAND COUNTY, UTAHby Mike Lowe, Janae Wallace, Charles E. Bishop,
and Hugh A. Hurlow
Projection: UTM Zone 12Units: MetersDatum: NAD27Spheroid: Clarke 1866
SPECIAL STUDY 113 Plate 5
2004
Community
Study AreaU T A H
Miles0 1 1.5 2
Kilometers0 1 1.5 2
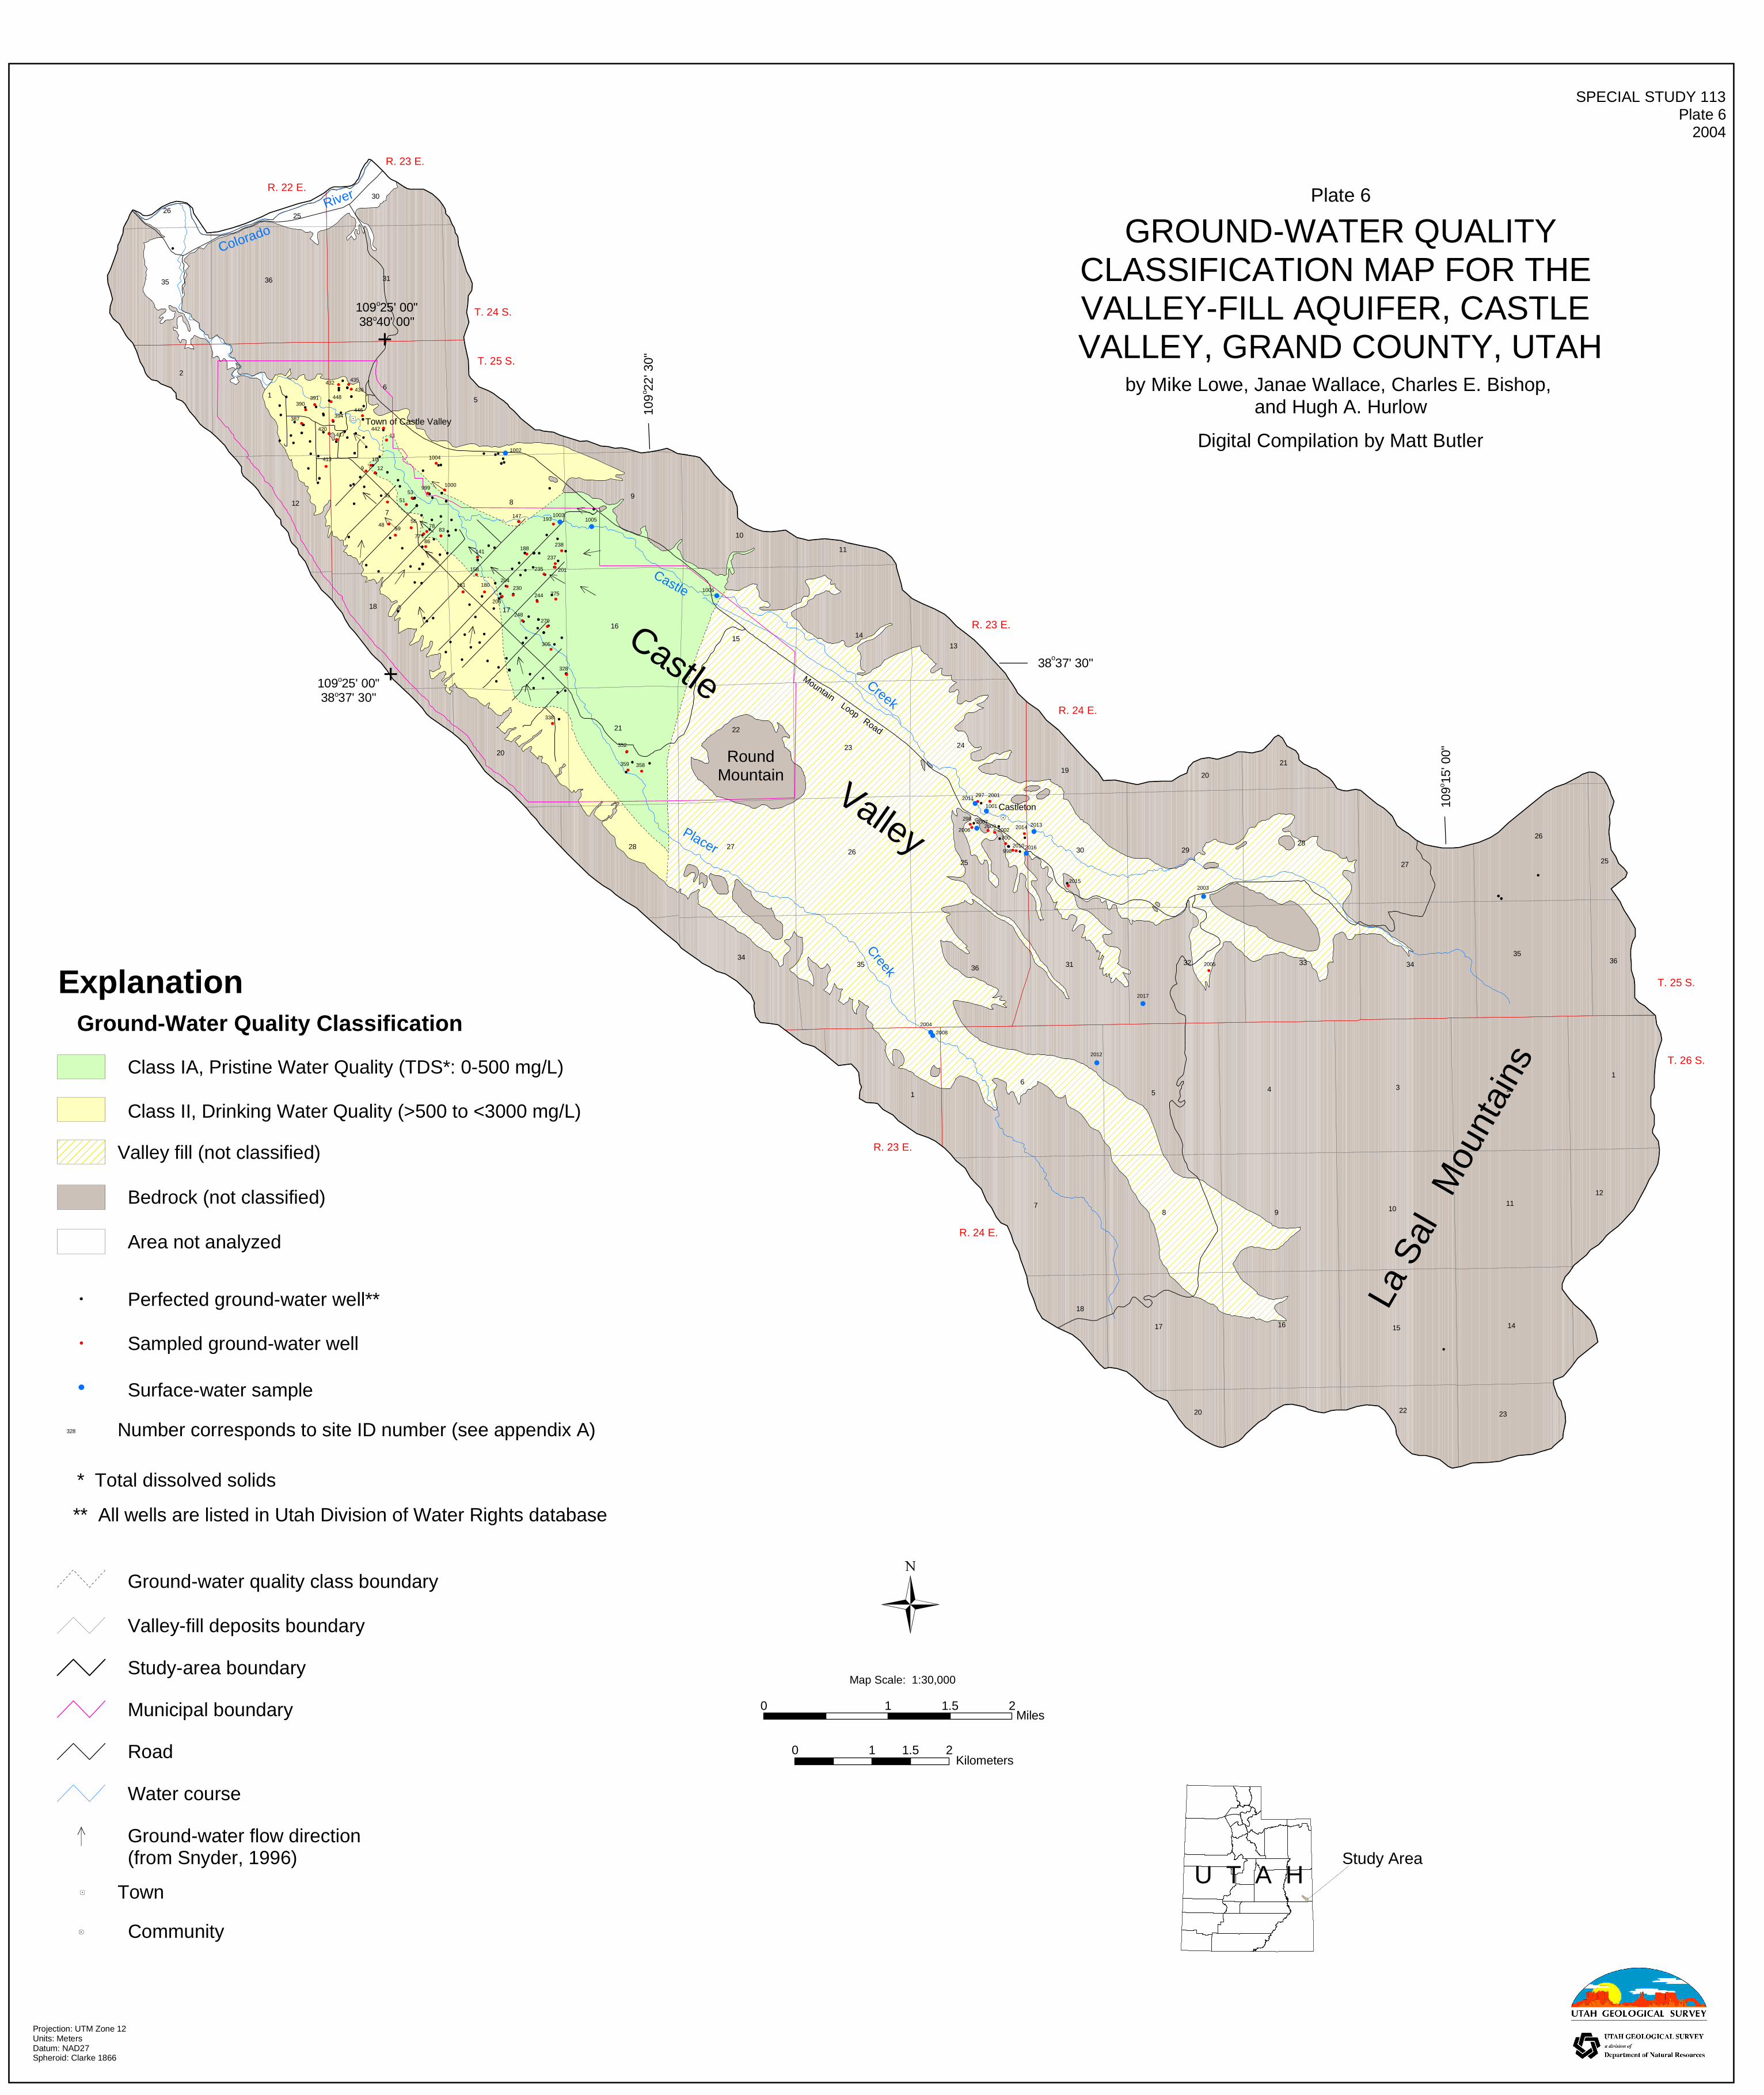
11
35 36 31
30
2526
2
16
5
98
712
17
16
15 14
20
21 22
23 24
13
28 2726
25
30 29
20
21
28
27
3435 36 31 32 33 34
345
6
1
78 9 10
11
2
35
26
25
36
1
12
2322
1617
18
20
R. 22 E.
R. 23 E.
T. 24 S.
T. 25 S.
R. 23 E.
R. 24 E.
T. 25 S.
T. 26 S.
10
Castle
Creek
38 37' 30"o
109
15' 0
0"o
Colorado
River
Mountain Loop Road
Placer
Creek
Town of Castle Valley
Castleton
15 14
RoundMountain
109 25' 00"38 40' 00"o
o
18
109 25' 00"38 37' 30"o
o
19
435
436432
448391390
387 394
420417
413
446
44211
10
129
100099953
5135
4859
5678
7786
83
141
147
158
161
188
201235
328
305
279
244
180230
204
206
248
338
352
359 358
297
Castle
Valley
R. 23 E.
R. 24 E.
10041002
10051003
193
238
237
2751006
2011 2001
1001
298
2006
20072009
2002
300
2013
20162010998
2014
20152003
2017
2005
2012
2004
2008
La S
alM
ount
ains
109
22' 3
0"o
ExplanationGround-Water Quality Classification
Surface-water sample
Sampled ground-water well
Perfected ground-water well**
Ground-water quality class boundary
Study-area boundary
Valley-fill deposits boundary
Municipal boundary
Road
Water course
Ground-water flow direction(from Snyder, 1996)
Bedrock (not classified)
Map Scale: 1:30,000
Class II, Drinking Water Quality (>500 to <3000 mg/L)
Class IA, Pristine Water Quality (TDS*: 0-500 mg/L)
* Total dissolved solids
** All wells are listed in Utah Division of Water Rights database
Town
Valley fill (not classified)
328 Number corresponds to site ID number (see appendix A)
Plate 6
Digital Compilation by Matt Butler
GROUND-WATER QUALITYCLASSIFICATION MAP FOR THE VALLEY-FILL AQUIFER, CASTLE VALLEY, GRAND COUNTY, UTAH
by Mike Lowe, Janae Wallace, Charles E. Bishop, and Hugh A. Hurlow
SPECIAL STUDY 113 Plate 6
2004
Area not analyzed
Projection: UTM Zone 12Units: MetersDatum: NAD27Spheroid: Clarke 1866
Community
Study AreaU T A H
Miles0 1 1.5 2
Kilometers0 1 1.5 2
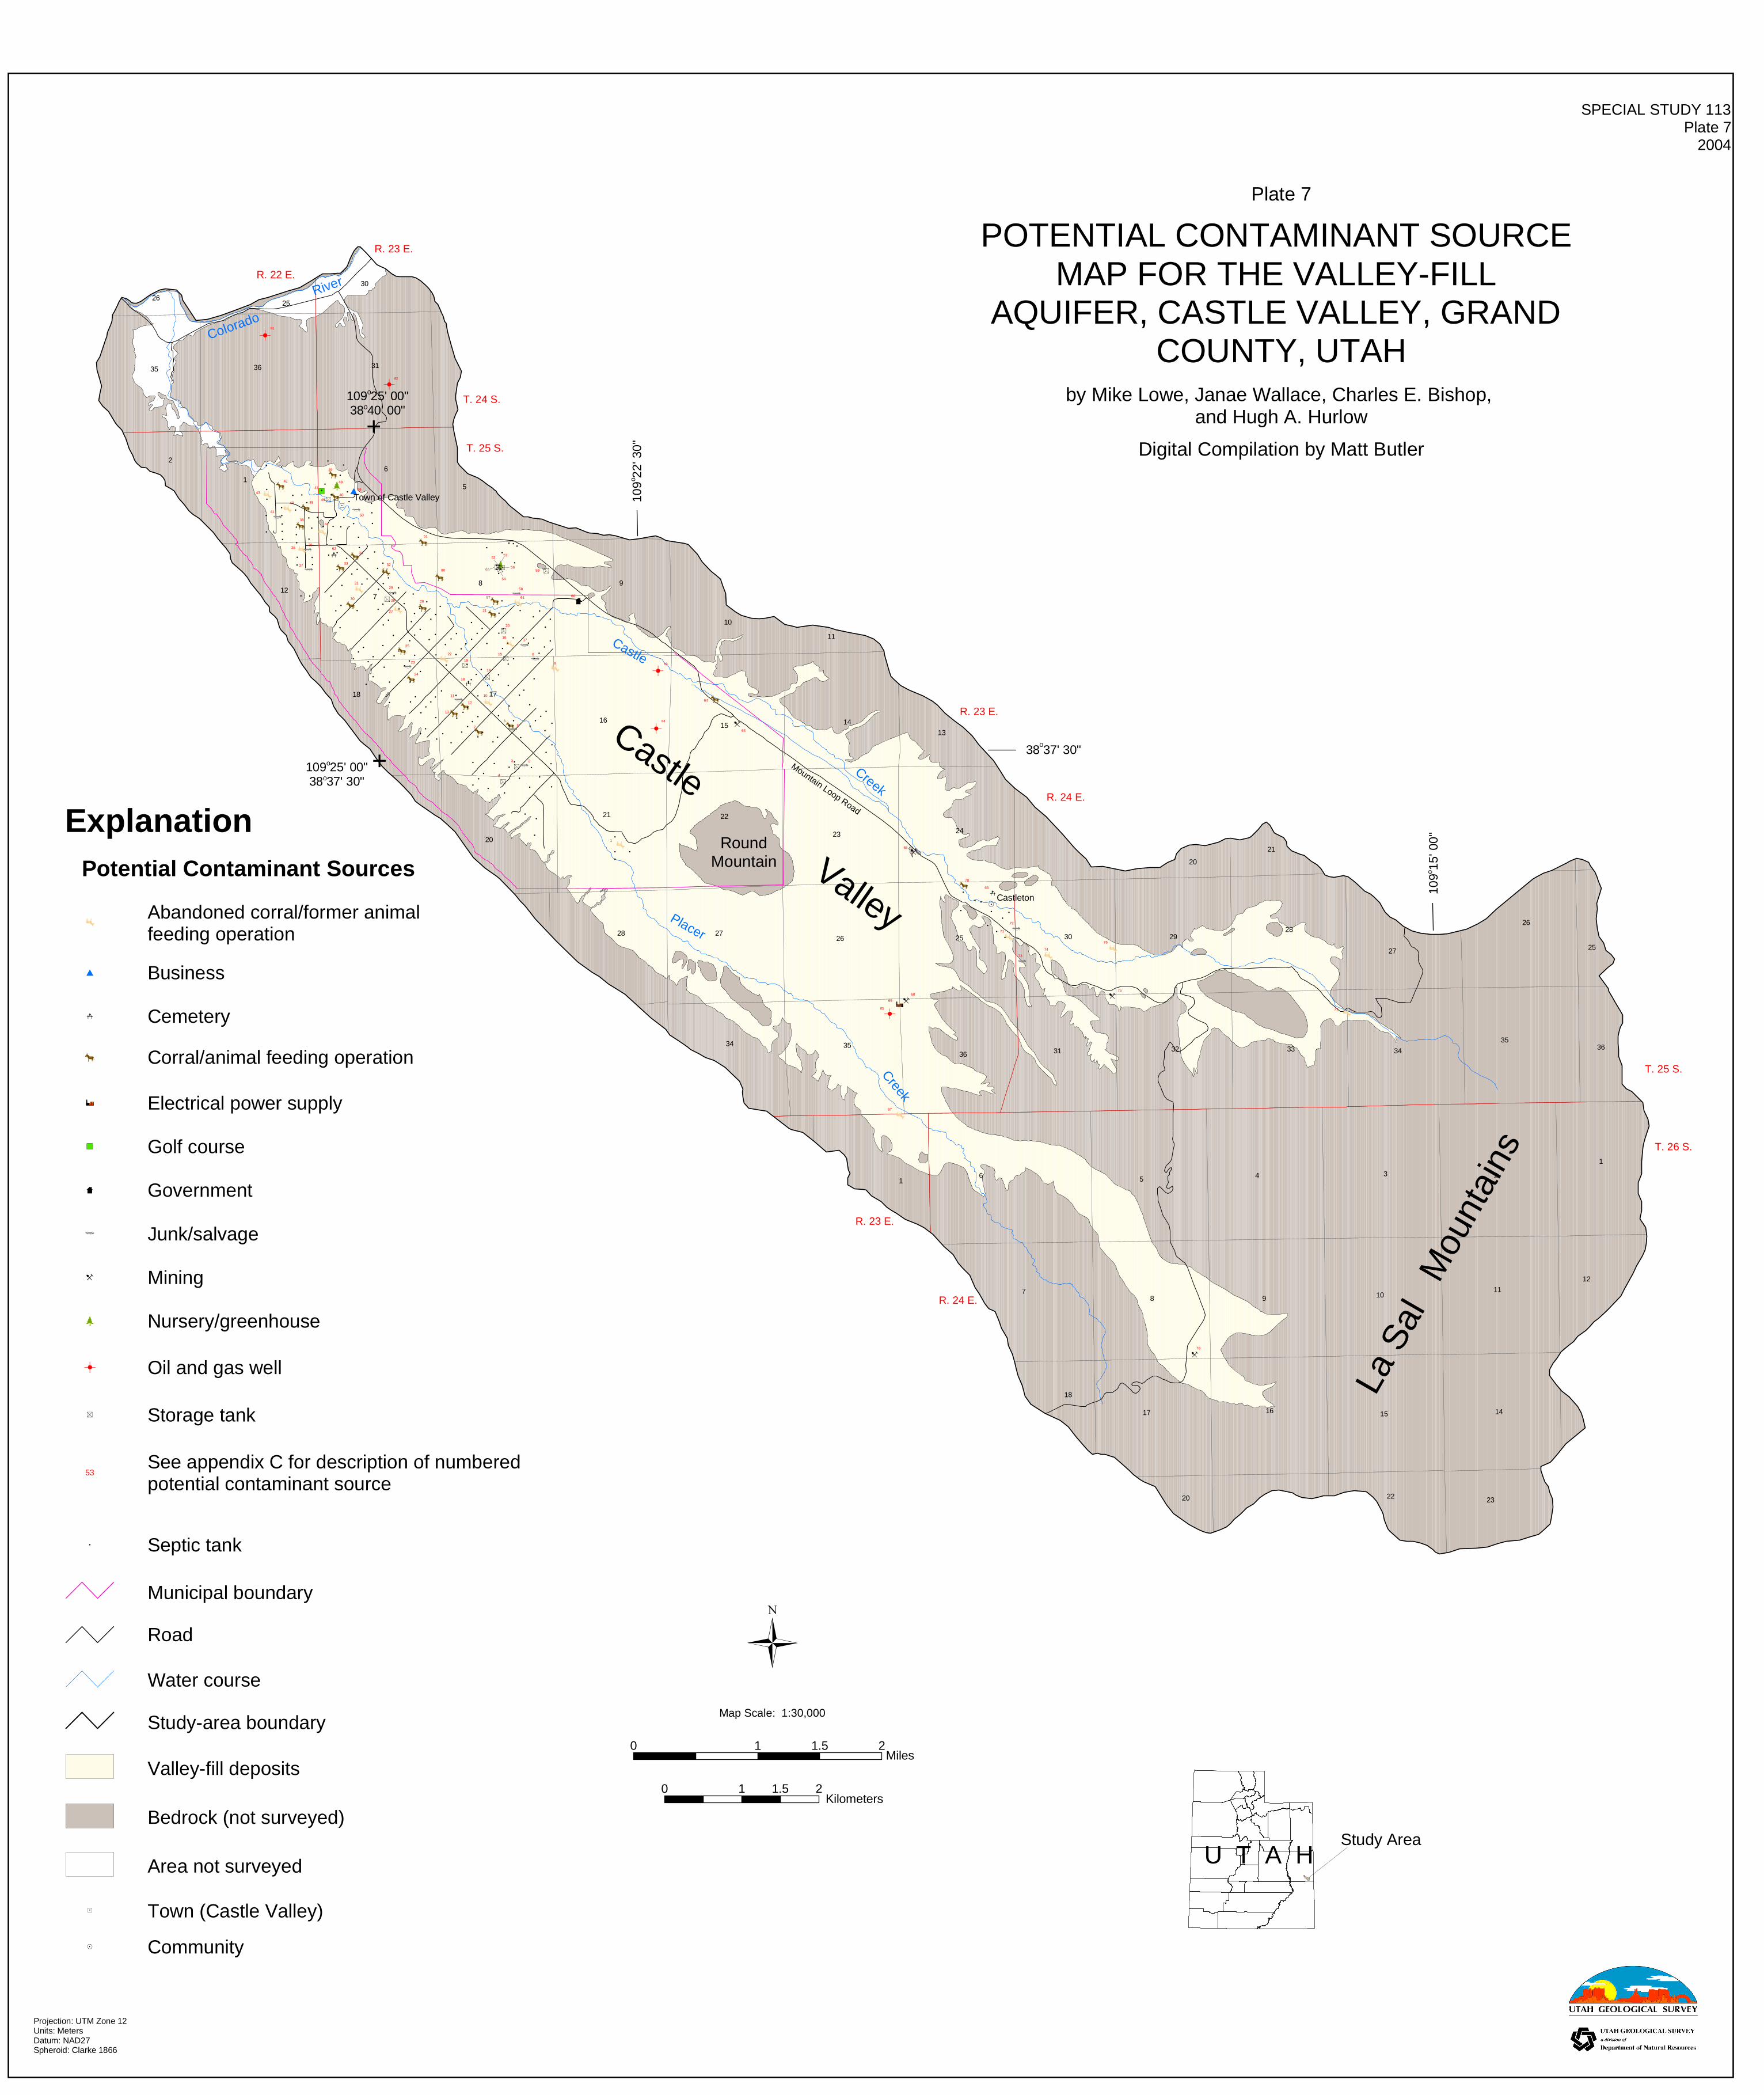
11
35 36 31
30
2526
2
1
6
5
98
712
18 17
1615 14
20
21 22
23 24
13
28 2726 25 30 29
20
21
28
27
34
36 31 32 33 34
34561
78 9 10
11
2
35
26
25
36
1
12
2322
1617
18
20
R. 22 E.
R. 23 E.
T. 24 S.
T. 25 S.
R. 23 E.
R. 24 E.
T. 25 S.
T. 26 S.
10
Castle
Creek
109
22' 3
0"o
38 37' 30"o
109
15' 0
0"o
Colorado
River
Placer
Creek
Town of Castle Valley
Mountain Loop Road
15 14
Castleton
109 25' 00"38 37' 30"o
o
109 25' 00"38 40' 00"o
o
81
82
84
85
35
83
RoundMountain
Castle
Valley
R. 23 E.
R. 24 E.
La S
alM
ount
ains
9
8
7
65
4
3 2
1
80
79
78
77
76
75
74
73
72
71
70
69
68
67
66
65
64
63
62
61 60
59
58
57
5655
54
5352
51
50
49
48
47
4645
44
43
42
41
40 39
38
37
3635
34
33 32
31
30
29
28
27
26
25
24
23
22
21
20
19
18
1716
15
14
13
12
11 10
Explanation
Water course
Potential Contaminant Sources
Municipal boundary
Road
Valley-fill deposits
Bedrock (not surveyed)
Abandoned corral/former animal feeding operation
Business
Cemetery
Electrical power supply
Golf course
Government
Junk/salvage
Mining
Nursery/greenhouse
Septic tank
Storage tank
53See appendix C for description of numbered potential contaminant source
Area not surveyed
Study-area boundary
Corral/animal feeding operation
Town (Castle Valley)
Map Scale: 1:30,000
Oil and gas well
Plate 7
Digital Compilation by Matt Butler
POTENTIAL CONTAMINANT SOURCE MAP FOR THE VALLEY-FILL
AQUIFER, CASTLE VALLEY, GRAND COUNTY, UTAH
by Mike Lowe, Janae Wallace, Charles E. Bishop, and Hugh A. Hurlow
Projection: UTM Zone 12Units: MetersDatum: NAD27Spheroid: Clarke 1866
SPECIAL STUDY 113 Plate 7
2004
Community
Study AreaU T A H
Miles0 1 1.5 2
Kilometers0 1 1.5 2