Embed Size (px)
Citation preview
Ground Snow Loads for Idaho: 2015
Hussain Al Hatailah
Bruce R. Godfrey
Ronald L. Sack
Richard J. Nielsen
University of Idaho Department of Civil Engineering
Moscow, Idaho 83843
© 2015 Board of Regents of the University of Idaho.
2
TABLE OF CONTENTS
PREFACE ............................................................................................................................3
1.0 Introduction ....................................................................................................................4
2.0 The First Idaho Study--1976 ..........................................................................................4
3.0 The Second Idaho Study--1986 .....................................................................................5
3.1 Exceptions for the 1986 Idaho Report....................................................................... 7
4.0 The 2015 Idaho Study ....................................................................................................7
4.1 Exceptions for the 2015 Study .................................................................................. 8
5.0 Summary and Conclusions ............................................................................................9
6.0 References ....................................................................................................................11
Appendix 1. Ground Snow Loads for Idaho Cities and Towns--2015 .............................12
Appendix 2. Ground Snow Loads for Idaho Cities and Towns—1976; 1986; 2015 ........20
FIGURE
Figure 3.1: The Rocky Mountain Conversion Density ....................................................... 6
TABLE
Table 4.1: Snow Records for 2015 Idaho Report ............................................................... 8
3
PREFACE
The American National Standards Institute and subsequently, the American Society of
Civil Engineers mapped the ground snow loads for the nation, but deferred to local
knowledge and case studies in the western U.S As a result many of the western States
have written reports to describe the ground snow loads produced by the varied terrain and
complex weather patterns. In 1976 we published the first comprehensive report of
ground snow loads for Idaho, which was updated in 1986 with an expanded data base and
loads associated with a two percent chance that the value will be exceeded in a given year
(also known as a 50-year mean recurrence interval); we used a three percent chance in the
1976 study.
The database for this 2015 study contains 31 additional years of record from the National
Weather Service (NWS) and the National Resources Conservation Service (NRCS),
formerly the Soil Conservation Service (SCS). We used a total of 408 stations within
Idaho and 260 additional stations located in bordering states. As in the 1986 study we
used the Rocky Mountain Conversion Density (RMCD) to obtain loads from the snow
depths recorded by the NWS Coop stations, and mapped the Normalized Ground Snow
Loads (NGSL). Appendix 1 lists the ground snow loads for Idaho towns and cities by
county. Several areas exhibited exceptions to the mapped values; consequently we have
provided Appendix 2 that compares the 1976, 1986 and 2015 loads, and it includes notes
to aid in interpreting any mapping exceptions and/or values that have changed
significantly from previous studies. We envision that the notes will be useful to the user
in interpreting loads for sites that are not specifically documented.
The 31 years of additional data, plus new Idaho stations and also stations from bordering
states produced results slightly different from those of our previous studies as shown in
Appendix 2. For this study, the counties of Ada, Bannock, Benewah, Bingham, Butte,
Clark, Clearwater, Jefferson, Jerome, Minidoka, and Payette did not show significant
changes from the 1986 report. The Washington-Idaho State line shows improved
agreement for towns near the state border. Also, there are generally small differences in
the studies for neighboring States at the Idaho-Oregon and Idaho-Montana borders.
Since this study focuses only on the ground snow loads, we have not included
information on the ground-to-roof conversion factors, which can be found in the
ASCE/SEI 7 Standard.
We urge our readers to use the information with care. The uncertainties associated with
snow should suggest that the scatter in the data could be large in spite of our many
efforts. For unusual structures or siting we suggest that all available information be
considered in determining the snow loads. Finally, we remind the user that the design
snow loads are the ultimate responsibility of the person in charge of the project.
May 2015
Moscow, Idaho
4
Ground Snow Loads for Idaho: 2015
By
Hussain Al Hatailah, Bruce R. Godfrey, Ronald L. Sack, and Richard J. Nielsen
1.0 Introduction
Snow loading can constitute the most severe test of structural integrity for structures that
are constructed in areas where large accumulations of snow are encountered. Economical
structural design in these areas requires an accurate prediction of the ground snow, plus
an understanding of how the snow is distributed on the structures. The Natural Resources
Conservation Service (NRCS) and the National Weather Service (NWS) are the two
principal agencies gathering ground snow data in the western U.S. (the West). The
American Society of Civil Engineers (ASCE) has mapped the ground snow loads for the
U.S. (ASCE/SEI 7-10 2010) but has not defined ground snow loads in most of the West,
where the national standard defers to local knowledge and case studies. The varied
terrain and complex weather patterns in the West result in extreme variations in ground
snow between the valleys, plains and mountains; it is insufficient to rely on simplified
measures such as using a standard lapse rate.
2.0 The First Idaho Study--1976
The first comprehensive study of ground snow for Idaho (Sack and Rusten 1976) and
(Rusten, Sack and Molnau 1980) used data from 279 snow course stations of the Soil
Conservation Service (SCS), which is now the NRCS. All of these stations were in Idaho
with the exception of 28 in Montana and seven in Wyoming. Each snow course had
seven or more years of record. Maximum-recorded weights of snow on the ground were
selected from records taken during the seasons from 1927 to 1975. The annual maximum
values of snow-water equivalent for each station were analyzed for a 30-year mean
recurrence interval (MRI, i.e., an annual probability of 0.033 that the ground snow is
exceeded) using a log Pearson type III frequency analysis. Additionally snow depth data
were used from 126 National Weather Service (NWS) stations within the state. These
data were also analyzed for a 30-year MRI. But these data can only yield useful results if
a specific gravity is assigned to the depths. Canada initially adopted a constant specific
gravity of 0.192 for all locations and added the maximum 24-hour rain occurring during
the winter months. The 1976 Idaho study used a value of 0.385 to convert the NWS
depths to loads. The value of 0.385 was obtained from the mean specific gravity of the
270 SCS stations within the region. The NWS depth data were used only if the SCS data
were sparse in a particular location. The station-specific extreme values were spatially
extrapolated using normalized ground snow loads (NGSL). Normalized ground snow
load (NGSL) contours are used by Idaho, Montana, and Washington. For this technique
the snow load at each measurement site (in units of force per area) is divided by the
5
elevation of the station in feet to give a quasi-normalized quantity in units of psf/ft.
These quantities appear to have no obvious physical significance, but the process in effect
reduces the entire area to a common base elevation. This procedure masks out the effect
of the environment on the snowmaking mechanism and gives single-valued contours that
are impossible to obtain without normalization. The ground-to-roof conversion factors
recommended in the 1976 study were those obtained by the National Research Council of
Canada and published in the American National Standards Institute A58.1-1972 (ANSI
1972).
3.0 The Second Idaho Study--1986
Various factors prompted updating the 1976 Idaho study. This was an opportunity to: (a)
update all annual maxima for the Idaho SCS and NWS stations; (b) include more stations
from surrounding states and (c) examine the issue of an appropriate specific gravity for
the NWS snow depth data. We used a total of 514 stations from both SCS and NWS for
the 1986 study. The 375 SCS stations were composed of 234 from Idaho, 93 from
Montana, 30 from Oregon and 18 from Washington. All Idaho snow courses included in
the study had a minimum of 10 years of record. The maximum-recorded weights of snow
on the ground were selected from records taken during the following snow seasons:
Idaho (1927-1983); Montana (1922-1974); Oregon (1928-1972); and Washington (1915-
1969). Additionally, snow depth data were available from 138 NWS stations in Idaho
(1927-1981) plus the first-order station in Spokane, Washington. The Idaho NWS first-
order stations in Boise, Lewiston, and Pocatello are included in the total NWS Idaho
stations.
The 1982 countrywide ANSI map is based on an annual probability of being exceeded
equal to 0.02 (50-year MRI), and we envisioned that the Idaho map should use this same
MRI. Annual probabilities of being exceeded ranging from 0.01 to 0.04 have been used
in the United States, but the trend is to standardize on the single value of 0.02. The MRI
is the reciprocal of the annual probability of being exceeded. Thus, a 50-year MRI
corresponds to an annual probability of being exceeded of 2 percent. It is important to
note, for example, that during a 50-year period, there is a 63.6 percent chance of
exceeding the value designated by the 2 percent annual probability of exceedance. In
order to conform to the value used in the West and also in the standard for this report the
annual maximum values of snow-water equivalent for each station were analyzed for a
50-year MRI using a log Pearson type III frequency analysis. Additionally snow depth
data were used from 126 NWS stations within the state. These data were also analyzed
for a 50-year MRI, as were the depths and snow-water equivalent for the first-order
Spokane station and the three Idaho first-order stations,
The snow depths recorded for the majority of the NWS stations, that is for the
Cooperative Observation Network (i.e., NWS Coop stations) constitute a potentially
useful set of information, but their use requires an estimate of the specific gravity of the
snow at each station to convert the NWS depths to loads. The methodology used by
6
ANSI for the United States involved plotting the 50-year MRI ground snow depths
against the 50-year MRI ground snow loads for the 184 first-order NWS stations. The
resulting nonlinear regression curve relating these extreme values was used to predict
ground snow loads for the NWS Coop stations nationwide.
It was envisioned that the value of the specific gravity of 0.385 used in the 1976 Idaho
study is probably accurate for mountainous locations where the snow compacts
throughout the winter, but it is probably not representative for sites in valleys and plains
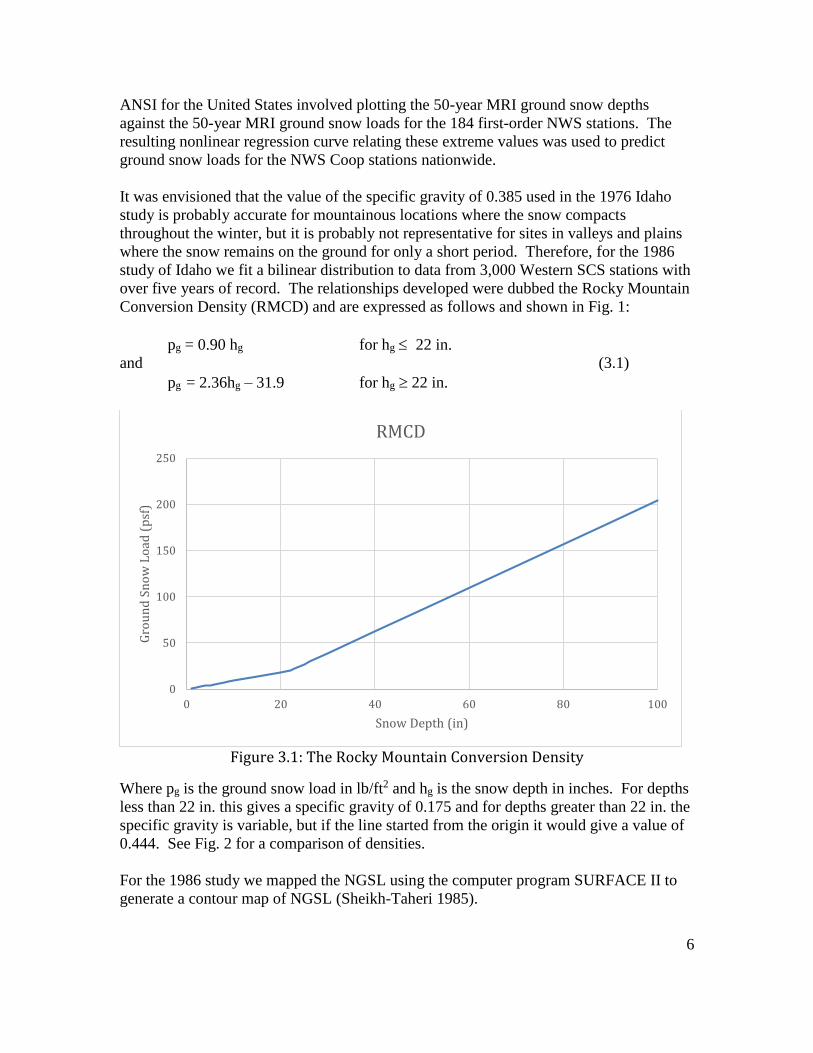
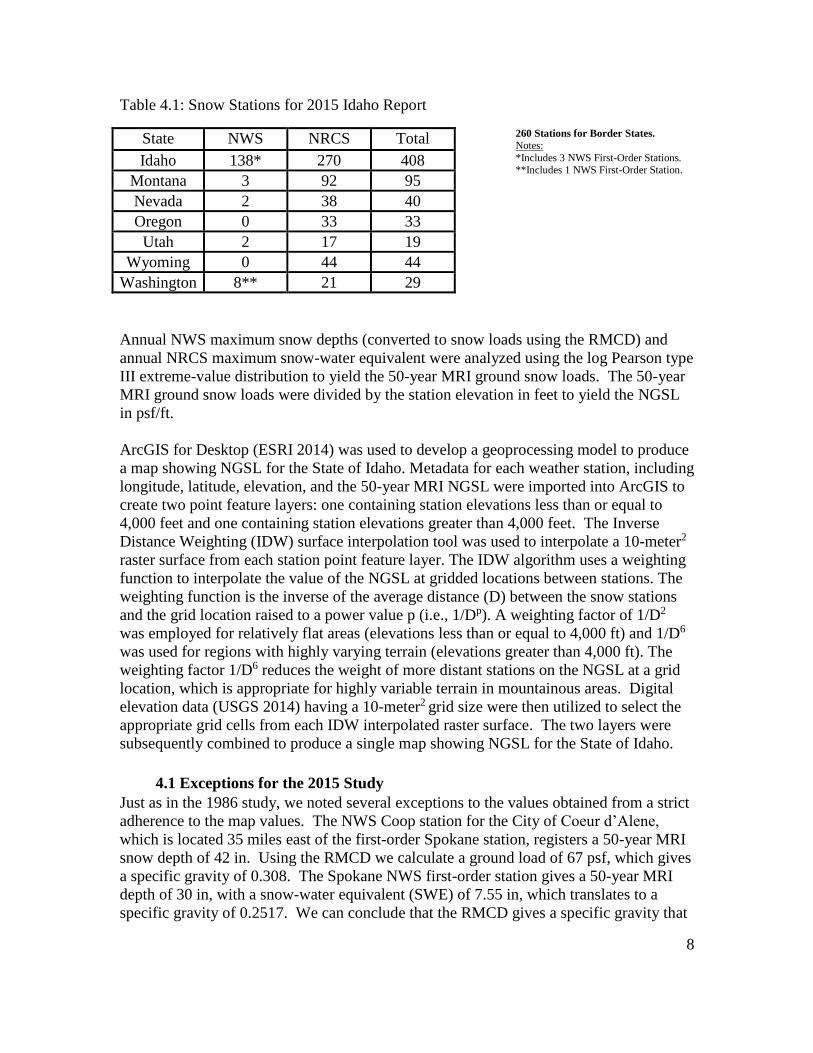
where the snow remains on the ground for only a short period. Therefore, for the 1986
study of Idaho we fit a bilinear distribution to data from 3,000 Western SCS stations with
over five years of record. The relationships developed were dubbed the Rocky Mountain
Conversion Density (RMCD) and are expressed as follows and shown in Fig. 1:
pg = 0.90 hg for hg 22 in.
and (3.1)
pg = 2.36hg – 31.9 for hg 22 in.
Figure 3.1: The Rocky Mountain Conversion Density
Where pg is the ground snow load in lb/ft2 and hg is the snow depth in inches. For depths
less than 22 in. this gives a specific gravity of 0.175 and for depths greater than 22 in. the
specific gravity is variable, but if the line started from the origin it would give a value of
0.444. See Fig. 2 for a comparison of densities.
For the 1986 study we mapped the NGSL using the computer program SURFACE II to
generate a contour map of NGSL (Sheikh-Taheri 1985).
0
50
100
150
200
250
0 20 40 60 80 100
Gro
un
d S
no
w L
oad
(p
sf)
Snow Depth (in)
RMCD
7
3.1 Exceptions for the 1986 Idaho Report
Some exceptions to the contour lines were noted during the mapping process. The map
produced ground snow loads for cities and towns; these loads were compared to the input
data to check the accuracy of the mapping. We checked the areas that were not
represented accurately by the contours and studied these in more detail. One such area
was Coeur d’Alene where the RMCD proved to be inadequate for predicting snow loads
from the snow depths of the NWS. Therefore, we obtained a factor to convert the
maximum depth to the maximum load at this station. The maximum annual water
equivalents were selected from the Spokane first-order NWS station for the past 28 years
and the 50-year MRI value was calculated. Similarly, maximum annual snow depths
were analyzed and the 50-year MRI snow depth was obtained. Both extreme values were
computed using the log Pearson type III frequency analysis. A conversion factor of 0.233
was calculated for Spokane by dividing the extreme value of water equivalent by the
extreme value of depth. This value was applied to the NWS depth at the Coeur d’Alene
station. Snow-water equivalents for Boise, Lewiston and Pocatello were used at these
first-order stations and the NWS values were disregarded.
Another type of exception was noted for locations where the NGSL was known and could
not be represented by a contour line. One of these exceptions occurred at Riggins (an
NWS Coop station) and another at Bear Mountain (an SCS station). The NGSL for
Riggins is 0.005, and the contour lines around this town were between 0.025 and 0.030.
Similarly, the value of NGSL for Bear Mountain is 0.120, and the contours around it have
a value of 0.055. Since the contour interval is 0.005, this difference in values cannot be
shown without adding more contours, which is untenable. Therefore, the value of the
NGSL for such locations were noted as exceptions, and these are represented on the map
by a + sign accompanied by the NGSL value. The map and report are available online
(Sack and Sheikh-Taheri 1986).
4.0 The 2015 Idaho Study
The 1986 study included the records up to 1983 and excluded stations with fewer than ten
years of data; whereas this 2015 study includes 31 more years of record from the NWS
and NRCS, plus it incorporates stations introduced since 1983 and also the SNOTEL
stations. This study also includes 260 stations from the neighboring States of Montana,
Nevada, Oregon, Utah and Washington. Details of this study and all the metadata for
Idaho are contained in a M.S. thesis (Hussain Al Hatailah 2015).
The NRCS records data consisting of snow-water equivalent through the snow course
monthly measurements and the SNOTEL stations, which are continuously monitored
remotely. The NWS maintains the Coop stations where only snow depths are measured
daily; they also support the first-order stations, which measure daily snow depth and
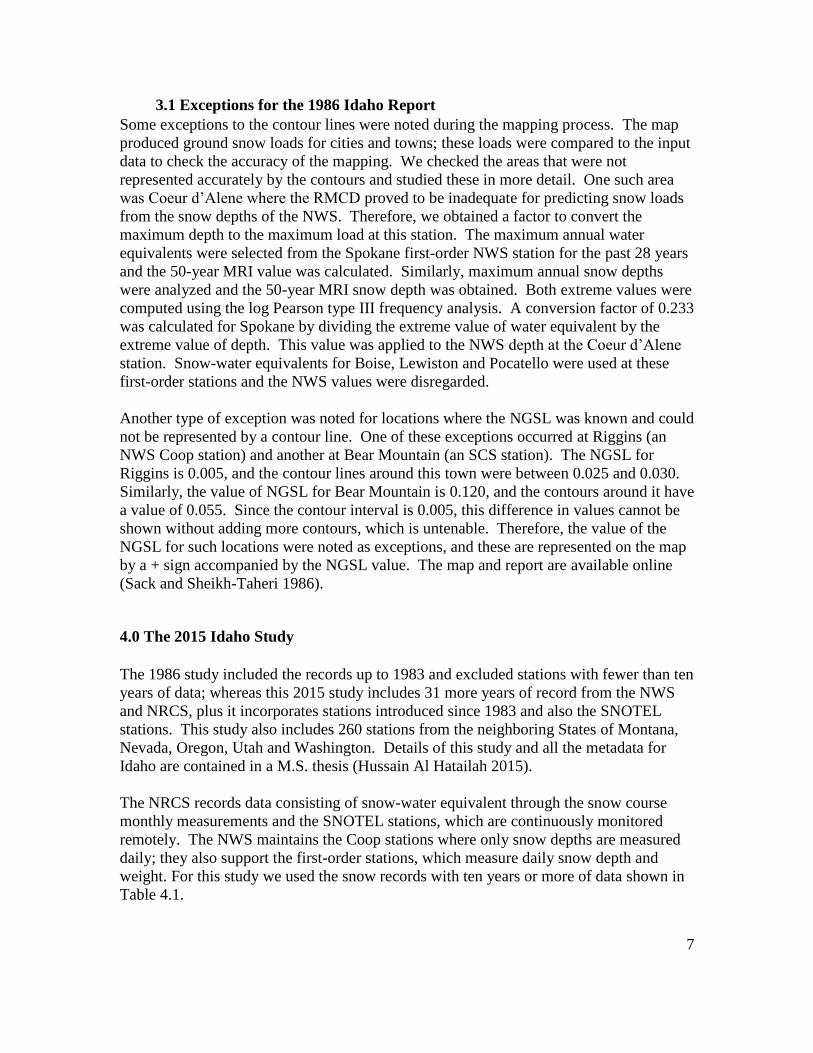
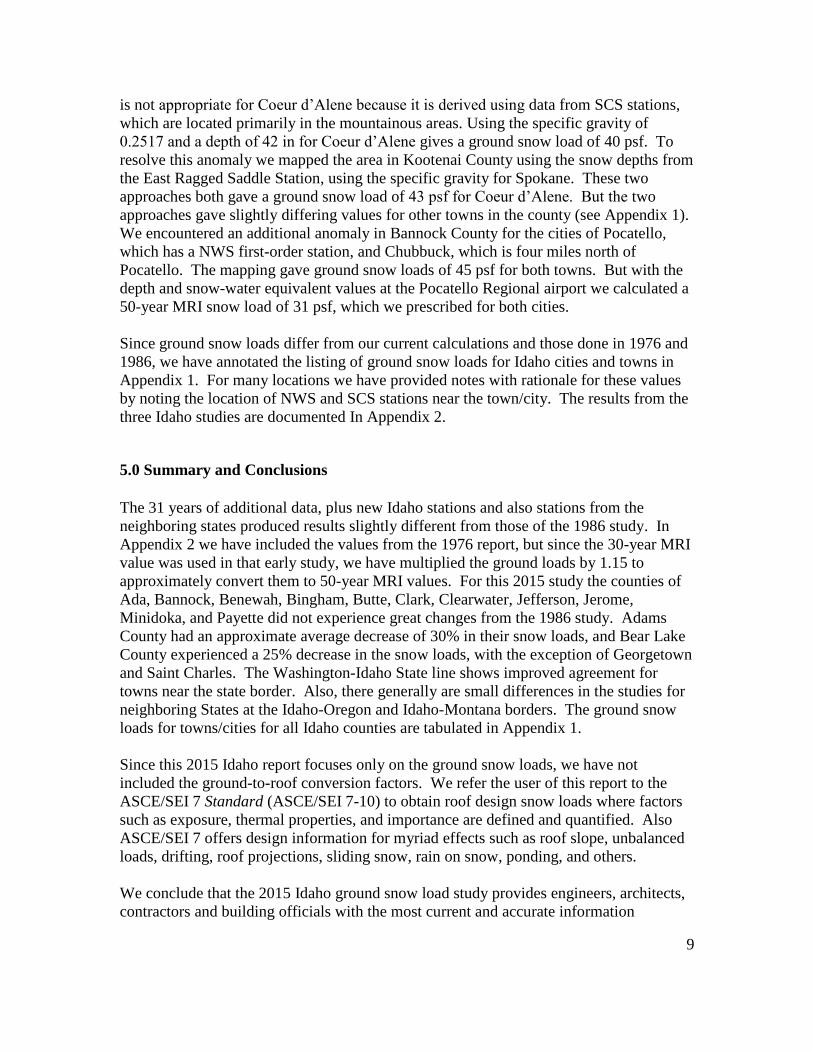
weight. For this study we used the snow records with ten years or more of data shown in
Table 4.1.
8
Table 4.1: Snow Stations for 2015 Idaho Report
260 Stations for Border States.
Notes:
*Includes 3 NWS First-Order Stations. **Includes 1 NWS First-Order Station.
Annual NWS maximum snow depths (converted to snow loads using the RMCD) and
annual NRCS maximum snow-water equivalent were analyzed using the log Pearson type
III extreme-value distribution to yield the 50-year MRI ground snow loads. The 50-year
MRI ground snow loads were divided by the station elevation in feet to yield the NGSL
in psf/ft.
ArcGIS for Desktop (ESRI 2014) was used to develop a geoprocessing model to produce
a map showing NGSL for the State of Idaho. Metadata for each weather station, including
longitude, latitude, elevation, and the 50-year MRI NGSL were imported into ArcGIS to
create two point feature layers: one containing station elevations less than or equal to
4,000 feet and one containing station elevations greater than 4,000 feet. The Inverse
Distance Weighting (IDW) surface interpolation tool was used to interpolate a 10-meter2
raster surface from each station point feature layer. The IDW algorithm uses a weighting
function to interpolate the value of the NGSL at gridded locations between stations. The
weighting function is the inverse of the average distance (D) between the snow stations
and the grid location raised to a power value p (i.e., 1/Dp). A weighting factor of 1/D2
was employed for relatively flat areas (elevations less than or equal to 4,000 ft) and 1/D6
was used for regions with highly varying terrain (elevations greater than 4,000 ft). The
weighting factor 1/D6 reduces the weight of more distant stations on the NGSL at a grid
location, which is appropriate for highly variable terrain in mountainous areas. Digital
elevation data (USGS 2014) having a 10-meter2 grid size were then utilized to select the
appropriate grid cells from each IDW interpolated raster surface. The two layers were
subsequently combined to produce a single map showing NGSL for the State of Idaho.
4.1 Exceptions for the 2015 Study
Just as in the 1986 study, we noted several exceptions to the values obtained from a strict
adherence to the map values. The NWS Coop station for the City of Coeur d’Alene,
which is located 35 miles east of the first-order Spokane station, registers a 50-year MRI
snow depth of 42 in. Using the RMCD we calculate a ground load of 67 psf, which gives
a specific gravity of 0.308. The Spokane NWS first-order station gives a 50-year MRI
depth of 30 in, with a snow-water equivalent (SWE) of 7.55 in, which translates to a
specific gravity of 0.2517. We can conclude that the RMCD gives a specific gravity that
State NWS NRCS Total
Idaho 138* 270 408
Montana 3 92 95
Nevada 2 38 40
Oregon 0 33 33
Utah 2 17 19
Wyoming 0 44 44
Washington 8** 21 29
9
is not appropriate for Coeur d’Alene because it is derived using data from SCS stations,
which are located primarily in the mountainous areas. Using the specific gravity of
0.2517 and a depth of 42 in for Coeur d’Alene gives a ground snow load of 40 psf. To
resolve this anomaly we mapped the area in Kootenai County using the snow depths from
the East Ragged Saddle Station, using the specific gravity for Spokane. These two
approaches both gave a ground snow load of 43 psf for Coeur d’Alene. But the two
approaches gave slightly differing values for other towns in the county (see Appendix 1).
We encountered an additional anomaly in Bannock County for the cities of Pocatello,
which has a NWS first-order station, and Chubbuck, which is four miles north of
Pocatello. The mapping gave ground snow loads of 45 psf for both towns. But with the
depth and snow-water equivalent values at the Pocatello Regional airport we calculated a
50-year MRI snow load of 31 psf, which we prescribed for both cities.
Since ground snow loads differ from our current calculations and those done in 1976 and
1986, we have annotated the listing of ground snow loads for Idaho cities and towns in
Appendix 1. For many locations we have provided notes with rationale for these values
by noting the location of NWS and SCS stations near the town/city. The results from the
three Idaho studies are documented In Appendix 2.
5.0 Summary and Conclusions
The 31 years of additional data, plus new Idaho stations and also stations from the
neighboring states produced results slightly different from those of the 1986 study. In
Appendix 2 we have included the values from the 1976 report, but since the 30-year MRI
value was used in that early study, we have multiplied the ground loads by 1.15 to
approximately convert them to 50-year MRI values. For this 2015 study the counties of
Ada, Bannock, Benewah, Bingham, Butte, Clark, Clearwater, Jefferson, Jerome,
Minidoka, and Payette did not experience great changes from the 1986 study. Adams
County had an approximate average decrease of 30% in their snow loads, and Bear Lake
County experienced a 25% decrease in the snow loads, with the exception of Georgetown
and Saint Charles. The Washington-Idaho State line shows improved agreement for
towns near the state border. Also, there generally are small differences in the studies for
neighboring States at the Idaho-Oregon and Idaho-Montana borders. The ground snow
loads for towns/cities for all Idaho counties are tabulated in Appendix 1.
Since this 2015 Idaho report focuses only on the ground snow loads, we have not
included the ground-to-roof conversion factors. We refer the user of this report to the
ASCE/SEI 7 Standard (ASCE/SEI 7-10) to obtain roof design snow loads where factors
such as exposure, thermal properties, and importance are defined and quantified. Also
ASCE/SEI 7 offers design information for myriad effects such as roof slope, unbalanced
loads, drifting, roof projections, sliding snow, rain on snow, ponding, and others.
We conclude that the 2015 Idaho ground snow load study provides engineers, architects,
contractors and building officials with the most current and accurate information

10
available to ensure the health and welfare of the public. But we acknowledge that the
uncertainties associated with snow suggest that the scatter in the data may be large in
spite of our best efforts. Also, the authority having jurisdiction must approve ground
snow loads for sites that are not specifically defined in this report. Ground snow load
determination for such sites must be based on an extreme value statistical analysis of data
available in the vicinity of the site using a value with a 2 percent annual probability of
being exceeded (i.e., 50-year MRI). And finally we remind the user of this report that the
design snow loads are the ultimate responsibility of the person in charge of the project.
11
6.0 References
Al Hatailah, Hussain, (2015). “Ground Snow Loads for the State of Idaho.” M.S.
Thesis, Department of Civil Engineering, University of Idaho, Moscow, ID.
American National Standards Institute (ANSI), (1982), “Building Code Requirements
for Minimum Design Loads in Buildings and Other Structures.” ANSI A58.1-1982,
New York, NY.
American Society of Civil Engineers (ASCE). (2010). “Minimum design loads for
buildings and other structures.” ASCE/SEI 7-10-2010, Reston, VA.
Rusten, A., Sack, R.L., and Molnau, M. (1980). Snow Load Analysis for Structures, J.
Struct. Engrg. (ASCE), Vol. 106, No. ST1, Proc. Paper 15102, January 1980, pp. 11-21.
ESRI (Environmental Systems Resource Institute). 2014. ArcGIS for Desktop 10.2.2.
ESRI, Redlands, CA.
Sack, R.L., & Sheik-Taheri, A. (1985). Ground and Roof Snow Loads for Idaho.
Department of Civil Engineering, University of Idaho, Moscow, ID.
http://www.lib.uidaho.edu/digital/idahosnow/index.html
http://www.lib.uidaho.edu/digital/idahosnow/elevation.html (Last accessed May 8, 2015)
Sack, R.L, Rusten, A., & Molnau, M.P. (1976). Snow loads for structures in Idaho.
Department of Civil Engineering, University of Idaho, Moscow, ID.
Sheikh-Taheri, A. (1985). “Ground Snow Loads for the State of Idaho, M.S. Thesis,
Department of Civil Engineering, University of Idaho, Moscow, ID.
United States Geological Survey (USGS). (n.d). Retrieved April 22, 2015, from
http://ned.usgs.gov/
Appendix 1. Ground Snow Loads for Idaho Cities and Towns--2015
Appendix 2. Ground Snow Loads for Idaho Cities and Towns—1976; 1986; 2015.
12
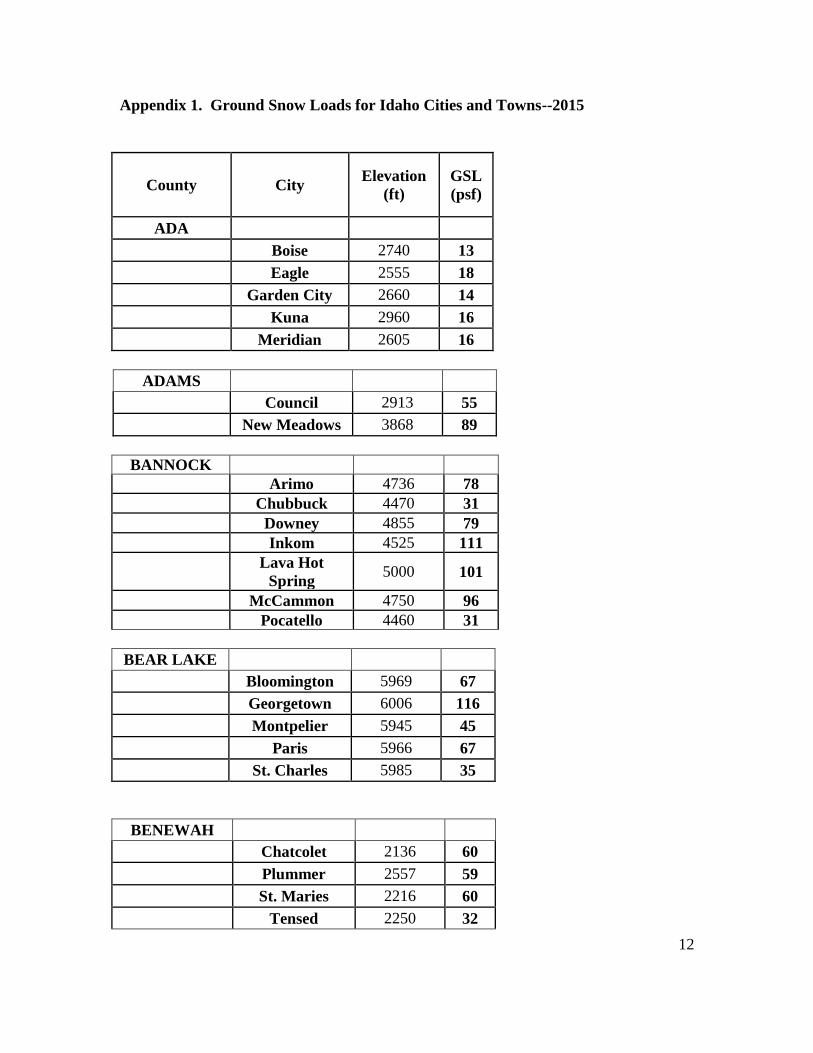
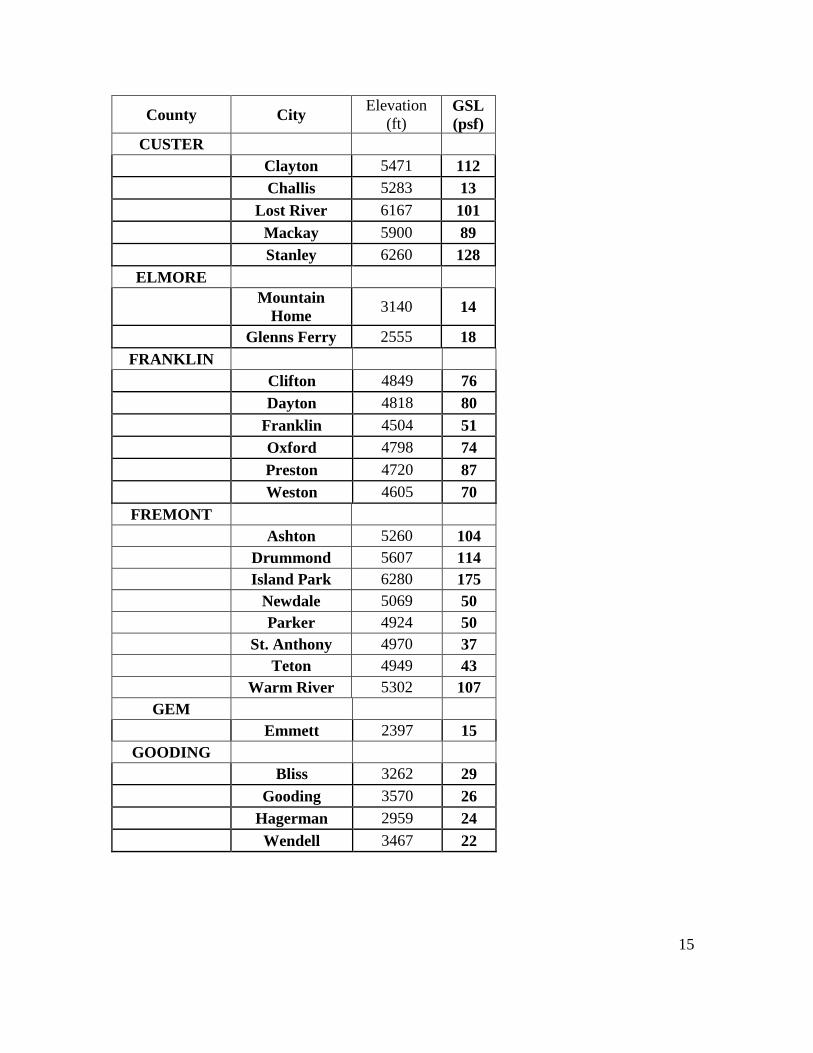
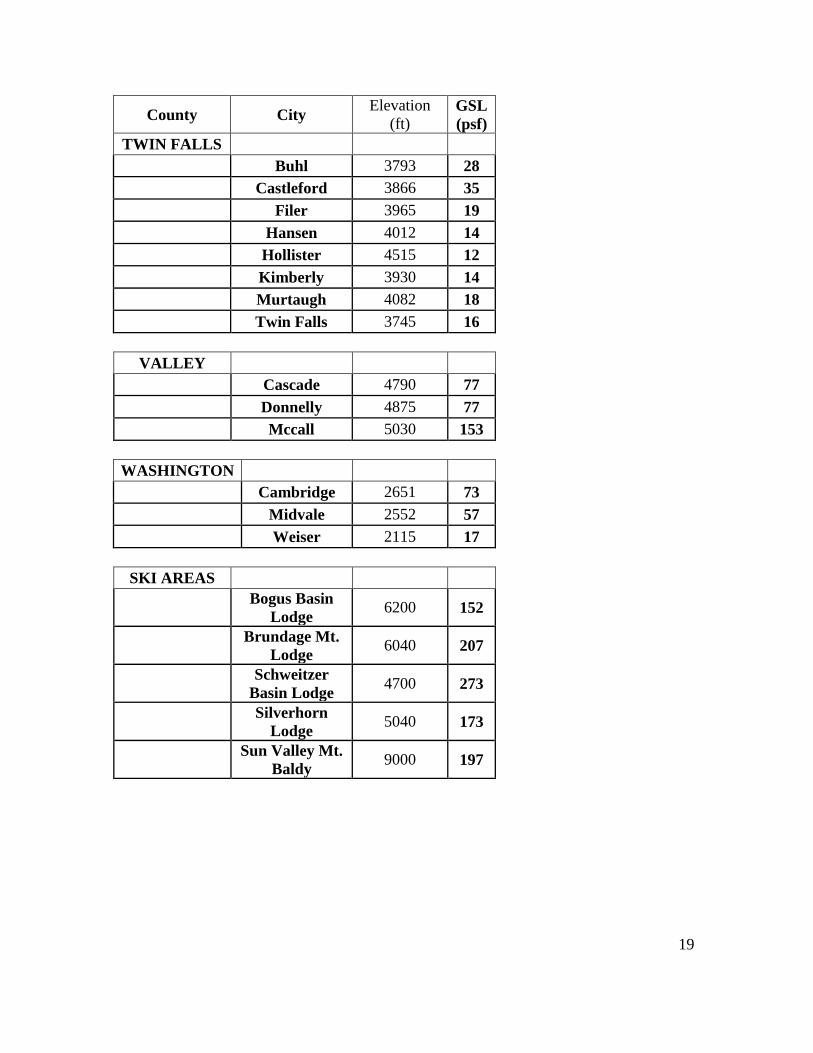
Appendix 1. Ground Snow Loads for Idaho Cities and Towns--2015
County City Elevation
(ft)
GSL
(psf)
ADA
Boise 2740 13
Eagle 2555 18
Garden City 2660 14
Kuna 2960 16
Meridian 2605 16
ADAMS
Council 2913 55
New Meadows 3868 89
BANNOCK
Arimo 4736 78
Chubbuck 4470 31
Downey 4855 79
Inkom 4525 111
Lava Hot
Spring 5000 101
McCammon 4750 96
Pocatello 4460 31
BEAR LAKE
Bloomington 5969 67
Georgetown 6006 116
Montpelier 5945 45
Paris 5966 67
St. Charles 5985 35
BENEWAH
Chatcolet 2136 60
Plummer 2557 59
St. Maries 2216 60
Tensed 2250 32
13
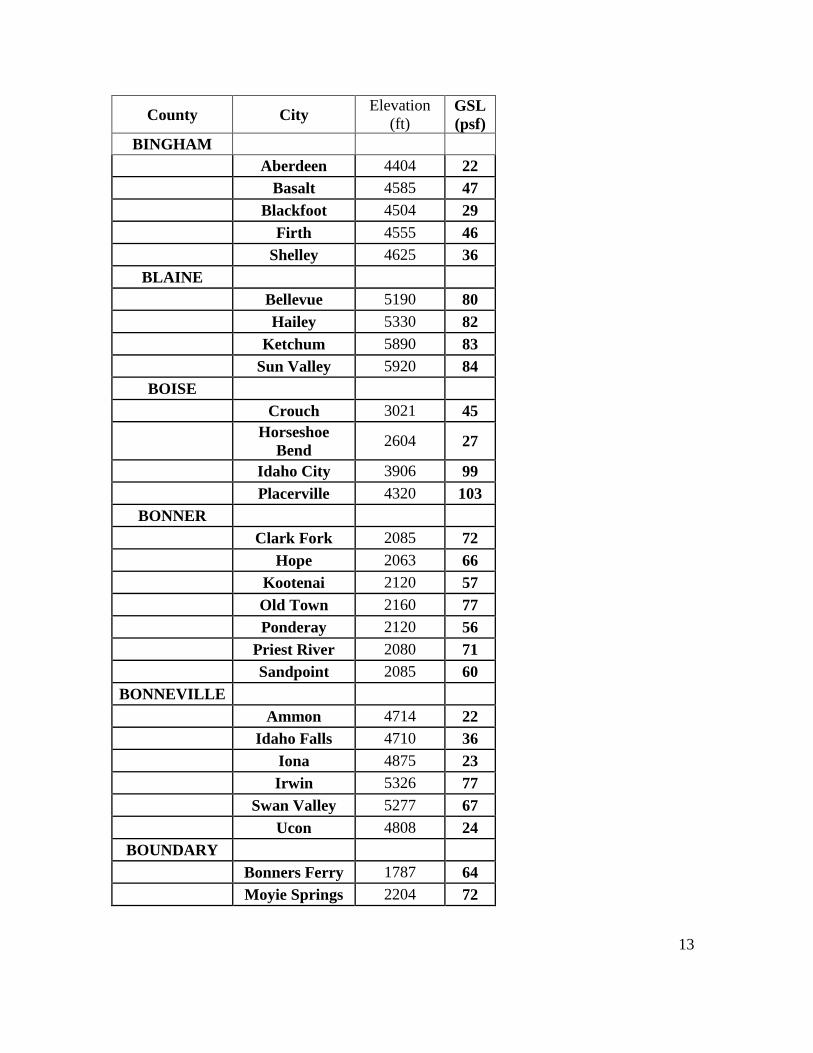
County City Elevation
(ft) GSL
(psf)
BINGHAM
Aberdeen 4404 22
Basalt 4585 47
Blackfoot 4504 29
Firth 4555 46
Shelley 4625 36
BLAINE
Bellevue 5190 80
Hailey 5330 82
Ketchum 5890 83
Sun Valley 5920 84
BOISE
Crouch 3021 45
Horseshoe
Bend 2604 27
Idaho City 3906 99
Placerville 4320 103
BONNER
Clark Fork 2085 72
Hope 2063 66
Kootenai 2120 57
Old Town 2160 77
Ponderay 2120 56
Priest River 2080 71
Sandpoint 2085 60
BONNEVILLE
Ammon 4714 22
Idaho Falls 4710 36
Iona 4875 23
Irwin 5326 77
Swan Valley 5277 67
Ucon 4808 24
BOUNDARY
Bonners Ferry 1787 64
Moyie Springs 2204 72
14
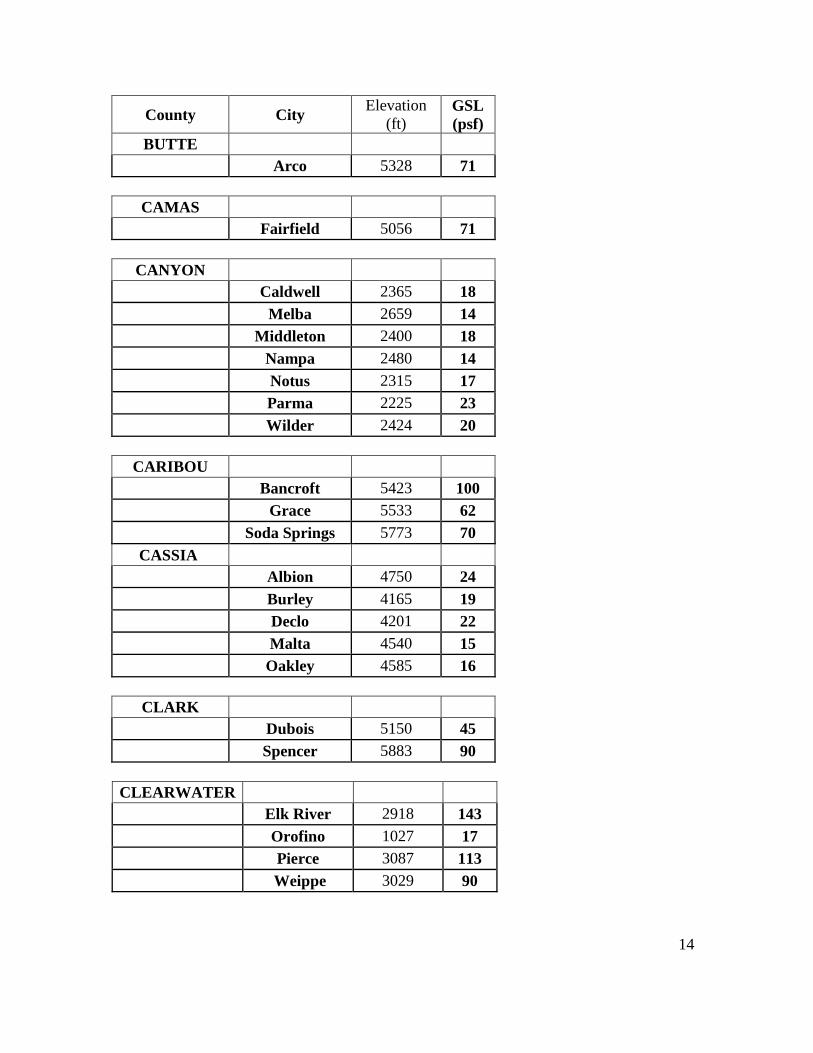
County City Elevation
(ft) GSL
(psf)
BUTTE
Arco 5328 71
CAMAS
Fairfield 5056 71
CANYON
Caldwell 2365 18
Melba 2659 14
Middleton 2400 18
Nampa 2480 14
Notus 2315 17
Parma 2225 23
Wilder 2424 20
CARIBOU
Bancroft 5423 100
Grace 5533 62
Soda Springs 5773 70
CASSIA
Albion 4750 24
Burley 4165 19
Declo 4201 22
Malta 4540 15
Oakley 4585 16
CLARK
Dubois 5150 45
Spencer 5883 90
CLEARWATER
Elk River 2918 143
Orofino 1027 17
Pierce 3087 113
Weippe 3029 90
15
County City Elevation
(ft) GSL
(psf)
CUSTER
Clayton 5471 112
Challis 5283 13
Lost River 6167 101
Mackay 5900 89
Stanley 6260 128
ELMORE
Mountain
Home 3140 14
Glenns Ferry 2555 18
FRANKLIN
Clifton 4849 76
Dayton 4818 80
Franklin 4504 51
Oxford 4798 74
Preston 4720 87
Weston 4605 70
FREMONT
Ashton 5260 104
Drummond 5607 114
Island Park 6280 175
Newdale 5069 50
Parker 4924 50
St. Anthony 4970 37
Teton 4949 43
Warm River 5302 107
GEM
Emmett 2397 15
GOODING
Bliss 3262 29
Gooding 3570 26
Hagerman 2959 24
Wendell 3467 22
16
County City
Elevation
(ft) GSL
(psf)
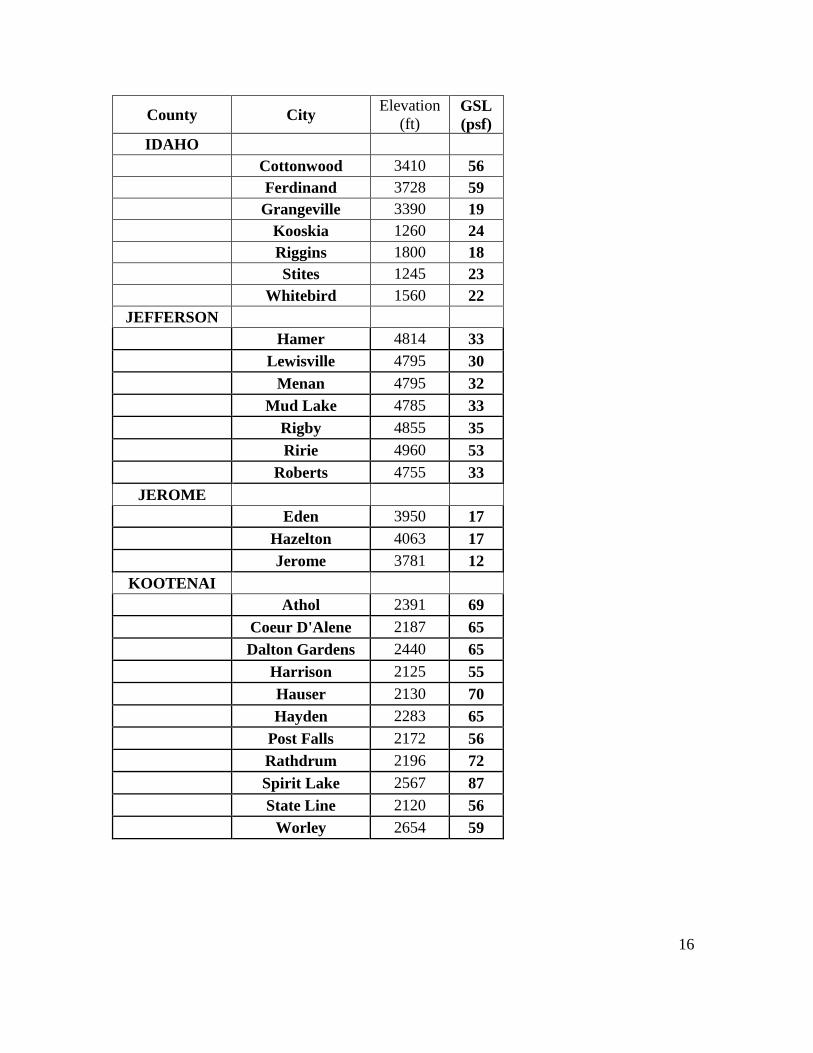
IDAHO
Cottonwood 3410 56
Ferdinand 3728 59
Grangeville 3390 19
Kooskia 1260 24
Riggins 1800 18
Stites 1245 23
Whitebird 1560 22
JEFFERSON
Hamer 4814 33
Lewisville 4795 30
Menan 4795 32
Mud Lake 4785 33
Rigby 4855 35
Ririe 4960 53
Roberts 4755 33
JEROME
Eden 3950 17
Hazelton 4063 17
Jerome 3781 12
KOOTENAI
Athol 2391 69
Coeur D'Alene 2187 65
Dalton Gardens 2440 65
Harrison 2125 55
Hauser 2130 70
Hayden 2283 65
Post Falls 2172 56
Rathdrum 2196 72
Spirit Lake 2567 87
State Line 2120 56
Worley 2654 59
17
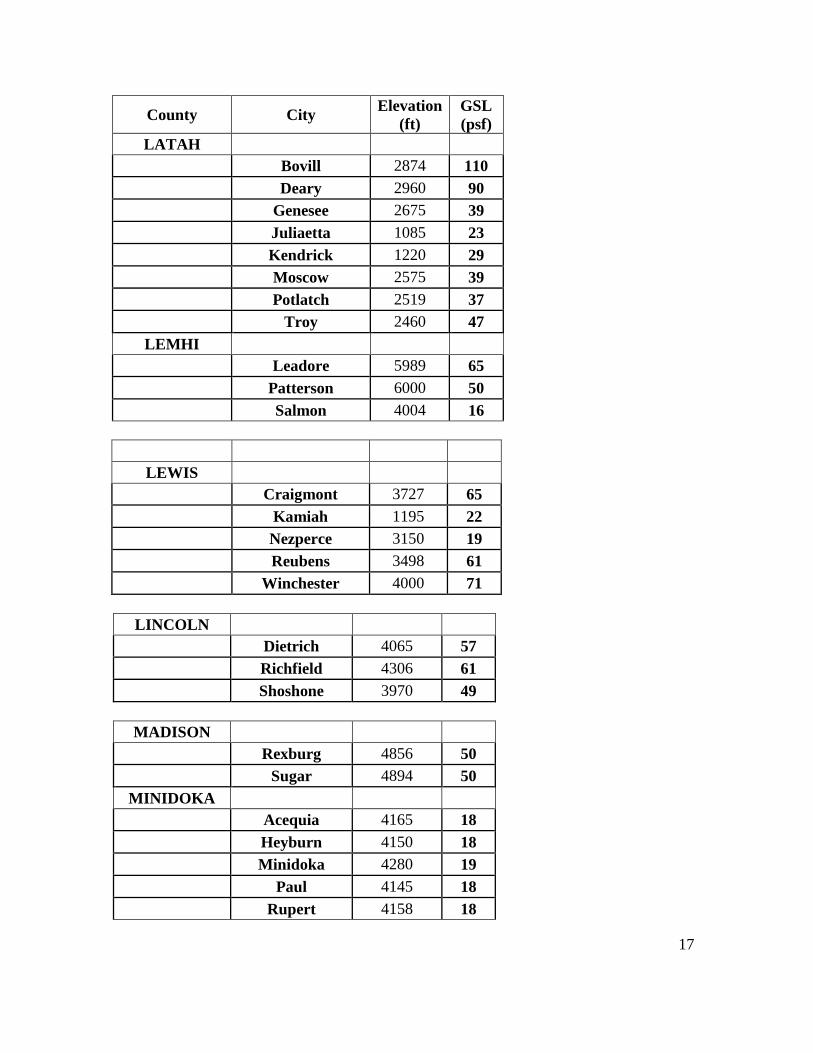
LEWIS
Craigmont 3727 65
Kamiah 1195 22
Nezperce 3150 19
Reubens 3498 61
Winchester 4000 71
LINCOLN
Dietrich 4065 57
Richfield 4306 61
Shoshone 3970 49
MADISON
Rexburg 4856 50
Sugar 4894 50
MINIDOKA
Acequia 4165 18
Heyburn 4150 18
Minidoka 4280 19
Paul 4145 18
Rupert 4158 18
County City Elevation
(ft)
GSL
(psf)
LATAH
Bovill 2874 110
Deary 2960 90
Genesee 2675 39
Juliaetta 1085 23
Kendrick 1220 29
Moscow 2575 39
Potlatch 2519 37
Troy 2460 47
LEMHI
Leadore 5989 65
Patterson 6000 50
Salmon 4004 16
18
County City Elevation
(ft) GSL
(psf)
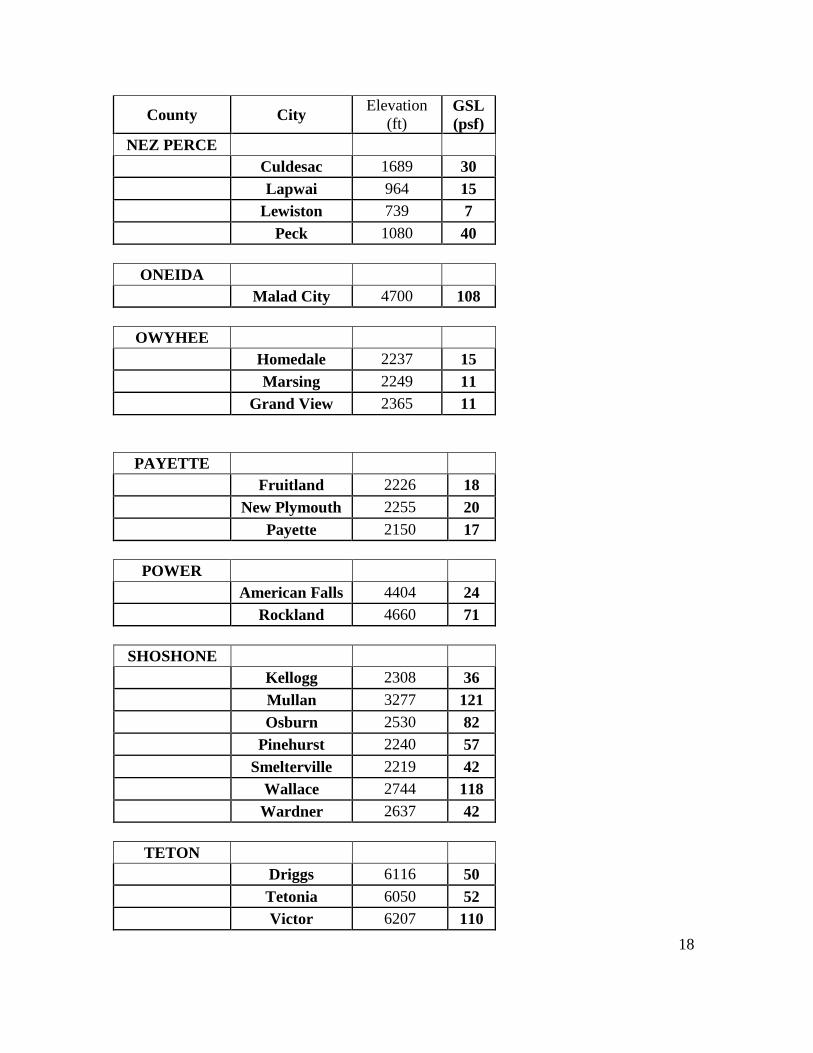
NEZ PERCE
Culdesac 1689 30
Lapwai 964 15
Lewiston 739 7
Peck 1080 40
ONEIDA
Malad City 4700 108
OWYHEE
Homedale 2237 15
Marsing 2249 11
Grand View 2365 11
PAYETTE
Fruitland 2226 18
New Plymouth 2255 20
Payette 2150 17
POWER
American Falls 4404 24
Rockland 4660 71
SHOSHONE
Kellogg 2308 36
Mullan 3277 121
Osburn 2530 82
Pinehurst 2240 57
Smelterville 2219 42
Wallace 2744 118
Wardner 2637 42
TETON
Driggs 6116 50
Tetonia 6050 52
Victor 6207 110
19
County City Elevation
(ft) GSL
(psf)
TWIN FALLS
Buhl 3793 28
Castleford 3866 35
Filer 3965 19
Hansen 4012 14
Hollister 4515 12
Kimberly 3930 14
Murtaugh 4082 18
Twin Falls 3745 16
VALLEY
Cascade 4790 77
Donnelly 4875 77
Mccall 5030 153
WASHINGTON
Cambridge 2651 73
Midvale 2552 57
Weiser 2115 17
SKI AREAS
Bogus Basin
Lodge 6200 152
Brundage Mt.
Lodge 6040 207
Schweitzer
Basin Lodge 4700 273
Silverhorn
Lodge 5040 173
Sun Valley Mt.
Baldy 9000 197
20
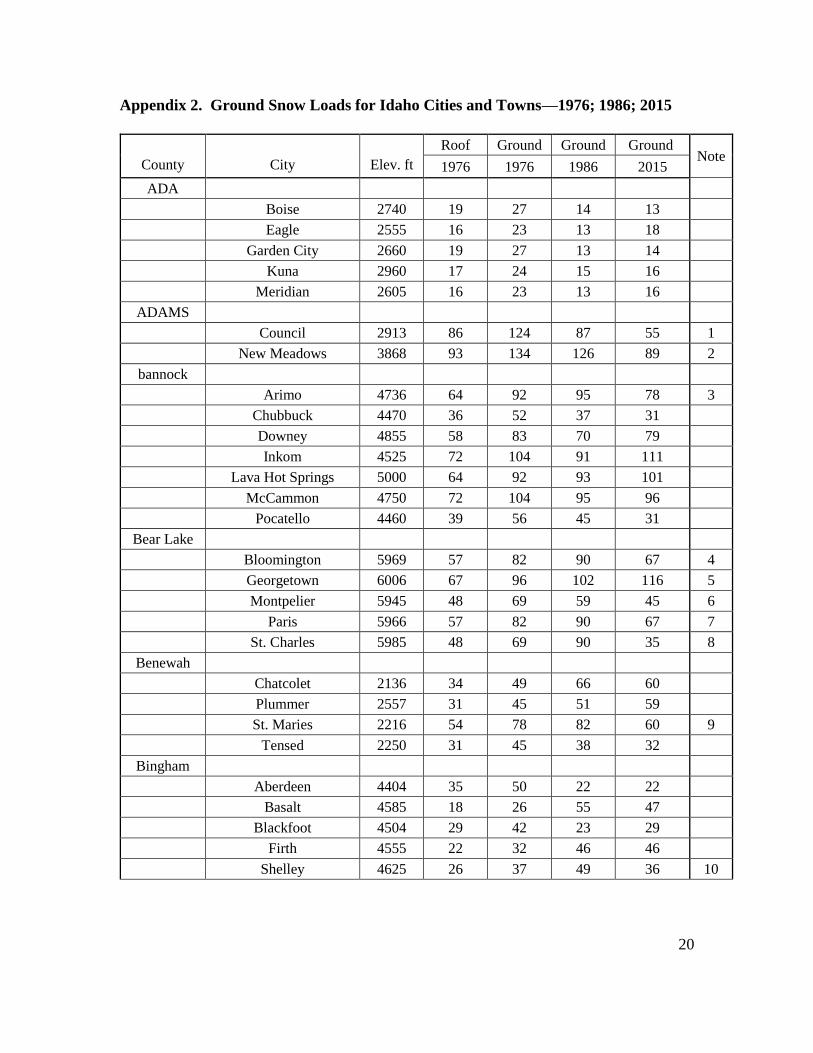
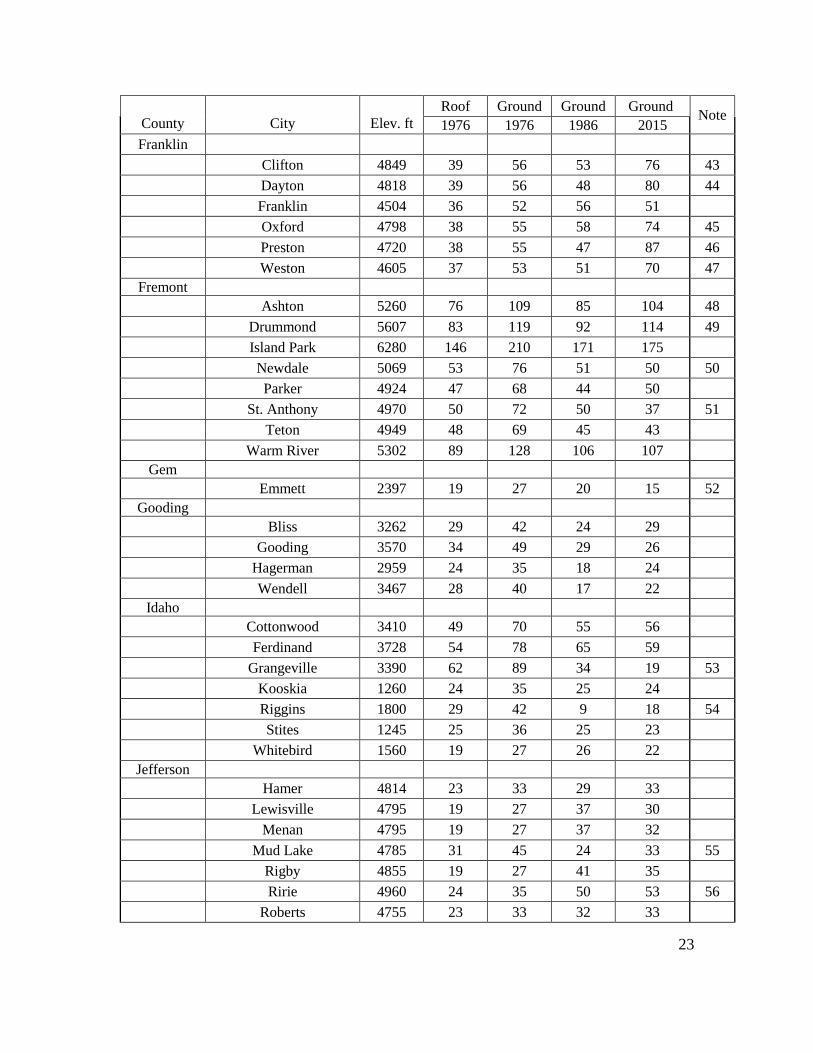
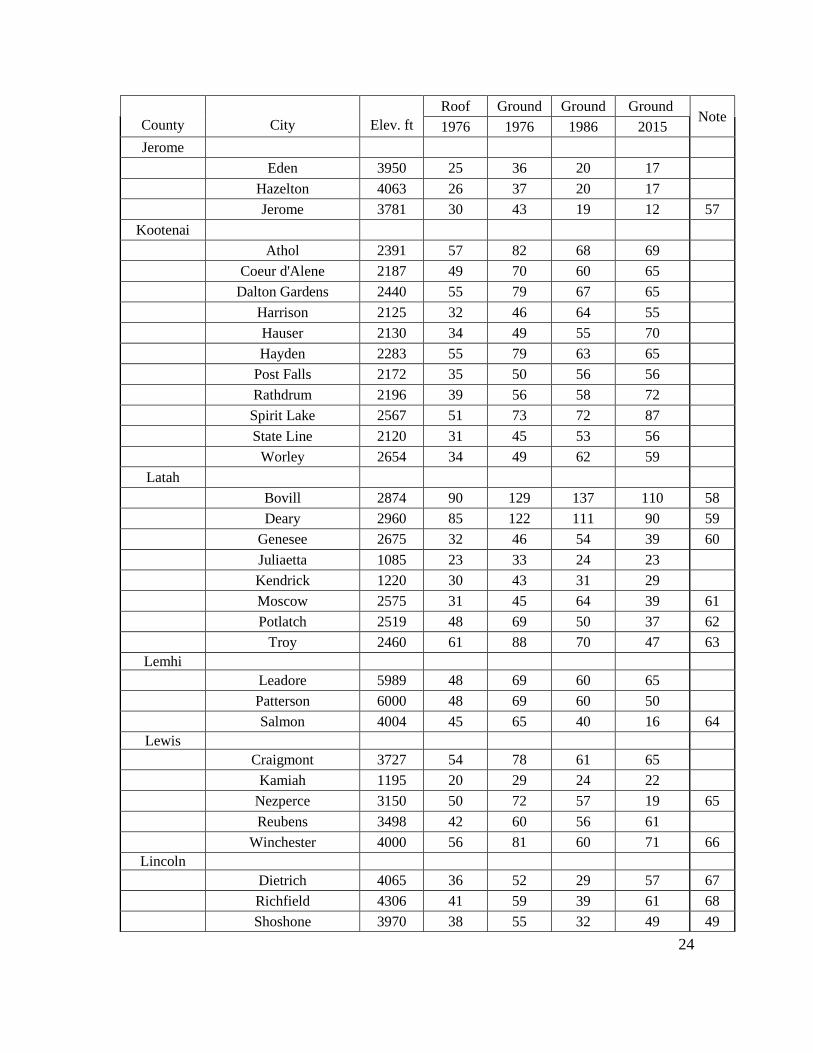
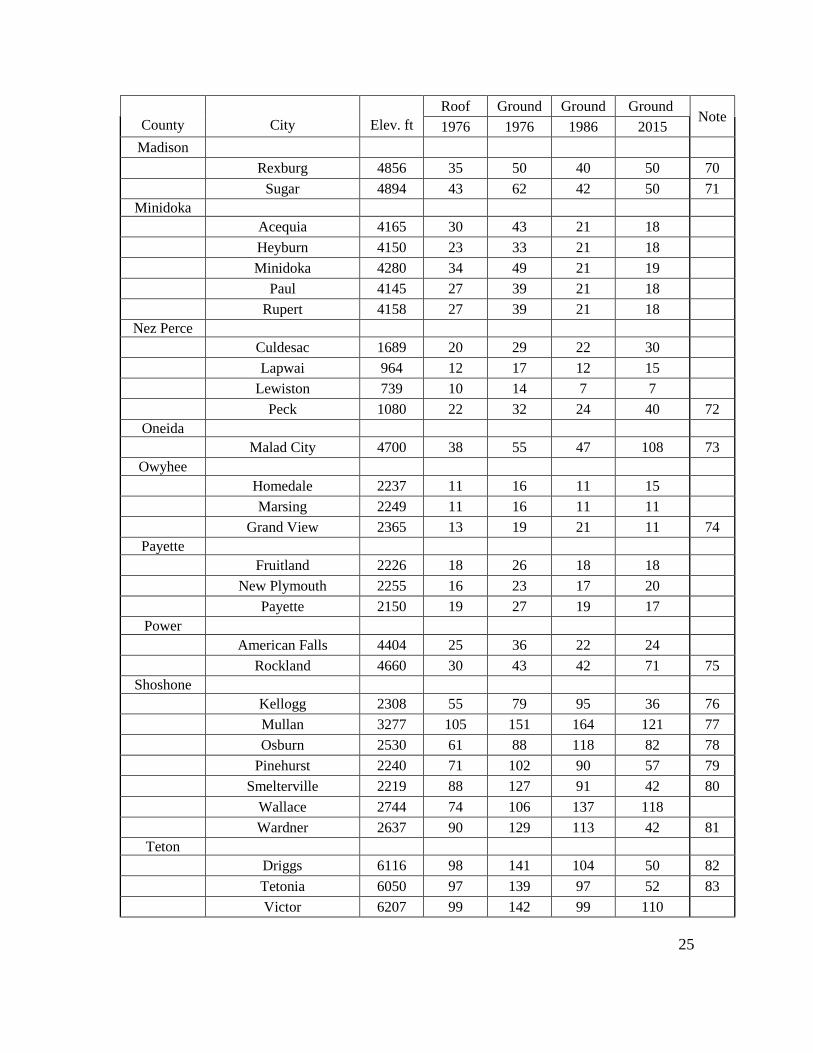
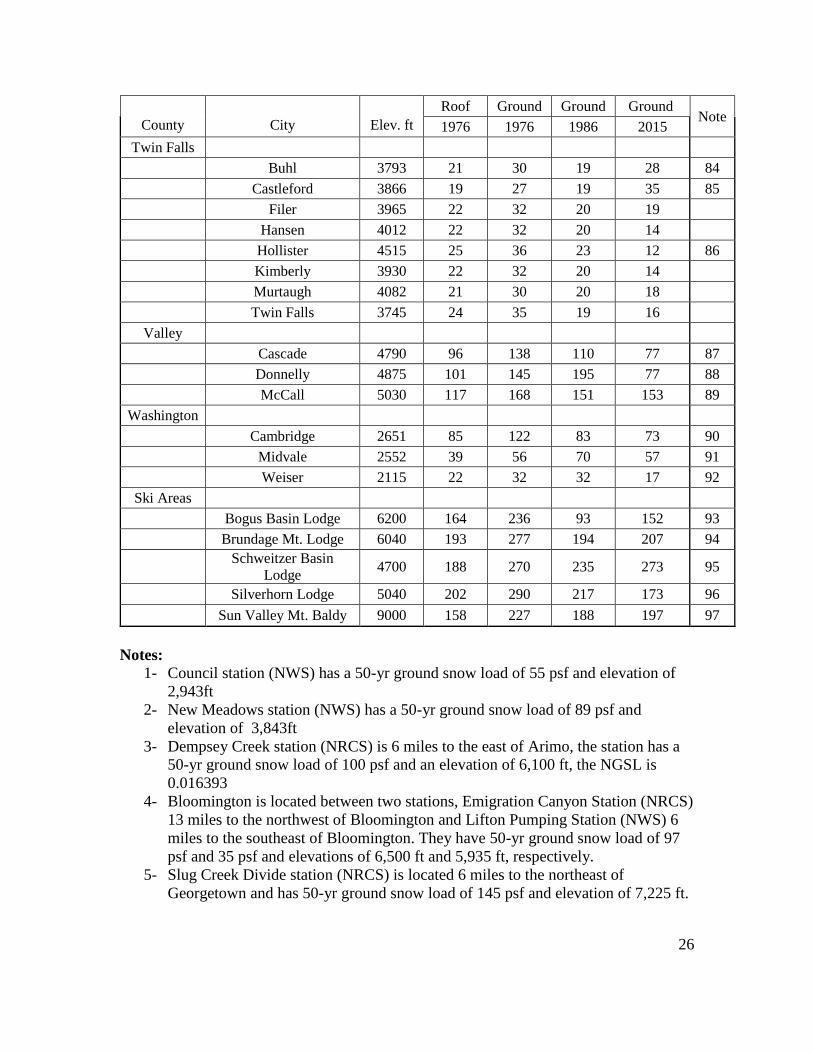
Appendix 2. Ground Snow Loads for Idaho Cities and Towns—1976; 1986; 2015
County
City
Elev. ft
Roof Ground Ground Ground Note
1976 1976 1986 2015
ADA
Boise 2740 19 27 14 13
Eagle 2555 16 23 13 18
Garden City 2660 19 27 13 14
Kuna 2960 17 24 15 16
Meridian 2605 16 23 13 16
ADAMS
Council 2913 86 124 87 55 1
New Meadows 3868 93 134 126 89 2
bannock
Arimo 4736 64 92 95 78 3
Chubbuck 4470 36 52 37 31
Downey 4855 58 83 70 79
Inkom 4525 72 104 91 111
Lava Hot Springs 5000 64 92 93 101
McCammon 4750 72 104 95 96
Pocatello 4460 39 56 45 31
Bear Lake
Bloomington 5969 57 82 90 67 4
Georgetown 6006 67 96 102 116 5
Montpelier 5945 48 69 59 45 6
Paris 5966 57 82 90 67 7
St. Charles 5985 48 69 90 35 8
Benewah
Chatcolet 2136 34 49 66 60
Plummer 2557 31 45 51 59
St. Maries 2216 54 78 82 60 9
Tensed 2250 31 45 38 32
Bingham
Aberdeen 4404 35 50 22 22
Basalt 4585 18 26 55 47
Blackfoot 4504 29 42 23 29
Firth 4555 22 32 46 46
Shelley 4625 26 37 49 36 10
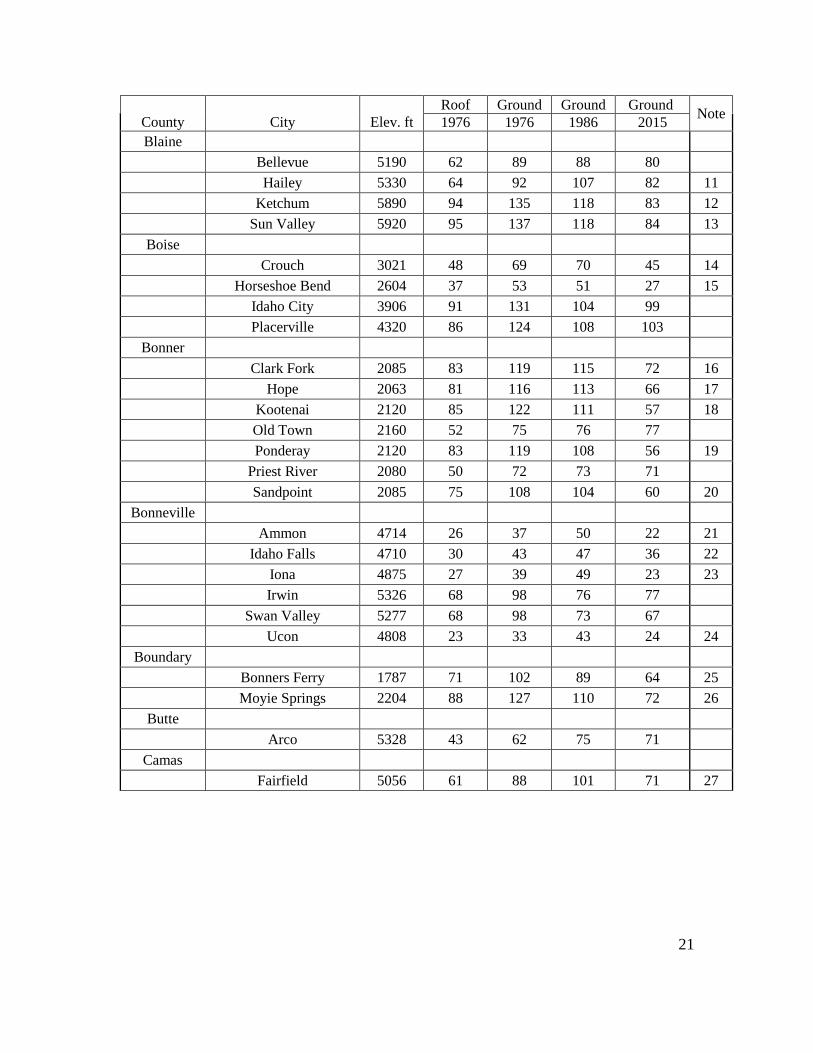
21
County
City
Elev. ft
Roof Ground Ground Ground Note
1976 1976 1986 2015
Blaine
Bellevue 5190 62 89 88 80
Hailey 5330 64 92 107 82 11
Ketchum 5890 94 135 118 83 12
Sun Valley 5920 95 137 118 84 13
Boise
Crouch 3021 48 69 70 45 14
Horseshoe Bend 2604 37 53 51 27 15
Idaho City 3906 91 131 104 99
Placerville 4320 86 124 108 103
Bonner
Clark Fork 2085 83 119 115 72 16
Hope 2063 81 116 113 66 17
Kootenai 2120 85 122 111 57 18
Old Town 2160 52 75 76 77
Ponderay 2120 83 119 108 56 19
Priest River 2080 50 72 73 71
Sandpoint 2085 75 108 104 60 20
Bonneville
Ammon 4714 26 37 50 22 21
Idaho Falls 4710 30 43 47 36 22
Iona 4875 27 39 49 23 23
Irwin 5326 68 98 76 77
Swan Valley 5277 68 98 73 67
Ucon 4808 23 33 43 24 24
Boundary
Bonners Ferry 1787 71 102 89 64 25
Moyie Springs 2204 88 127 110 72 26
Butte
Arco 5328 43 62 75 71
Camas
Fairfield 5056 61 88 101 71 27
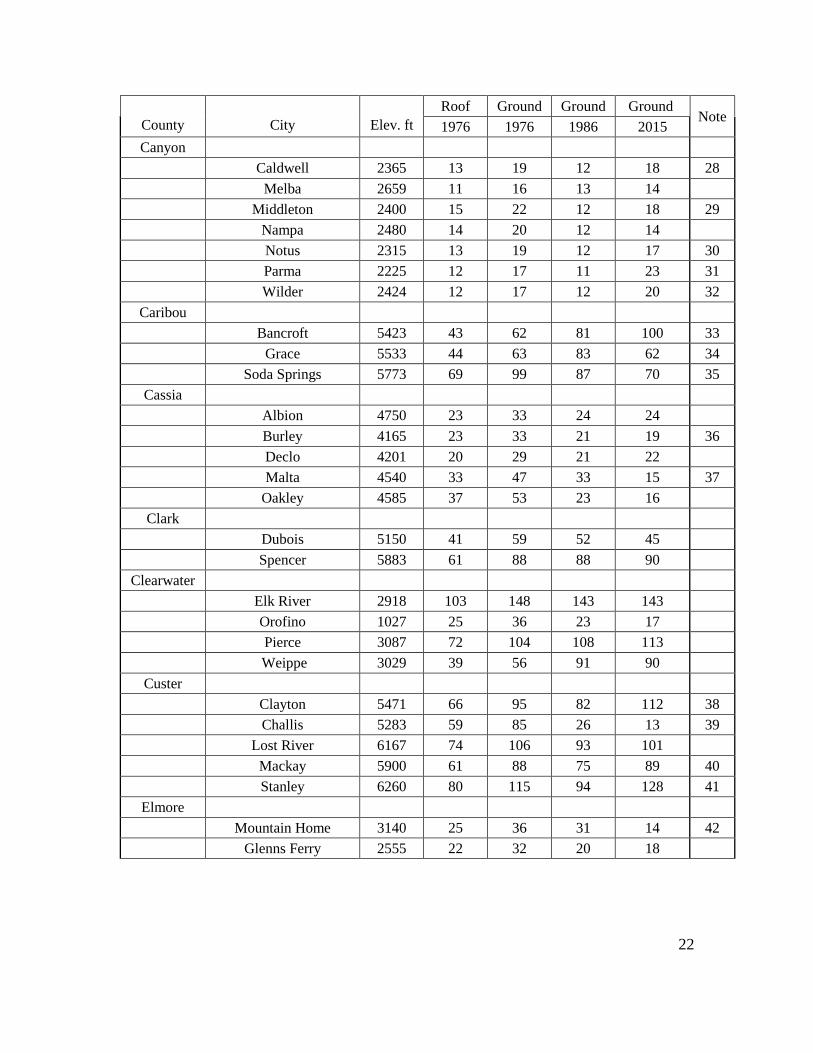
22
County
City
Elev. ft
Roof Ground Ground Ground Note
1976 1976 1986 2015
Canyon
Caldwell 2365 13 19 12 18 28
Melba 2659 11 16 13 14
Middleton 2400 15 22 12 18 29
Nampa 2480 14 20 12 14
Notus 2315 13 19 12 17 30
Parma 2225 12 17 11 23 31
Wilder 2424 12 17 12 20 32
Caribou
Bancroft 5423 43 62 81 100 33
Grace 5533 44 63 83 62 34
Soda Springs 5773 69 99 87 70 35
Cassia
Albion 4750 23 33 24 24
Burley 4165 23 33 21 19 36
Declo 4201 20 29 21 22
Malta 4540 33 47 33 15 37
Oakley 4585 37 53 23 16
Clark
Dubois 5150 41 59 52 45
Spencer 5883 61 88 88 90
Clearwater
Elk River 2918 103 148 143 143
Orofino 1027 25 36 23 17
Pierce 3087 72 104 108 113
Weippe 3029 39 56 91 90
Custer
Clayton 5471 66 95 82 112 38
Challis 5283 59 85 26 13 39
Lost River 6167 74 106 93 101
Mackay 5900 61 88 75 89 40
Stanley 6260 80 115 94 128 41
Elmore
Mountain Home 3140 25 36 31 14 42
Glenns Ferry 2555 22 32 20 18
23
County
City
Elev. ft
Roof Ground Ground Ground Note
1976 1976 1986 2015
Franklin
Clifton 4849 39 56 53 76 43
Dayton 4818 39 56 48 80 44
Franklin 4504 36 52 56 51
Oxford 4798 38 55 58 74 45
Preston 4720 38 55 47 87 46
Weston 4605 37 53 51 70 47
Fremont
Ashton 5260 76 109 85 104 48
Drummond 5607 83 119 92 114 49
Island Park 6280 146 210 171 175
Newdale 5069 53 76 51 50 50
Parker 4924 47 68 44 50
St. Anthony 4970 50 72 50 37 51
Teton 4949 48 69 45 43
Warm River 5302 89 128 106 107
Gem
Emmett 2397 19 27 20 15 52
Gooding
Bliss 3262 29 42 24 29
Gooding 3570 34 49 29 26
Hagerman 2959 24 35 18 24
Wendell 3467 28 40 17 22
Idaho
Cottonwood 3410 49 70 55 56
Ferdinand 3728 54 78 65 59
Grangeville 3390 62 89 34 19 53
Kooskia 1260 24 35 25 24
Riggins 1800 29 42 9 18 54
Stites 1245 25 36 25 23
Whitebird 1560 19 27 26 22
Jefferson
Hamer 4814 23 33 29 33
Lewisville 4795 19 27 37 30
Menan 4795 19 27 37 32
Mud Lake 4785 31 45 24 33 55
Rigby 4855 19 27 41 35
Ririe 4960 24 35 50 53 56
Roberts 4755 23 33 32 33
24
County
City
Elev. ft
Roof Ground Ground Ground Note
1976 1976 1986 2015
Jerome
Eden 3950 25 36 20 17
Hazelton 4063 26 37 20 17
Jerome 3781 30 43 19 12 57
Kootenai
Athol 2391 57 82 68 69
Coeur d'Alene 2187 49 70 60 65
Dalton Gardens 2440 55 79 67 65
Harrison 2125 32 46 64 55
Hauser 2130 34 49 55 70
Hayden 2283 55 79 63 65
Post Falls 2172 35 50 56 56
Rathdrum 2196 39 56 58 72
Spirit Lake 2567 51 73 72 87
State Line 2120 31 45 53 56
Worley 2654 34 49 62 59
Latah
Bovill 2874 90 129 137 110 58
Deary 2960 85 122 111 90 59
Genesee 2675 32 46 54 39 60
Juliaetta 1085 23 33 24 23
Kendrick 1220 30 43 31 29
Moscow 2575 31 45 64 39 61
Potlatch 2519 48 69 50 37 62
Troy 2460 61 88 70 47 63
Lemhi
Leadore 5989 48 69 60 65
Patterson 6000 48 69 60 50
Salmon 4004 45 65 40 16 64
Lewis
Craigmont 3727 54 78 61 65
Kamiah 1195 20 29 24 22
Nezperce 3150 50 72 57 19 65
Reubens 3498 42 60 56 61
Winchester 4000 56 81 60 71 66
Lincoln
Dietrich 4065 36 52 29 57 67
Richfield 4306 41 59 39 61 68
Shoshone 3970 38 55 32 49 49
25
County
City
Elev. ft
Roof Ground Ground Ground Note
1976 1976 1986 2015
Madison
Rexburg 4856 35 50 40 50 70
Sugar 4894 43 62 42 50 71
Minidoka
Acequia 4165 30 43 21 18
Heyburn 4150 23 33 21 18
Minidoka 4280 34 49 21 19
Paul 4145 27 39 21 18
Rupert 4158 27 39 21 18
Nez Perce
Culdesac 1689 20 29 22 30
Lapwai 964 12 17 12 15
Lewiston 739 10 14 7 7
Peck 1080 22 32 24 40 72
Oneida
Malad City 4700 38 55 47 108 73
Owyhee
Homedale 2237 11 16 11 15
Marsing 2249 11 16 11 11
Grand View 2365 13 19 21 11 74
Payette
Fruitland 2226 18 26 18 18
New Plymouth 2255 16 23 17 20
Payette 2150 19 27 19 17
Power
American Falls 4404 25 36 22 24
Rockland 4660 30 43 42 71 75
Shoshone
Kellogg 2308 55 79 95 36 76
Mullan 3277 105 151 164 121 77
Osburn 2530 61 88 118 82 78
Pinehurst 2240 71 102 90 57 79
Smelterville 2219 88 127 91 42 80
Wallace 2744 74 106 137 118
Wardner 2637 90 129 113 42 81
Teton
Driggs 6116 98 141 104 50 82
Tetonia 6050 97 139 97 52 83
Victor 6207 99 142 99 110
26
County
City
Elev. ft
Roof Ground Ground Ground Note
1976 1976 1986 2015
Twin Falls
Buhl 3793 21 30 19 28 84
Castleford 3866 19 27 19 35 85
Filer 3965 22 32 20 19
Hansen 4012 22 32 20 14
Hollister 4515 25 36 23 12 86
Kimberly 3930 22 32 20 14
Murtaugh 4082 21 30 20 18
Twin Falls 3745 24 35 19 16
Valley
Cascade 4790 96 138 110 77 87
Donnelly 4875 101 145 195 77 88
McCall 5030 117 168 151 153 89
Washington
Cambridge 2651 85 122 83 73 90
Midvale 2552 39 56 70 57 91
Weiser 2115 22 32 32 17 92
Ski Areas
Bogus Basin Lodge 6200 164 236 93 152 93
Brundage Mt. Lodge 6040 193 277 194 207 94
Schweitzer Basin
Lodge 4700 188 270 235 273 95
Silverhorn Lodge 5040 202 290 217 173 96
Sun Valley Mt. Baldy 9000 158 227 188 197 97
Notes:
1- Council station (NWS) has a 50-yr ground snow load of 55 psf and elevation of
2,943ft
2- New Meadows station (NWS) has a 50-yr ground snow load of 89 psf and
elevation of 3,843ft
3- Dempsey Creek station (NRCS) is 6 miles to the east of Arimo, the station has a
50-yr ground snow load of 100 psf and an elevation of 6,100 ft, the NGSL is
0.016393
4- Bloomington is located between two stations, Emigration Canyon Station (NRCS)
13 miles to the northwest of Bloomington and Lifton Pumping Station (NWS) 6
miles to the southeast of Bloomington. They have 50-yr ground snow load of 97
psf and 35 psf and elevations of 6,500 ft and 5,935 ft, respectively.
5- Slug Creek Divide station (NRCS) is located 6 miles to the northeast of
Georgetown and has 50-yr ground snow load of 145 psf and elevation of 7,225 ft.
27
6- Montpelier RS station (NWS) is located in Montpelier and has 50-yr ground snow
load of 45 psf and elevation of 5,960
7- Paris is located between two stations, Emigration Canyon Station (NRCS) 12
miles to the northwest of Bloomington and Lifton Pumping Station (NWS) 7
miles to the southeast of Bloomington. They have 50-yr ground snow load of 97
psf and 35 psf and elevation of 6,500 ft and 5,935 ft, respectively.
8- Lifton Pumping station (NWS) is located 3 miles to the east of St. Charles has a
50-yr ground snow load of 35 psf and an elevation of 5,935 ft.
9- Saint Maries station (NWS) has a 50-yr ground snow load of 58 psf and elevation
of 2,151 ft
10- Idaho Falls Fanning FLD station (NWS) and Idaho Falls 2 ESE (NWS) is 7 miles
and 8 miles to the north of Shelley and have 50-yr ground snow loads of 37 and
22 psf and elevation of 4,729 ft and 4,742ft, respectively.
11- Hailey 3NNW station (NWS) has 50-yr ground snow load of 84 psf and elevation
of 5,424 ft
12- Ketchum RS (NRCS) has 50-yr ground snow load of 74 psf and elevation of
5,890 ft
13- Sun Valley Station (NWS) is located 0.3 miles to the north of Sun Valley and
Ketchum RS (NRCS) is located 0.7 miles to the south of Sun Valley. They have
50-yr ground snow loads of 140 psf and 73 psf, respectively. The elevations are
5,820 ft and 5,890 ft respectively.
14- Garden Valley Station (NWS) is located 1 mile to the south of Crouch. It has 50-
yr ground snow load of 46 and elevation of 3,100 ft. the NGSL is 0.014931
15- Emmett 2E station (NWS) is located 13 miles to the southwest of Horseshoe Bend
and it has a 50-yr ground snow load of 15 psf and elevation of 2,390 ft.
16- Cabinet Gorge station (NWS) is located 7 miles to the southeast of Clark Fork and
has a 50-yr ground snow load of 77 psf and elevation of 2,173 ft.
17- Sandpoint Exp station (NRCS) and Sandpoint Exp Station (NWS) are located 12
miles to the west of Hope and they have a 50-yr ground snow load of 49 psf and
61 psf and elevation of 2,100 ft and 2,126 ft, respectively.
18- Sandpoint Exp station (NRCS) and Sandpoint Exp station (NWS) are located 2.5
miles from Kootenai and they have 50-yr ground snow loads of 49 psf and 61 psf,
respectively and elevations of 2,100 ft and 2,126 ft, respectively.
19- Sandpoint Exp station (NRCS) and Sandpoint Exp station (NWS) are located 1.5
miles from Ponderay and they have 50-yr ground snow loads of 49 psf, and 61
psf, respectively and elevations of 2,100 ft and 2,126 ft, respectively.
20- Sandpoint Exp station (NRCS) and Sandpoint Exp station (NWS) have 50-yr
ground snow loads of 49 psf and 61 psf, respectively and elevations of 2,100 ft
and 2,126 ft, respectively.
21- Idaho Falls Fanning FLD station (NWS) is located 4 miles to the northeast of
Ammon and has a 50-yr ground snow load of 22 psf and an elevation of 4,729 ft.
22- Idaho Falls Fanning FLD and Idaho Falls 2 ESE (NWS) have 50-yr ground snow
loads of 37 and 22 psf, respectively.
23- Idaho Falls Fanning FLD station (NWS) is located 4 miles to the southwest of
Iona and has a 50-yr ground snow load of 22 psf and an elevation of 4,729 ft.
28
24- Idaho Falls Fanning FLD station (NWS) is located 6 miles to the southwest of
Ucon and has a 50-yr ground snow load of 22 psf.
25- Bonners Ferry station (NWS) has a 50-yr ground snow load of 75 psf and
elevation of 2,075 ft
26- Bonners Ferry station (NWS) is located 7 miles to the southwest of Moyie
Springs and has a 50-yr ground snow load of 75 psf and elevation of 2,075 ft
27- Fairfield RS (NWS) has a 50-yr ground snow load of 71 psf and an elevation of
5,565 ft.
28- Caldwell has a station (NWS) with a 50-yr ground snow load of 18.6 psf and an
elevation of 2,370 ft.
29- Caldwell station (NWS) is located 4 miles to the southwest of Middleton and has
a 50-yr ground snow load of 18.6 psf and an elevation of 2,370 ft.
30- Notus is located between two stations, Parma exp station (NWS) and Caldwell
station (NWS). They have a 50-yr ground snow loads of 18 and 25 psf, with
elevations of 2,290 ft. and 2,370 ft., respectively
31- Parma has a station (NWS) with 50-yr ground snow load of 25 psf and elevation
2,290 ft.
32- Parma Exp station (NWS) is located 8 miles north of Wilder and has a 50-yr
ground snow load of 25 psf with an elevation of 2,290 ft..
33- Lower Pebble Station (NRCS) is located 9 miles to the west of Bancroft and has a
50-yr ground snow load of 113 psf and elevation of 5,780ft.
34- Grace station (NWS) has 50-yr ground snow load of 62 psf and an elevation of
5,500 ft.
35- Conda station (NWS) is located 5 miles to the northeast of Soda Springs and has
50-yr ground snow load of 71 psf and elevation of 6,204. The NGSL is 0.011501
36- Burley Muni Airport Station (NWS) has a 50-yr ground snow load of 19 psf and
an elevation of 4,142 ft.
37- Malta 4ESE station (NWS) is located 3 miles to the southeast of Malta and has a
50-yr ground snow load of 15 psf.
38- Bruno Creek Station (NRCS) is located 9 miles to the northwest of Clayton and it
has a 50-yr ground snow load of 163 and elevation of 7,920 ft. the NGSL is
0.020581
39- Challis has a station (NWS) in the town that has a 50-yr ground snow load of 13
psf.
40- Mackay Lost River Ranger Station (NWS) has a 50-yr ground snow load of 89 psf
and elevation of 5,897 ft.
41- Stanley Station (NWS) has ground snow load of 128 psf
42- Mountain Home has a station (NWS) with a 50-yr ground snow load of 13 psf.
43- Oxford Springs station (NRCS) is located 8 miles to the northwest of Clifton and
Preston station (NWS) is located 9 miles to the southeast of Clifton; the stations
have 50-yr ground snow loads of 103 psf and 89 psf and elevations of 6,740 and
4,800 ft respectively.
44- Preston station (NWS) is located 6 miles to the east of Dayton and has 50-yr
ground snow load of 89 psf and elevation of 4,800 ft.
29
45- Oxford Springs station (NWS) is located 6 miles to the west of Oxford and has a
50-yr ground snow load and elevations of 103 psf and 6,740 ft. The NGSL is
0.015282
46- Preston Station (NWS) has a 50-yr ground snow load of 89 psf.
47- Preston Station (NWS) is located 6 miles to the Northeast of Weston and has a
50-yr ground snow load of 89 psf and elevation of 4,800 ft.
48- Ashton station (NWS) has a 50-yr ground snow load of 106 psf and elevation of
5,212 ft.
49- Ashton Station (NWS) is located 4 miles to the north of Drummond and has a 50-
yr ground snow load of 106 psf and elevation of 5,212 ft.
50- Sugar Station (NWS) is located 6 miles to the west of Newdale and has a 50-yr
ground snow load of 50 psf and elevation of 4,925 ft.
51- Saint Anthony station (NWS) has a 50-yr ground snow load of 37 psf and
elevation of 4,910 ft.
52- Emmett 2E station (NWS) has a 50-yr ground snow load of 15 psf and elevation
of 2,390 ft.
53- Grangeville has a station (NWS) with 50-yr ground snow load of 16 psf.
54- Riggins has a station (NWS) with 50-yr ground snow load of 18 psf.
55- Hamer 4NW station (NWS) is 14 miles to the northeast of Mud Lake and it has a
50-yr ground snow load of 33 psf and elevation of 4,790 ft.
56- Sugar Station (NWS) is located 16 miles north of Ririe and has a 50-yr ground
snow load of 50 psf and elevation of 4,925 ft.
57- Jerome station (NWS) has a 50-yr ground snow load of 11 psf and elevation of
3,740 ft.
58- Sherwin Station (NRCS) is located 7 miles to the northeast of Bovill and has a 50-
yr ground snow load of 125 psf and elevation of 3,200 ft. The NGSL is 0.039063
59- Deary is located in the center of three stations; Moscow U of I (NWS), Sherwin
(NRCS) and Elk River 1 S (NWS). The stations have 50-yr ground snow loads of
42 psf, 125 psf and 143 psf, respectively. The station elevations are 2,660 ft,
3,200 ft, and 2,918 ft, respectively.
60- Moscow U of I station (NWS) is located 11 miles to the north of Genesee and it
has a 50-yr ground snow load of 42 psf and elevation of 2,660 ft
61- Moscow U of I station (NWS) has a 50-yr ground snow load of 42 psf and
elevation of 2,660 ft. the station is located 4 miles to the east of Moscow.
62- Potlatch 3NNE station (NWS) has a 50-yr ground snow load of 39 psf and
elevation of 2,760 ft.
63- Moscow U of I station (NWS) is located 9 miles to the west of Troy and has a 50-
yr ground snow load of 42 psf and elevation of 2,660 ft.
64- Salmon Lemhi Co AP station (NWS) has a 50-yr ground snow load of 15 psf at an
elevation of 4,044 ft.
65- Nez Perce has a station (NWS) with a 50-yr ground snow load of 18 psf.
66- Winchester station (NWS) has snow load of 58 psf and elevation of 3,972 ft.
67- Richfield station (NWS) is 11 miles to the north of Dietrich and has a 50-yr
ground snow load of 61 psf and an elevation of 4,282 ft.
30
68- Richfield station (NWS) has a 50-yr ground snow load of 61 psf and an elevation
of 4,282 ft.
69- Richfield station (NWS) is 14 miles to the northeast of Shoshone and has a 50-yr
ground snow load of 61 psf and an elevation of 4,282 ft.
70- Sugar station (NWS) is located 4 miles to the northeast of Rexburg and has a 50-
yr ground snow load of 50 psf and elevation of 4,925 ft.
71- Sugar station (NWS) has a 50-yr ground snow load of 50 psf and elevation of
4,925 ft.
72- Dworshak Fish Hatchery station (NWS) is 6 mi. to the northeast of Peck and has a
50-yr ground snow load of 51 psf and an elevation of 995.
73- Malad station (NWS) has a 50-yr ground snow load of 111 psf at an elevation of
4,581 ft and Malad City Airport station (NWS) has a 50-yr ground snow load of
35 psf and elevation of 4,482 ft. the stations are three miles apart.
74- Grand View 4 NW (NWS) has a 50-yr ground snow load of 9 psf.
75- Arbon station (NWS) is located 15 miles to the southeast of Rockland and has a
50-yr ground snow load of 81 psf and elevation of 5,210 ft.
76- Kellogg has a station (NWS) with 50-yr ground snow load of 36 psf.
77- Mullan Pass station (NWS) has a 50-yr ground snow load of 140 psf and elevation
of 3,586 ft. the NGSL is 0.039107
78- Wallace Woodland Park Station (NWS) is located 4 miles to the southeast of
Osburn and has a 50-yr ground snow load of 70 psf and elevation of 2,710 ft.
79- Kellogg station (NWS) is located 5 miles to the east of Pinehurst and Fourth of
July Summit is located 14 miles to the west of Pinehurst. The stations have 50-yr
ground snow loads of 36 psf and 93 psf and elevations of 2,377ft and 3,200ft,
respectively.
80- Smelterville is 2 miles to the west of Kellogg.
81- Wardner is 1 mile from Kellogg.
82- Driggs has a station (NWS) with a 50-yr ground snow load of 50 psf.
83- Driggs station (NWS) is located 6 miles to the south of Tetonia and it has a 50-yr
ground snow load of 50 psf and elevation of 6,120 ft.
84- Buhl is located in the center of 3 stations: Twin Falls (NWS), Jerome (NWS), and
Castleford (NWS). The 50-yr ground snow loads are 16, 10 and 35 psf,
respectively.
85- Castleford has a station (NWS) with a 50-yr ground snow load of 35 psf.
86- Hollister has a station (NWS) with a 50-yr snow load of 12 psf.
87- Cascade station (NWS) has a 50-yr ground snow load of 79 psf and elevation of
4,896 ft.
88- Long Valley Station (NRCS) is located 4 miles north of Donnelly and has a 50-yr
ground snow load of 77 psf and elevation of 4,890 ft.
89- McCall has a station (NRCS) with 50-yr ground snow load of 167 psf and
elevation of 5,020 ft
90- Cambridge station (NWS) has a 50-yr ground snow load of 74 psf and elevation
of 2,650 ft.
91- Cambridge station (NWS) is located 7 miles to the south of Midvale and has a 50-
yr ground snow load of 74 psf and elevation of 2,650 ft
31
92- Weiser has a station (NWS) with a 50-yr ground snow load of 17 psf.
93- Bogus Basin has 3 stations: Bogus Basin (NRCS), Bogus Basin Road (NRCS),
and Deer Point (NWS). They have 50-yr ground snow loads of 213, 67 and 161
psf, respectively. The elevations are 6,340, 5,540 and 7,044 ft, respectively.
94- Brundage Mountain has two stations; Brundage Mountain (NRCS) and Brundage
Reservoir (NRCS). The stations have 50-yr ground snow loads of 367 psf and 214
psf and elevations of 7,560 ft and 6,250 ft respectively.
95- Schweitzer Basin Lodge has a station with a 50-yr ground snow load of 364 psf
and an elevation of 6,200 ft.
96- Kellogg Peak Station (NRCS) is located 1.5 to the west of Silverhorn Lodge and
has a 50-yr ground snow load of 191 psf and elevation of 5,560 ft.
97- Mountain Baldy Station (NRCS) has a 50-yr ground snow load of 195 psf and an
elevation of 8,920 ft.