Embed Size (px)
Citation preview
Spectral Reflectance measurements of geological materials in
Northern Victoria Land, Antarctica Stefano Salvi(1), Francesco Mazzarini(2), Fawzi Doumaz(1), Valerio Lombardo(1), Cristiano
Tolomei(1), (1) INGV – Laboratorio di Geodesia e Telerilevamento,
Via di Vigna Murata, 605 00143 Roma, [email protected] (2) CNR-CSGSDA, Via S.Maria, 53, 56126 Pisa, [email protected]
Riassunto
Vengono presentati i risultati di tre diverse campagne di misure spettrali eseguite nella Terra
Vittoria Settentrionale, Antartide. Numerosi spettri di riflettanza sono stati acquisiti su diversi tipi
di superfici rocciose, con una risoluzione di 1 nm nell'intervallo spettrale 0.4-2.5 µm. Vengono
descritte la metodologia di misura sul campo e le procedure di analisi preliminare e validazione dei
dati. Gli spettri sono organizzati in una Libreria Spettrale (LILIAN) che contiene anche tutti i dati
ancillari necessari alla loro validazione. Viene descritta l'organizzazione dei dati nella libreria
LILIAN e le modalità di accesso alla stessa via Web.
Abstract
In situ spectral reflectance measurements of geological materials were performed during three
separate surveys in the Northern Victoria Land, Antarctica. We describe the results of the
campaigns, the measurement methodology of spectral reflectance over geological surfaces, the
preliminary data analysis and the structure of the spectral library LILIAN, which contains the
validated spectra. All the data in LILIAN are public domain and can be accessed freely via Internet.
Their main uses will be to constrain the analysis and geological interpretation of remote sensing
data in the 0.4-2.5 µm wavelength range.
Introduction
Lithologic recognition and mapping is one of the primary task of geological oriented remote
sensing. Remote sensing applications are especially useful when extreme environmental conditions
inhibit direct survey such as in Antarctica.
1
Lithologic mapping from remote sensing data implies a typical methodology composed of different
level of analysis: image calibration, correction for atmospheric effects, image analysis (statistical
and/or deterministic), field verification, and final interpretation. The knowledge of the interaction
mechanisms of the electromagnetic radiation with the surface materials is instrumental for the
fullfillment of all these steps. In particular, in the optical range, the most relevant surface property
for geologic remote sensing is the reflectance.
The spectral intensity of the solar radiation reflected by any natural surface is influenced by the
physical and chemical properties of the material. Various electronic and molecular processes result
from the interaction between incident light and rock minerals. In the 0.4-2.5 µm range spectral
features in reflectance spectra of rocks are due to high energy electronic processes at short
wavelengths and to atomic and molecular vibrational processes at longer wavelengths (Hunt and
Salisbury, 1970; Hunt et al., 1973; Hunt, 1980). Spectral features of the most common rock-forming
minerals are stable in the VNIR range and can be used to identify the mineral phases. Since rocks
are formed by minerals, the relative abundance of their mineral constituents is the main factor
controlling the rock spectral signature. Other important factors are structure, texture and alteration
state of the rock surface.
The collection of reflectance spectra of different materials is finalised to the production of a spectral
library. Generally, the main purpose of a spectral library is to feed a remote sensing data analysis
system with the ground truth needed to perform image calibration and reliable geologic
interpretation. Although many spectral libraries have been published, they have limited use in
lithologic mapping, especially with low spectral resolution data, since they are most often
composed of laboratory measurements of mineral samples (usually pulverised). A more practical
approach consists of collecting rock spectra in the field over the actual reflecting surfaces (Salvi et
al., 1997). Such spectra yield a very accurate ground truth for the application of both statistic and
deterministic techniques of image analysis. In the most favourable cases a few well chosen rock
spectra will constrain all the analysis needed for the lithologic mapping of a large area.
This note describes the activities and the results achieved in the frame of the project 3d.1
‘Spectrometric surveys of Antarctic natural surfaces for an integrated study with remote sensing
data’ of the PNRA (Italian Program of Research in Antarctica). The project plan consisted of two
main tasks: the acquisition of spectral measurements of geological surfaces (rocks, regoliths), and
of glaciated surfaces in Northern Victoria Land, Antarctica.
In this paper we describe the procedures for the acquisition and analysis of in situ reflectance
spectra of the main lithologies of the area carried out during three field surveys in the 1994/1995, 2
1995/1996, 1997/1998 austral summers. Several spectra were measured and the rock surfaces
described in terms of their structure, morphology and composition. The entire database was
organised in a spectral library (LILIAN) freely accessible via Internet.
Geographic and Geologic Outline of the Northern Victoria Land
The Transantarctic Mountains (TAM) is a chain running across Antarctica from the Pacific to
Atlantic sides of the continent. The highest percentage of exposed rocks and soils in the continent is
along this mountain belt, especially in its Pacific border: the Northern Victoria Land (NVL); here
the ice free area is more than 5% of the emerged land.
The main regional morphological features are outlet glaciers, neveé and ice sheets. In such
environment most of free-ice areas are strongly affected by periglacial processes producing block-
field, block-sheet, and debris; other consistent deposits are due to glacial processes as glacial drift,
moraines, and raised beaches. There are also wide areas constituted by supraglacial deposits as
supra glacial moraines (Baroni, 1989a, b; Carmignani et al., 1989a, b).
The geology of the study area is characterised by the occurrence of a Proterozoic - Paleozoic
crystalline basement unconformably covered by continental deposits (Beacon Supergroup, Permian
- Triassic) and by volcanic sequences (Ferrar Supergroup, Jurassic - Early Cretaceous); the
Cenozoic - Quaternary alkaline volcanics (McMurdo Volcanics) close the sequence (Ganovex
Team, 1987; Carmignani et al., 1989a, b).
The sequence above described is made up by metamorphic rocks of low to medium high grade
(slate, schist, gneiss, calcsilicate, and amphibolite), intrusive rocks (granites, mafites, and dykes),
volcanic rocks (dolerite, basalt, and pyroclastics), sedimentary rocks (sandstone, siltite), and glacial
and periglacial deposits.
The intrusives are widespread all over the NVL with ages ranging from the early paleozoic (Late
Cambrian - Early Ordovician) to Cenozoic (Eocene - Oligocene). Difference in ages reflects also
different composition of magmatic sequences: the oldest rocks belongs to the crystalline basement
and constitute the Early Ordovician Granite Harbour Intrusives (GHI) of calcalkaline to subalcaline
affinity (Ghezzo et al., 1989); the youngest ones, the Meander Intrusives (MI), are related to the
alkaline Cenozoic magmatism affecting both Ross Sea area and NVL facing coastal area (Muller et
al., 1991). The GHI are constituted by granite, monzogranite, granodiorite, and tonalite rocks,
coupled with mafic products as diorite and gabbro, whereas the MI are made up of alkali granite
and syenogranite. The Cenozoic McMurdoVolcanics (Kyle, 1990) consists of mildly alkaline to
alkaline volcanic products ranging from alkali basalt to trachyte and from basanite and nephelinite
3
to phonolite. The Mount Melbourne Volcano is an expression of this volcanism. All of these rocks
are often covered by eolic and glacial deposits.
Italian geological spectral surveys in the Northern Victoria Land
In this section for each field party the instrument used, the measured type of rocks and the main
results of the campaign will be briefly described.
Austral summer 1994/1995 field survey
In this survey, measurements where planned to be performed by means of a GER IRIS
spectroradiometer with 5 nm of spectral resolution in the 0.4-2.5 µm range. Unfortunately the
severe Antarctic conditions caused the failure of this instrument early in the survey. The field work
was then performed by a spare EXOTEC 100 AX radiometer (property of CNR-IRSS of Milan)
operating in the wavelength range 0.4-1.1 µm. The EXOTEC allows for the calculation of
reflectance values in four channels relative to the spectral windows of Landsat-MSS or TM
satellites, depending on the filters used. With the same instruments Zibordi and Meloni (1991)
made bihemispherical reflectance measurements of some Antarctic surfaces. During the field
survey, MSS landsat satellite filters were used, using optics with field of view (FOV) of 15°; the
methodology of measurement has been discussed in Casacchia et al. (1999). Field data consisted of
spectral measurements, GPS data and field description of the textural and compositional
characteristics of the rock targets acquired in 52 different sites (Cagnati and Mazzarini, 1995;
Bogliolo et al., 1996; Casacchia et al., 1999). During this period, reflectance values of granitoid
surfaces and of their glacial and eolic deposits were measured. A preliminary spectral lithologic
classification was carried out analysing the collected data, relative to a deglaciated area south of the
Italian Terra Nova base (Casacchia et al., 1999); four classes were identified: a) granites
(granodiorite to monzogranite); b) mafic intrusives (gabbro, diorite and tonalite); c) glacial drift; d)
glacial and eolic deposits related to granites (feldspatic sand).
Austral summer 1995/1996 field survey
During the second campaign, the EXOTEC radiometer was used only in five sites, while most of
the reflectance spectra were acquired by means of a newly acquired Field Spec FR
spectroradiometer. This instrument measures the radiance reflected by a surface, or the solar
irradiance, in 2151 contiguous spectral bands (bandwidth 10 nm) between 350 and 2500 nm.
Various optics can be attached to the instrument via a fiber optic and the system is calibrated in the 4
laboratory with a standard illumination source to obtain absolute radiance measurements. The
reflectance spectra are obtained ratioing the radiance spectrum of the target surface to the radiance
spectrum of a standard reference panel measured in the same illumination geometry. The
instrument was delivered shortly before the beginning of the campaign, therefore the
spectroradiometer had to be tested directly during the Antarctic expedition (Bogliolo et al., 1996).
Several reflectance spectra of the main geological formations were measured for each of 14
different sites (Salvi, 1996). The instrument performed quite well in almost all conditions but the
quality of the spectral measurements suffered from a low S/N in the short wave infrared range and
from a damaged fiber optic cable.
Several types of rocks were spectrally sampled during this expedition. Particularly, granites
(monzogranites, granodiorites and tonalites), high grade metamorphic rocks (schists, gneisses and
amphibolites), metasedimentary rocks (meta-sandstones, meta-siltsones, meta-limestones), mafic
intrusive rocks (gabbros and diorites), pyroclastic rocks and basaltic and doleritic lavas, glacial
deposits (moraines), regolithic covers. GPS coordinates and field description of the textural and
compositional characteristics of the measured rock surfaces were recorded.
Austral summer 1997/1998 field survey
To increase the number of spectral measurements and to improve the quality of the spectra collected
in the previous campaign, a new survey was carried out in November/December 1997. The Field
Spec FR spectroradiometer was re-calibrated and a new fiber optic mounted to improve the overall
S/N. Rock surfaces were spectrally sampled in 17 sites; considering the improved instrument
performance, part of the measurements from the previous campaign were repeated and better
quality spectra were acquired. In 10 sites, spectral measurements from helicopter were also
performed to improve the surface characterization at the pixel scale of remote sensing images.
During this campaign reflectance spectra of granites (monzogranites and granodiorites), high grade
metamorphic rocks (schists, gneisses and amphibolites), regolites from alkaline lavas, pyroclastic
rocks, basaltic and doleritic lavas and Quaternary-Holocene beach deposits were acquired (Salvi,
98). Geological samples were collected for all the measured surfaces, to be later analysed and yield
the necessary information for the ancillary data files (see library description).
A further objective of the campaign was to identify a few sites to be used for the calibration and
atmospheric correction of remote sensing images, and measure their spectral reflectance. For this
purpose the site had to match the following requirements: high spectral homogeneity over a
minimum area of 60 x 60 m, very small local relief, gentle slope (0-10 degrees), easy identification
5
on remote sensing images. Availability of ground sites with a wide range of reflectances, some of
them possibly located at different elevations to account for the difference in atmospheric paths, was
also required. A few of the measured sites had these characteristics and were marked as possible
calibration sites.
Measurement methodology
Most of the surfaces measured with the 4-bands EXOTEC radiometer during the 94/95 and 95/96
campaigns were subsequently re-measured with the FieldSpec spectroradiometer. We verified the
consistency of the different measurements (see Figure 5 later in the text), thus we will describe in
the sequel methodology and results for the FieldSpec campaigns only.
The typical measurement procedure in the field consisted of using a tripod to hold the fiber optics
perpendicular to the surface at a distance generally between 0.3 and 0.6 meters; a FOV of 25° was
used, thereby sampling the surface over a circular area with diameter between 13 and 24 cm. Some
stop-and-go measurements were also done (i.e. holding the optics in hand and moving over the
surface after each measurement) to obtain an average spectral response over heterogeneous
materials as for instance poligenic regoliths and glacial drifts.
To minimize the effects of variable solar zenith angle on the reference panel response (see later in
this chapter) a particular measurement setting was also used (coded TI in LILIAN, see next
chapter). In this setting the reference panel was placed perpendicular to the solar illumination
direction (solar zenith angle = 0) and the optics was also aligned with this direction (view angle =
solar zenith angle). The target surface was chosen as close to the same geometry as possible.
During the 1995/1996 campaign some test measurements were executed from the helicopter at 50 to
100 m heights, in order to sample areas comparable to the pixel dimensions of satellite images (20 -
40 m) and obtain an average of the spectral contributions for non uniform surfaces. The spectra
measured during the aerial tests of the 1995 campaign did not compare well with the ground
measured spectra, mainly because the measurement time required to obtain a good signal was about
2-3 minutes and it was difficult to maintain a stable illumination geometry and to keep the same
surface area within the instrument FOV. These problems were partially solved during the
1997/1998 campaign, when the higher S/N of the improved instrument allowed for faster
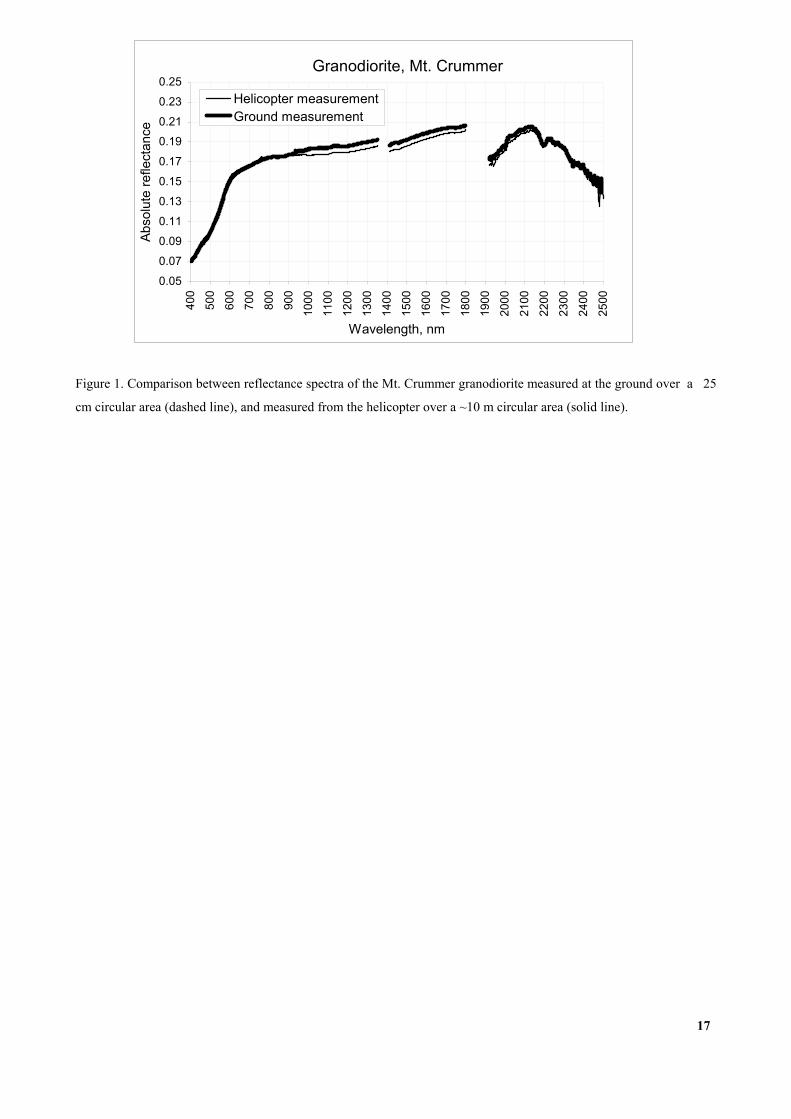
measurements. Moreover for most sites the measurement distance was reduced to 10-15 m, which
corresponds to a 5-7 m-wide circular area, ensuring a better target uniformity during the
measurement. This measurement setting resulted in a good correspondance between ground and air
measurements (Figure 1).
6
As an additional requirement for the execution of good measurements the cloud cover had to be
close to zero; a minimal cover was tolerated when located far from the sun disc and was in any case
reported in the ancillary data file. The instrument was used most often in radiance mode, i.e. the
radiance reflected from the target surface and the reference panel were measured and stored as a
independent spectral files. Notwithstanding the requirement of clear sky and stable overall
illumination, the radiances reflected from target and panel were measured in short succession to
minimize the changes in illumination conditions. For all measurements, the reference panel used
was a 30 x 30 cm Spectralon board whose absolute directional/hemispherical reflectance factor was
certified.
For each target surface a large number of spectra (up to several tens for the less homogeneous
materials) was measured and averaged to increase the S/N and account for the compositional
variability.
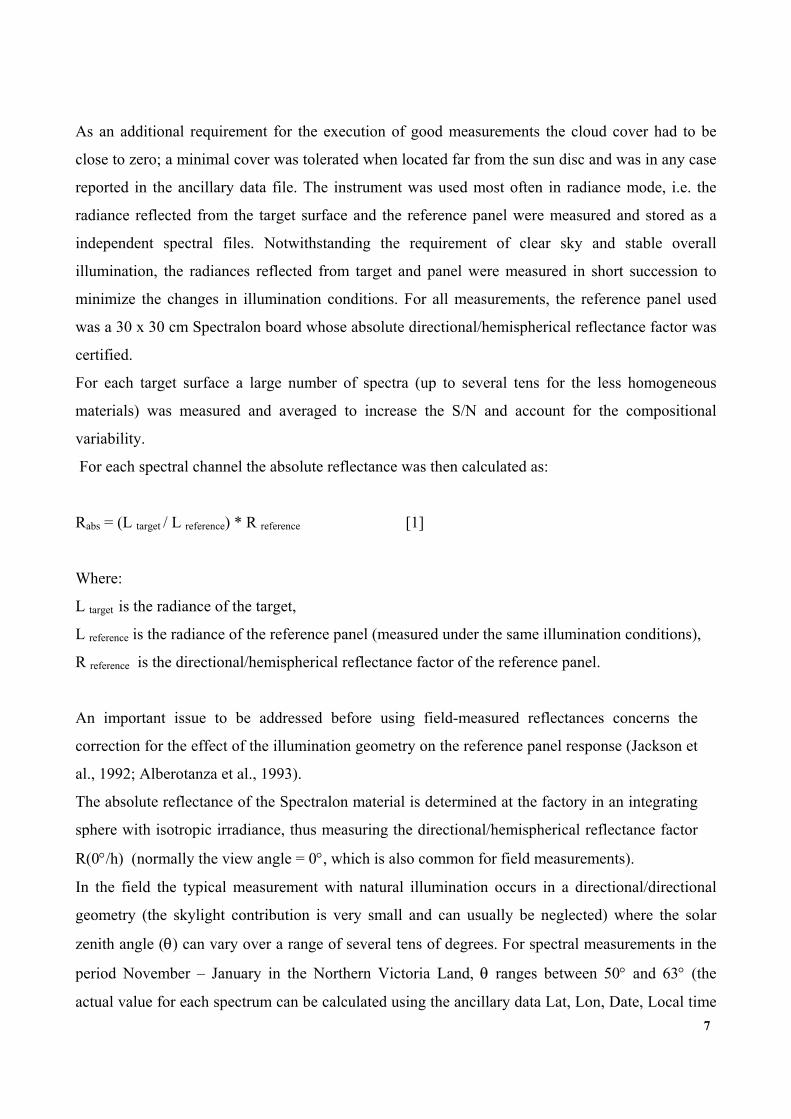
For each spectral channel the absolute reflectance was then calculated as:
Rabs = (L target / L reference) * R reference [1]
Where:
L target is the radiance of the target,
L reference is the radiance of the reference panel (measured under the same illumination conditions),
R reference is the directional/hemispherical reflectance factor of the reference panel.
An important issue to be addressed before using field-measured reflectances concerns the
correction for the effect of the illumination geometry on the reference panel response (Jackson et
al., 1992; Alberotanza et al., 1993).
The absolute reflectance of the Spectralon material is determined at the factory in an integrating
sphere with isotropic irradiance, thus measuring the directional/hemispherical reflectance factor
R(0°/h) (normally the view angle = 0°, which is also common for field measurements).
In the field the typical measurement with natural illumination occurs in a directional/directional
geometry (the skylight contribution is very small and can usually be neglected) where the solar
zenith angle (θ) can vary over a range of several tens of degrees. For spectral measurements in the
period November – January in the Northern Victoria Land, θ ranges between 50° and 63° (the
actual value for each spectrum can be calculated using the ancillary data Lat, Lon, Date, Local time 7
and a commercial program for ephemerides calculation). Bidirectional calibration factors for
Spectralon panels have been obtained from laboratory experiments (Jackson et al., 1992;
Alberotanza et al., 1993) and can be used to calculate absolute directional/directional reflectance
spectra from the uncalibrated field spectral data.
We decided to leave the user the choice of which calibration factors to use, and did not apply any
directional/directional reflectance calibration to the LILIAN data. Since the calibration consists in
the multiplication for a number usually between 0.8 and 0.98, it would change only to a minor
extent the shape of the spectrum and the depth of absorption features. The latter should therefore be
cleary distinguishable even in the uncalibrated spectral data.
Moreover we executed at several sites measurements in TI mode (see previous section) which, for
smooth and quasi-lambertian targets give a good approximation of the directional/directional
reflectance.
LILIAN, the reflectance spectral library of antarctic lithologies
Introduction
The absolute reflectance spectra calculated according the [1] for all measured surfaces were then
examined for noise evaluation and for a first validation. Some spectra contained considerable
noise or spectral artifacts due to erroneous measurement setting or change in the illumination
conditions between the target and reference radiance measurements, and were discarded.
The remaining spectra form our reflectance spectral library LILIAN. The acronym LILIAN
indicates that most of its content regards antarctic lithologies, although a minor number of non-
geologic antarctic surfaces are also included.
A fundamental step in the creation of a spectral library is the data validation, i.e. the association
of each spectrum to a set of ancillary data pertaining to:
the compositional characteristics of the measured surface;
the geographical and geological characteristics of the site;
the instrument characteristics and all environmental parameters which could have influenced
the measurement.
While information on the site, instrument, and environmental conditions were noted at the
measurement time, the composition of the measured surface was in general only visually
described in the field and representative samples were collected to proceed later to a more
detailed petrographical analysis.
8
Different analysis techniques were used to characterize the mineral composition of the samples.
Igneous rocks characterized by holocrystalline texture allowed for a modal analysis. For these
rocks one thin section (occasionally two when a textural anisotropy was evident) was made,
trying when needed to cut the section through the alteration band. The mineralogical
composition was established using a polarized-light microscope to resolve the optical features of
the different crystals within the rock. Petrographic microscope provided also useful information
of the texture and structure of the rocks. The fraction of each mineralogical species was
calculated using a point-counter to retrieve the modal distribution of the paragenesis. This
method allows also for the estimation of the glass content for the hypocrystalline lavas or the
fraction of vacuoles for pumices and scoria.
For siltstones and claystones a qualitative mineralogical composition was obtained by X-ray
diffrattometry, which allows to discriminate among the various clay minerals.
In the digital library LILIAN, the analysis data have been integrated when possible with pictures
of the thin sections and of the measured surfaces (in a WEB-compliant format) and with
diffractograms (as spreadsheet files). LILIAN spectra and accessory files can be searched,
browsed, or downloaded from the following Web address:
http://www.ingv.it/labtel2/LibrerieSpettral/LILIAN.htm
The LILIAN structure and file formats
We used a rather simple structure for LILIAN, preferring a plain file organization to the use of
data base software packages and complex data formatting.
Three main types of data files are used: spectral data files, wavelength data files and ancillary data
files. Additional information can be stored in image files, diffractometric data files, etc.
The spectral data file contains the absolute reflectance spectrum in the following format (Fig. 3):
Rec. 1 : Name of the spectral data file itself
Rec. 2: Definitions of the numerical fields in the following records, typically: Wavelength, Name of
lithology measured
Rec. 3 to the EOF: central wavelength (in nm) of the spectral band, absolute reflectance value (in
the range 0-1)
A wavelength data file exists for each instrument (or instrument configuration), containing:
Rec. 1: Header record: definitions of the 4 numerical fields in the following records
9
Rec. 2 to EOF: Band number, Central wavelength, Minimum wavelength, Maximum wavelength
(all in µm)
The ancillary data file is named after the target surface and contains its complete description
(Figure 2); it also contains the pointers to the other files: spectral file, wavelength file, image file.
In particular the first 24 records of the ancillary data file contain the site and surface descriptions,
the record # 25 contains the number N of the spectral measurements available for that surface, while
the following N blocks of 26 records contain the instrument and environmental data relative to each
of the N measurements. Each block contains also the pointer to the actual spectral data file, i.e. the
name of the file itself. The file is in ASCII format and each record contains one or more keywords
descriptive of the data fields. For character fields the no data is the slash character (/), for numeric
fields is the number 999. For some character fields the data are coded (Tables 1, 2, 3, 4).
A detailed description of the records of the ancillary data file follows, see sample file in figure 2.
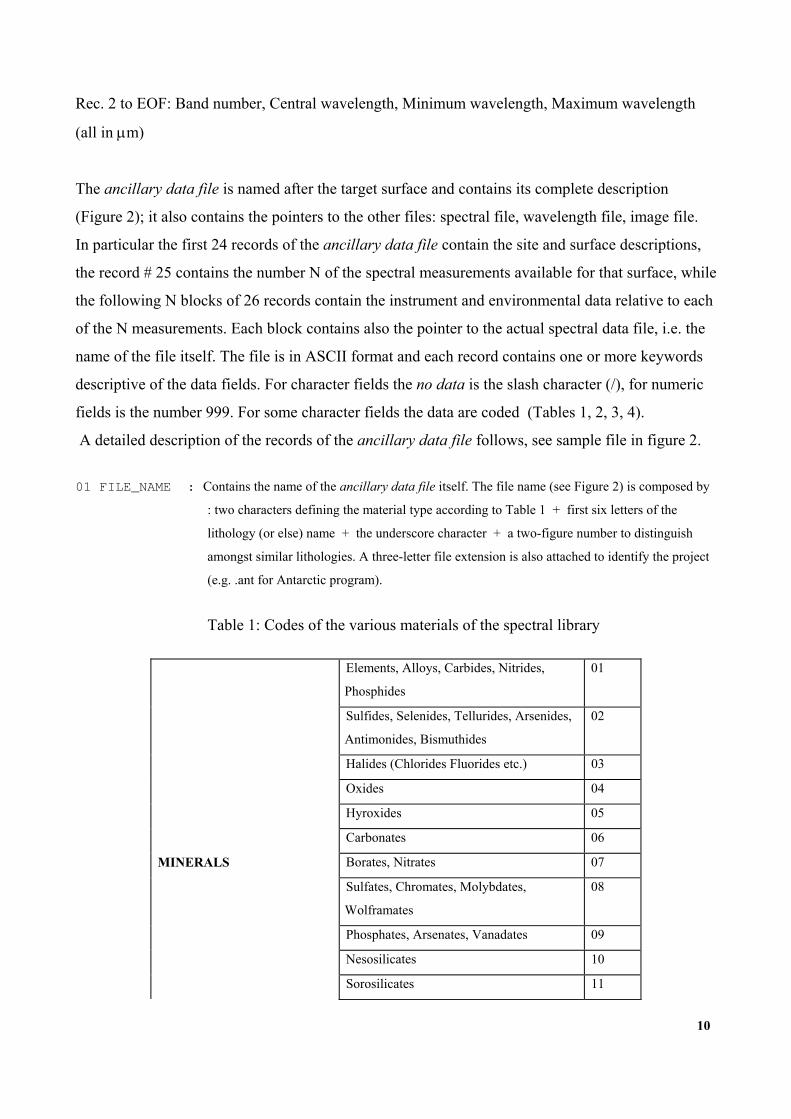
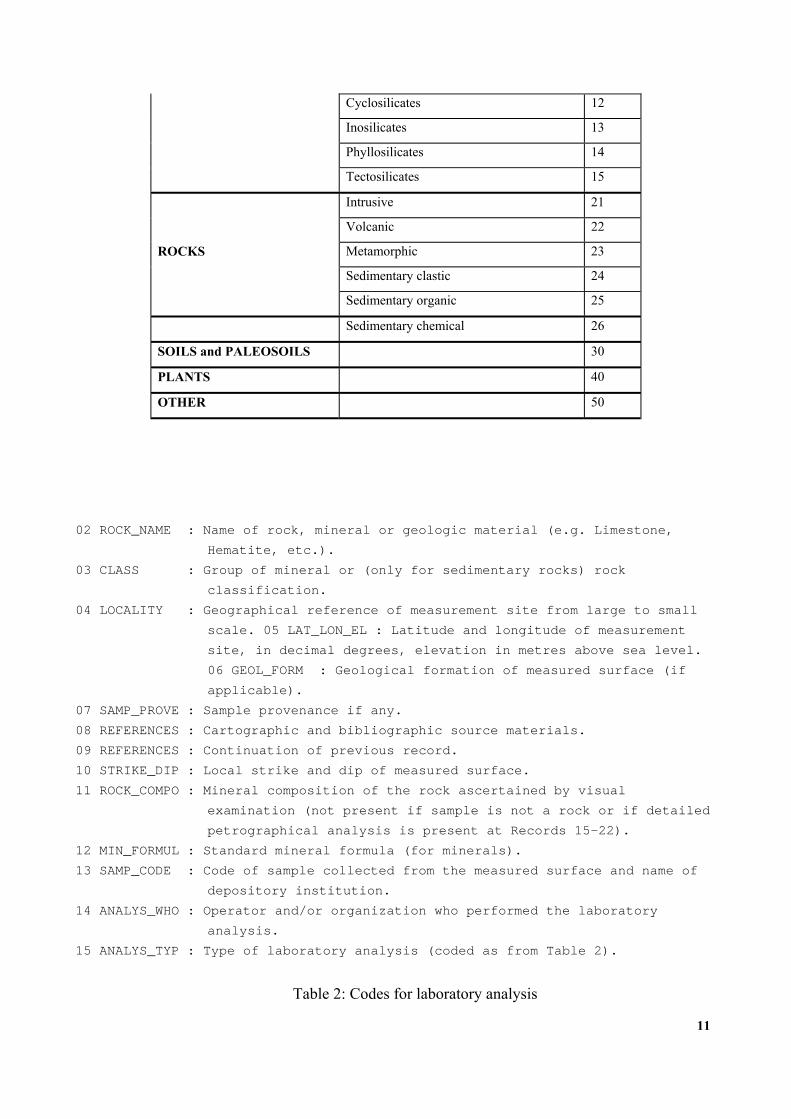
01 FILE_NAME : Contains the name of the ancillary data file itself. The file name (see Figure 2) is composed by
: two characters defining the material type according to Table 1 + first six letters of the
lithology (or else) name + the underscore character + a two-figure number to distinguish
amongst similar lithologies. A three-letter file extension is also attached to identify the project
(e.g. .ant for Antarctic program).
Table 1: Codes of the various materials of the spectral library
Elements, Alloys, Carbides, Nitrides,
Phosphides
01
Sulfides, Selenides, Tellurides, Arsenides,
Antimonides, Bismuthides
02
Halides (Chlorides Fluorides etc.) 03
Oxides 04
Hyroxides 05
Carbonates 06
MINERALS Borates, Nitrates 07
Sulfates, Chromates, Molybdates,
Wolframates
08
Phosphates, Arsenates, Vanadates 09
Nesosilicates 10
Sorosilicates 11
10
Cyclosilicates 12
Inosilicates 13
Phyllosilicates 14
Tectosilicates 15
Intrusive 21
Volcanic 22
ROCKS Metamorphic 23
Sedimentary clastic 24
Sedimentary organic 25
Sedimentary chemical 26
SOILS and PALEOSOILS 30
PLANTS 40
OTHER 50
02 ROCK_NAME : Name of rock, mineral or geologic material (e.g. Limestone,
Hematite, etc.).
03 CLASS : Group of mineral or (only for sedimentary rocks) rock
classification.
04 LOCALITY : Geographical reference of measurement site from large to small
scale. 05 LAT_LON_EL : Latitude and longitude of measurement
site, in decimal degrees, elevation in metres above sea level.
06 GEOL_FORM : Geological formation of measured surface (if
applicable).
07 SAMP_PROVE : Sample provenance if any.
08 REFERENCES : Cartographic and bibliographic source materials.
09 REFERENCES : Continuation of previous record.
10 STRIKE_DIP : Local strike and dip of measured surface.
11 ROCK_COMPO : Mineral composition of the rock ascertained by visual
examination (not present if sample is not a rock or if detailed
petrographical analysis is present at Records 15-22).
12 MIN_FORMUL : Standard mineral formula (for minerals).
13 SAMP_CODE : Code of sample collected from the measured surface and name of
depository institution.
14 ANALYS_WHO : Operator and/or organization who performed the laboratory
analysis.
15 ANALYS_TYP : Type of laboratory analysis (coded as from Table 2).
Table 2: Codes for laboratory analysis
11
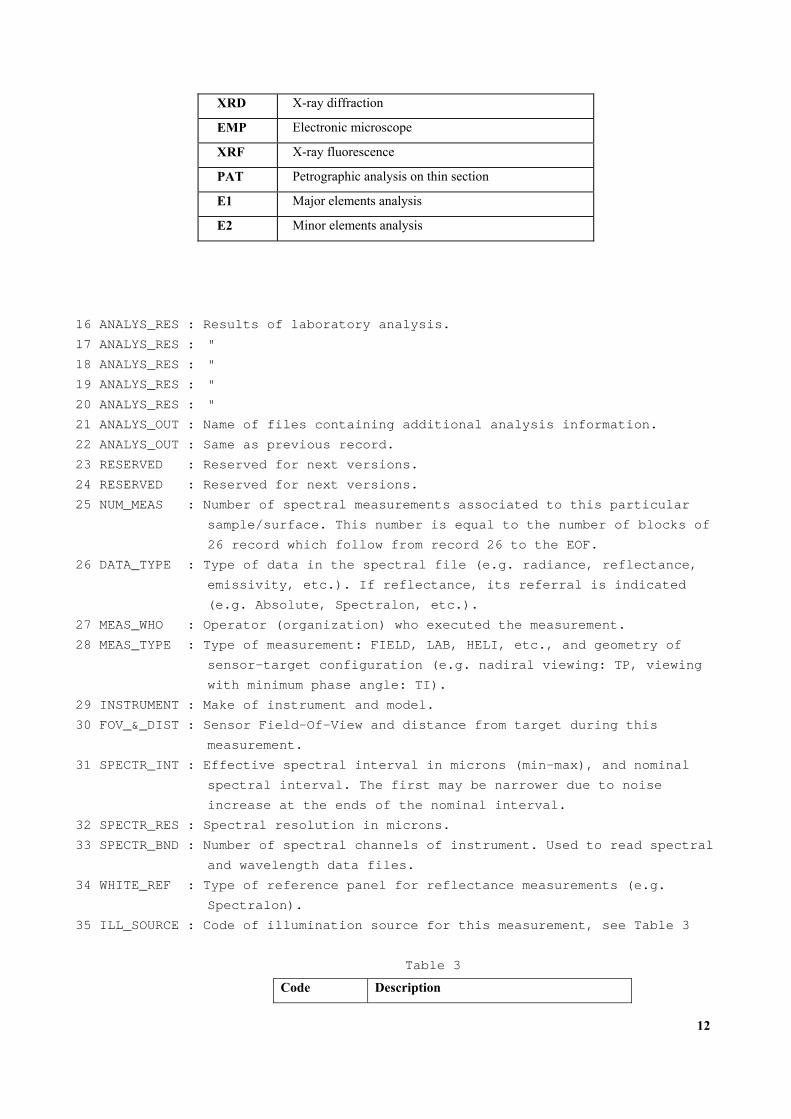
XRD X-ray diffraction
EMP Electronic microscope
XRF X-ray fluorescence
PAT Petrographic analysis on thin section
E1 Major elements analysis
E2 Minor elements analysis
16 ANALYS_RES : Results of laboratory analysis.
17 ANALYS_RES : "
18 ANALYS_RES : "
19 ANALYS_RES : "
20 ANALYS_RES : "
21 ANALYS_OUT : Name of files containing additional analysis information.
22 ANALYS_OUT : Same as previous record.
23 RESERVED : Reserved for next versions.
24 RESERVED : Reserved for next versions.
25 NUM_MEAS : Number of spectral measurements associated to this particular
sample/surface. This number is equal to the number of blocks of
26 record which follow from record 26 to the EOF.
26 DATA_TYPE : Type of data in the spectral file (e.g. radiance, reflectance,
emissivity, etc.). If reflectance, its referral is indicated
(e.g. Absolute, Spectralon, etc.).
27 MEAS_WHO : Operator (organization) who executed the measurement.
28 MEAS_TYPE : Type of measurement: FIELD, LAB, HELI, etc., and geometry of
sensor-target configuration (e.g. nadiral viewing: TP, viewing
with minimum phase angle: TI).
29 INSTRUMENT : Make of instrument and model.
30 FOV_&_DIST : Sensor Field-Of-View and distance from target during this
measurement.
31 SPECTR_INT : Effective spectral interval in microns (min-max), and nominal
spectral interval. The first may be narrower due to noise
increase at the ends of the nominal interval.
32 SPECTR_RES : Spectral resolution in microns.
33 SPECTR_BND : Number of spectral channels of instrument. Used to read spectral
and wavelength data files.
34 WHITE_REF : Type of reference panel for reflectance measurements (e.g.
Spectralon).
35 ILL_SOURCE : Code of illumination source for this measurement, see Table 3
Table 3
Code Description
12
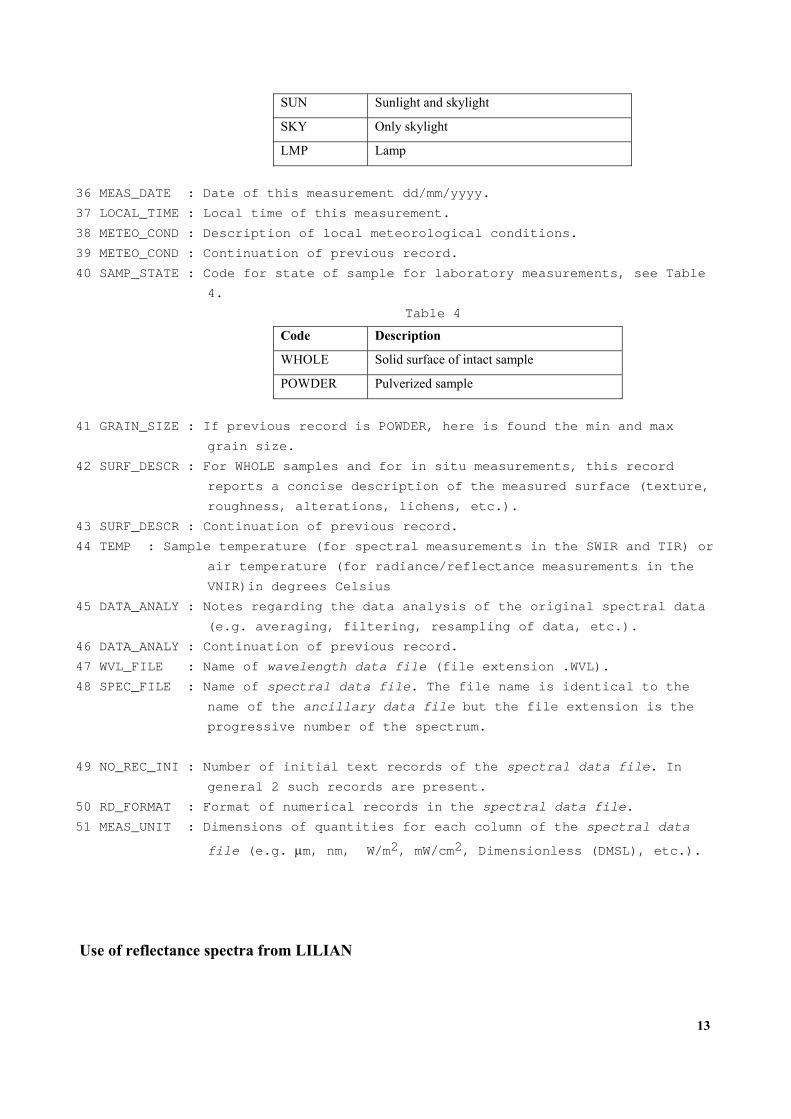
SUN Sunlight and skylight
SKY Only skylight
LMP Lamp
36 MEAS_DATE : Date of this measurement dd/mm/yyyy.
37 LOCAL_TIME : Local time of this measurement.
38 METEO_COND : Description of local meteorological conditions.
39 METEO_COND : Continuation of previous record.
40 SAMP_STATE : Code for state of sample for laboratory measurements, see Table
4.
Table 4
Code Description
WHOLE Solid surface of intact sample
POWDER Pulverized sample
41 GRAIN_SIZE : If previous record is POWDER, here is found the min and max
grain size.
42 SURF_DESCR : For WHOLE samples and for in situ measurements, this record
reports a concise description of the measured surface (texture,
roughness, alterations, lichens, etc.).
43 SURF_DESCR : Continuation of previous record.
44 TEMP : Sample temperature (for spectral measurements in the SWIR and TIR) or
air temperature (for radiance/reflectance measurements in the
VNIR)in degrees Celsius
45 DATA_ANALY : Notes regarding the data analysis of the original spectral data
(e.g. averaging, filtering, resampling of data, etc.).
46 DATA_ANALY : Continuation of previous record.
47 WVL_FILE : Name of wavelength data file (file extension .WVL).
48 SPEC_FILE : Name of spectral data file. The file name is identical to the
name of the ancillary data file but the file extension is the
progressive number of the spectrum.
49 NO_REC_INI : Number of initial text records of the spectral data file. In
general 2 such records are present.
50 RD_FORMAT : Format of numerical records in the spectral data file.
51 MEAS_UNIT : Dimensions of quantities for each column of the spectral data
file (e.g. µm, nm, W/m2, mW/cm2, Dimensionless (DMSL), etc.).
Use of reflectance spectra from LILIAN
13
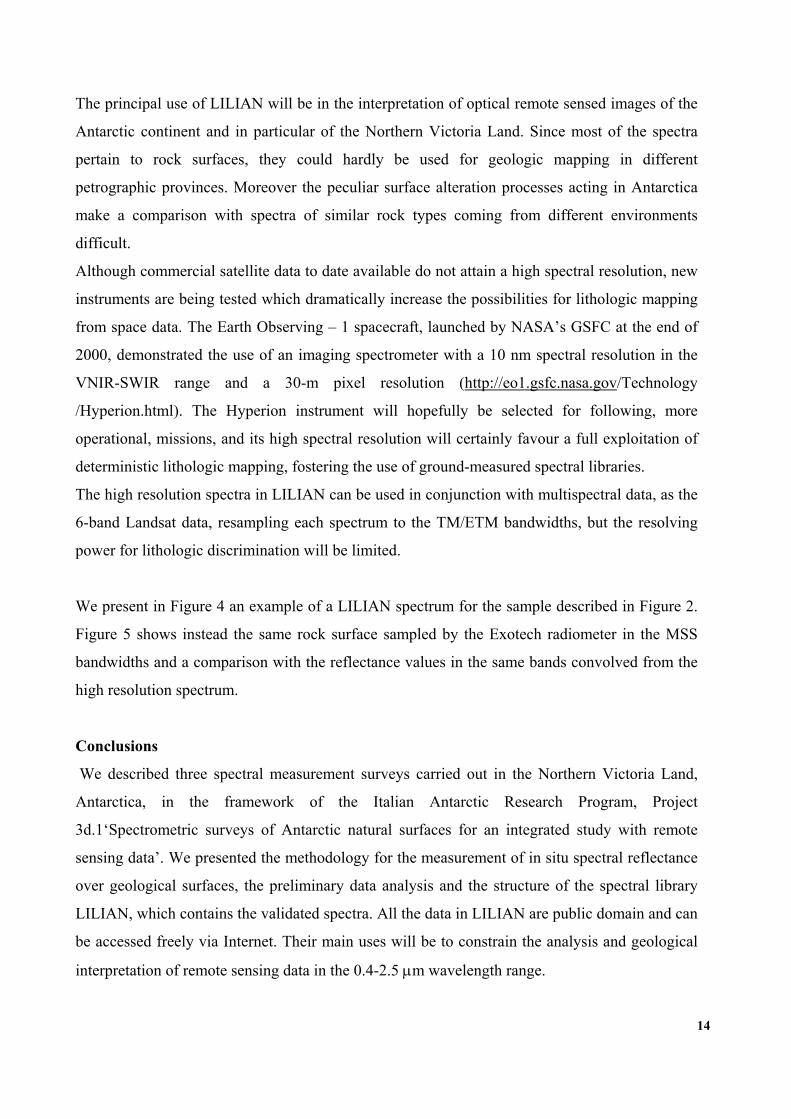
The principal use of LILIAN will be in the interpretation of optical remote sensed images of the
Antarctic continent and in particular of the Northern Victoria Land. Since most of the spectra
pertain to rock surfaces, they could hardly be used for geologic mapping in different
petrographic provinces. Moreover the peculiar surface alteration processes acting in Antarctica
make a comparison with spectra of similar rock types coming from different environments
difficult.
Although commercial satellite data to date available do not attain a high spectral resolution, new
instruments are being tested which dramatically increase the possibilities for lithologic mapping
from space data. The Earth Observing – 1 spacecraft, launched by NASA’s GSFC at the end of
2000, demonstrated the use of an imaging spectrometer with a 10 nm spectral resolution in the
VNIR-SWIR range and a 30-m pixel resolution (http://eo1.gsfc.nasa.gov/Technology
/Hyperion.html). The Hyperion instrument will hopefully be selected for following, more
operational, missions, and its high spectral resolution will certainly favour a full exploitation of
deterministic lithologic mapping, fostering the use of ground-measured spectral libraries.
The high resolution spectra in LILIAN can be used in conjunction with multispectral data, as the
6-band Landsat data, resampling each spectrum to the TM/ETM bandwidths, but the resolving
power for lithologic discrimination will be limited.
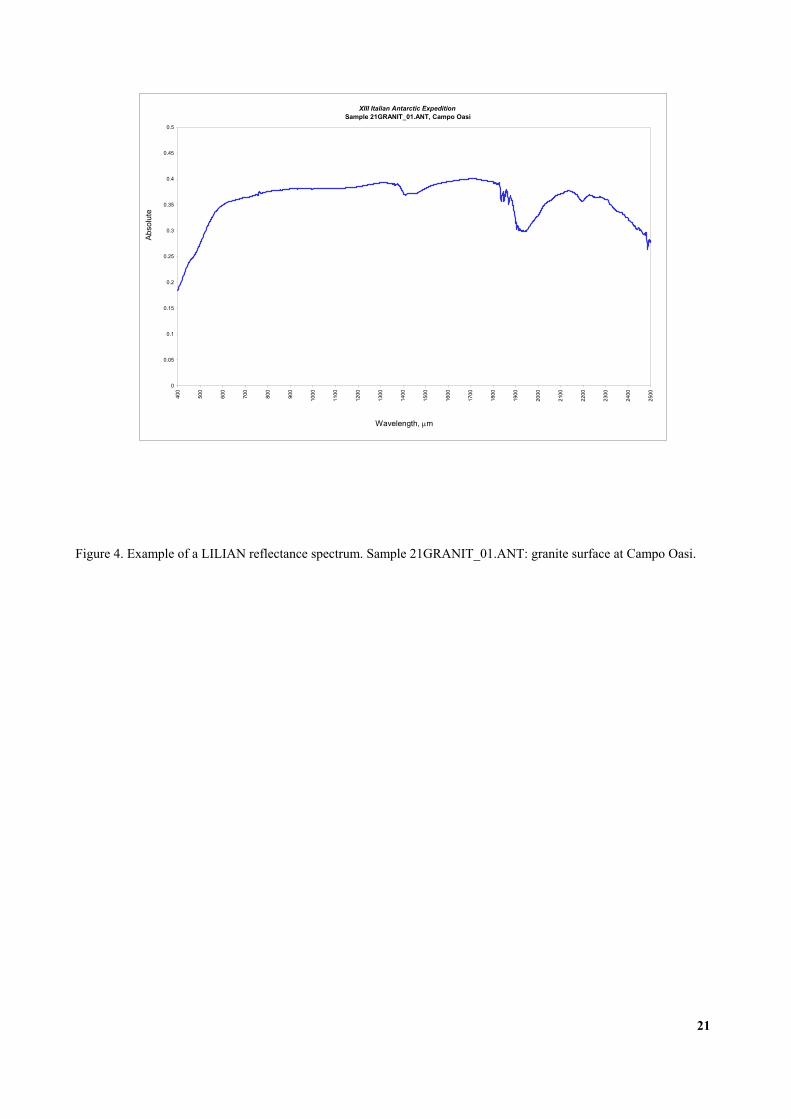
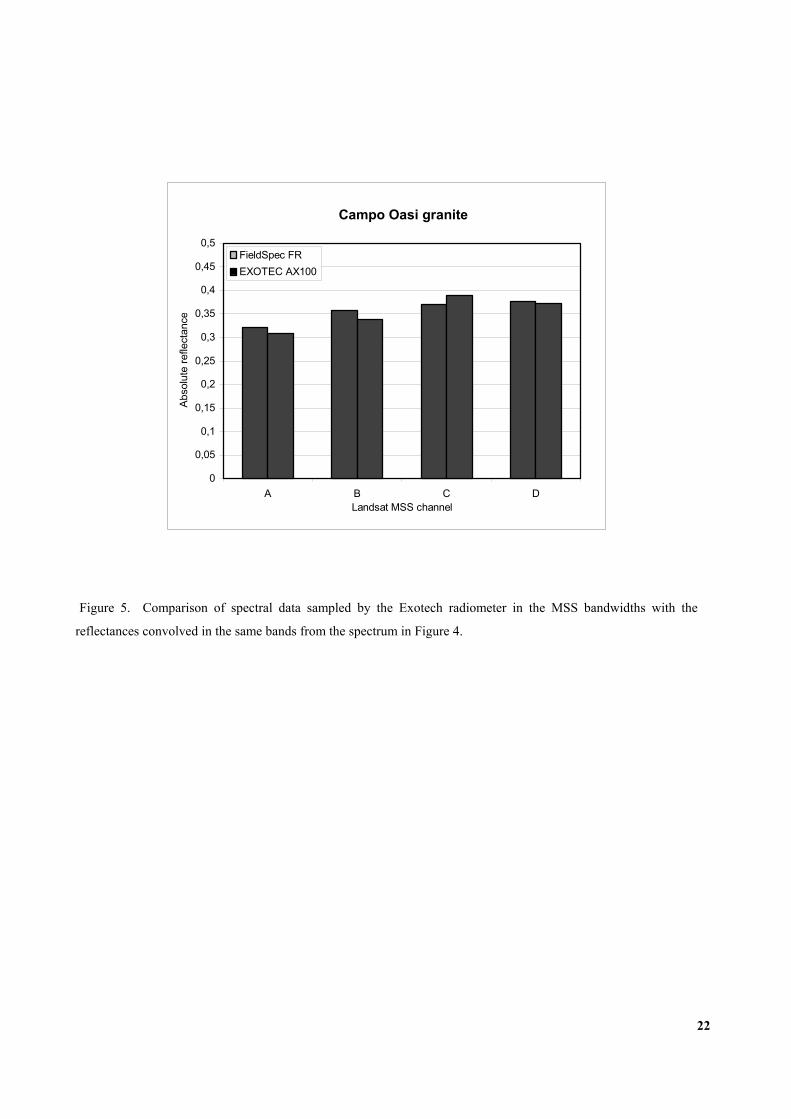
We present in Figure 4 an example of a LILIAN spectrum for the sample described in Figure 2.
Figure 5 shows instead the same rock surface sampled by the Exotech radiometer in the MSS
bandwidths and a comparison with the reflectance values in the same bands convolved from the
high resolution spectrum.
Conclusions
We described three spectral measurement surveys carried out in the Northern Victoria Land,
Antarctica, in the framework of the Italian Antarctic Research Program, Project
3d.1‘Spectrometric surveys of Antarctic natural surfaces for an integrated study with remote
sensing data’. We presented the methodology for the measurement of in situ spectral reflectance
over geological surfaces, the preliminary data analysis and the structure of the spectral library
LILIAN, which contains the validated spectra. All the data in LILIAN are public domain and can
be accessed freely via Internet. Their main uses will be to constrain the analysis and geological
interpretation of remote sensing data in the 0.4-2.5 µm wavelength range.
14
Acknowledgments
We thank E. Zilioli for lending the EXOTECH radiometer during the 1994/1995 and 1995/1996
surveys. We are very grateful to all the logistic personnel of the Italian base at Terranova Bay for
the help given in many occasions, and especially to the scouts and helicopter pilots who were very
comprehensive and collaborative during the field measurements. References
Alberotanza L., Canossi I., Pavanati M., Ramasco C., Zibordi G., (1993). Spettri di riflettanza di
superfici naturali: metodologia di misura ed applicazione ad acque lagunari. Rivista Italiana
di Telerilevamento, 2, 17-20.
Baroni C. (1989a). Geomorphological map of the Northern Foothills near the Italian Station (Terra
Nova Bay, Antarctica), 1:20000 scale. Mem. Soc. Geol. It., 33, 195-211.
Bogliolo M., Buongiorno M.F., Cagnati A., Casacchia R., Mazzarini F., Salvatori R., Salvi S.,
Salvini F., Tomasoni R., Valt M., Zilioli E., (1996). Radiometria di superfici glaciologiche e
geologiche in Antartide. ING publication n. 580, 54 pp.
Cagnati A., Mazzarini F., (1995). Report Campagna Antartica 1994-95, Progetto 3b-3b.1
Telerilevamento. Rapporto Campagna Antartica Estate Australe 1994-95, Decima Spedizione,
Progetto Antartide ANT 95/02, 163-167.
Carmignani L., Ghezzo C., Gosso G., Lelli A., Lombardo B., Meccheri M., Montrasio A., Pertusati
P.C., Salvini F. (1989a). Geological map of the area between David and Mariner Glaciers,
(Victoria Land-Antarctica), 1:500000 scale. Mem. Soc. Geol. It., 33.
Carmignani L., Ghezzo C., Gosso G., Lelli A., Lombardo B., Meccheri M., Montrasio A., Pertusati
P.C., Salvini F. (1989b). Geology of the Wilson Terrane in the area between David and
Mariner Glaciers, (Victoria Land-Antarctica). Mem. Soc. Geol. It., 33, 79-99.
Casacchia R., Mazzarini F., Salvatori R., Salvini F., (1999). Rock-type discrimination by field, TM
and SPOT data, Tarn Flat, Antarctica. International Journal of Remote Sensing 20, 2, 403-
420.
GANOVEX Team, (1987). Geological Map of the North Victoria Land, Antarctica (1:500,000).
Explanation Notes. Geol. Jb.., Vol. B66, 7-79.
Ghezzo C., Baldelli C., Biagini R., Carmignani L., Di Vincenzo G., Gosso G., Lelli A., Lombardo
B., Montrasio A., Pertusati P.C., Salvini F. (1989). Granitoids from the David Glacier-Aviator
Glacier segment of the Transantarctic Mountains, North Victoria Land, Antarctica. Mem.
Soc. Geol. It., 33, 143-159.
15
Jackson R.D., Clarke T.R., Moran M.S., (1992). Bidirectional calibration results for 11 spectralon
and BaSO4 reference reflectance panels. Remote Sensing of Environment, 40, 231-239.
Hunt G.R., (1980). Electromagnetic radiation: the communication link in remote sensing. In Siegal
B.S., Gillespie A.R., Remote Sensing in Geology. John Wiley & Sons Inc., Usa.
Hunt G.R., Salisbury J.W., (1970). Visible and near-infrared spectra of minerals and rocks: I
Silicate minerals. Modern geology, 1, 283-300.
Hunt G.R., Salisbury J.W., Lenhoff C.J., (1973). Visible and near-infrared spectra of minerals and
rocks: VII Acidic igneous rocks. Modern geology, 4, 217-224.
Kyle P.R., (1990). McMurdo Volcanic Group western Ross Embayment. In: LeMasurier &
Thompson (eds.), Volcanoes of the Antarctic Plate & Southern Oceans, AGU, Washington,
Antarctic Research Series, 48, 19-145.
Muller P., Schmidt-Thome M., Kreuzer H., Tessenshon F. & Vetter U., (1991). Cenozoic
Peralkaline Magmatism at the Western Margin of the Ross Sea, Antarctica. Mem. Soc. Geol.
It., 46, 315-336.
Salvi S., (1996). Report Campagna Antartica 1995-96, Progetto 3b-3b.1 Telerilevamento. Rapporto
Campagna Antartica Estate Australe 1995-96, Undicesima Spedizione, Progetto Antartide
ANT 96/07, 123-124.
Salvi S., (1998). Report Campagna Antartica 1997-98, Progetto 3b-3d.1 Rilievi spettroradiometrici
di superfici naturali in Antartide per uno studio integrato con dati telerilevati. Rapporto
Campagna Antartica Estate Australe 1997-98, Undicesima Spedizione, Progetto Antartide
ANT 98/02, 139-140.
Salvi S., Bogliolo P.M., Buongiorno M.F., (1997). A reflectance spectral library for Antarctic rock
types in the range 0.4-2.5 µm. In: The Antarctic Region: Geological Evolution and Processes
(C.A.Ricci ed.) Terra Pub, Siena, 1111-1116.
Zibordi G., Meloni G.P. (1991). Correction of bihemispherical reflectance measurements for
noncosine response of 2π steradian optics: a methodology and its application to Antarctic
surfaces. Rem. Sens. Environ., 37, 55-62.
16
0.05
0.07
0.09
0.11
0.13
0.15
0.17
0.190.21
0.23
0.25
400
500
600
700
800
900
1000
1100
1200
1300
1400
1500
1600
1700
1800
1900
2000
2100
2200
2300
2400
2500
Wavelength, nm
Abso
lute
refle
ctan
ce
Helicopter measurementGround measurement
Granodiorite, Mt. Crummer
Figure 1. Comparison between reflectance spectra of the Mt. Crummer granodiorite measured at the ground over a 25
cm circular area (dashed line), and measured from the helicopter over a ~10 m circular area (solid line).
17
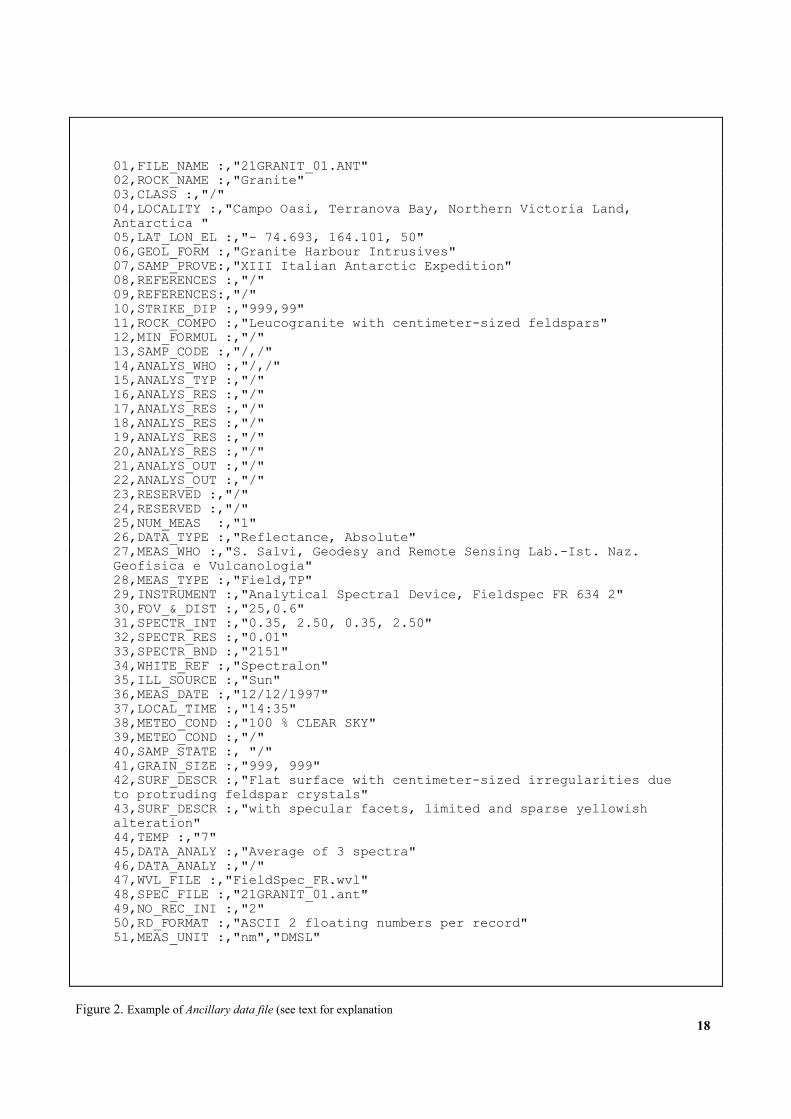
01,FILE_NAME :,"21GRANIT_01.ANT" 02,ROCK_NAME :,"Granite" 03,CLASS :,"/" 04,LOCALITY :,"Campo Oasi, Terranova Bay, Northern Victoria Land, Antarctica " 05,LAT_LON_EL :,"- 74.693, 164.101, 50" 06,GEOL_FORM :,"Granite Harbour Intrusives" 07,SAMP_PROVE:,"XIII Italian Antarctic Expedition" 08,REFERENCES :,"/" 09,REFERENCES:,"/" 10,STRIKE_DIP :,"999,99" 11,ROCK_COMPO :,"Leucogranite with centimeter-sized feldspars" 12,MIN_FORMUL :,"/" 13,SAMP_CODE :,"/,/" 14,ANALYS_WHO :,"/,/" 15,ANALYS_TYP :,"/" 16,ANALYS_RES :,"/" 17,ANALYS_RES :,"/" 18,ANALYS_RES :,"/" 19,ANALYS_RES :,"/" 20,ANALYS_RES :,"/" 21,ANALYS_OUT :,"/" 22,ANALYS_OUT :,"/" 23,RESERVED :,"/" 24,RESERVED :,"/" 25,NUM_MEAS :,"1" 26,DATA_TYPE :,"Reflectance, Absolute" 27,MEAS_WHO :,"S. Salvi, Geodesy and Remote Sensing Lab.-Ist. Naz. Geofisica e Vulcanologia" 28,MEAS_TYPE :,"Field,TP" 29,INSTRUMENT :,"Analytical Spectral Device, Fieldspec FR 634 2" 30,FOV_&_DIST :,"25,0.6" 31,SPECTR_INT :,"0.35, 2.50, 0.35, 2.50" 32,SPECTR_RES :,"0.01" 33,SPECTR_BND :,"2151" 34,WHITE_REF :,"Spectralon" 35,ILL_SOURCE :,"Sun" 36,MEAS_DATE :,"12/12/1997" 37,LOCAL_TIME :,"14:35" 38,METEO_COND :,"100 % CLEAR SKY" 39,METEO_COND :,"/" 40,SAMP_STATE :, "/" 41,GRAIN_SIZE :,"999, 999" 42,SURF_DESCR :,"Flat surface with centimeter-sized irregularities due to protruding feldspar crystals" 43,SURF_DESCR :,"with specular facets, limited and sparse yellowish alteration" 44,TEMP :,"7" 45,DATA_ANALY :,"Average of 3 spectra" 46,DATA_ANALY :,"/" 47,WVL_FILE :,"FieldSpec_FR.wvl" 48,SPEC_FILE :,"21GRANIT_01.ant" 49,NO_REC_INI :,"2" 50,RD_FORMAT :,"ASCII 2 floating numbers per record" 51,MEAS_UNIT :,"nm","DMSL"
18 Figure 2. Example of Ancillary data file (see text for explanation

19

21GRANIT_01.1 Wavelength Granite - Campo Oasi 0.35 0.1317 0.351 0.1324 0.352 0.1333 0.353 0.1344 0.354 0.1357 0.355 0.1367 …….. ………
Figure 3: Example of spectral data file.
20
XIII Italian Antarctic ExpeditionSample 21GRANIT_01.ANT, Campo Oasi
0
0.05
0.1
0.15
0.2
0.25
0.3
0.35
0.4
0.45
0.5
400
500
600
700
800
900
1000
1100
1200
1300
1400
1500
1600
1700
1800
1900
2000
2100
2200
2300
2400
2500
Wavelength, µm
Abso
lute
Figure 4. Example of a LILIAN reflectance spectrum. Sample 21GRANIT_01.ANT: granite surface at Campo Oasi.
21
Campo Oasi granite
0
0,05
0,1
0,15
0,2
0,25
0,3
0,35
0,4
0,45
0,5
A B C DLandsat MSS channel
Abso
lute
refle
ctan
ce
FieldSpec FR
EXOTEC AX100
Figure 5. Comparison of spectral data sampled by the Exotech radiometer in the MSS bandwidths with the
reflectances convolved in the same bands from the spectrum in Figure 4.
22