Embed Size (px)
Citation preview
Ground Penetrating Radar (GPR) Investigations at Fort Frederica National Monument, Glynn County, Georgia
SEAC Accession No. 1943
Prepared for:
Fort Frederica National Monument 6515 Frederica Road
St. Simons Island, Georgia 31522
And:
Southeast Archeological Center National Park Service
2035 East Paul Dirac Drive Johnson Building, Box 7
Tallahassee, Florida 32310
By:
Shawn M. Patch
____________________________ Principal Investigator
Georgia Department of Transportation Office of Environment/Location
3993 Aviation Circle Atlanta, Georgia 30336
June 28, 2005
ABSTRACT
On April 11-13 2005, staff archaeologists from the Georgia Department of Transportation (GDOT) conducted a series of ground penetrating radar (GPR) assessments of selected areas within Fort Frederica National Monument, in Glynn County, Georgia. This work was accomplished as part of an ongoing cooperative relationship between GDOT and the National Park Service (NPS). The primary focus of this work was to identify the location of a bomb magazine that was reported to have exploded in 1744. The bulk of our work was spent in the northwest area of the original fort near the bastion and soldiers’ barracks. Because of favorable weather and extra time, we also investigated the Hird House lot, which was excavated in the 1970s, and the cemetery close to the visitor’s center. Results of the survey are excellent, with the identification of numerous high visibility targets. Verification of the sub-surface targets will need to come from future archaeological work and ground truthing excavations.
ii
TABLE OF CONTENTS
Page
ABSTRACT........................................................................................................................ ii LIST OF FIGURES ........................................................................................................... iv LIST OF TABLES...............................................................................................................v INTRODUCTION ...............................................................................................................1 METHODS ..........................................................................................................................1 RESULTS AND INTERPRETATIONS .............................................................................5 CONCLUSIONS AND RECOMMENDATIONS ..............................................................7 REFERENCES CITED......................................................................................................21
iii
LIST OF FIGURES
Page
Figure
1. Location of GPR survey areas within Fort Frederica National Monument .............2
2. Sketch map of grid layout in primary survey area...................................................3
3. Composite image of GPR time slice data for Grid 1 ...............................................9
4. Composite image of GPR time slice data for Grid 2 .............................................10
5. Composite image of GPR time slice data for Grid 3 .............................................11
6. Composite image of GPR time slice data for Grid 4 .............................................12
7. Composite image of GPR time slice data for Grid 5 .............................................13
8. Composite image of GPR time slice data for Grid 6 .............................................14
9. Composite image of GPR time slice data for Grid 7 .............................................15
10. Composite image of GPR time slice data for Grid 8 .............................................16
11. Composite image of GPR time slice data for Grid 9 .............................................17
12. Composite image of GPR time slice data for Grid 10 ...........................................18
13. Composite image of GPR time slice data for Grid 11 ...........................................19
iv

LIST OF TABLES
Page
Table 1. Summary Information for GPR Grids..............................................................................4
v
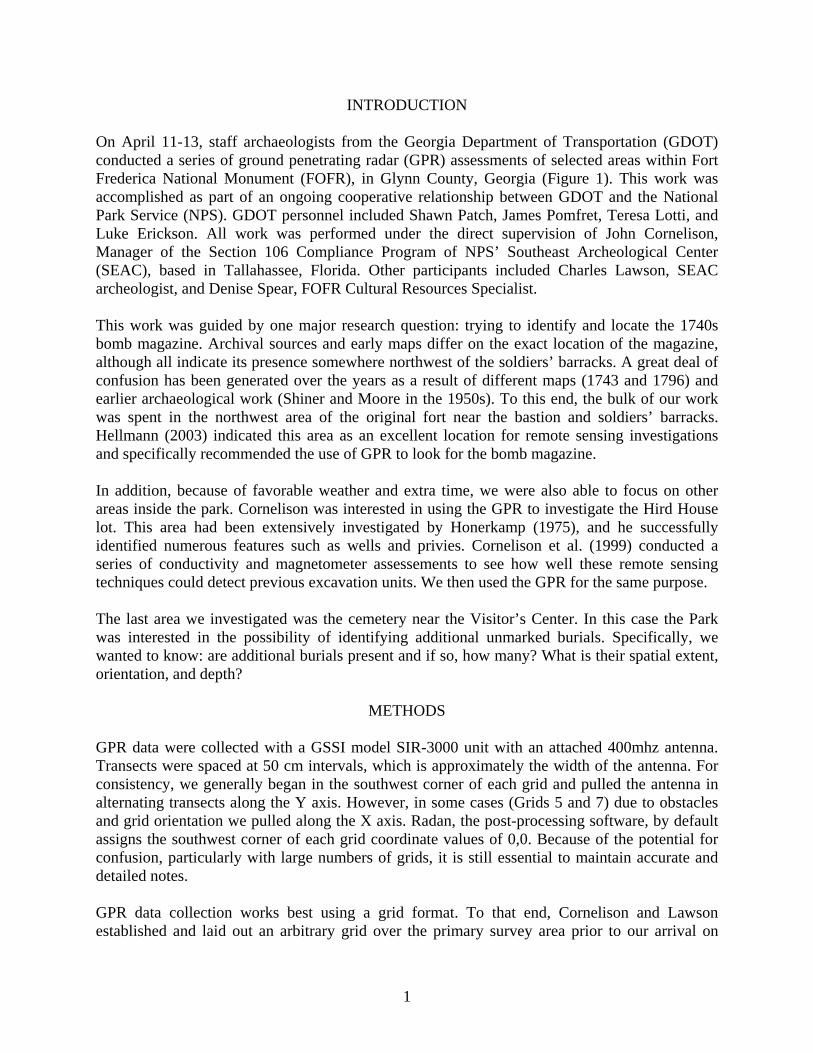
INTRODUCTION
On April 11-13, staff archaeologists from the Georgia Department of Transportation (GDOT) conducted a series of ground penetrating radar (GPR) assessments of selected areas within Fort Frederica National Monument (FOFR), in Glynn County, Georgia (Figure 1). This work was accomplished as part of an ongoing cooperative relationship between GDOT and the National Park Service (NPS). GDOT personnel included Shawn Patch, James Pomfret, Teresa Lotti, and Luke Erickson. All work was performed under the direct supervision of John Cornelison, Manager of the Section 106 Compliance Program of NPS’ Southeast Archeological Center (SEAC), based in Tallahassee, Florida. Other participants included Charles Lawson, SEAC archeologist, and Denise Spear, FOFR Cultural Resources Specialist. This work was guided by one major research question: trying to identify and locate the 1740s bomb magazine. Archival sources and early maps differ on the exact location of the magazine, although all indicate its presence somewhere northwest of the soldiers’ barracks. A great deal of confusion has been generated over the years as a result of different maps (1743 and 1796) and earlier archaeological work (Shiner and Moore in the 1950s). To this end, the bulk of our work was spent in the northwest area of the original fort near the bastion and soldiers’ barracks. Hellmann (2003) indicated this area as an excellent location for remote sensing investigations and specifically recommended the use of GPR to look for the bomb magazine. In addition, because of favorable weather and extra time, we were also able to focus on other areas inside the park. Cornelison was interested in using the GPR to investigate the Hird House lot. This area had been extensively investigated by Honerkamp (1975), and he successfully identified numerous features such as wells and privies. Cornelison et al. (1999) conducted a series of conductivity and magnetometer assessements to see how well these remote sensing techniques could detect previous excavation units. We then used the GPR for the same purpose. The last area we investigated was the cemetery near the Visitor’s Center. In this case the Park was interested in the possibility of identifying additional unmarked burials. Specifically, we wanted to know: are additional burials present and if so, how many? What is their spatial extent, orientation, and depth?
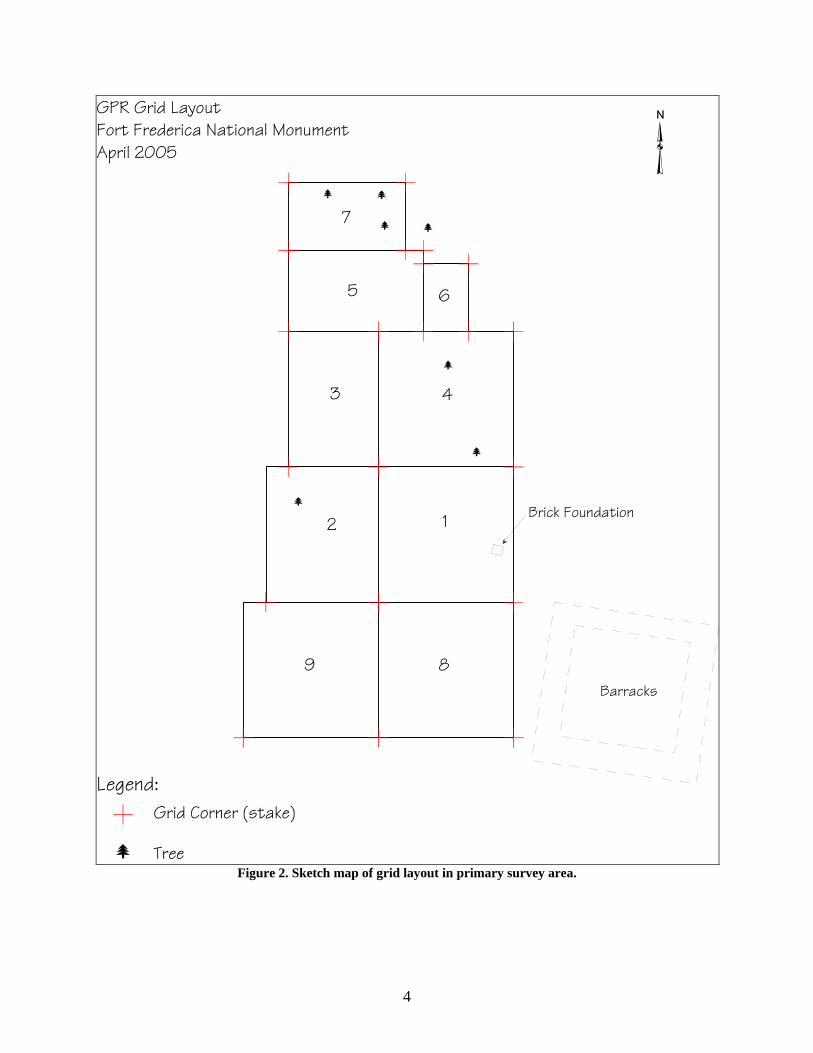
METHODS GPR data were collected with a GSSI model SIR-3000 unit with an attached 400mhz antenna. Transects were spaced at 50 cm intervals, which is approximately the width of the antenna. For consistency, we generally began in the southwest corner of each grid and pulled the antenna in alternating transects along the Y axis. However, in some cases (Grids 5 and 7) due to obstacles and grid orientation we pulled along the X axis. Radan, the post-processing software, by default assigns the southwest corner of each grid coordinate values of 0,0. Because of the potential for confusion, particularly with large numbers of grids, it is still essential to maintain accurate and detailed notes. GPR data collection works best using a grid format. To that end, Cornelison and Lawson established and laid out an arbitrary grid over the primary survey area prior to our arrival on
1
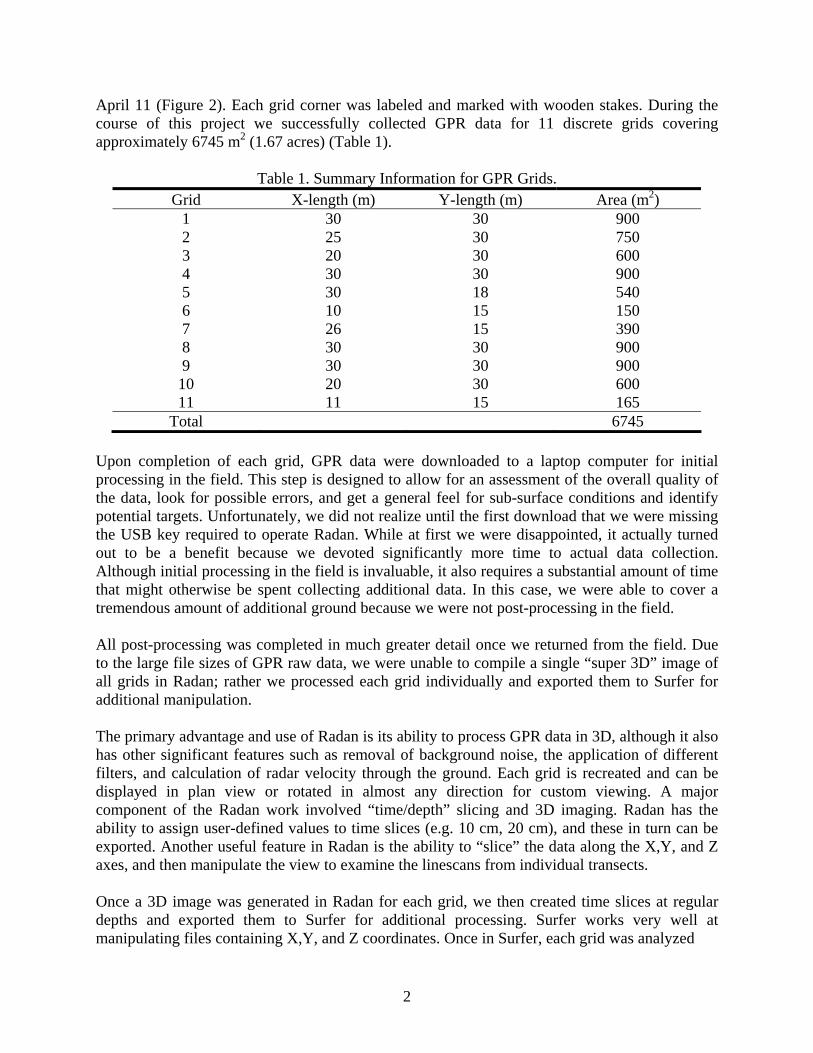
April 11 (Figure 2). Each grid corner was labeled and marked with wooden stakes. During the course of this project we successfully collected GPR data for 11 discrete grids covering approximately 6745 m2 (1.67 acres) (Table 1).
Table 1. Summary Information for GPR Grids. Grid X-length (m) Y-length (m) Area (m2)
1 30 30 900 2 25 30 750 3 20 30 600 4 30 30 900 5 30 18 540 6 10 15 150 7 26 15 390 8 30 30 900 9 30 30 900 10 20 30 600 11 11 15 165
Total 6745 Upon completion of each grid, GPR data were downloaded to a laptop computer for initial processing in the field. This step is designed to allow for an assessment of the overall quality of the data, look for possible errors, and get a general feel for sub-surface conditions and identify potential targets. Unfortunately, we did not realize until the first download that we were missing the USB key required to operate Radan. While at first we were disappointed, it actually turned out to be a benefit because we devoted significantly more time to actual data collection. Although initial processing in the field is invaluable, it also requires a substantial amount of time that might otherwise be spent collecting additional data. In this case, we were able to cover a tremendous amount of additional ground because we were not post-processing in the field. All post-processing was completed in much greater detail once we returned from the field. Due to the large file sizes of GPR raw data, we were unable to compile a single “super 3D” image of all grids in Radan; rather we processed each grid individually and exported them to Surfer for additional manipulation. The primary advantage and use of Radan is its ability to process GPR data in 3D, although it also has other significant features such as removal of background noise, the application of different filters, and calculation of radar velocity through the ground. Each grid is recreated and can be displayed in plan view or rotated in almost any direction for custom viewing. A major component of the Radan work involved “time/depth” slicing and 3D imaging. Radan has the ability to assign user-defined values to time slices (e.g. 10 cm, 20 cm), and these in turn can be exported. Another useful feature in Radan is the ability to “slice” the data along the X,Y, and Z axes, and then manipulate the view to examine the linescans from individual transects. Once a 3D image was generated in Radan for each grid, we then created time slices at regular depths and exported them to Surfer for additional processing. Surfer works very well at manipulating files containing X,Y, and Z coordinates. Once in Surfer, each grid was analyzed
2
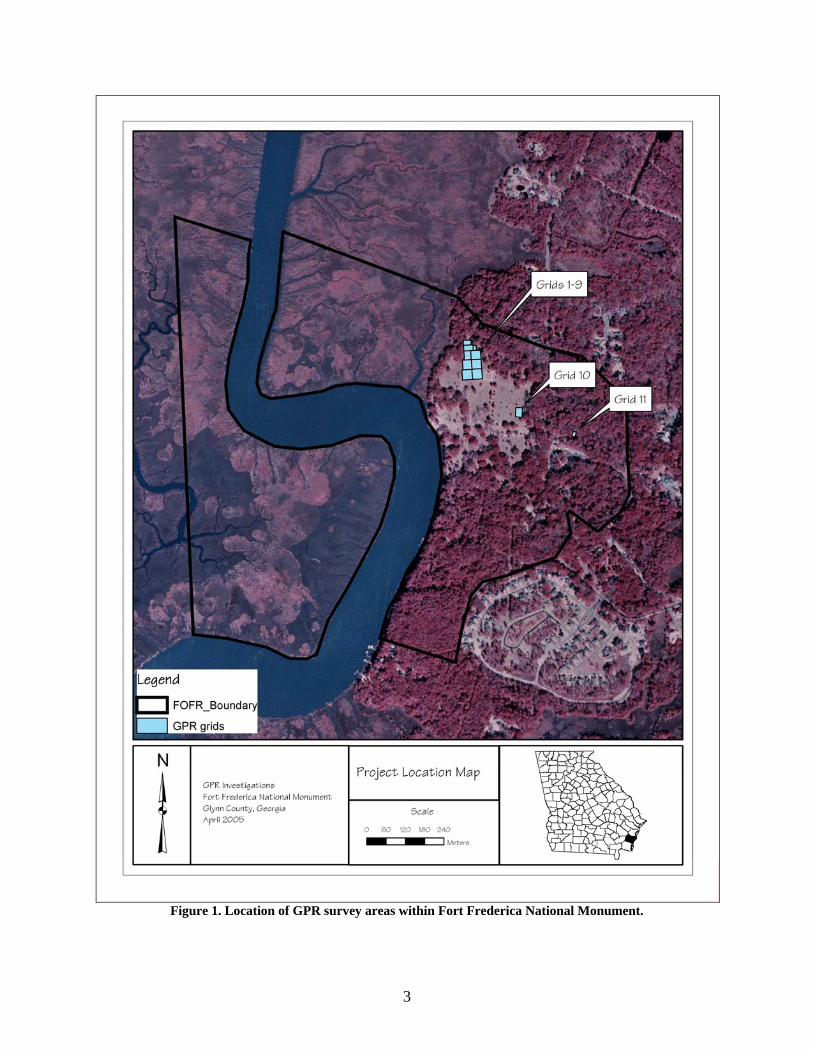
Figure 1. Location of GPR survey areas within Fort Frederica National Monument.
3
12
3 4
5 6
7
89
Brick Foundation
Barracks
GPR Grid LayoutFort Frederica National MonumentApril 2005
Grid Corner (stake)
Tree
Legend:
Figure 2. Sketch map of grid layout in primary survey area.
4
individually. For consistency, each grid was sliced at 20 cm intervals from the surface to approximately 160 cm. In a few cases where radar readings and field conditions were particularly good, and/or there were targets, we continued slicing up to 2 m. We could then change color values to amplify high reflectivity targets. Surfer also allows for multiple time slice images to be displayed side-by-side and stacked vertically for better interpretive results.
RESULTS AND INTERPRETATIONS Results of the survey are excellent, with numerous areas of high reflectivity, indications of possible sub-surface targets and areas of archaeological interest, as well as overall sedimentary conditions. In the hopes of making this report easier to follow, composite images for each grid have been moved toward the back. Brief descriptions for each grid are provided below. Grid 1 The brick foundation located in the southeastern portion is clearly visible in the first two images; not at all surprising given that it is a surface feature (Figure 3). There is also a large linear feature oriented approximately northeast-southwest visible in the 80-140cm range. It is difficult to tell with any degree of certainty, but this could represent an old excavation trench or possible buried pipe (if any such thing exists). Grid 2 There is a tree in the northwest quadrant that required some creative navigation, which explains the high reflectivity values near the surface (Figure 4). Because of the root system, there are no obvious large features or patterns in this grid, although there are numerous individual targets. These could possibly be small features or individual artifacts such as unexploded ordnance. Grid 3 Two linear features are obvious in the upper 60 cm of Grid 3 (Figure 5). The larger of these is oriented approximately northwest-southeast and, based on its low reflection, has the appearance of a pipe or other shallow utility. The second of these is much shorter, runs east-west, and has higher reflectivity values. No trees are present in this particular area so associated roots are unlikely. In the southwest portion of the grid is a discrete area of high reflectivity, although it is difficult to hypothesize about what it might be. Grid 4 The most prominent targets in Grid 4 are tree roots (Figure 6). Two large trees are present in this grid and their associated root systems are extensive, particularly in the upper 80 cm. In fact, the patterns are so well defined that one can virtually identify the tree locations based on the reflection values. Grid 5
5
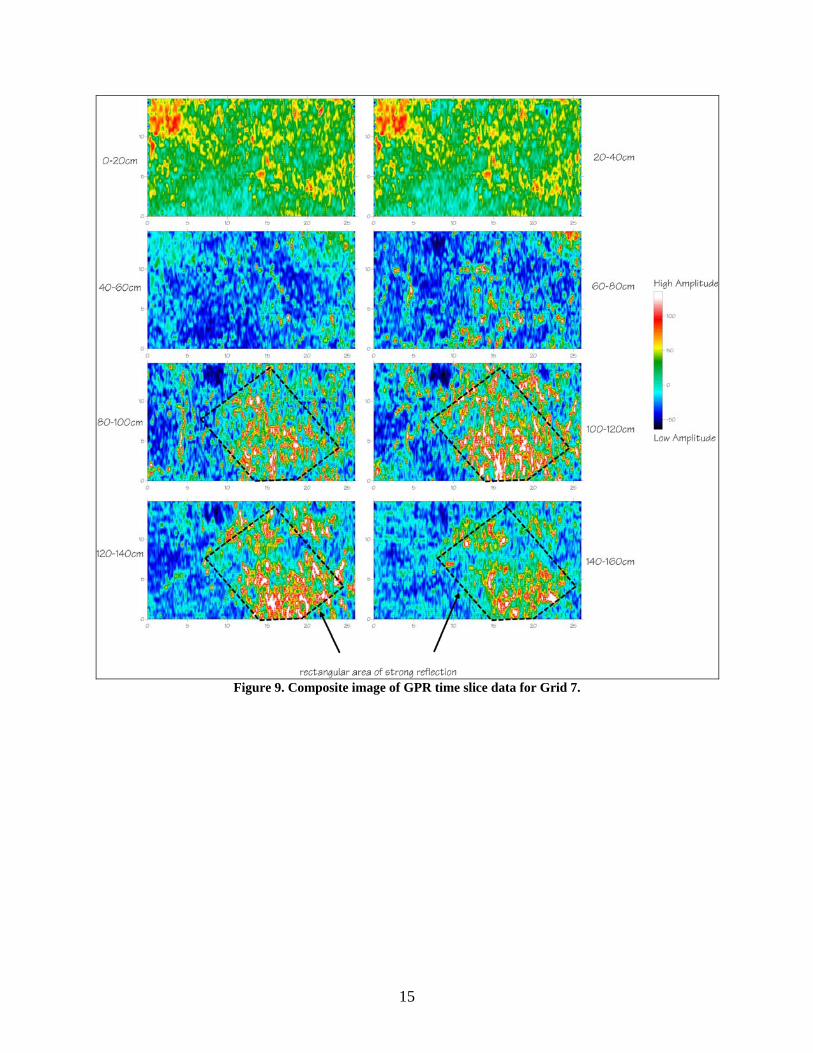
This grid has some of the strongest targets of all those identified during this survey (Figure 7). On the ground surface in this area there is a large earthen berm in the shape of a large V, with its apex oriented to the north (dashed line in first image). Beginning at a depth of approximately 80 cm the reflection values increase dramatically and roughly mirror the surface features. Without a doubt these are strong targets and may indicate a large debris field of dense material (e.g. tabby, brick). Grid 6 Grid 6 has similar results to Grid 5 (Figure 8), not entirely surprising given that they are adjacent to one another. There is very little energy reflection until approximately 80 cm. At this depth numerous individual targets appear, as well as some possible linear features. These data could also be interpreted as a large scatter, rather than linear features. Again, it could be a large area of construction or building debris. Grid 7 Grid 7 was the northern extent of GPR investigations in the barracks area (Figure 9). Of all the grids in this survey area, this one has perhaps the strongest potential for buried construction debris that could possibly be associated with an exploded or ruined structure. There is a massive area of reflection, roughly rectangular in shape, beginning at approximately 80 cm. When Grids 6, 7, and 8 are considered together the reflected area is extremely strong. These data do not look like individual targets, although they certainly are present. They more closely resemble what we might expect for a massive debris field or major changes in stratigraphy, which is another possibility. Grid 8 This grid was located immediately west of the existing foundation of the soldiers’ barracks (Figure 10). In fact, the extreme southeastern corner of our grid covered the latrine area of the barracks (visible in the first three images, lower right). The most prominent anomalies in this grid are two linear features. The first is present between approximately 60-100 cm. Oriented northwest-southeast, it is fairly obvious and resembles a buried pipe, utility, or possibly an old excavation trench. The second feature is the most interesting, and entirely unexpected. Oriented northeast-southwest it parallels closely the existing foundation/wall of the soldiers’ barracks, although it is several feet removed from the structure. This feature is actually present in each of the images but it appears differently with increasing depth. At the surface it is displayed as an area of low/no reflection, indicating the radar energy passed deeper without hitting any targets. This suggests a trench. At approximately 100 cm, however, its appearance begins to change dramatically, with a significant increase in reflectivity. This indicates the presence of targets, possibly tabby, brick, or trash. At this time, hypotheses for this feature include a buried wall/foundation from a possible earlier structure, a builder’s trench possibly associated with the original construction of the barracks, or
6
a filled-in drainage ditch or latrine. Hellmann (2003:61) discusses Shiner’s excavations in the 1950s and specifically mentions the identification of a drainage ditch leading from the tabby-lined pool to the marshes west of the barracks. Although this reference suggests an east-west orientation for the ditch, conversations with Denise Spear indicated a possible north-south orientation, which would have been the shortest route to the marsh for waste disposal. The GPR data support the latter and may further indicate the ditch was lined with tabby and/or brick. All of these should be explored with future investigations. Grid 9 This grid has one prominent linear feature between 60-100 cm in depth (Figure 11). Oriented approximately east-west, it looks more like a tree root than a pipe or utility, although there are no trees present in this area. There are also numerous individual targets of high reflectivity with increasing depth. They do not appear to be patterned in any recognizable fashion, but are very strong, and could be small features or large artifacts. Grid 10 This grid was located in the former Hird House lot (Figure 12). The results here are very interesting because we were able to successfully identify the locations of previous excavation units and correlate these with maps from the report (Honerkamp 1979). While each unit is not identified individually, the general excavation areas are clearly visible beginning at approximately 100 cm. They appear as areas of high reflectivity and overlay very well with the sketch map provided in Honerkamp’s report. In addition, there is a large circular anomaly in the western portion of the grid that is fairly well defined, and does not appear to have been excavated previously. This feature could possibly be a trash pit, well, or privy. Grid 11 The primary purpose of placing this grid in the cemetery was to explore the possibility of additional unmarked graves. Accordingly, we established a small area between existing graves that was free of large trees and other surface obstructions (Figure 13). We can say with a high degree of confidence that there appears to be at least one additional burial in the northern portion of the grid very close to a large vault. The anomaly here is very strong, appears to a depth of approximately 140-160 cm, and is roughly oriented east-west. There is an additional anomaly that may also be a burial in the northwest corner, although it is much more diffuse and harder to see with the same confidence.
CONCLUSIONS AND RECOMMENDATIONS The primary research question that we intended to address with the GPR survey involved identification of a possible bomb magazine that was reported to have exploded sometime in the 1740s. To that end, we relied extensively on the expert information provided by Denise Spear, a ranger at Fort Frederica whose knowledge of the archival sources is vast and deep. Our efforts focused first and foremost on the hypothesized location of the former magazine somewhere in
7
8
the vicinity west of the existing soldiers’ barracks. Due to excellent field conditions were able to cover a large amount of ground in a relatively short amount of time, one of the significant advantages of remote sensing and geophysical prospecting. The results are encouraging for a number of reasons. First, each grid appears to have numerous individual targets, and several broader patterns are also present. The radar worked extremely well for this project due in large part to the excellent field conditions (both surface and sub-surface). The sandy soils, low water table, and grassed area all contributed to an excellent scenario for GPR. Future investigations should be prioritized based on the GPR results together with research questions, archival information, time, and budgetary constraints. From a remote sensing and archaeological perspective, there are several areas that will require some level of ground truthing. With respect to the missing magazine, efforts should focus on the area of strong reflectivity in Grids 5, 6, and 7, the far northern extent of our survey area. The strength, depth, and pattern of the anomalies in these grids are suggestive of a large scatter of material that may or may not be trash, brick, tabby, or other construction/demolition debris. Several of the linear anomalies should be investigated to determine whether they are archaeological (i.e. previous excavation trenches or unidentified features) or possible buried pipes and utilities (unlikely but not inconceivable). Of particular importance, however, is the large linear anomaly present in Grid 8. This feature so closely resembles the existing barracks, and its proximity is even more intriguing, that it warrants careful attention in the future. Additional excavations should focus on determining what, in fact, this feature represents, and how it relates to the barracks. At this time we simply cannot say for certain although it is too obvious to overlook and may be important to better understanding the construction and occupation of the barracks. The Hird House lot is also of interest, although it has been extensively excavated in the past. While we have successfully identified previous excavation units, there is also an additional anomaly that may be a feature such as a well, privy, or trash pit. Excavation of this feature may not be necessary unless there is a compelling reason to do so. Because of the sensitivity of human burials and Georgia state law, very little should be done in the cemetery area unless absolutely necessary. At least one additional grave appears to be present, and a second may also exist. However, there do not appear to be any additional unmarked graves beyond these two.
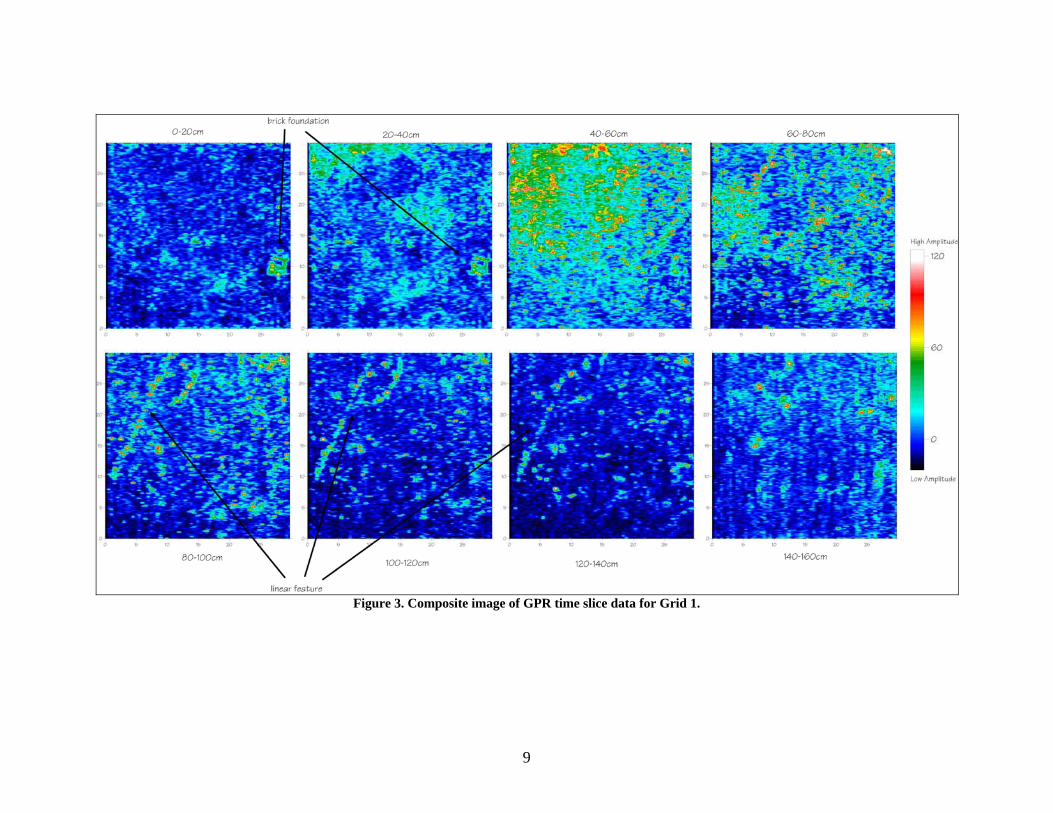
Figure 3. Composite image of GPR time slice data for Grid 1.
9
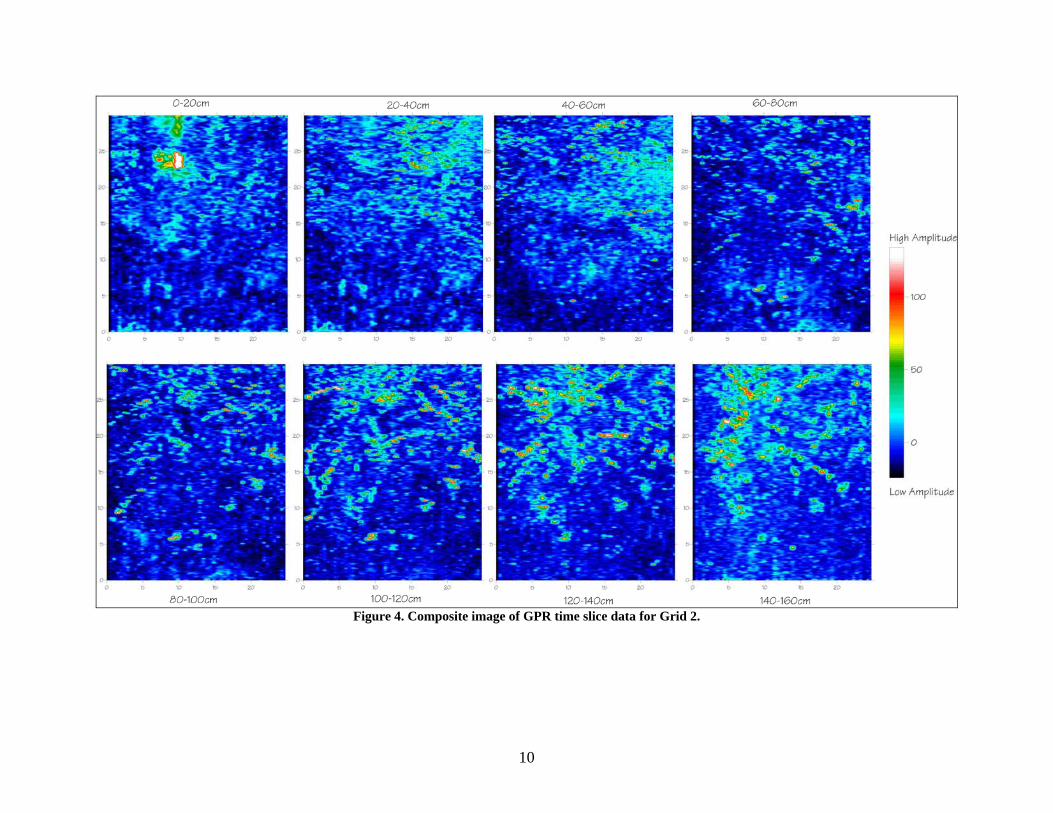
Figure 4. Composite image of GPR time slice data for Grid 2.
10
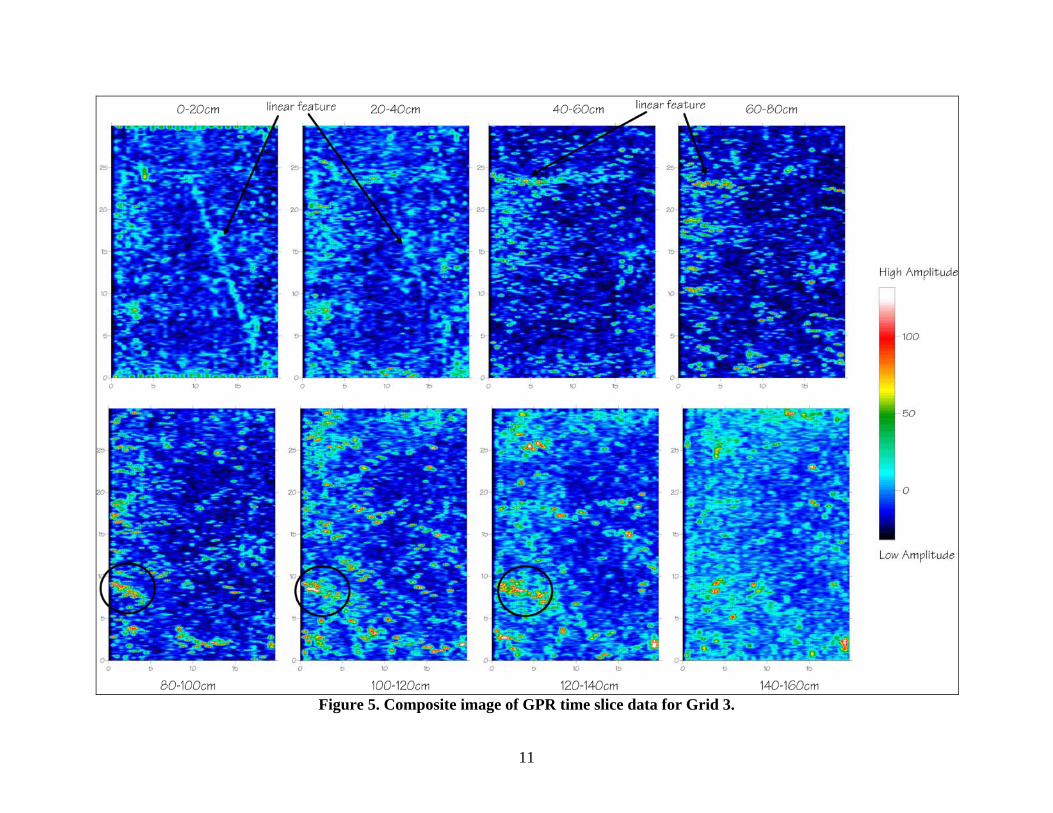
Figure 5. Composite image of GPR time slice data for Grid 3.
11
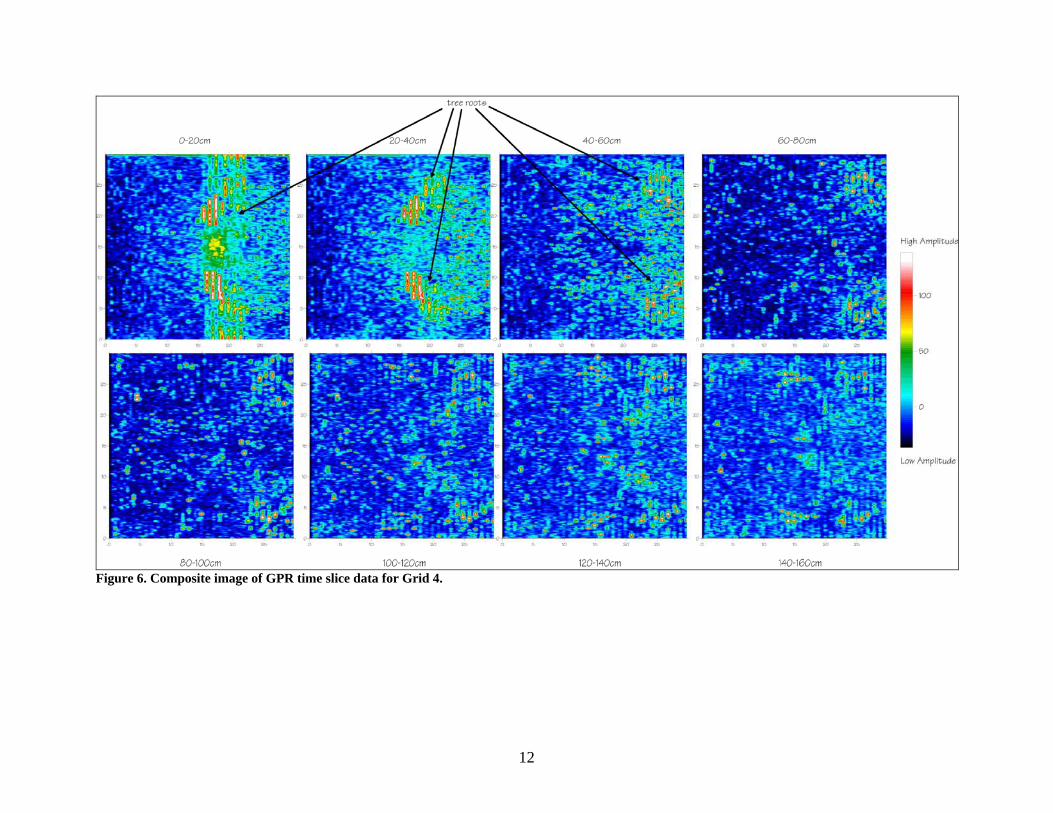
Figure 6. Composite image of GPR time slice data for Grid 4.
12
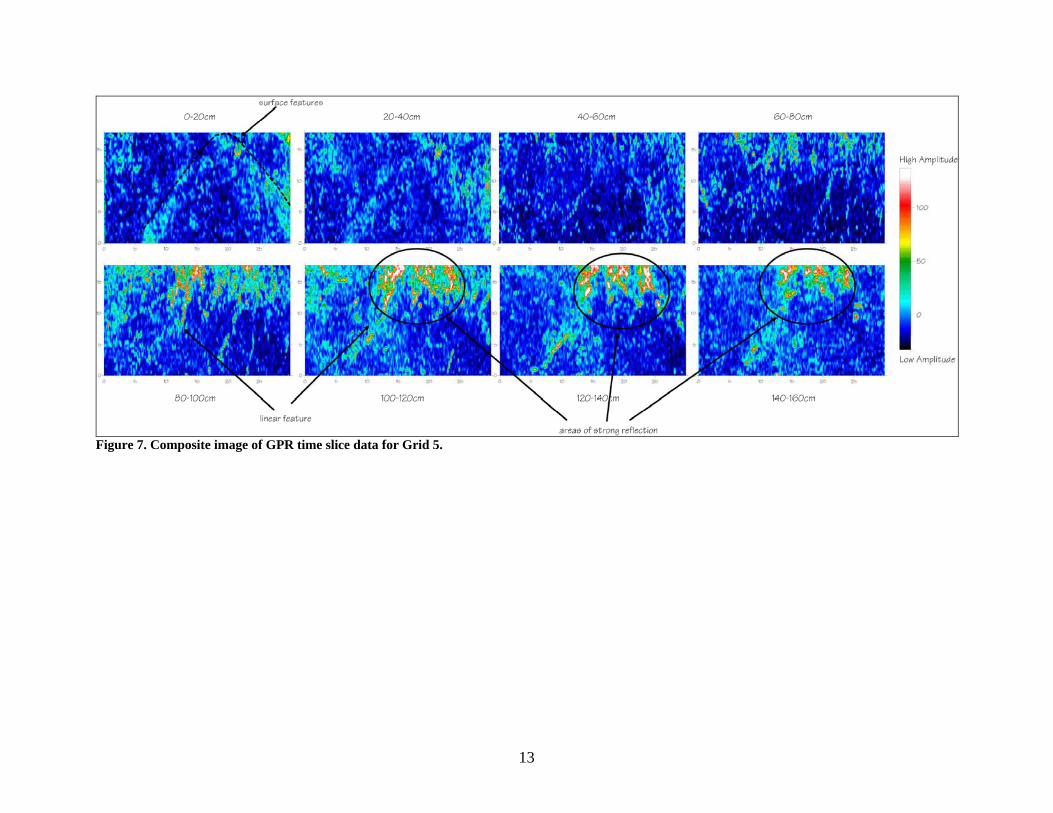
Figure 7. Composite image of GPR time slice data for Grid 5.
13
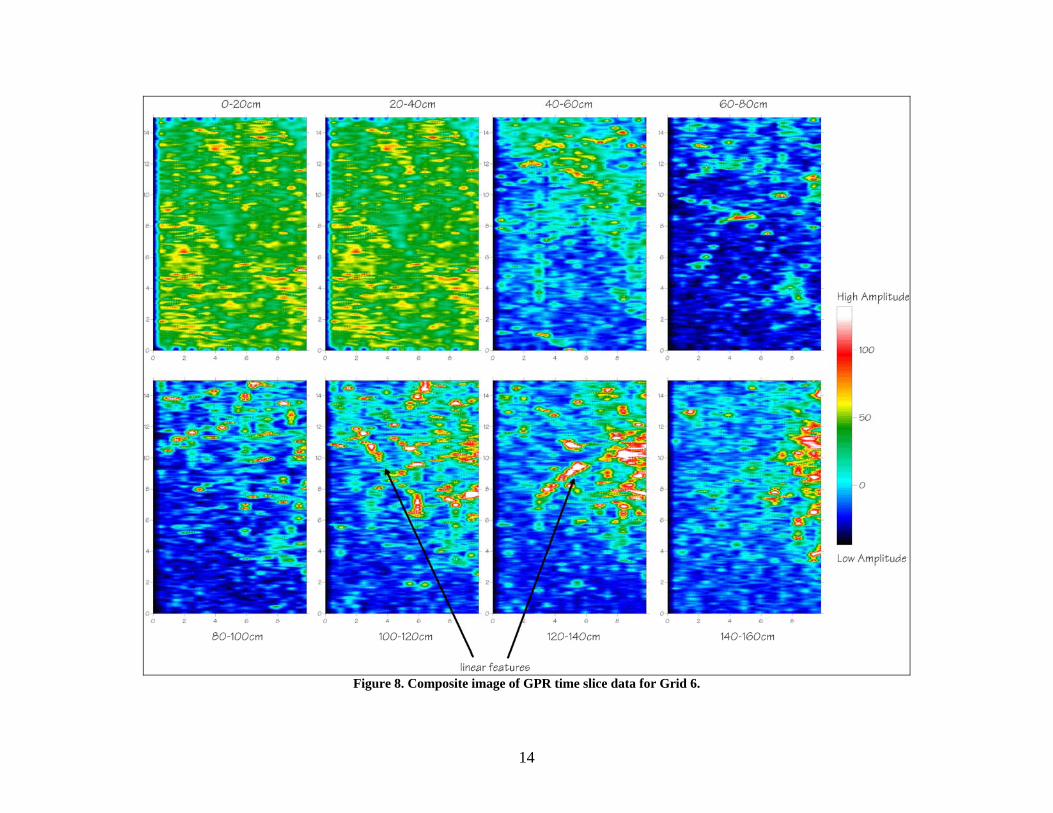
Figure 8. Composite image of GPR time slice data for Grid 6.
14
15
Figure 9. Composite image of GPR time slice data for Grid 7.
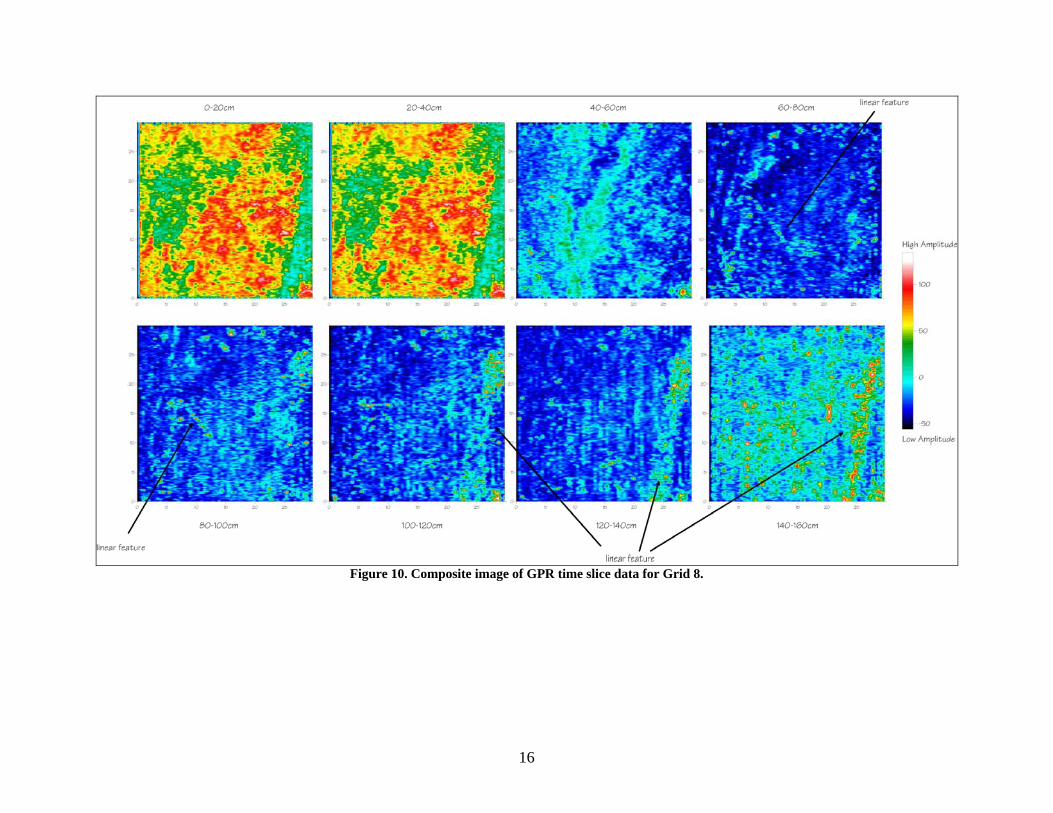
Figure 10. Composite image of GPR time slice data for Grid 8.
16
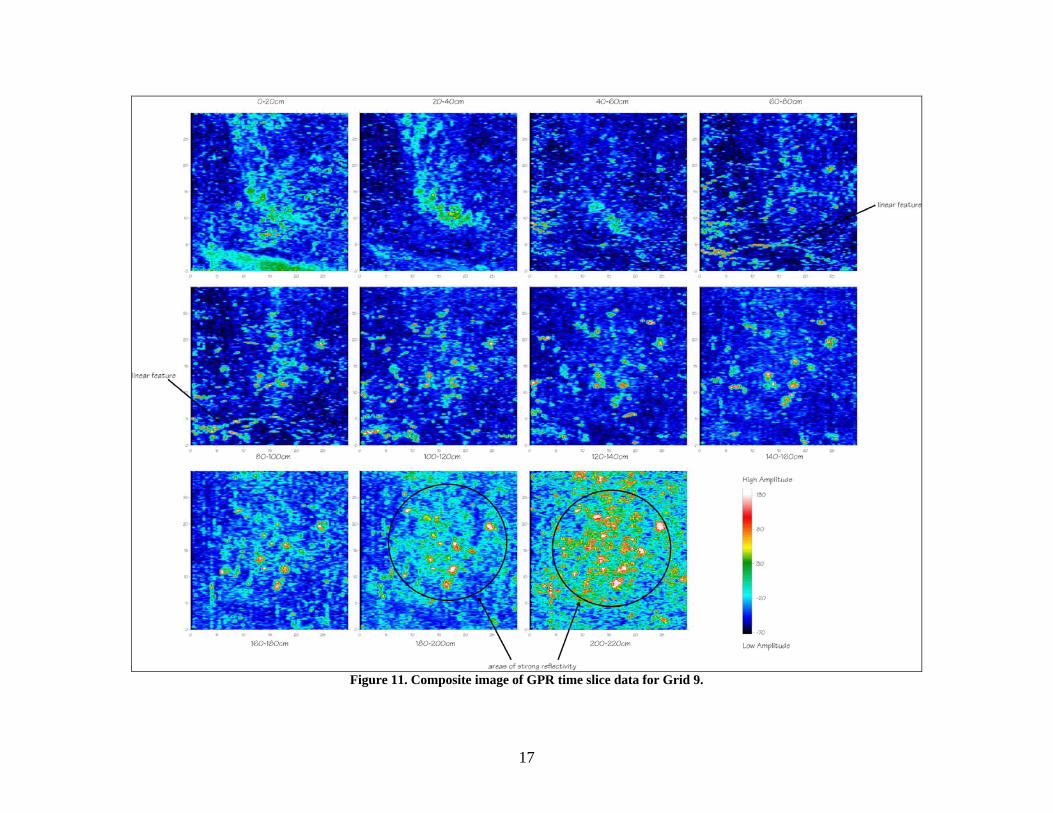
Figure 11. Composite image of GPR time slice data for Grid 9.
17
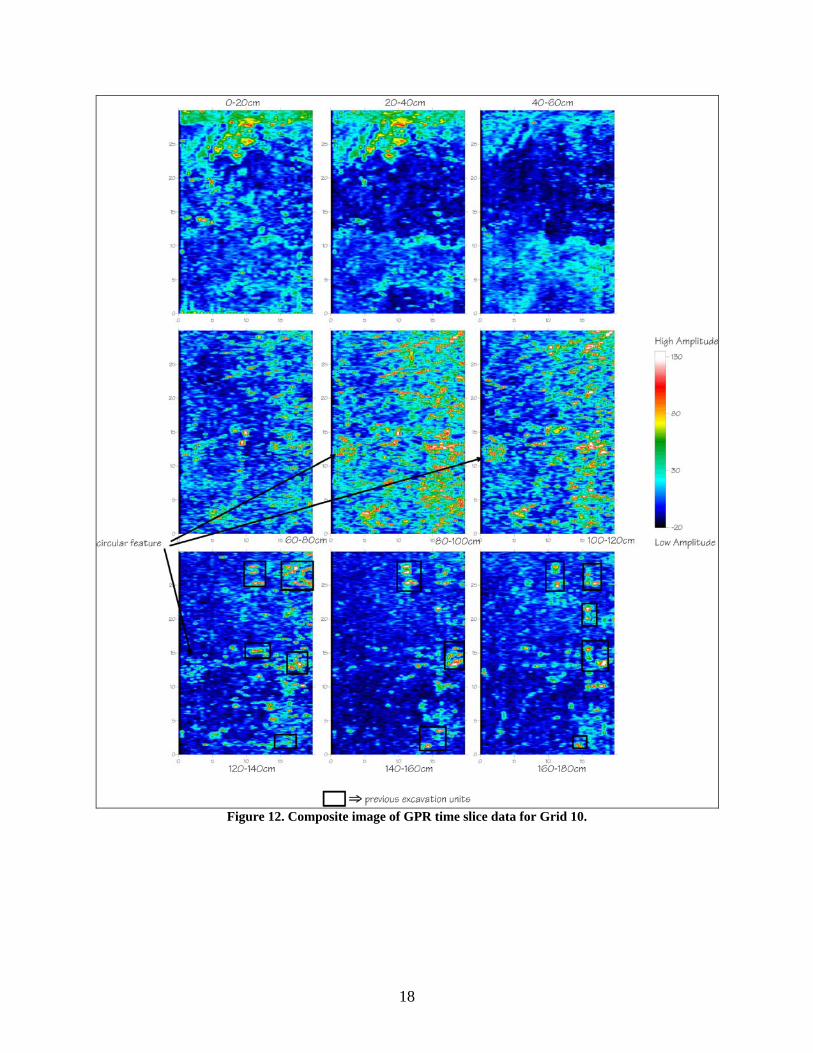
Figure 12. Composite image of GPR time slice data for Grid 10.
18
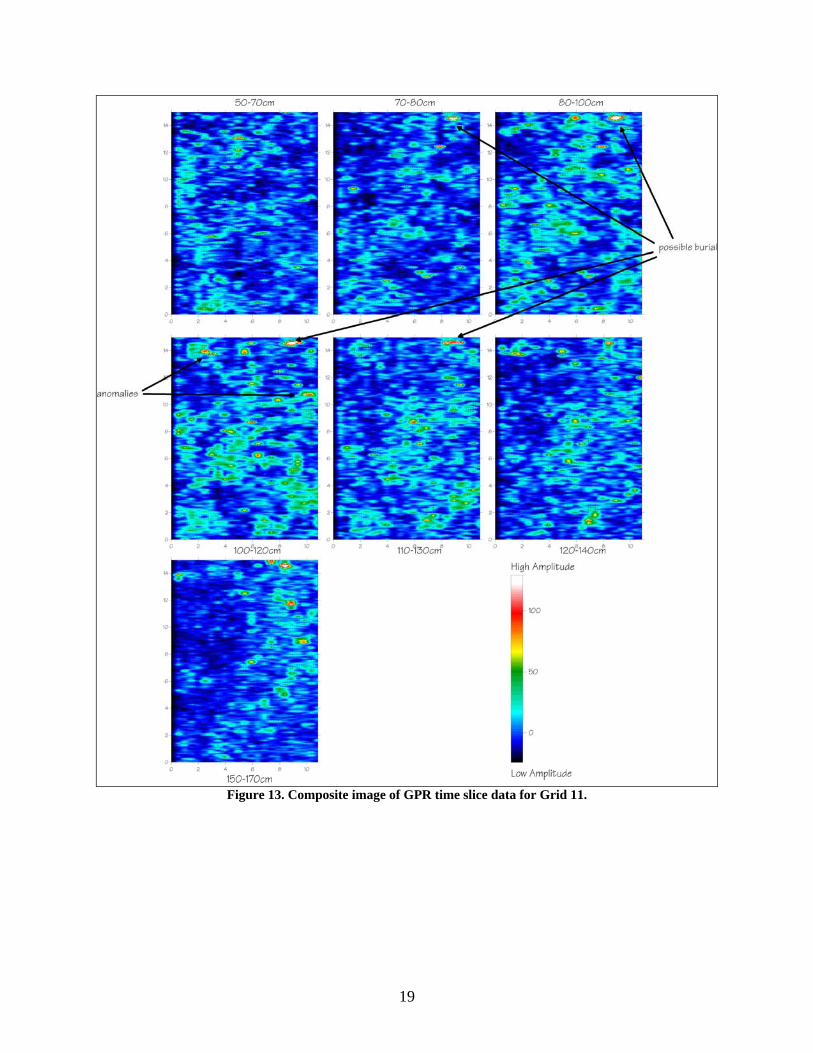
Figure 13. Composite image of GPR time slice data for Grid 11.
19
REFERENCES CITED Cornelison, John E., Regina M. Meyer, and Joseph C. Russell 1999 Electromagnetic Conductivity and Magnetometer Survey of Selected Areas of Fort
Frederica National Monument, Glynn County, Georgia. Manuscript on file, National Park Service, Southeast Archeological Center, Tallahassee.
Hellmann, Robert 2003 Archeological Overview and Assessment of Fort Frederica National Monument, Glynn
County, Georgia. Southeast Archeological Center, National Park Service, Tallahassee, Florida.
Honerkamp, Nickolas 1975 The Material Culture of Fort Frederica: The Thomas Hird Lot. Unpublished Master’s
Thesis, Department of Anthropology, University of Florida, Gainesville.
20