Embed Size (px)
Citation preview
GROUND MOTION AMPLIFICATION AS A FUNCTION OF SURFACE GEOLOGY
Jonathan P. Stewart and Andrew H. Liu University of California, Los Angeles
ABSTRACT
Empirical relationships are developed to predict amplification factors for 5% damped spectral acceleration as a function of surface geology. Amplification factors are derived for spectral periods T = 0.01 – 5 s by assigning a reference spectrum to > 700 recordings from shallow crustal earthquakes. The reference spectrum is derived from soft rock attenuation relations modified to account for event-specific source/path peculiarities and rupture directivity effects. Strong motion sites are classified according to three geologic classification schemes: age only, age + depositional environment, and age + material gradation. Within each scheme, amplification is regressed against ground motion amplitude, and for one scheme, against amplitude and duration. The material gradation scheme is found to produce the least scatter in the amplification functions. The results of the regression indicate significant nonlinear ground response effects, and pronounced variations in the levels of amplification across geological categories. Amplification is also found to be sensitive to the duration of strong shaking. Due to the soft rock reference spectra used in this study, amplification levels are smaller than had been identified in previous studies employing reference motions from relatively firm rock sites.
INTRODUCTION It has long been recognized that geologic conditions can exert a strong influence on ground motions and structural damage patterns (e.g., Seed et al., 1972; Seed et al., 1987; Seed et al., 1991; Chang et al., 1996; Rathje et al., 2000). Quantification of site amplification effects from strong motion recordings requires the removal of source and path effects. This has typically been accomplished by one of three techniques. The first and most common technique compares rock and soil motions recorded in close proximity to each other (e.g., Borcherdt, 1970; Seed and Idriss, 1971; Idriss, 1990; Borcherdt and Glassmoyer, 1994; Dickenson and Seed, 1996; Borcherdt, 1996; Rathje et al., 2000). Comparisons of this type, performed by Borcherdt (1994) on 35 strong motion stations (with 9 accompanying reference sites) that recorded the 1989 Loma Prieta earthquake, comprise the principal empirical basis for the ground motion provisions in the 1997 Uniform Building Code (Uniform, 1997) and 1997 National Earthquake Hazards Reduction Program Code and Commentary (BSSC, 1998). A modified version of this approach has also been used in which rock site spectra are applied as a reference motion across a relatively broad region by correcting motions with a geometric spreading factor of 1/r (e.g., Borcherdt, 1996), or by coupling geometric spreading with a frequency-dependant attenuation model (e.g., Hartzell et al., 1996; Hartzell et al., 1997). Alternative approaches for evaluating ground motion amplification on soil do not require the presence of a reference site. Such approaches have the distinct advantage of being able to incorporate essentially all available earthquake recordings. One such approach, termed horizontal-to-vertical spectral ratio (HVSR), involves normalizing the horizontal component
1
SMIP2000 Seminar Proceedings
spectra for a given site by the vertical component spectra for that same site (Lermo and Chavez-Garcia, 1993). A second approach implements a generalized inversion scheme to identify source, path, and site effects for a given earthquake (Boatwright et al., 1991). While this approach, when properly implemented, can reproduce spectral ratios comparable to those observed from adjacent rock/soil sites (e.g., Field and Jacob, 1995), considerable amounts of strong motion and geologic data are needed to obtain reliable inversions. Moreover, a reliable assessment of site effects is needed a priori, which limits the usefulness of the approach for identifying such effects from strong motion records. This study implements a third approach not requiring the presence of a reference site. Amplification is defined using the acceleration response spectra of recordings normalized by a reference spectrum that represents the ground motions that would have been expected at the site had the geologic condition been soft rock. The reference spectrum is defined using an attenuation relation for rock sites in active tectonic regions modified for source-specific peculiarities and rupture directivity effects. As such, this approach incorporates the observed, event-specific characteristics of source and path into the reference motions so that the ratio of recorded/reference spectra represents as cleanly as possible the effects of local geologic conditions on the ground motion. This approach is conceptually similar to that employed by Sokolov and his co-workers (e.g., Sokolov, 1997; Sokolov et al., 2000) in which spectral ratios are calculated using recordings and reference motions from attenuation models for “very hard rock” sites. The principal difference from our approach is that Sokolov uses attenuation models derived for Fourier spectra (instead of response spectra) that do not incorporate the effects of source mechanism, directivity, or event-specific source/path peculiarities. The present approach, by using response spectra in lieu of Fourier spectra, leverages significant recent developments in ground motion attenuation relationships for spectral acceleration that allow these effects to be incorporated into the estimation of reference motions. A total of 433 recording stations were classified based on mapped surficial geology. Amplification factors are derived for each recording, and are regressed within various categories of surficial geology against ground motion amplitude. Median levels of amplification, as well as the standard error of amplification, are compiled across geologic site categories to evaluate the effect of geologic conditions on amplification and to identify the advantages of incorporating different levels of detail in geologic site classifications. This paper presents preliminary results of work in progress, as additional strong motion and geologic data is becoming available for sites that recorded the recent earthquakes in Turkey in Taiwan. Moreover, amplification factors are also being examined as a function of 30 m shear wave velocity (Vs), and geotechnical classification schemes.
STRONG MOTION DATABASE The strong motion database includes 704 recordings from 433 stations and 44 events between 1933 and 1999. The source information for this database includes the Pacific Engineering and Analysis Strong Motion (PE&A) database, the National Geophysical Data Center database (shallow crustal events only), and data provided by the State of California (CSMIP), U.S. Geological Survey, University of Southern California (USC), and Los Angeles Department of Water and Power. Data from the 1995 Hyogo-Ken Nanbu (Kobe) earthquake, the
2
SMIP2000 Seminar Proceedings
1999 Kocaeli and Duzce earthquakes in Turkey, and the 1999 Chi-Chi earthquake in Taiwan are not included in this compilation due to inadequate sources of geologic information for the recording station sites and a lack of uniformly processed ground motion records as of this writing.
GEOLOGIC SITE CLASSIFICATIONS
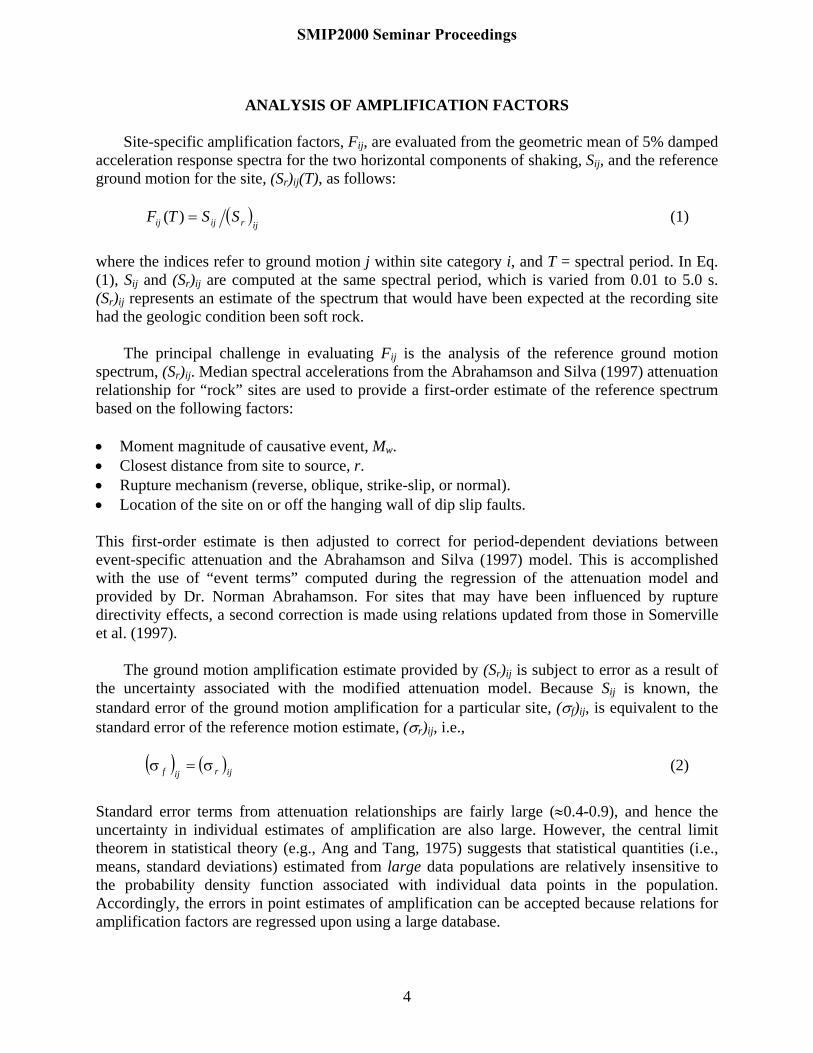
Geologic conditions at each strong motion station were classified. The level of mapping detail for Quaternary deposits is variable across California, where most of the stations are located. The geology of the entire state is documented on 27 maps at 1:250,000 scale by the California Division of Mines and Geology (CDMG, 1959-1998). These maps distinguish Quaternary deposits based on age (Holocene-Pleistocene) and generalized descriptions of depositional environment. The Southern California Aerial Mapping Project (SCAMP) is compiling more detailed geologic information for selected quadrangles in southern California. For example, data for the Santa Ana 30’ x 60’ quadrangle has been prepared at 1:100,000 scale by Morton et al. (1999) and was used in this study. In addition, preliminary digital geologic maps at 1:24,000 scale prepared through SCAMP of 7.5’ quadrangles in Los Angeles and Orange counties have been obtained (CDMG staff, 2000). The SCAMP maps are the most detailed of the available geologic maps, providing basic information on the gradation of Quaternary deposits (e.g., coarse/fine/mixed), and detailed information on depositional environment. Information from the above sources was supplemented as necessary with field geologic classifications for strong motion stations by Geomatrix (1993) and by the authors. Attempts were made to classify each site according to schemes that make use of different levels of detail on geologic conditions. Three different schemes were used so that the sensitivity of ground motion amplification to various mapped geologic parameters could be discerned. Criteria used for the geologic classifications are presented in Table 1. The three classification schemes are as follows: age only, age + depositional environment, age + material gradation. Length restrictions preclude a full listing of the site classifications, but these will be published in a forthcoming report.
Table 1: Criteria for geologic classifications
Age Depositional Environment* Material Gradation* Holocene Fan alluvium Coarse
Pleistocene Valley alluvium Fine Lacustrine/Marine Mixed Aeolian Artificial fill
Tertiary Mesozoic
* criteria only used for Holocene and Pleistocene age groups
3
SMIP2000 Seminar Proceedings
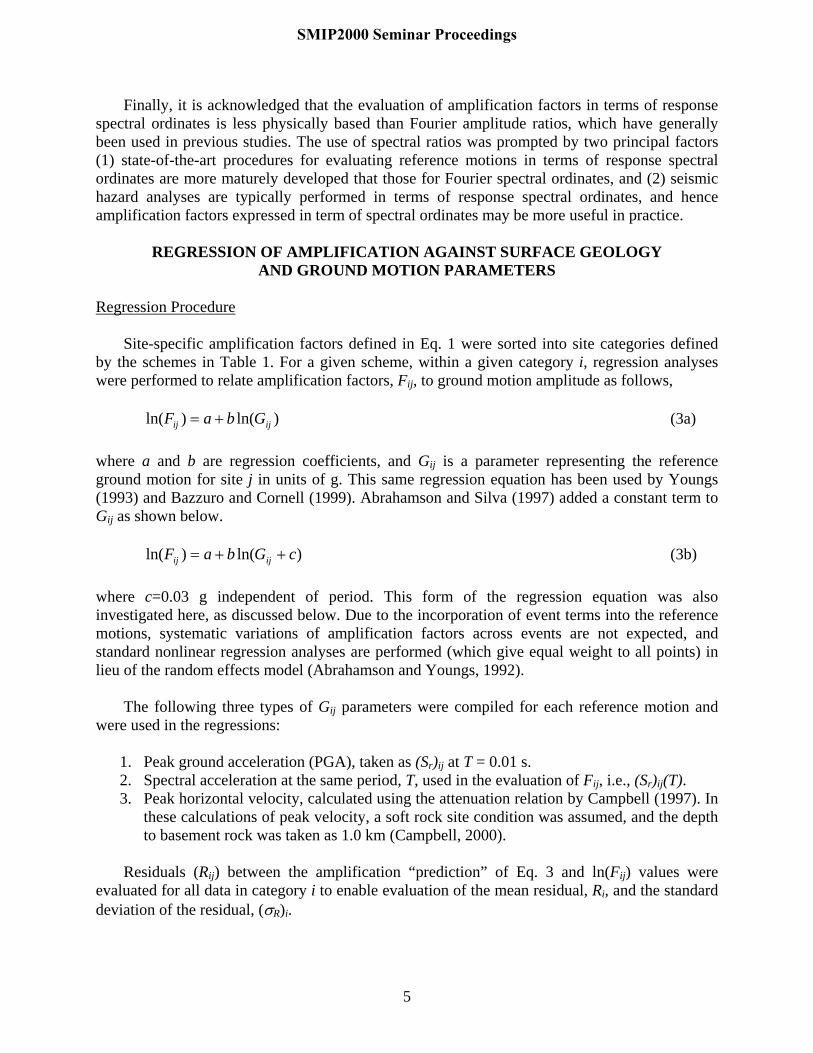
ANALYSIS OF AMPLIFICATION FACTORS Site-specific amplification factors, Fij, are evaluated from the geometric mean of 5% damped acceleration response spectra for the two horizontal components of shaking, Sij, and the reference ground motion for the site, (Sr)ij(T), as follows: ( )
ijrijij SSTF =)( (1)
where the indices refer to ground motion j within site category i, and T = spectral period. In Eq. (1), Sij and (Sr)ij are computed at the same spectral period, which is varied from 0.01 to 5.0 s. (Sr)ij represents an estimate of the spectrum that would have been expected at the recording site had the geologic condition been soft rock. The principal challenge in evaluating Fij is the analysis of the reference ground motion spectrum, (Sr)ij. Median spectral accelerations from the Abrahamson and Silva (1997) attenuation relationship for “rock” sites are used to provide a first-order estimate of the reference spectrum based on the following factors: • Moment magnitude of causative event, Mw. • Closest distance from site to source, r. • Rupture mechanism (reverse, oblique, strike-slip, or normal). • Location of the site on or off the hanging wall of dip slip faults. This first-order estimate is then adjusted to correct for period-dependent deviations between event-specific attenuation and the Abrahamson and Silva (1997) model. This is accomplished with the use of “event terms” computed during the regression of the attenuation model and provided by Dr. Norman Abrahamson. For sites that may have been influenced by rupture directivity effects, a second correction is made using relations updated from those in Somerville et al. (1997). The ground motion amplification estimate provided by (Sr)ij is subject to error as a result of the uncertainty associated with the modified attenuation model. Because Sij is known, the standard error of the ground motion amplification for a particular site, (σf)ij, is equivalent to the standard error of the reference motion estimate, (σr)ij, i.e., ( ) ( )ijrijf σ=σ (2)
Standard error terms from attenuation relationships are fairly large (≈0.4-0.9), and hence the uncertainty in individual estimates of amplification are also large. However, the central limit theorem in statistical theory (e.g., Ang and Tang, 1975) suggests that statistical quantities (i.e., means, standard deviations) estimated from large data populations are relatively insensitive to the probability density function associated with individual data points in the population. Accordingly, the errors in point estimates of amplification can be accepted because relations for amplification factors are regressed upon using a large database.
4
SMIP2000 Seminar Proceedings
Finally, it is acknowledged that the evaluation of amplification factors in terms of response spectral ordinates is less physically based than Fourier amplitude ratios, which have generally been used in previous studies. The use of spectral ratios was prompted by two principal factors (1) state-of-the-art procedures for evaluating reference motions in terms of response spectral ordinates are more maturely developed that those for Fourier spectral ordinates, and (2) seismic hazard analyses are typically performed in terms of response spectral ordinates, and hence amplification factors expressed in term of spectral ordinates may be more useful in practice.
REGRESSION OF AMPLIFICATION AGAINST SURFACE GEOLOGY AND GROUND MOTION PARAMETERS
Regression Procedure Site-specific amplification factors defined in Eq. 1 were sorted into site categories defined by the schemes in Table 1. For a given scheme, within a given category i, regression analyses were performed to relate amplification factors, Fij, to ground motion amplitude as follows, (3a) )ln()ln( ijij GbaF += where a and b are regression coefficients, and Gij is a parameter representing the reference ground motion for site j in units of g. This same regression equation has been used by Youngs (1993) and Bazzuro and Cornell (1999). Abrahamson and Silva (1997) added a constant term to Gij as shown below. (3b) )ln()ln( cGbaF ijij ++= where c=0.03 g independent of period. This form of the regression equation was also investigated here, as discussed below. Due to the incorporation of event terms into the reference motions, systematic variations of amplification factors across events are not expected, and standard nonlinear regression analyses are performed (which give equal weight to all points) in lieu of the random effects model (Abrahamson and Youngs, 1992). The following three types of Gij parameters were compiled for each reference motion and were used in the regressions:
1. Peak ground acceleration (PGA), taken as (Sr)ij at T = 0.01 s. 2. Spectral acceleration at the same period, T, used in the evaluation of Fij, i.e., (Sr)ij(T). 3. Peak horizontal velocity, calculated using the attenuation relation by Campbell (1997). In
these calculations of peak velocity, a soft rock site condition was assumed, and the depth to basement rock was taken as 1.0 km (Campbell, 2000).
Residuals (Rij) between the amplification “prediction” of Eq. 3 and ln(Fij) values were evaluated for all data in category i to enable evaluation of the mean residual, Ri, and the standard deviation of the residual, (σR)i.
5
SMIP2000 Seminar Proceedings
∑=
=iN
jij
ii R
NR
1
1 (5a)
( )( )
11
2
−
−=σ∑=
i
N
jiij
iR N
RRi
(5b)
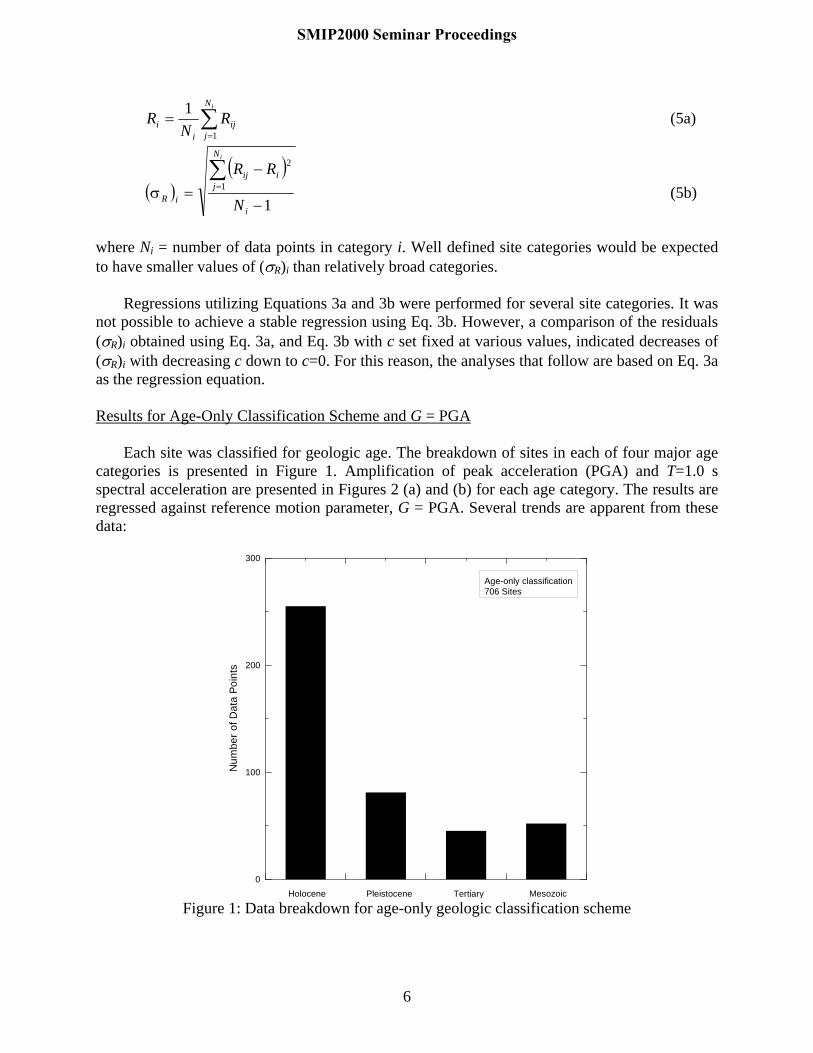
where Ni = number of data points in category i. Well defined site categories would be expected to have smaller values of (σR)i than relatively broad categories. Regressions utilizing Equations 3a and 3b were performed for several site categories. It was not possible to achieve a stable regression using Eq. 3b. However, a comparison of the residuals (σR)i obtained using Eq. 3a, and Eq. 3b with c set fixed at various values, indicated decreases of (σR)i with decreasing c down to c=0. For this reason, the analyses that follow are based on Eq. 3a as the regression equation. Results for Age-Only Classification Scheme and G = PGA Each site was classified for geologic age. The breakdown of sites in each of four major age categories is presented in Figure 1. Amplification of peak acceleration (PGA) and T=1.0 s spectral acceleration are presented in Figures 2 (a) and (b) for each age category. The results are regressed against reference motion parameter, G = PGA. Several trends are apparent from these data:
0
100
200
300
Num
ber o
f Dat
a Po
ints
Age-only classification706 Sites
Holocene Pleistocene Tertiary Mesozoic Figure 1: Data breakdown for age-only geologic classification scheme
6
SMIP2000 Seminar Proceedings
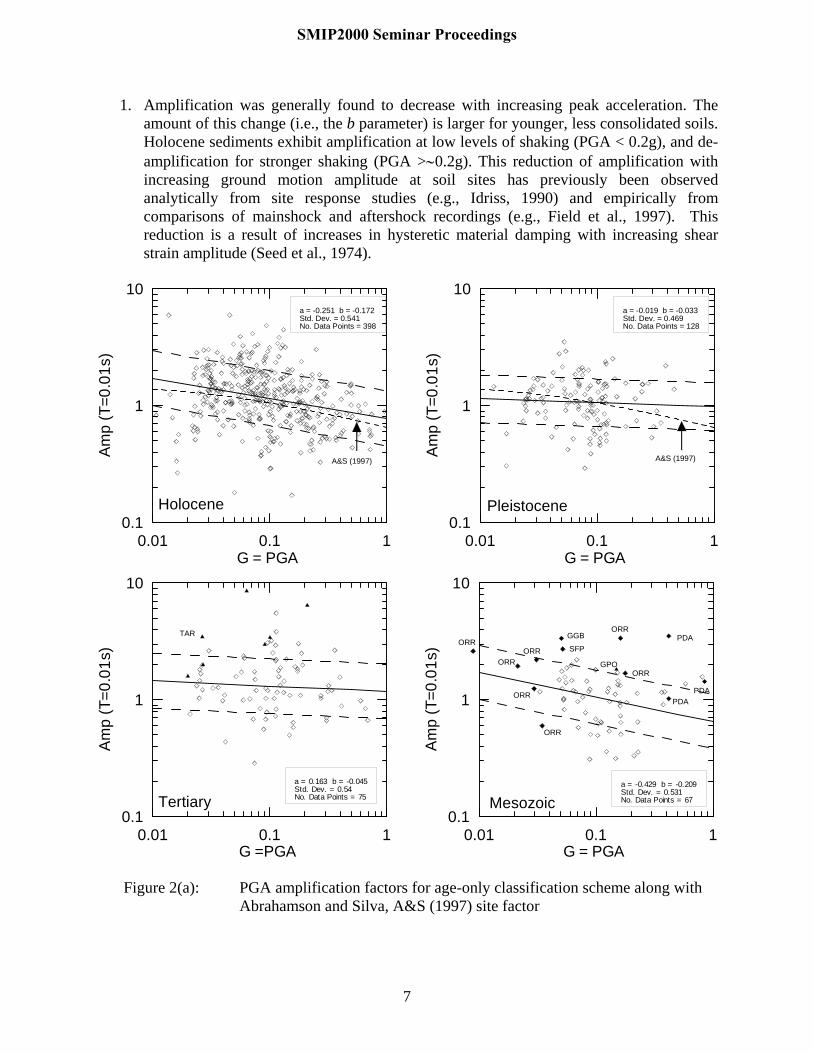
1. Amplification was generally found to decrease with increasing peak acceleration. The amount of this change (i.e., the b parameter) is larger for younger, less consolidated soils. Holocene sediments exhibit amplification at low levels of shaking (PGA < 0.2g), and de-amplification for stronger shaking (PGA >∼0.2g). This reduction of amplification with increasing ground motion amplitude at soil sites has previously been observed analytically from site response studies (e.g., Idriss, 1990) and empirically from comparisons of mainshock and aftershock recordings (e.g., Field et al., 1997). This reduction is a result of increases in hysteretic material damping with increasing shear strain amplitude (Seed et al., 1974).
0.01 0.1 1G = PGA
0.1
1
10
Am
p (T
=0.0
1s)
a = -0.251 b = -0.172Std. Dev. = 0.541No. Data Points = 398
0.01 0.1 1G = PGA
0.1
1
10
Am
p (T
=0.0
1s)
a = -0.019 b = -0.033Std. Dev. = 0.469No. Data Points = 128
0.01 0.1 1G =PGA
0.1
1
10
Am
p (T
=0.0
1s)
a = 0.163 b = -0.045Std. Dev. = 0.54No. Data Points = 75
0.01 0.1 1G = PGA
0.1
1
10
Am
p (T
=0.0
1s)
a = -0.429 b = -0.209Std. Dev. = 0.531No. Data Points = 67
Holocene Pleistocene
Tertiary Mesozoic
A&S (1997) A&S (1997)
TAR
PDA
PDA
PDA
ORR
ORR
ORR
ORR
ORR
ORR
ORR
SFP
GGB
GPO
Figure 2(a): PGA amplification factors for age-only classification scheme along with
Abrahamson and Silva, A&S (1997) site factor
7
SMIP2000 Seminar Proceedings

0.01 0.1 1G = PGA
0.1
1
10A
mp
(T =
1.0
s)
a = 0.208 b = -0.059Std. Dev. = 0.588No. Data Points = 398
0.01 0.1 1G = PGA
0.1
1
10
Am
p (T
= 1
.0s)
a = 0.182 b = -0.046Std. Dev. = 0.494No. Data Points = 128
0.01 0.1 1G = PGA
0.1
1
10
Am
p (T
= 1
.0s)
a = 0.131 b = -.022Std. Dev. = 0.522No. Data Points = 75
0.01 0.1 1G = PGA
0.1
1
10
Am
p (T
= 1
.0s)
a = -1.016 b = -0.343Std. Dev. = 0.805No. Data Points = 67
Holocene Pleistocene
Tertiary Mesozoic
A&S (1997) A&S (1997)
TAR
PDA
PDA
PDA
ORR
ORRORR
ORRORR
ORR
ORR
SFP
GGB
GPO
Figure 2(b): T=1.0 s spectral amplification factors for age-only classification scheme
along with Abrahamson and Silva, A&S (1997) site factor 2. Amplification at low levels of shaking (i.e., PGA ≈ 0.01g) is largest for Holocene
sediments, and generally decreases with increasing geologic age (with the exception of Mesozoic). The a parameter, which represents an index of amplification at G = 1.0 g, generally increases with geologic age. This can be attributed to the previously noted decrease of nonlinear sediment response with increasing geologic age.
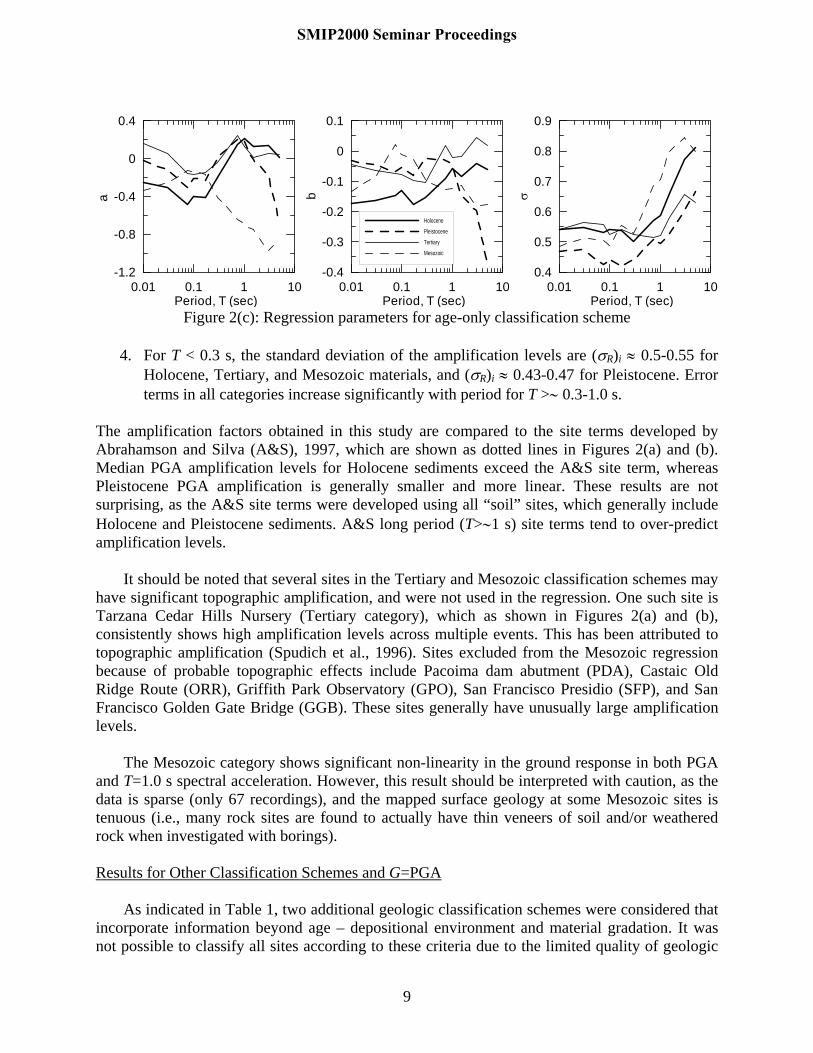
3. As shown in Figure 2(c), the nonlinearity in Holocene materials (indexed by b) decreases with period (i.e., b increases). This change in b is sufficient that median T=1 s spectral amplification levels for Holocene materials exceed 1.0 even during strong shaking (PGA ≈ 1 g). Nonlinearity in the Pleistocene and Tertiary sediments is less period dependant up to T ≈ 1 s, beyond which the results are subject to increased scatter and are less reliable. Values of b for the Mesozoic category have significant fluctuations with period, and are less reliable than other categories, as discussed further below.
8
SMIP2000 Seminar Proceedings
0.01 0.1 1 10Period, T (sec)
-1.2
-0.8
-0.4
0
0.4a
Holocene
Pleistocene
Tertiary
Mesozoic
0.01 0.1 1 10Period, T (sec)
-0.4
-0.3
-0.2
-0.1
0
0.1
b
0.01 0.1 1 10Period, T (sec)
0.4
0.5
0.6
0.7
0.8
0.9
σ
Figure 2(c): Regression parameters for age-only classification scheme
4. For T < 0.3 s, the standard deviation of the amplification levels are (σR)i ≈ 0.5-0.55 for
Holocene, Tertiary, and Mesozoic materials, and (σR)i ≈ 0.43-0.47 for Pleistocene. Error terms in all categories increase significantly with period for T >∼ 0.3-1.0 s.
The amplification factors obtained in this study are compared to the site terms developed by Abrahamson and Silva (A&S), 1997, which are shown as dotted lines in Figures 2(a) and (b). Median PGA amplification levels for Holocene sediments exceed the A&S site term, whereas Pleistocene PGA amplification is generally smaller and more linear. These results are not surprising, as the A&S site terms were developed using all “soil” sites, which generally include Holocene and Pleistocene sediments. A&S long period (T>∼1 s) site terms tend to over-predict amplification levels. It should be noted that several sites in the Tertiary and Mesozoic classification schemes may have significant topographic amplification, and were not used in the regression. One such site is Tarzana Cedar Hills Nursery (Tertiary category), which as shown in Figures 2(a) and (b), consistently shows high amplification levels across multiple events. This has been attributed to topographic amplification (Spudich et al., 1996). Sites excluded from the Mesozoic regression because of probable topographic effects include Pacoima dam abutment (PDA), Castaic Old Ridge Route (ORR), Griffith Park Observatory (GPO), San Francisco Presidio (SFP), and San Francisco Golden Gate Bridge (GGB). These sites generally have unusually large amplification levels. The Mesozoic category shows significant non-linearity in the ground response in both PGA and T=1.0 s spectral acceleration. However, this result should be interpreted with caution, as the data is sparse (only 67 recordings), and the mapped surface geology at some Mesozoic sites is tenuous (i.e., many rock sites are found to actually have thin veneers of soil and/or weathered rock when investigated with borings). Results for Other Classification Schemes and G=PGA As indicated in Table 1, two additional geologic classification schemes were considered that incorporate information beyond age – depositional environment and material gradation. It was not possible to classify all sites according to these criteria due to the limited quality of geologic
9
SMIP2000 Seminar Proceedings
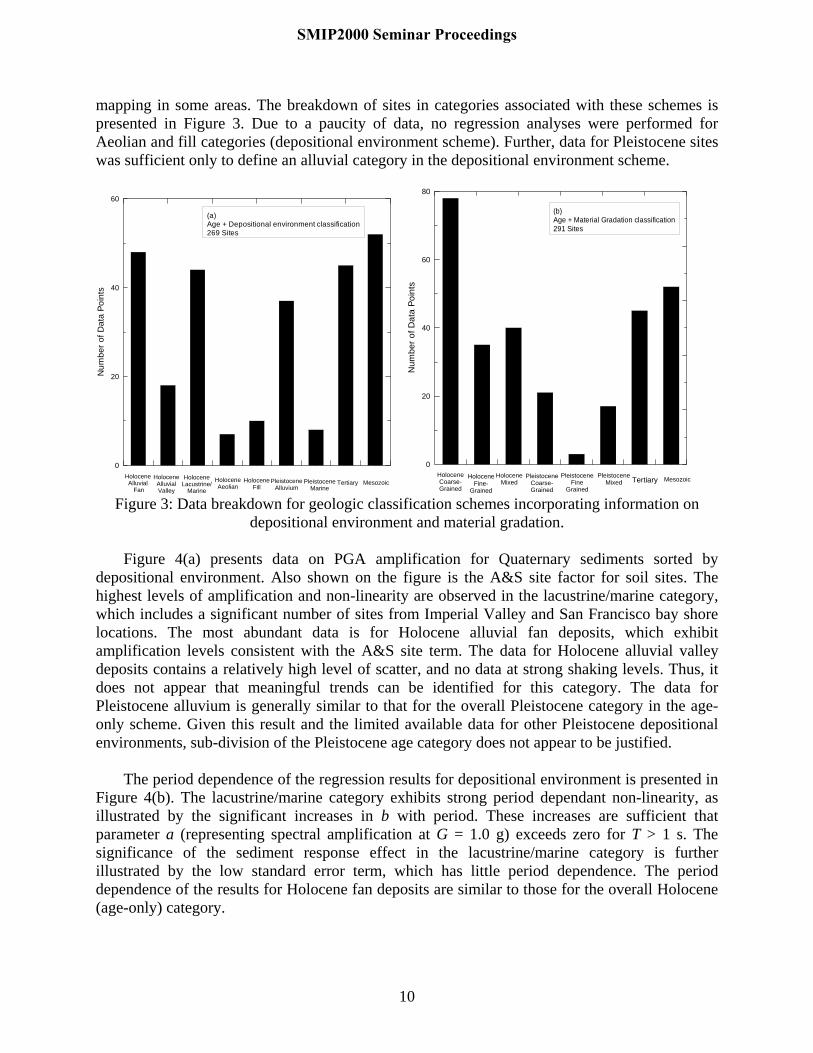
mapping in some areas. The breakdown of sites in categories associated with these schemes is presented in Figure 3. Due to a paucity of data, no regression analyses were performed for Aeolian and fill categories (depositional environment scheme). Further, data for Pleistocene sites was sufficient only to define an alluvial category in the depositional environment scheme.
0
20
40
60
Num
ber o
f Dat
a Po
ints
(a)Age + Depositional environment classification269 Sites
HoloceneLacustrine/
Marine
HoloceneAlluvial
Fan
HoloceneAlluvialValley
PleistoceneAlluvium
Tertiary MesozoicHoloceneAeolian
HoloceneFill
PleistoceneMarine
0
20
40
60
80
Num
ber o
f Dat
a Po
ints
(b)Age + Material Gradation classification291 Sites
HoloceneCoarse-Grained
HoloceneFine-
Grained
PleistoceneCoarse-Grained
Tertiary MesozoicPleistoceneFine
Grained
HoloceneMixed
PleistoceneMixed
Figure 3: Data breakdown for geologic classification schemes incorporating information on depositional environment and material gradation.
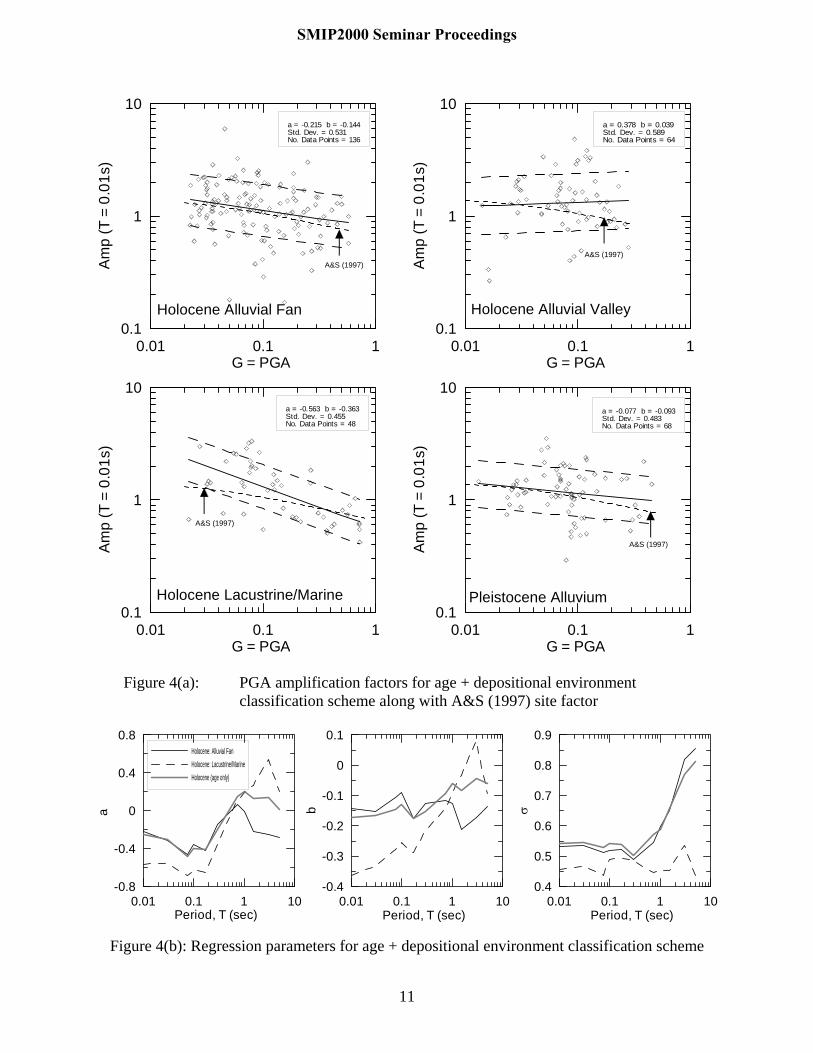
Figure 4(a) presents data on PGA amplification for Quaternary sediments sorted by depositional environment. Also shown on the figure is the A&S site factor for soil sites. The highest levels of amplification and non-linearity are observed in the lacustrine/marine category, which includes a significant number of sites from Imperial Valley and San Francisco bay shore locations. The most abundant data is for Holocene alluvial fan deposits, which exhibit amplification levels consistent with the A&S site term. The data for Holocene alluvial valley deposits contains a relatively high level of scatter, and no data at strong shaking levels. Thus, it does not appear that meaningful trends can be identified for this category. The data for Pleistocene alluvium is generally similar to that for the overall Pleistocene category in the age-only scheme. Given this result and the limited available data for other Pleistocene depositional environments, sub-division of the Pleistocene age category does not appear to be justified. The period dependence of the regression results for depositional environment is presented in Figure 4(b). The lacustrine/marine category exhibits strong period dependant non-linearity, as illustrated by the significant increases in b with period. These increases are sufficient that parameter a (representing spectral amplification at G = 1.0 g) exceeds zero for T > 1 s. The significance of the sediment response effect in the lacustrine/marine category is further illustrated by the low standard error term, which has little period dependence. The period dependence of the results for Holocene fan deposits are similar to those for the overall Holocene (age-only) category.
10
SMIP2000 Seminar Proceedings
0.01 0.1 1G = PGA
0.1
1
10A
mp
(T =
0.0
1s)
a = -0.215 b = -0.144Std. Dev. = 0.531No. Data Points = 136
0.01 0.1 1G = PGA
0.1
1
10
Am
p (T
= 0
.01s
)
a = 0.378 b = 0.039Std. Dev. = 0.589No. Data Points = 64
0.01 0.1 1G = PGA
0.1
1
10
Am
p (T
= 0
.01s
)
a = -0.563 b = -0.363Std. Dev. = 0.455No. Data Points = 48
0.01 0.1 1G = PGA
0.1
1
10
Am
p (T
= 0
.01s
)a = -0.077 b = -0.093Std. Dev. = 0.483No. Data Points = 68
Holocene Alluvial Fan Holocene Alluvial Valley
Holocene Lacustrine/Marine Pleistocene Alluvium
A&S (1997)A&S (1997)
A&S (1997)
A&S (1997)
Figure 4(a): PGA amplification factors for age + depositional environment
classification scheme along with A&S (1997) site factor
0.01 0.1 1 10Period, T (sec)
-0.8
-0.4
0
0.4
0.8
a
Holocene: Alluvial FanHolocene: Lacustrine/MarineHolocene (age only)
0.01 0.1 1 10Period, T (sec)
-0.4
-0.3
-0.2
-0.1
0
0.1
b
0.01 0.1 1 10Period, T (sec)
0.4
0.5
0.6
0.7
0.8
0.9
σ
Figure 4(b): Regression parameters for age + depositional environment classification scheme
11
SMIP2000 Seminar Proceedings
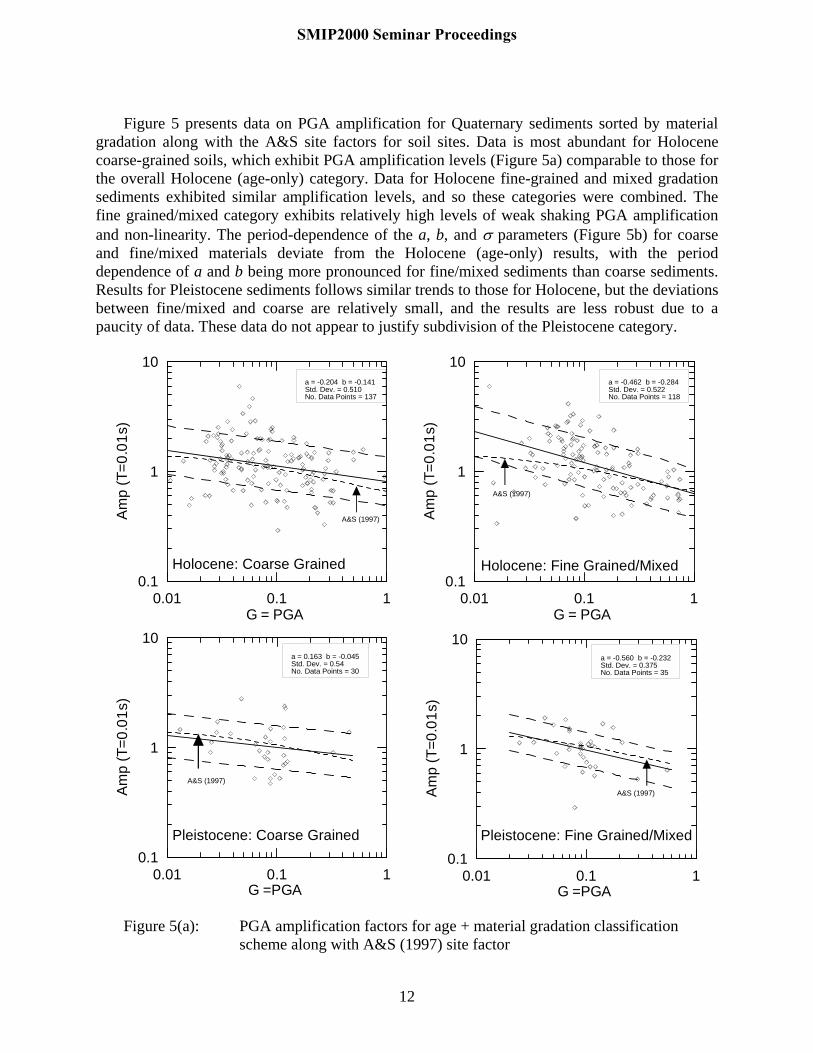
Figure 5 presents data on PGA amplification for Quaternary sediments sorted by material gradation along with the A&S site factors for soil sites. Data is most abundant for Holocene coarse-grained soils, which exhibit PGA amplification levels (Figure 5a) comparable to those for the overall Holocene (age-only) category. Data for Holocene fine-grained and mixed gradation sediments exhibited similar amplification levels, and so these categories were combined. The fine grained/mixed category exhibits relatively high levels of weak shaking PGA amplification and non-linearity. The period-dependence of the a, b, and σ parameters (Figure 5b) for coarse and fine/mixed materials deviate from the Holocene (age-only) results, with the period dependence of a and b being more pronounced for fine/mixed sediments than coarse sediments. Results for Pleistocene sediments follows similar trends to those for Holocene, but the deviations between fine/mixed and coarse are relatively small, and the results are less robust due to a paucity of data. These data do not appear to justify subdivision of the Pleistocene category.
0.01 0.1 1G = PGA
0.1
1
10
Am
p (T
=0.0
1s)
a = -0.204 b = -0.141Std. Dev. = 0.510No. Data Points = 137
0.01 0.1 1G = PGA
0.1
1
10
Am
p (T
=0.0
1s)
a = -0.462 b = -0.284Std. Dev. = 0.522No. Data Points = 118
0.01 0.1 1G =PGA
0.1
1
10
Am
p (T
=0.0
1s)
a = -0.560 b = -0.232Std. Dev. = 0.375No. Data Points = 35
Holocene: Coarse Grained Holocene: Fine Grained/Mixed
Pleistocene: Coarse Grained
A&S (1997)
A&S (1997)
A&S (1997)
A&S (1997)
0.01 0.1 1G =PGA
0.1
1
10
Am
p (T
=0.0
1s)
a = 0.163 b = -0.045Std. Dev. = 0.54No. Data Points = 30
Pleistocene: Fine Grained/Mixed
Figure 5(a): PGA amplification factors for age + material gradation classification
scheme along with A&S (1997) site factor
12
SMIP2000 Seminar Proceedings
0.01 0.1 1 10Period, T (sec)
-0.8
-0.6
-0.4
-0.2
0
0.2
0.4a
Holocene: Coarse Grained
Holocene: Fine Grained/Mixed
Holocene (Age only)
0.01 0.1 1 10Period, T (sec)
-0.3
-0.2
-0.1
0
0.1
b
0.01 0.1 1 10Period, T (sec)
0.4
0.5
0.6
0.7
0.8
0.9
σ
Figure 5(b): Regression parameters for age + material gradation classification scheme
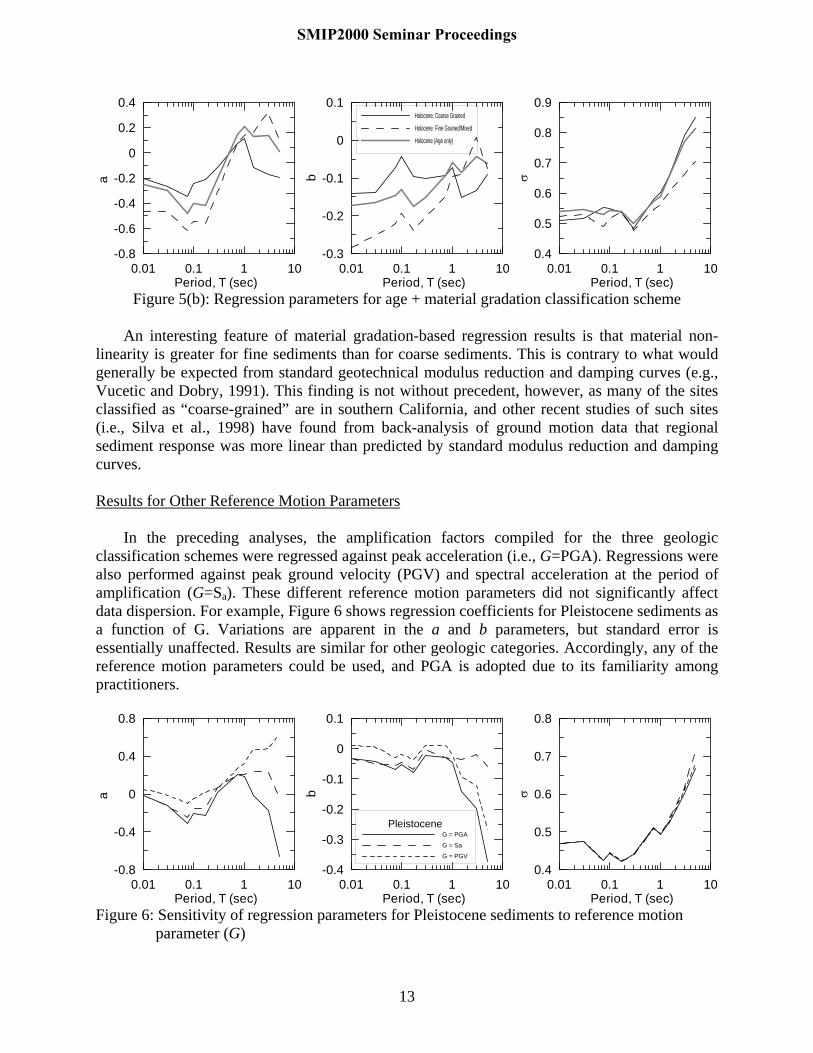
An interesting feature of material gradation-based regression results is that material non-linearity is greater for fine sediments than for coarse sediments. This is contrary to what would generally be expected from standard geotechnical modulus reduction and damping curves (e.g., Vucetic and Dobry, 1991). This finding is not without precedent, however, as many of the sites classified as “coarse-grained” are in southern California, and other recent studies of such sites (i.e., Silva et al., 1998) have found from back-analysis of ground motion data that regional sediment response was more linear than predicted by standard modulus reduction and damping curves. Results for Other Reference Motion Parameters In the preceding analyses, the amplification factors compiled for the three geologic classification schemes were regressed against peak acceleration (i.e., G=PGA). Regressions were also performed against peak ground velocity (PGV) and spectral acceleration at the period of amplification (G=Sa). These different reference motion parameters did not significantly affect data dispersion. For example, Figure 6 shows regression coefficients for Pleistocene sediments as a function of G. Variations are apparent in the a and b parameters, but standard error is essentially unaffected. Results are similar for other geologic categories. Accordingly, any of the reference motion parameters could be used, and PGA is adopted due to its familiarity among practitioners.
0.01 0.1 1 10Period, T (sec)
-0.8
-0.4
0
0.4
0.8
a
0.01 0.1 1 10Period, T (sec)
-0.4
-0.3
-0.2
-0.1
0
0.1
b
PleistoceneG = PGA
G = Sa
G = PGV
0.01 0.1 1 10Period, T (sec)
0.4
0.5
0.6
0.7
0.8
σ
Figure 6: Sensitivity of regression parameters for Pleistocene sediments to reference motion
parameter (G)
13
SMIP2000 Seminar Proceedings
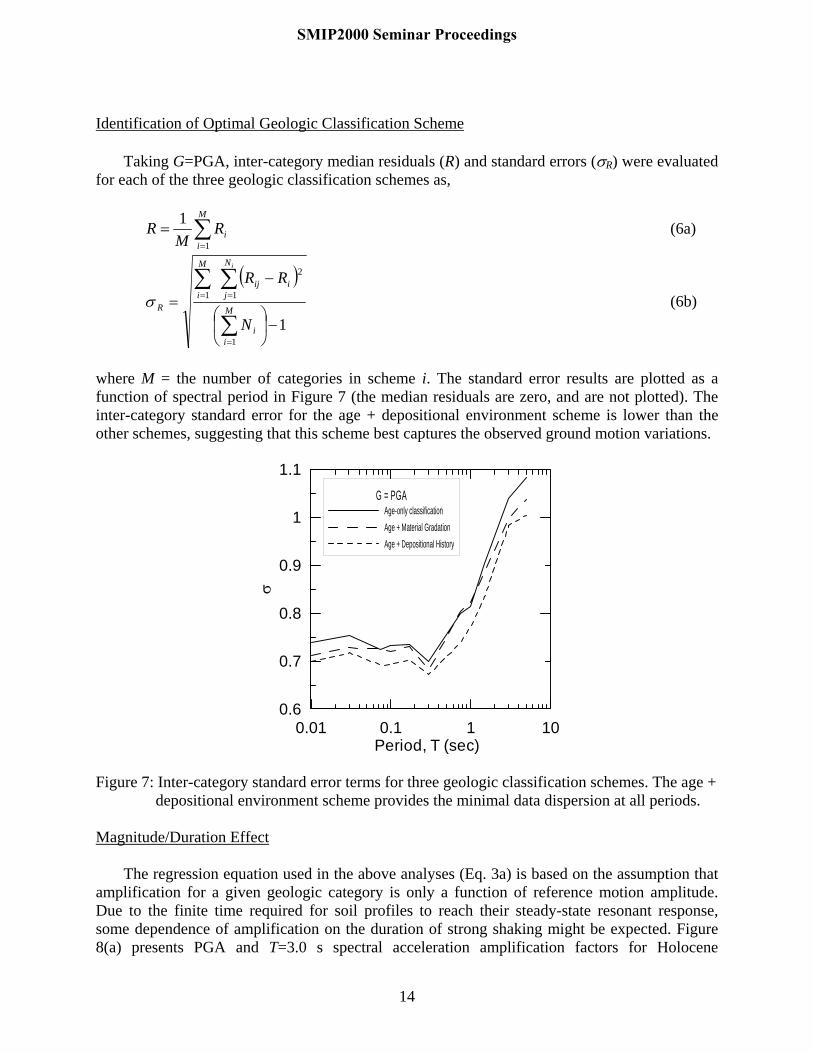
Identification of Optimal Geologic Classification Scheme Taking G=PGA, inter-category median residuals (R) and standard errors (σR) were evaluated for each of the three geologic classification schemes as,
∑=
=M
iiR
MR
1
1 (6a)
( )
11
1
2
1
−⎟⎠
⎞⎜⎝
⎛
−=
∑
∑∑
=
==
M
ii
N
jiij
M
iR
N
RRi
σ (6b)
where M = the number of categories in scheme i. The standard error results are plotted as a function of spectral period in Figure 7 (the median residuals are zero, and are not plotted). The inter-category standard error for the age + depositional environment scheme is lower than the other schemes, suggesting that this scheme best captures the observed ground motion variations.
0.01 0.1 1 10Period, T (sec)
0.6
0.7
0.8
0.9
1
1.1
σ
G = PGAAge-only classificationAge + Material GradationAge + Depositional History
Figure 7: Inter-category standard error terms for three geologic classification schemes. The age + depositional environment scheme provides the minimal data dispersion at all periods.
Magnitude/Duration Effect The regression equation used in the above analyses (Eq. 3a) is based on the assumption that amplification for a given geologic category is only a function of reference motion amplitude. Due to the finite time required for soil profiles to reach their steady-state resonant response, some dependence of amplification on the duration of strong shaking might be expected. Figure 8(a) presents PGA and T=3.0 s spectral acceleration amplification factors for Holocene
14
SMIP2000 Seminar Proceedings
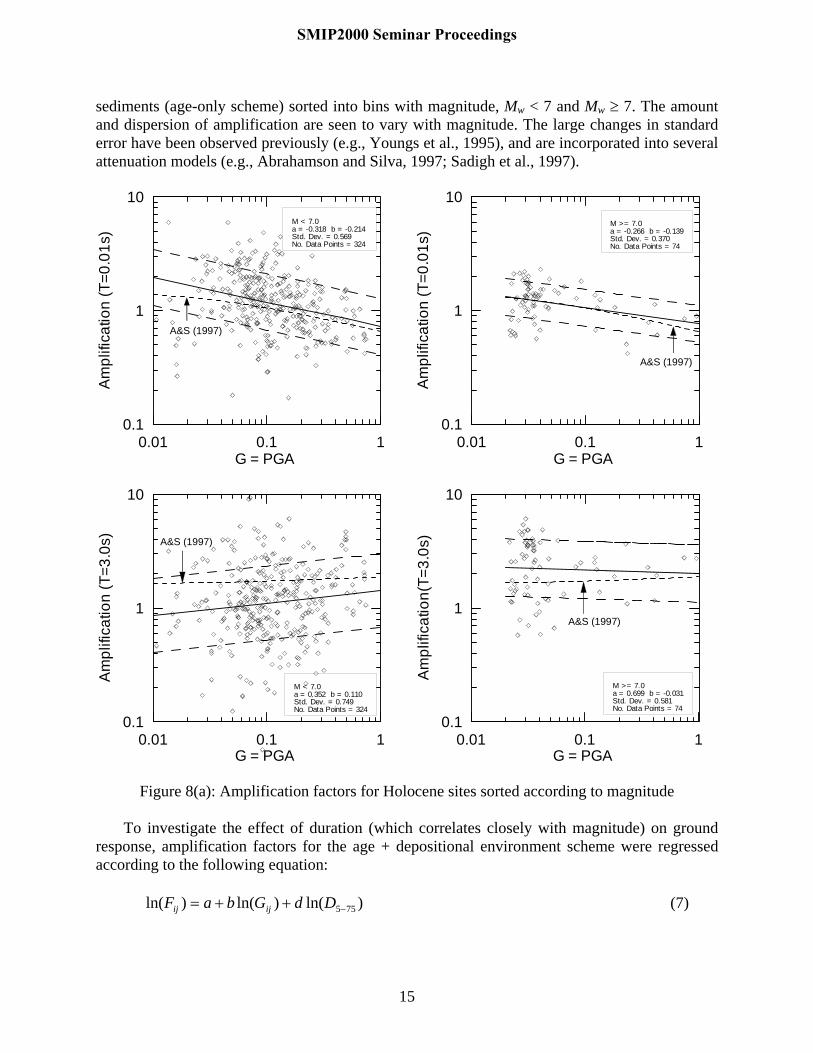
sediments (age-only scheme) sorted into bins with magnitude, Mw < 7 and Mw ≥ 7. The amount and dispersion of amplification are seen to vary with magnitude. The large changes in standard error have been observed previously (e.g., Youngs et al., 1995), and are incorporated into several attenuation models (e.g., Abrahamson and Silva, 1997; Sadigh et al., 1997).
0.01 0.1 1G = PGA
0.1
1
10
Am
plifi
catio
n (T
=0.0
1s)
M >= 7.0a = -0.266 b = -0.139Std. Dev. = 0.370No. Data Points = 74
0.01 0.1 1G = PGA
0.1
1
10
Am
plifi
catio
n (T
=3.0
s)
M < 7.0a = 0.352 b = 0.110Std. Dev. = 0.749No. Data Points = 324
0.01 0.1 1G = PGA
0.1
1
10
Am
plifi
catio
n(T=
3.0s
)
M >= 7.0a = 0.699 b = -0.031Std. Dev. = 0.581No. Data Points = 74
0.01 0.1 1G = PGA
0.1
1
10
Am
plifi
catio
n (T
=0.0
1s)
M < 7.0a = -0.318 b = -0.214Std. Dev. = 0.569No. Data Points = 324
A&S (1997)
A&S (1997)
A&S (1997)
A&S (1997)
Figure 8(a): Amplification factors for Holocene sites sorted according to magnitude
To investigate the effect of duration (which correlates closely with magnitude) on ground response, amplification factors for the age + depositional environment scheme were regressed according to the following equation: (7) )ln()ln()ln( 755−++= DdGbaF ijij
15
SMIP2000 Seminar Proceedings
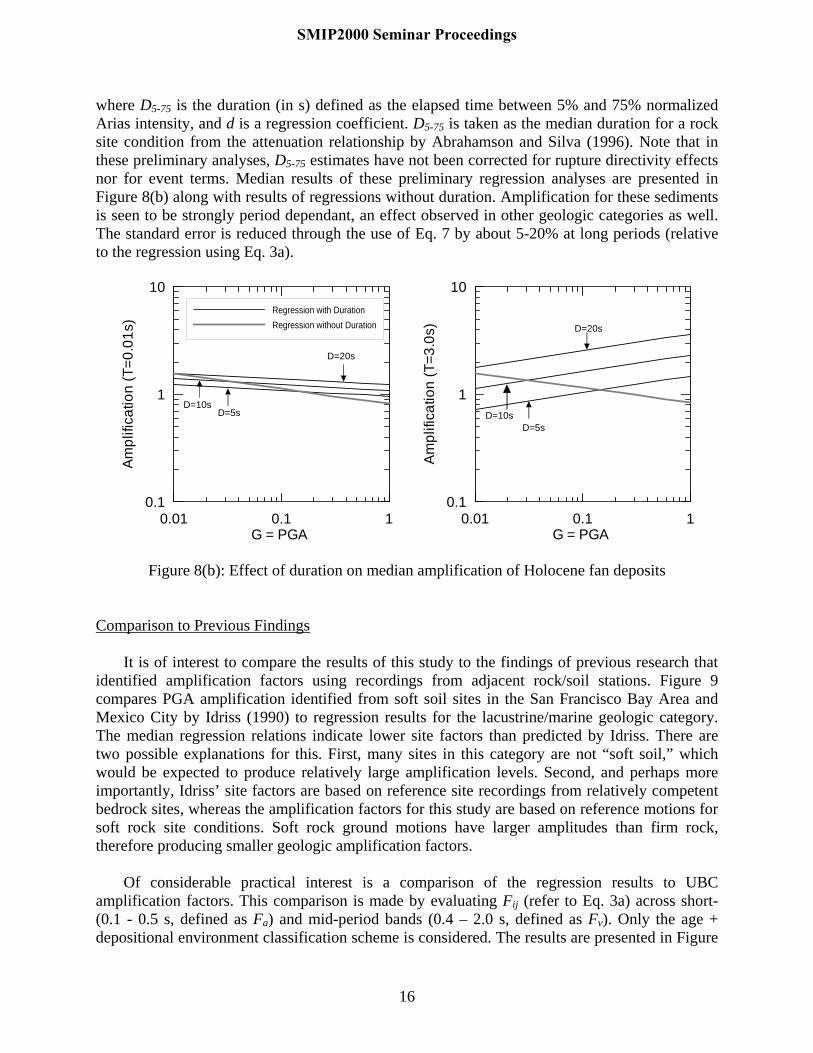
where D5-75 is the duration (in s) defined as the elapsed time between 5% and 75% normalized Arias intensity, and d is a regression coefficient. D5-75 is taken as the median duration for a rock site condition from the attenuation relationship by Abrahamson and Silva (1996). Note that in these preliminary analyses, D5-75 estimates have not been corrected for rupture directivity effects nor for event terms. Median results of these preliminary regression analyses are presented in Figure 8(b) along with results of regressions without duration. Amplification for these sediments is seen to be strongly period dependant, an effect observed in other geologic categories as well. The standard error is reduced through the use of Eq. 7 by about 5-20% at long periods (relative to the regression using Eq. 3a).
0.01 0.1 1G = PGA
0.1
1
10
Am
plifi
catio
n (T
=3.0
s)
0.01 0.1 1G = PGA
0.1
1
10
Ampl
ifica
tion
(T=0
.01s
)
Regression with DurationRegression without Duration
D=5sD=10s
D=20s
D=10s
D=20s
D=5s
Figure 8(b): Effect of duration on median amplification of Holocene fan deposits Comparison to Previous Findings It is of interest to compare the results of this study to the findings of previous research that identified amplification factors using recordings from adjacent rock/soil stations. Figure 9 compares PGA amplification identified from soft soil sites in the San Francisco Bay Area and Mexico City by Idriss (1990) to regression results for the lacustrine/marine geologic category. The median regression relations indicate lower site factors than predicted by Idriss. There are two possible explanations for this. First, many sites in this category are not “soft soil,” which would be expected to produce relatively large amplification levels. Second, and perhaps more importantly, Idriss’ site factors are based on reference site recordings from relatively competent bedrock sites, whereas the amplification factors for this study are based on reference motions for soft rock site conditions. Soft rock ground motions have larger amplitudes than firm rock, therefore producing smaller geologic amplification factors. Of considerable practical interest is a comparison of the regression results to UBC amplification factors. This comparison is made by evaluating Fij (refer to Eq. 3a) across short- (0.1 - 0.5 s, defined as Fa) and mid-period bands (0.4 – 2.0 s, defined as Fv). Only the age + depositional environment classification scheme is considered. The results are presented in Figure
16
SMIP2000 Seminar Proceedings
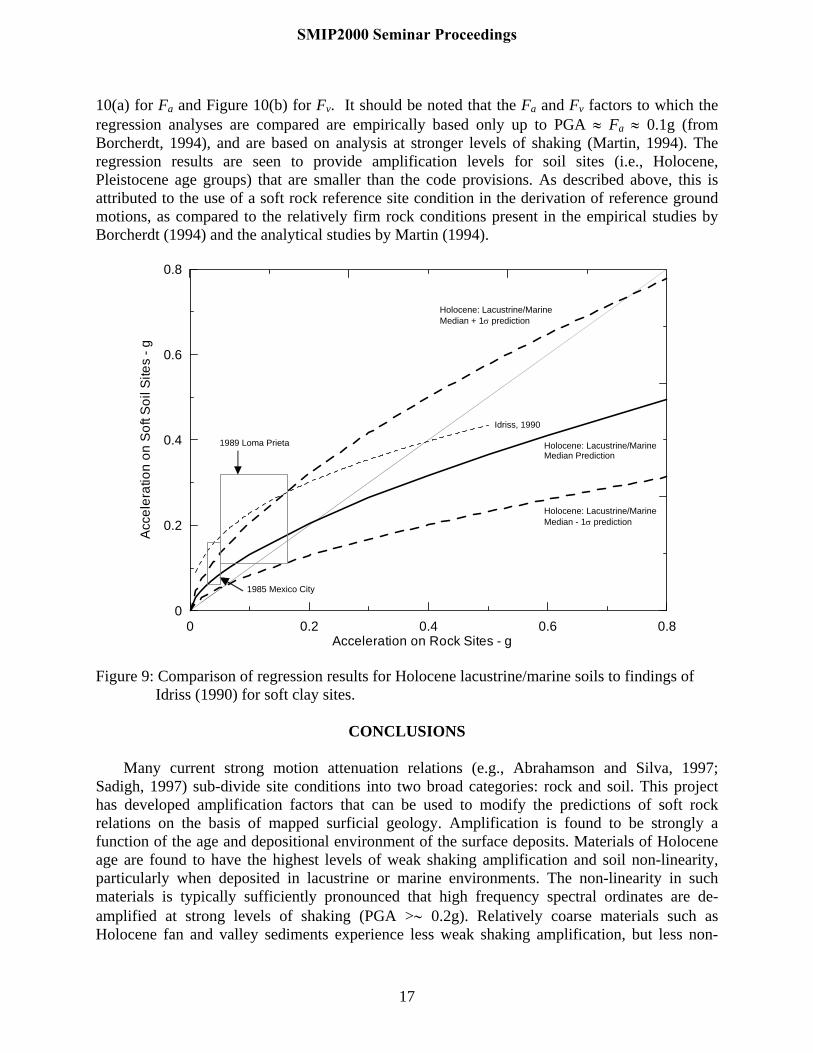
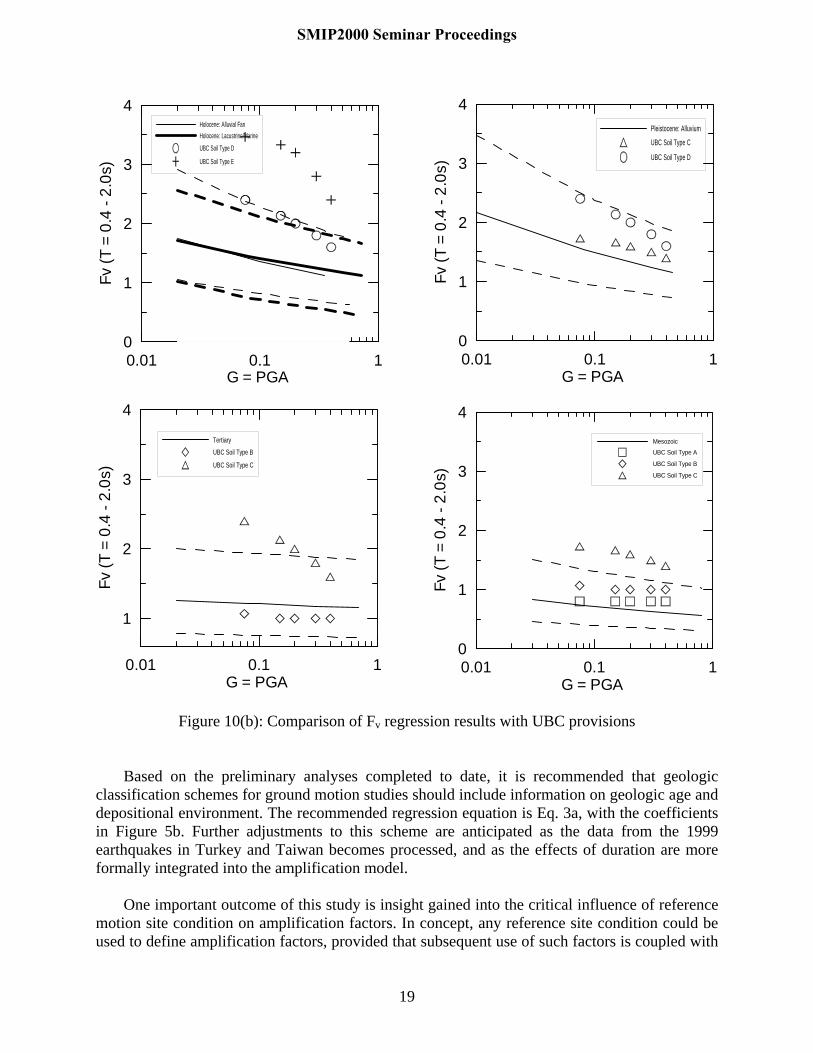
10(a) for Fa and Figure 10(b) for Fv. It should be noted that the Fa and Fv factors to which the regression analyses are compared are empirically based only up to PGA ≈ Fa ≈ 0.1g (from Borcherdt, 1994), and are based on analysis at stronger levels of shaking (Martin, 1994). The regression results are seen to provide amplification levels for soil sites (i.e., Holocene, Pleistocene age groups) that are smaller than the code provisions. As described above, this is attributed to the use of a soft rock reference site condition in the derivation of reference ground motions, as compared to the relatively firm rock conditions present in the empirical studies by Borcherdt (1994) and the analytical studies by Martin (1994).
0 0.2 0.4 0.6 0.8Acceleration on Rock Sites - g
0
0.2
0.4
0.6
0.8
Acc
eler
atio
n on
Sof
t Soi
l Site
s - g
1989 Loma Prieta
1985 Mexico City
Idriss, 1990
Holocene: Lacustrine/MarineMedian Prediction
Holocene: Lacustrine/MarineMedian - 1σ prediction
Holocene: Lacustrine/MarineMedian + 1σ prediction
Figure 9: Comparison of regression results for Holocene lacustrine/marine soils to findings of Idriss (1990) for soft clay sites.
CONCLUSIONS
Many current strong motion attenuation relations (e.g., Abrahamson and Silva, 1997; Sadigh, 1997) sub-divide site conditions into two broad categories: rock and soil. This project has developed amplification factors that can be used to modify the predictions of soft rock relations on the basis of mapped surficial geology. Amplification is found to be strongly a function of the age and depositional environment of the surface deposits. Materials of Holocene age are found to have the highest levels of weak shaking amplification and soil non-linearity, particularly when deposited in lacustrine or marine environments. The non-linearity in such materials is typically sufficiently pronounced that high frequency spectral ordinates are de-amplified at strong levels of shaking (PGA >∼ 0.2g). Relatively coarse materials such as Holocene fan and valley sediments experience less weak shaking amplification, but less non-
17
SMIP2000 Seminar Proceedings
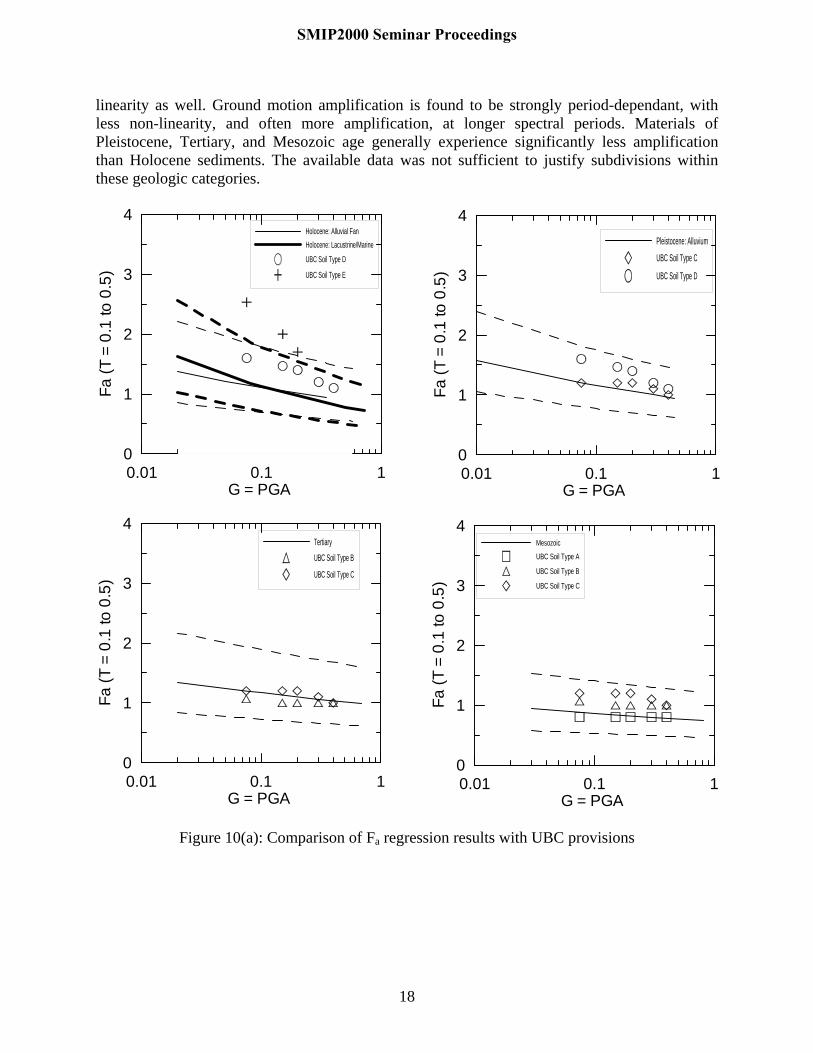
linearity as well. Ground motion amplification is found to be strongly period-dependant, with less non-linearity, and often more amplification, at longer spectral periods. Materials of Pleistocene, Tertiary, and Mesozoic age generally experience significantly less amplification than Holocene sediments. The available data was not sufficient to justify subdivisions within these geologic categories.
0.01 0.1 1G = PGA
0
1
2
3
4
Fa (T
= 0
.1 to
0.5
)
Holocene: Alluvial FanHolocene: Lacustrine/Marine
UBC Soil Type D
UBC Soil Type E
0.01 0.1 1G = PGA
0
1
2
3
4
Fa (T
= 0
.1 to
0.5
)
Pleistocene: Alluvium
UBC Soil Type C
UBC Soil Type D
0.01 0.1 1G = PGA
0
1
2
3
4
Fa (T
= 0
.1 to
0.5
)
Tertiary
UBC Soil Type B
UBC Soil Type C
0.01 0.1 1G = PGA
0
1
2
3
4
Fa (T
= 0
.1 to
0.5
)
Mesozoic
UBC Soil Type A
UBC Soil Type B
UBC Soil Type C
Figure 10(a): Comparison of Fa regression results with UBC provisions
18
SMIP2000 Seminar Proceedings
0.01 0.1 1G = PGA
0
1
2
3
4Fv
(T =
0.4
- 2.
0s)
Holocene: Alluvial FanHolocene: Lacustrine/Marine
UBC Soil Type D
UBC Soil Type E
0.01 0.1 1G = PGA
1
2
3
4
Fv (T
= 0
.4 -
2.0s
)
Tertiary
UBC Soil Type B
UBC Soil Type C
0.01 0.1 1G = PGA
0
1
2
3
4
Fv (T
= 0
.4 -
2.0s
)Mesozoic
UBC Soil Type A
UBC Soil Type B
UBC Soil Type C
0.01 0.1 1G = PGA
0
1
2
3
4
Fv (T
= 0
.4 -
2.0s
)
Pleistocene: Alluvium
UBC Soil Type C
UBC Soil Type D
Figure 10(b): Comparison of Fv regression results with UBC provisions Based on the preliminary analyses completed to date, it is recommended that geologic classification schemes for ground motion studies should include information on geologic age and depositional environment. The recommended regression equation is Eq. 3a, with the coefficients in Figure 5b. Further adjustments to this scheme are anticipated as the data from the 1999 earthquakes in Turkey and Taiwan becomes processed, and as the effects of duration are more formally integrated into the amplification model. One important outcome of this study is insight gained into the critical influence of reference motion site condition on amplification factors. In concept, any reference site condition could be used to define amplification factors, provided that subsequent use of such factors is coupled with
19
SMIP2000 Seminar Proceedings
design motions appropriate for the reference site condition. In California, the predominant condition of consolidated (non-soil) geologic materials can be described as “soft rock.” Accordingly, attenuation models based on “rock” recordings in California are actually appropriate for a soft rock condition. For this reason, soft rock was selected as the reference site condition, and the amplification factors presented herein are appropriate for use with standard rock attenuation models. The use of amplification factors defined from relatively firm rock reference sites coupled with these same rock attenuation models may produce unnecessarily conservative design ground motions.
ACKNOWLEDGEMENTS This study was supported principally by the California Department of Conservation, Division of Mines and Geology, Strong Motion Instrumentation Program, Contract 1098-712. Additional support was provided by the Pacific Earthquake Engineering Research Center under Contract Number 021544. This support is gratefully acknowledged. We would like to thank Moh Huang and Anthony Shakal of CSMIP, and the member of the CSMIP Advisory Committee, for their valuable advice and contributions of data. In particular, CSMIP staff provided accurate station locations that increased the quality of the geologic classifications. Charles Real of CDMG facilitated the acquisition of digital SCAMP maps for southern California. James Chen and M. B. Baturay of UCLA assisted with data synthesis and analysis.
REFERENCES Abrahamson, N.A. and Silva, W.J. (1996). “Empirical ground motion models,” Report prepared
for Brookhaven National Laboratory, New York, NY, May, 144 p. Abrahamson, N.A. and Silva, W.J. (1997). “Empirical response spectral attenuation relations for
shallow crustal earthquakes,” Seism. Res. Letters, 68(1), 94-127. Abrahamson, N.A. and Youngs, R.R. (1992). “A stable algorithm for regression analyses using
the random effect model,” Bull. Seism. Soc. Am., 82, 505-510. Ang, A.H.-S. and Tang, W.H. (1975). Probability Concepts in Engineering Planning and
Design, Volume I – Basic Principles, John Wiley & Sons, New York, NY. Bazzuro, P. and Cornell, C.A. (1999). “Efficient PSHA for nonlinear soil sites with uncertain
properties,” Ph.D. dissertation, Stanford University (in progress). Boatwright, J., Fletcher, J.B., and Fumal, T.E. (1991). “A general inversion scheme for source,
site and propagation characteristics using multiply recorded sets of moderate-sized earthquakes,” Bull. Seism. Soc. Am., 81, 1754-1782.
Borcherdt, R.D. (1970). “Effect of local geology on ground motion near San Francisco Bay,” Bull. Seism. Soc. Am., 60, 29-61.
Borcherdt, R.D. (1994). “Estimates of site-dependent response spectra for design (methodology and justification),” Earthquake Spectra, EERI, 10(4), 617-653.
Borcherdt, R.D. and Glassmoyer, G. (1994). “Influences of local geology on strong and weak ground motions recorded in the San Francisco Bay region and their implications for site-specific building-code provisions,” in The Loma Prieta earthquake of October 17, 1989 – Strong Ground Motion, R.D. Borcherdt (ed.), U.S. Geological Survey Prof. Paper 1551-A, p 77-108.
20
SMIP2000 Seminar Proceedings
Borcherdt, R.D. (1996). “Preliminary amplification estimates inferred from strong ground motion recordings of the Northridge earthquake of January 17, 1994,” Proc. Int. Workshop on Site Response Subjected to Strong Earthquake Motions, Yokosuka, Japan, Vol. 2, 21-46.
Building Seismic Safety Council, BSSC (1998). NEHRP Recommended Provisions for Seismic Regulations for New Buildings and Other Structures, Part 1 – Provisions and Part 2 – Commentary, Federal Emergency Management Agency, Washington D.C., February.
Campbell, K.W. (1997). “Empirical near-source attenuation relations for horizontal and vertical components of peak ground acceleration, peak ground velocity, and pseudo-absolute acceleration response spectra,” Seism. Res. Letters, 68(1), 154-179.
Campbell, K.W. (2000). Erratum to Campbell, 1997, Seism. Res. Letters, 71(3), 352-354. CDMG staff (2000). “Preliminary working digital geologic maps of portion of Los Angeles,
Orange, and Ventura Counties, California, compiled for seismic hazard zoning,” 1:24,000 scale.
Chang, S.W., Bray, J.D., and Seed, R.B. (1996). “Engineering implications of ground motions from the Northridge earthquake,” Bull. Seism. Soc. Am., 86(1B), S270-S288.
Dickenson, S.E. and Seed, R.B. (1996). “Nonlinear dynamic response of soft and deep cohesive soil deposits,” Proc. Int. Workshop on Site Response Subjected to Strong Earthquake Motions, Yokosuka, Japan, Vol. 2, 67-81.
Field, E.H. and Jacob, K.H. (1995). “A comparison and test of various site-response estimation techniques, including three that are not reference-site dependent,” Bull. Seism. Soc. Am., 85, 1127-1143.
Field, E.H., Johnson, P.A., Beresnev, I.A., and Zeng, Y. (1997). “Nonlinear ground motion amplification by sediment during the 1994 Northridge earthquake,” Nature, 390, 599-602.
Geomatrix Consultants (1993). “Compilation of geotechnical data for strong motion stations in the Western United States,” Report to Lawrence Livermore National Lab., Project No. 2256.
Hartzell, S.A., Leeds, A., Frankel, A., and Michael, J. (1996). “Site response for urban Los Angeles using aftershocks of the Northridge earthquake,” Bull. Seism. Soc. Am., 86, S168-S192.
Hartzell, S.A., Cranswick, E., Frankel, A., Carver, D., and Meremonte, M. (1997). “Variability of site response in the Los Angeles urban area,” Bull. Seism. Soc. Am., 87, 1377-1400.
Idriss, I.M. (1990). “Response of soft soil sites during earthquakes,” Proc. H. Bolton Seed Memorial Symposium, J. M. Duncan (editor), Vol. 2, 273-290.
Lermo, J. and Chavez-Garcia, F.J. (1993). “Site effect evaluation using spectral ratios with only one station,” Bull. Seism. Soc. Am., 83, 1574-1594.
Martin, G., ed. (1994). Proc. NCEER, SEAOC, BSSC Workshop on Site Response during Earthquakes and Seismic Code Provisions, Univ. Southern California, Los Angeles, CA, November.
Morton, D.M., Hauser, R.M., and Ruppert, K.R. (1999). “Preliminary Digital Geologic Map of the Santa Ana 30' x 60' Quadrangle, Southern California,” Open-File Report 99-172, U.S. Geological Survey, Menlo Park, CA.
Rathje, E.M., Idriss, I.M., and Somerville, P. (2000). “Strong ground motion and site effects,” Earthquake Spectra, Special Volume on 1999 Kocaeli, Turkey, earthquake, (in press).
Sadigh, K., Chang, C.-Y., Egan, J.A., Makdisi, F., and Youngs, R.R. (1997). “Attenuation relations for shallow crustal earthquakes based on California strong motion data,” Seism. Res. Letters, 68(1), 180-189.
21
SMIP2000 Seminar Proceedings
Seed, H.B. and Idriss, I.M. (1971). “Influence of soil conditions on building damage potential during earthquakes,” J. Struct. Engrg., ASCE, 97(2), 639-663.
Seed, H.B. and Idriss, I.M. (1982). Ground Motions and Soil Liquefaction During Earthquakes, Mongraph, Earthquake Engrg. Res. Institute, Oakland, CA.
Seed, H.B., Romo, M.P., Sun, J.J., and Lysmer, J. (1987). “Relationships between soil conditions and earthquake ground motions in Mexico City in the earthquake of September 19, 1985,” Rpt. No. UCB/EERC-87/15, Earthquake Engrg. Res. Ctr., Univ. of California, Berkeley.
Seed, H.B., Ugas, C., and Lysmer, J. (1974). “Site-dependent spectra for earthquake resistant design,” Rpt. No. UCB/EERC-74/12, Earthquake Engrg. Res. Ctr., Univ. of California, Berkeley.
Seed, H.B., Whitman, R.V., Dezfulian, H., Dobry, R., and Idriss, I.M. (1972). “Soil conditions and building damage in 1967 Caracas earthquake,” J. Soil Mech. and Fndns. Div., ASCE, 98(8), 787-806.
Seed, R.B., Dickenson, S.E., and Idriss, I.M. (1991). “Principal geotechnical aspects of the 1989 Loma Prieta earthquake,” Soils and Foundations, 31(1), 1-26.
Silva, W.J., Costantino, C., and Li, S. (1998). “Quantification of nonlinear soil response for the Loma Prieta, Northridge, and Imperial Valley, California earthquakes,” in The effects of surface geology on seismic motion, Balkema, Vol. 2, 1137-1143.
Sokolov, V.Y. (1997). “Empirical models for estimating Fourier-amplitude spectra of ground acceleration in the northern Caucasus (Racha seismogenic zone),” Bull. Seism. Soc. Am., 87, 1401-1412.
Sokolov, V.Y., Loh, C.-H., and Wen, K.-L. (2000). “Empirical study of sediment-filled basin response: The case of Taipei City,” Earthquake Spectra, 16(3), 681-707.
Somerville, P.G., Smith, N.F., Graves, R.W., and Abrahamson, N.A. (1997). “Modification of empirical strong ground motion attenuation relations to include the amplitude and duration effects of rupture directivity,” Seism. Res. Letters, 68(1), 199-222.
Spudich, P., Hellweg, M. and Lee, W.H.K. (1996). “Directional topographic site response at Tarzana observed in aftershocks of the 1994 Northridge, California, Earthquake: Implications for mainshock motions,” Bull. Seism. Soc. Am., 86(1B), S139-S208.
Uniform Building Code, 1997 edition. (1997). International Conference of Building Officials, Whittier, CA.
Vucetic, M. and Dobry, R. (1991). “Effect of soil plasticity on cyclic response,” J. Geotech. Engrg., ASCE, 117(1), 89-107.
Youngs, R.R. (1993). “Soil amplification and vertical to horizontal ratios for analysis of strong motion data from active tectonic regions,” Appendix 2C in Guidelines for Determining Design Basis Ground Motions, Vol. 2, Electrical Power Research Institute, Report No. TR-102293.
Youngs, R.R., Abrahamson, N.A., Makdisi, F., and Sadigh, K. (1995). “Magnitude dependent dispersion in peak ground acceleration,” Bull. Seism. Soc. Am., 85, 1161-1176.
22
SMIP2000 Seminar Proceedings