Embed Size (px)
Citation preview
GROUND-BASED IMAGE AND DATA ACQUISITION SYSTEMS FOR ROADWAY INVENTORIES IN NEW ENGLAND
A SYNTHESIS OF HIGHWAY PRACTICE
Jason DeGray, Research Assistant Kathleen L. Hancock, PE, PhD., Associate Professor
Prepared for The New England Transportation Consortium
August 2002 NETCR 30 Project No. 00-1
This report, prepared in cooperation with the New England Transportation Consortium, does not constitute a standard, specification, or regulation. The contents of this report reflect the views of the authors who are responsible for the facts and the accuracy of the data presented herein. The contents do not necessarily reflect the views of the New England Transportation Consortium or the Federal Highway Administration.

Technical Report Documentation Page1. Report No. 2. Government Accession No. 3. Recipient’s Catalog No.
NETCR 30 N/A N/A4. Title and Subtitle 5. Report Date
August 20026. Performing Organization Code
GROUND-BASED IMAGE AND DATA ACQUISITION SYSTEMS
FOR ROADWAY INVENTORIES IN NEW ENGLANDA SYNTHESIS OF HIGHWAY PRACTICE N/A
7. Author(s) 8. Performing Organization Report No.
Jason DeGrayKathleen Hancock, PE, PhD
NETCR 30
9. Performing Organization Name and Address 10. Work Unit No. (TRAIS)
N/A11. Contract or Grant No.
University of MassachusettsTransportation Center214 Marston HallAmherst, MA 01003 N/A
12. Sponsoring Agency Name and Address 13. Type of Report and Period Covered
Final
14. Sponsoring Agency Code
New England Transportation Consortium179 Middle TurnpikeUniversity of Connecticut, U-202Storrs, CT 06269-5202
NETC 00-1 A study conducted in cooperation with the US DOT
15. Supplementary Notes
N/A16. Abstract
Across New England, the use of ground-based imaging technologies ranges from very sophisticated, to very simple, to not used at all. The primary objective of this project is to quantify and summarize the use of ground-based imagery in the six New England states and to provide an overview of the benefits of ground-based imaging technologies. A secondary objective is to determine what kind of linkage exists between roadway databases and GIS systems across the New England states and provide information to the states about the potential benefits of linking these tools.17. Key Words 18. Distribution Statement
Ground-based imagery, videolog, data acquisition, roadway inventories, GIS
No restrictions. This document is available through the National Technical Information Service, Springfield, Virginia 22161.
19. Security Classif. (Of this report) 20. Security Classif. (Of this page) 21. No. of Pages 22. Price
Unclassified Unclassified 189 N/A
Form DOT F 1700.7 (8-72) Reproduction of completed page authorized
ii

TABLE OF CONTENTS
PageLIST OF TABLES v
SUMMARY 1
CHAPTER 1 2 BACKGROUND 2
GOVERNMENT AIDS AND MANDATES 2 TECHNOLOGY 5 IMAGES 7 OTHER DATA 12
ISSUES AROUND GROUND-BASED IMAGING 13 INCORPORATING GROUND-BASED IMAGERY INTO GIS 18
METHODOLOGY 20
CHAPTER 2 25 OVERVIEW OF NEW ENGLAND PRACTICES 25 CONNECTICUT 26 MAINE 28 MASSACHUSETTS 30 NEW HAMPSHIRE 31 RHODE ISLAND 31 VERMONT 32
CHAPTER 3 33 STATE OF THE PRACTICE OF GROUND-BASED IMAGERY AND DATA COLLECTION IN NEW ENGLAND 33
ROADWAY INVENTORIES 33 IMAGE ACQUISITION 36 PROCESSING, STORAGE AND DISTRIBUTION 40 SUMMARY 42
CHAPTER 4 44 USING GIS 44 SUMMARY 53
CHAPTER 5 54 GROUND-BASED IMAGERY AND DATA COLLECTION FLORIDA 54 ARKANSAS 56 IOWA 57 OHIO 57 TEXAS 58 OTHER STATES 58 SUMMARY 58
CHAPTER 6 60 CONCLUSIONS 60
REFERENCES 65
ACKNOWLEDGMENTS 67
iii

iv
APPENDIX A- STATE TRANSPORTATION AGENCY SURVEY
APPENDIX B- GIS AGENCY SURVEY
APPENDIX C- MAINE AUTOMATED SHIM ANALYSIS PROGRAM USER’S GUIDE
APPENDIX D- NEW HAMPSHIRE MANUAL OF INSTRUCTIONS FOR ROAD INVENTORY
APPENDIX E- CONNECTICUT TRANSPORTATION INSTITUTE SUMMARY TABLES OF OTHER TRANSPORTATION AGENCIES
APPENDIX F- CONTACTS AND SYSTEM PROVIDERS

v
LIST OF TABLES
PageTABLE 1- ADVANTAGES AND DISADVANTAGES OF MAJOR
MEANS OF INVENTORY DATA COLLECTION 18
TABLE 2- ROADWAY IMAGES, INVENTORY ELEMENTS AND REFERENCING SYSTEMS 22
TABLE 3- GENERAL NEW ENGLAND CHARACTERISTICS 25
TABLE 4- ROADWAY GEOMETRY/FEATURES EXTRACTED FROM IMAGERY 34
TABLE 5- DATA COLEECTED AND ASSOCIATED ACQUISITION DISTANCE INTERVALS 35
TABLE 6- INFORMATION PRODUCED FROM THE CAPTURED DATA 36
TABLE 7- APPROXIMATE CENTERLINE MILES LOGGED 37
TABLE 8- MEDIUM EMPLOYED FOR IMAGE STORAGE 37
TABLE 9- ROADWAY VIEWS RECORDED 38
TABLE 10- EXTENT OF WHICH IMAGERY IS CAPTURED 39
TABLE 11- DISTANCE INTERVAL BETWEEN IMAGE ACQUISITION 39
TABLE 12- IMAGE FILTERING 40
TABLE 13- DIGITAL IMAGE STORAGE CHARCTERISTICS 41
TABLE 14- DIGITAL IMAGE STORAGE CHARCTERISTICS 42
TABLE 15- GIS SYSTEMS 45
TABLE 16- FORMS OF SPATIAL LOCATION REFERENCING 46
TABLE 17- WAREHOUSING TECHNIQUES 47
TABLE 18- TRANSPORTATION DATA WITHIN THE GIS 48
TABLE 19- DISTANCE INTERVAL BETWEEN DATA POINTS AND DATA UPDATE CHARACTERISTICS 49
TABLE 20- DATA ORIGIN 50
TABLE 21- VIDEOLOG USAGE 51
TABLE 22- MEANS OF ROADWAY DIGITATION 52
TABLE 23- EXTERNAL DISTRIBUTION 52

GROUND-BASED IMAGE AND ROADWAY DATA ACQUISITION IN NEW ENGLAND
SUMMARY Transportation is a broad and important subject; data required by engineers, planners, and field workers cover many different topics. State transportation agencies, therefore, generally require one or more maintainable databases of roadway data. These databases range from very basic to exceptionally intricate and include information from physical attributes of the roadway (termed “roadway inventories”), to collision records, signal timings, and utility data, among others. In many cases, data are collected and maintained by different groups within the transportation community. For example, the police may maintain collision records, while traffic characteristics are maintained by a transportation-operations agency. Many data sets may be acquired from ground-based imagery, a technology commonly known as videologging.
A videolog is the result of recording continuous images of a roadway. From this video, roadway inventories and data such as centerline location, signs, guardrails, and geometric road characteristics can be collected. Along with the video, other data are often collected simultaneously using other collection equipment and techniques. These data include, but are not limited to, chainage, pavement conditions, vehicle attitude, and GPS coordinates.
Across New England, the use of ground-based imaging technologies ranges from very sophisticated, to very simple, to not used at all. The primary objective of this project is to quantify and summarize the use of ground-based imagery in the six New England states and to provide an overview of the benefits of ground-based imaging technologies.
Data collected in the ground-based imaging process are also potentially very useful in Geographic Information Systems (GIS). These systems store and manage geo-spatially referenced information and provide rapid access to many users. GIS can act as a database manager and analysis tool for the transportation data collected during the imaging process.
A secondary objective of this project is to determine what kind of linkage exists between roadway databases and GIS systems across the New England states and provide information to the states about the potential benefits of linking these tools.

2
CHAPTER 1
INTRODUCTION
Background
Government Aid and Mandates
The need for collection of highway data was first recognized in the United States
in 1892 with the Good Roads Movement. Although this bill did not pass, it was the first
attempt to require some level of examination of the condition of the nation’s roadways.
The following year, a bill passed that allowed the Secretary of Agriculture to "make
inquiry regarding public roads" and "make investigation for a better system of roads"
(Ritter 1994). This bill also provided $10,000 towards the development of the Office of
Road Inquiry (ORI), the predecessor of today’s Federal Highway Administration. This
office was strictly limited to investigating and disseminating information and was not
tasked to develop a formal system of organization for maintaining roadways.
In 1904, the ORI, renamed the Office of Public Roads Inquiry (OPR), attempted
to inventory all roads outside of major cities in the United States. This was the largest
undertaking of this office at that time. The inventory mainly focused on roadway laws,
expenditures, and revenue streams. The only physical characteristic of the road collected
at that time was mileage classified by surface type. Between 1893 and 1916, some states
formed their own Departments of Transportation and took over the data collection. The
ORI/OPR continued to collect roadway data in the remaining states.
The 1916 Federal Aid Road Act formulated a method of federally funding states
for building and maintaining roadways. This act also required that each state form a
department of transportation.

3
In 1920 the Bureau of Public Roads (BPR), formally the ORI/OPR, surveyed all
roads and began a roadway classification process, determining what roads were in the
greatest need of improvement and developing a system to allocate funds towards the
maintenance of these roadways.
The 1934 Hayden-Cartwright Act denied federal funds to any state that diverted
federal highway revenues for other purposes. Also included in this act was a proviso that
permitted states to use 1½ percent of their matched federal-aid towards planning for
future work. This type of investigation included the collection and analysis of data to be
used in the planning process. The accord between the states and the BPR specifically
allowed for three types of planning surveys: road inventory, traffic, and financial
investments. This marks the beginning of the federal government specifically funding
states in the roadway inventory and data collection process. These data items included:
width, type and condition of the roadway, and location of all farms, residences, schools,
businesses, industrial plants, hospitals, and any other facilities that the roads must serve.
The Federal Highway Act of 1944, the resulting Federal-Aid Highway Act of
1956, and the Highway Revenue Act of 1956 greatly increased the number of highways
that the nation had to construct and maintain. Consequently these acts increased the
amount of funding provided for inventory and data collection.
In 1965, the now Federal Highway Administration was mandated by congress to
report biennially on the condition, performance, and future investment needs of the
nation’s highway system. This requirement called for the gathering of a very large
workforce in each state to collect and maintain the nation’s roadway data.
In 1978, the Highway Performance Monitoring System (HPMS) was initiated.
This system is currently used by the federal government to acquire roadway inventory

4
and perform data collection. HPMS acts as a large database of roadway information for
the nation’s highway system. Data from the HPMS is used in state-specific formulas for
the apportionment of Federal-Aid funds. HPMS specifies the minimum data collection
requirement for states, such as pavement roughness data and lane and shoulder width.
Many states collect additional data for their own programs (Ritter 1994).
Over time, some roadway characteristics were identified as so crucial to the
performance of roadways that specific monitoring systems were developed. Two such
areas are bridge and structural data and pavement data.
The 1968 Federal Highway Act established the National Bridge Inspection
Program (NBIP), which mandates states to periodically inventory and inspect all
structures on public roads. Bridge inspection was further stressed in the 1995 Intermodal
Surface Transportation Efficiency Act (ISTEA) by the formation of a Bridge
Management System (Phares, Washer and Moore 1999).
Pavement management systems were first recognized as a valuable tool in the
1956 to 1960 AASHO road test. These tests were the first attempt to develop a system
that rates pavement condition regardless of pavement type. A pavement management
system was another management system specified by ISTEA.
Pavement is typically monitored in two areas: physical attributes and a
measurement of rider comfort. Physical attributes include the typical pavement distress
characteristics of rutting (physical displacement of the pavement due to repetitive loads
of vehicles), faulting (potholes), cracking (physical cracks), patching (seals for cracks or
fillers for potholes), and raveling (the physical disintegration of the pavement from the
surface downward) (Sime 1984). Measurement of rider comfort started as a subjective
value assigned to the roadway based upon a user’s comfort while traveling along that

5
road compared to all other roads. Soon, professionals realized that surface roughness is a
good indicator of rider comfort. By measuring surface roughness in a quantitative way,
the subjectivity of human discretion is eliminated. This was the basis for establishing the
International Roughness Index (IRI).
The IRI is the surface roughness evaluation system of choice, chosen more for the
sake of uniformity than for its advantages over other systems. The IRI measures
roughness in m/km with a value of zero being perfectly flat. Conceivably, IRI has no
upper limit, but a road with a value of 8 m/km is considered to be almost impassable.
The Federal Government has required states to report the IRI values of its roads since
1990 as part of the HPMS (Sayers and Karamihas 1997).
In 1980, only 5 states had anything resembling a pavement management system,
now all 50 states have some form of system. The mandate put forth by ISTEA to
specifically develop Pavement Management Systems has since been removed. However,
policy statements by the FHWA and state transportation agencies have clarified that
pavement management is still a part of HPMS and is thus still required (Finn 1998).
Technology
The earliest forms of roadway inventory and data collection, beginning in the mid
1890’s, relied solely on manual collection. This method was loosely organized and
inefficient. Only rudimentary data, such as mileage, lane width, and road conditions
were collected by the federal government or state transportation agencies. All other
necessary data were left to be collected by local officials on a project-by-project basis.
This type of data collection was termed a “windshield survey,” meaning that the
appropriate data were collected as the recorder drove down a road noting any significant

6
data and their location relative to the road’s mileage. This was a time consuming and
tiresome process. The data were often stored on note cards arranged by mileage along
the roadway. Any management and manipulation of these data were done by hand.
Often, roadway data were kept by the agency that collected it and not distributed
elsewhere, requiring the user to locate and go to the data since distribution was tedious.
As the nation’s roadway network continued to grow, a larger and larger workforce
was needed to collect the data. Over the course of the first half-century of the 1900’s,
roadway planners and designers added more sophisticated to their trade. As a result
additional data points pertaining to the roadway’s geometric features were required to be
maintained. Not only were there more roads to collect data for, but also more data
needed to be collected. Collectors realized that obtaining and maintaining roadway data
through the “windshield survey” was very inefficient. Out-of-date, incorrect, and poorly
managed data became the result of overworked personal and a rapidly growing interstate
highway system.
Prior to the 1960’s, the cost involved in roadway inventory and data collection
was strictly limited to the cost of employing the data collectors and maintainers. New
technologies, developed in the 1960’s, began to allow for better systems of collecting,
storing, and manipulating roadway data. Mainframe computers allowed for more
efficient data warehousing and distribution. Policy makers recognized the potential
benefits of using these new technologies and adjusted the funding to include them. As
computers became more sophisticated into the 1970’s, they were used to process roadway
data to produce profile and curvature data (Ritter 1994).

7
Images
Also in the 1970’s, the value of taking images of roadways was recognized.
Many transportation agencies began using 35-millimeter cameras on a van with the
shutter of the camera being triggered by the van’s drive train. The technical term for this
practice became known as ground-based imaging, but was commonly referred to as
photologs, and later, videologs. These systems took images of the roadway at constant
intervals along the road. The film could then be viewed with a special viewer that
allowed the user to scan forwards or backwards at an adjustable rate. This allowed for
roadway inventories and data to be extracted in an office instead of the field. By moving
most of the work into the office, the hazards to field collection personal were minimized.
This new practice was also more efficient. More roads could be covered in less time,
allowing for more up-to-date data. Photologs were also valuable from a distribution
perspective. The film could be reproduced and sent to any desired location as long as
that location had the appropriate viewer.
These systems had shortcomings. 35 mm photologs have poor image quality, and
copying the film is time consuming. The vans used to collect the images could not travel
faster than 45 mph, considerably slower than some operating highway speeds. Linear
referencing problems existed because the images were recorded at set intervals during the
actual vehicle miles traveled. If this mileage was different from the state defined
mileposts, the collector did not know where the image for a stretch of road was physically
located. The image retrieval process was also tedious. First, storage density for 35mm
film is low. Literally, hundreds to thousands of reels of film were required to photolog an
entire state. Then, to locate a specific section of road after the correct reel was located,

8
the user had to scan through up to 100 feet of film to identify the desired location (Orth
and Singh 1994).
In the early 1980’s, video tape recorders (VHS) became a common format for
recording images. This analog videotape offers the appearance of continuous images.
Typical 35mm camera photolog systems took an image of the road approximately every
52.8 ft. Common videotape records 30 separate images every second. If a van carrying a
video tape recorder is traveling at 45 mph, an image is taken every 2.2 ft. The increase in
precision of the videotape system is obvious. The VHS, and later SVHS (higher
recording quality), formats became very common in all types of video applications. As a
result, recorders and players of these formats became mass-produced and the hardware
price was very cost efficient.
Analog videotape proved valuable in pavement management systems. The rapid
image acquisition allowed for a high enough level of scrutiny that pavement could
effectively be evaluated from these images. Now, not only could the fieldwork of
roadway inventorying be eliminated, but so could a large portion of fieldwork required
for pavement management. Video also allowed for more rapid and effective pavement
maintenance by being able to record and evaluate more pavement more quickly. With
the advent of videotape, the term photolog matured to videolog.
Although analog videotape does not improve the accessibility of the images over
35 mm systems, the number of tapes needed to videolog an entire state is much lower
than that of the 35mm reels. It would take approximately 100 tapes to record the entire
state of Maine. However, once the correct tape is located, scanning through the tape to
reach the correct image takes longer. Videotape also has lower image quality than 35mm
film. On the other hand, analog videotapes can be reproduced easier and cheaper than 35

9
mm film, but whenever a tape is reproduced, the analog signal must be amplified. This
process creates “noise” that degrades the quality (Anderson).
In the mid 1980’s, Connecticut pioneered a laser videodisc system. In this
system, the images from a 35 mm camera system are transferred onto a laser disc. These
laser discs can then be viewed on a computer with the appropriate player and software.
This system greatly improves accessibility. The number of laserdiscs required to store
images for a state is much lower than that of any tape system. One laser disc can contain
108,300 photolog images or the equivalent of 80 35mm reels. This reduces the number
of storage devices needed for videologs of a state from triple to double digits. Laser discs
are better for accessibility because of their rapid access capabilities. A user need only
input some form of linear referencing and the viewing software will almost instantly
display the appropriate image. Also, duplicating laser discs does not diminish the quality
of the image.
A limiting factor with a laser disc system is that it does nothing to improve the
image quality of 35 mm film. It simply provides the user with increased accessibility to
the same images. It also greatly increases the direct processing cost of the images. To
transfer them onto a laser disc requires capitol investments in recording and viewing
hardware, investments that were quite sizeable in the mid 1980’s. It complements a good
linear referencing system, but does not solve the linear referencing problems of accuracy
(Hudson and Seitz 1996).
Technologies that were developed over the past two decades have given way to
the current generation of ground-based imaging. The newer systems combine the
benefits of videotape and laser disc systems while eliminating many of their drawbacks.
Digital videotape eliminates the “noise” problem of analog tapes. Digital videotape uses

10
binary numbers to represent each pixel of the image. It is much more efficient to copy
film in this format, since binary numbers are not as susceptible to the loss that greatly
effects analog signals. This is better for distribution because now the images can be
copied multiple times without any degradation of quality. However, digital images
require large amounts of storage space. The average video of 30 frames per second
requires 27 megabytes of memory per second. An average audio file requires one fifth of
a megabyte per second. Video images were first stored on laser discs and digital
videotape, then CDs, and most recently DVDs. DVDs offer about 1.5 times the storage
space of laser discs. Connecticut can supply video of all of its state-maintained highways
on 20 DVDs. These higher-volume storage devices use the same retrieval methods as
laser discs.
In the late 1980’s, it became economically feasible to capture high quality freeze
frame or “still” video images. This greatly enhanced the quality of the video used in
roadway inventory and data collection. After the video was captured, it would be
digitized and stored on digital tape or disc. This required an investment in hardware that
would perform the digitization. Digital cameras have eliminated this need. With these
cameras, the images are captured and stored directly as a digital computer file. These
files can then be directly transferred to a laser disc, CD, or DVD. The rapid expansion of
computer technology in the 1990’s resulted in computers with enough storage space to
contain all of the video images directly on a hard drive. The state of Connecticut
currently maintains ten 40 GIG hard drives that contain an up-to-date account of all of the
state’s roadways. Currently, roadway images can be captured directly onto a hard drive
onboard the collection van during the collection process. The van then returns to its base
at the end of the day and downloads the newly collected data into the main storage

11
location. If the roadway has been videologged before, the new files can overwrite the
older files. Having all of the video images stored in one location provides advantages for
access and distribution. The central storage site can become the location for a network
that supplies video images to anyone who can access the network. The advantages to
storing and distributing the data in this way is that the production cost of the discs is
eliminated and every time the data are updated, new discs need not be issued. This
allows users immediate access to the most up-to-date data available. Having all of the
data in one centralized location also means that maintenance of the data can be more
easily monitored.
Drawbacks to this new system are that it is susceptible to the problems of any
network, the more users on the network, the slower the retrieval and viewing process
becomes. The centralized location means that if anything happens to the network servers,
the system may be unusable until the problem is fixed. The size of the video files is still
an issue and the investment for computers is still costly. Compression strategies have
been used to reduce file sizes. These strategies eliminate data behind repetitive display.
In other words, if a pixel in a video is blue for 90 consecutive frames, compression
strategies can eliminate the data necessary to display the pixel in frames 2 thru 90.
Instead, the program is instructed to display the same color that it was last told until new
instructions come along. The current compression strategy of choice in ground-based
imaging is JPEG which can reduce a file up to 1/20th of its original size (Anderson).
The final issue is security. By having all of the data on a server, they can be
accessible to outside manipulation. This requires that the servers be protected with up-to-
date firewall technology.

12
The videolog process moved the inventorying practice from the field into the
office. Until recently, inventories were manually extracted from the video. Technology
has advanced now to the development of image processing software. At the present stage
of development, this type of software allows users to semi-automatically acquire the
physical dimensions of an object from the image where the image is manually identified
and on-line tools are used to measure necessary parameters. This type of software may
lead to the future possibility of completely automating inventory collection where the
software would recognize pre-defined patterns, thus identifying specified objects. These
objects would then be automatically inventoried without user input.
Other Data
The videologging process usually takes place on a data collection vehicle. Many
states use an Automated Roadway Analyzer, ARAN, which is a proprietary term of
Roadware Group Inc. Along with images, equipment on ARAN vehicles collect other
data. These include data that are required by the federal government in its pavement
management, bridge management, and highway performance monitoring systems.
Technologies in this data collection have advanced over the years as well. Surface
roughness and texture are now monitored with sophisticated laser systems that measure
the pavement surface. Also, pavement condition can be monitored with more advanced
methods of rutting and roughness measurements. Advanced gyroscopes provide accurate
roll, yaw, and pitch measurements. The availability of GPS coordinates provides for a
referencing system that is more accurate than any of its predecessors. These data can be
used to produce a road’s horizontal/vertical curvature and longitudinal profile.
Combining the roadway curvatures and profiles with GPS coordinates can quickly
13
produce accurate centerline maps of roadways. This information is extremely valuable
for use in Geographic Information Systems, which will be discussed later.
ISSUES AROUND GROUND-BASED IMAGING
Many issues exist in designing and implementing ground-based imaging and data
collection systems for roadway inventory and data collection.
State specific systems- First, the imaging and data collection process varies from
state to state with no one method being a best practice. For this reason each state should
assess what it requires from an inventory and data collection system and then design the
system accordingly, as opposed to implementing a system designed for another state.
Acceptance of image and data collection systems- Many states still rely on a
labor-intensive method of manual roadway inventory and data collection. The first issue
becomes why more states are not using ground-based imaging. Some states may resist
converting to ground-based imaging because they are comfortable with an existing
system and do not want to change. Some states use ground-based images in their
simplest form. For states to expand their capabilities, they should be educated about the
benefits of using more developed systems. Ground-based imaging is a technology-
dependant tool. As the technology improves, so does the general efficiency of the
system. The primary problem cited was lack of adequate and consistent funding, as
identified from a 42-state survey about choosing a roadway inventory and data collection
system. Convincing policy makers to procure these systems is difficult because of a lack
of tangible results that the public can see (Hummer, Schefler, Khattak, and Karimi 1999).
Once a ground-based imaging system is in place, additional issues arise, including
what to record and what information is to be extracted from the imagery.

14
Level of implementation- Is it important to record roads of all jurisdictions or only
those directly maintained by the state’s transportation agency? Ground-based imaging
can be an effective tool at the local level. Many town department of public works could
benefit from the reduction in labor and increased efficiency that ground-based imaging
systems offer but cannot afford the initial capital investment. The state has to determine
if recording and analyzing local roads is a valuable service and how much funding it can
afford to assist individual towns in the process.
Roadway features- What information is to be extracted from videologs? It is
possible to inventory signs, signals, lane width, clearance, and intersecting roads, to name
just a few items. Almost anything that is visible along the roadway can be inventoried.
Image acquisition- What views are required and how are the images
processed/edited? While a driver’s eye view is essential, other views such a right, left,
and rear views can assist in the roadway inventory collection process by providing other
angles from which to see the inventory item in case it is obstructed, and to pick out items
that may not be apparent in only a front view. The distance interval between image
acquisitions is important to balance the cost of additional images with the benefit of more
information. For example, should there be 10 or 5 meters between each frame? A
smaller interval means more information must be stored and thus more videotape or disk
space is required. If the distance interval between frames is too large, data items might
be lost. Therefore, a balance must be struck between the cost and the quantity of the data.
Other related decisions include how often a road is recorded, how many passes are made
on a road, and at what interval images are edited/processed.
Pavement images- Filming the pavement surface is valuable in pavement
evaluation. Many states use visual-based rating techniques to evaluate the status of

15
pavements. This type of technique assigns a value based on the number and type of
cracks within a given section of roadway and are subject to the opinions of personnel
performing the investigation. When rating the pavement in the field, the danger to
personnel is high due to traffic exposure. Implementing an automated pavement rating
system will minimize problems such as safety hazards to field personnel, subjectivity of
observations, and time constraints associated with manual methods. Having the
pavement surface image also allows more people to review the same pavement section
and thus increases the effectiveness of the evaluation procedure.
The state may have to evaluate whether it wants to perform the collection process
in house or if it should contract this out to another agency or private contractor.
Storage media- Another important issue is the medium on which the images are
stored. 35mm film used to be the medium of choice. However this proved to be
inefficient because of the high number of rolls of film required to record an entire state,
the high duplication cost, limited access, and tedious process of viewing specific
locations on the film. Videotape offers advantages in higher storage capacity, ease of
duplication, and better access because the tapes can be played on any common VCR.
Viewing specific locations on the tape is still a monotonous process due the necessity of
fast forwarding and rewinding the tape to get to the desired location. Storing the images
as digital image files seems to be the most effective and efficient storage process. These
files can be stored on CD, laser disk, DVD, and/or hard drive. Digital images offer the
highest level of efficiency in storage, duplication, access, and viewing. Duplication of
files is relatively easy since files stored on a hard drive can simply be copied to another
hard drive. CD reproduction or “burning” is now a process that can be completed on a
PC while DVD burning is still done professionally and costs approximately $150 a copy,

16
although DVD writers are becoming a cost effective alternative. Locating and viewing
specific images is easier because the user can input a linear referencing value and
specifically designed software will rapidly display the appropriate image. Many states
require that the videologs be stored on more than one type of medium to accommodate
users with limited access to the appropriate technologies.
Additional roadway data- Along with the actual videologging, many state
agencies simultaneously collect other data. These data include, but are not limited to,
surface roughness, grade, GPS coordinates, gyroscope measurements of roll, yaw and
pitch, transverse profile measurements, and skid number. The technology and hardware
required to collect these data vary in sophistication. The state has to determine what data
are critical and economically feasible to collect and what distance interval between data
points is required. Collecting all of these data in one pass is timely and efficient.
However, the extensive amount of technologies in the van requires that the data
collection personnel onboard be highly qualified and aware of how to operate all of the
systems properly.
Distribution- With the easy duplication of digital image files, the state can make
this information available both internally and externally. On one hand, the belief is that
all of this information should be made readily available for everyone. On the other,
issues of security and liability may limit the amount agencies are willing to release.
Connecticut was one of the first states to stress the necessity of making the videologs
readily available to many of its employs. They started with photolog videodisc retrieval
stations (PLV’s) and evolved into using PC’s loaded with DigitalHIWAY software
accessing images by DVD or over a network (Hudson and Seitz 1996). Today over one
hundred PC’s in Connecticut have access to the videologs and the number continues to

17
rise on a monthly basis. Some states make CDs or DVDs available to outside individuals
and companies, from in-route navigation companies to law practices. Many states are
weary of providing videolog information to outside parties for fear that the information
could be used inappropriately. Each state needs to establish what level of availability is
appropriate to its goals and purpose.
Other roadway inventory and data collection systems- In addition to ground-
based imaging, other sophisticated techniques are currently being used in roadway
inventory collection. These include “backpack-based” data collection and satellite data
collection. Backpack-based data collection is efficient in areas where the inventory
elements are spaced close together. It requires a relatively low initial cost. During this
method the data collection staff walks from one inventory item to the next. Within the
backpack are a location-referencing device, often a GPS receiver, which locates the item
from satellite signals, and a storage device such as a laptop or pen-based computer to
store descriptive data about the inventory item. The drawbacks of backpack-based data
collection are that it offers little choice in technologies, is physically demanding, and data
collection generally stops for adverse weather conditions.
Satellites or airborne photography provide high-resolution images of the earth’s
surface. The images are then processed manually using image-processing software to
collect the necessary inventory items. These systems are used quite regularly to produce
centerline maps of the roadway networks used in GIS. Aerial photos provide a potential
for automation of inventory collection. No physical collection manpower is required and
the images inexpensively cover a large area. The disadvantages of these photos are that
the cost depends on the coverage of the image not the roadway network, adverse weather
affects the image quality, and the agency has no control over the collection schedule.

18
Because many items cannot be identified from the air, current airborne or satellite
imagery will never replace ground-based imagery for certain inventory activities.
Combinations of these systems may offer the most productive and efficient method of
inventory and data collection. Table 1 summarizes the advantages and disadvantages of
the different methods of roadway inventory and data collection.
TABLE 1
ADVANTAGES AND DISADVANTAGES OF MAJOR MEANS OF INVENTORY DATA COLLECTION (Hummer, Schefler, Khattak, and Karimi 1999)Means Relative Advantages Relative Disadvantages
Can collect data at highway speeds Primarily uses crew of two collectors High data accuracy possible Skilled crew required for operation
Data collection slowed by several conditions Videolog
Much choice in on-board technologies Requires large initial investment if buying
Lower initial cost Little choice in technologies Physically demanding Backpack Efficient in areas with multiple elements Collection stops in adverse weather
Potential for high level of automation for inventory extraction
Cost depends on size of image, not on the size of the roadway network
No collection crew required Cannot collect many inventory elements Automated processing algorithms incomplete Adverse weather affects image quality
Satellite
Covers large area inexpensively No control over collection schedule
Videologging and other automated techniques are being implemented by state
transportation agencies. However, according to a 1999 report, 75 percent of 42 state
transportation agencies interviewed still use non-automated methods of inventory
collection (Hummer, Schefler, Khattak, and Karimi 1999).
INCORPORATING GROUND-BASED IMAGERY INTO GIS
Geographic Information Systems (GIS) have rapidly become an important tool in
transportation, primarily to store, manage, analyze, and display pertinent characteristics at

19
a specific geographic location. These characteristics can be almost anything from crime
rate to environmental classification to traffic level.
GIS provides a unique opportunity for transportation officials to effectively
manage infrastructures and roadway inventories. Data associated with these systems are,
by their nature, spatially referenced. Instead of personnel having to go into the field to
take measurements, a time consuming process, GIS systems allow transportation officials
to point to an item within the GIS and get any relevant information such as condition,
height, or size. Ground-based images containing the inventory item and its surroundings
can easily be incorporated into this environment.
When collecting ground-based images, a spatial reference is collected. Spatial
referencing is a method of locating any item within that reference system. This can be by
precise latitude and longitude, state plane coordinates, state-defined mileposts, chainage,
or another system. These references are needed for integrating information within a GIS.
The issues associated with integrating image data into GIS are presented in the following
sections.
GIS software- The first issue is the GIS system that the state predominantly uses.
Every GIS software package is unique. When recording ground-based images, collection
of spatially referenced data that allows for the easiest transfer into the most commonly
used GIS system(s) will eliminate or minimize integration at a later date.
Data warehousing- Next is the location where the data are stored. Many GIS
agencies are moving toward a centralized warehouse. Some states rely on distributed and
local warehousing.
Maintaining data within the GIS - The GIS agency has to determine what data
they want to obtain and maintain on their system that ground-based imaging and data

20
collection could provide. If cost, storage, and security are not issues, almost all data
collected from the ARAN vehicle could be included. Currently, many different
technologies are used to perform the roadway inventory and digitization processes for
GIS. The state should perform an analysis to see if changing their techniques is
economically feasible or necessary.
METHODOLOGY
The purpose of this project is to provide a state-of-the-practice of ground-based
image and data collection in the six New England states. A state-of-the-practice report is
not only a summary of the current practices being performed by each state, but is also a
summary of potential technologies and applications associated with ground-based image
and data collection. The latter can serve to assist states in deciding if and how to upgrade
their system.
State-specific information was gathered by surveying each state and is described
in task 1 below. Information about potential technologies and applications of ground
based image and data collection was gathered through an extensive background search
that included the history of roadway inventories, pavement management techniques,
summaries of audio and digital video, GIS applications, and more as listed in the
reference section at the back of this report.
Six tasks are defined to perform this project (Hancock 2000).
•Task 1: Survey of Transportation Departments in New England- Survey all states by
questionnaire for current collection practices, including what, how, where, and when

21
efforts are focused. The questionnaire should provide information sufficient to execute
Tasks 2 through 4.
This survey is intended to gather information that will provide an overview of
each state’s roadway inventory and data collection techniques. The survey will call for
information regarding the use of ground-based images, highway features and attributes
collected, data confirmation practices, automation of inventory/data collection, and
database management and analysis. The surveys are to be sent to the primary contact in
each state’s transportation agency in charge of ground-based imaging or roadway
inventory and data collection. A copy of the surveys sent to each state is presented in
Appendix A. In addition to this survey another survey is to be designed that will inquire
about GIS practices in each state. The purpose of the second survey is to determine what
roadway information is being maintained by each GIS agency and if those agencies are
using data collected in the ground-based imaging process. A copy of the survey sent to
the GIS agencies is presented in Appendix B.
•Task 2: Road-Inventory Data Elements- Assemble a list of road-inventory data elements
and/or types of images collected by the states.
This task is designed to establish what roadway inventory items each state
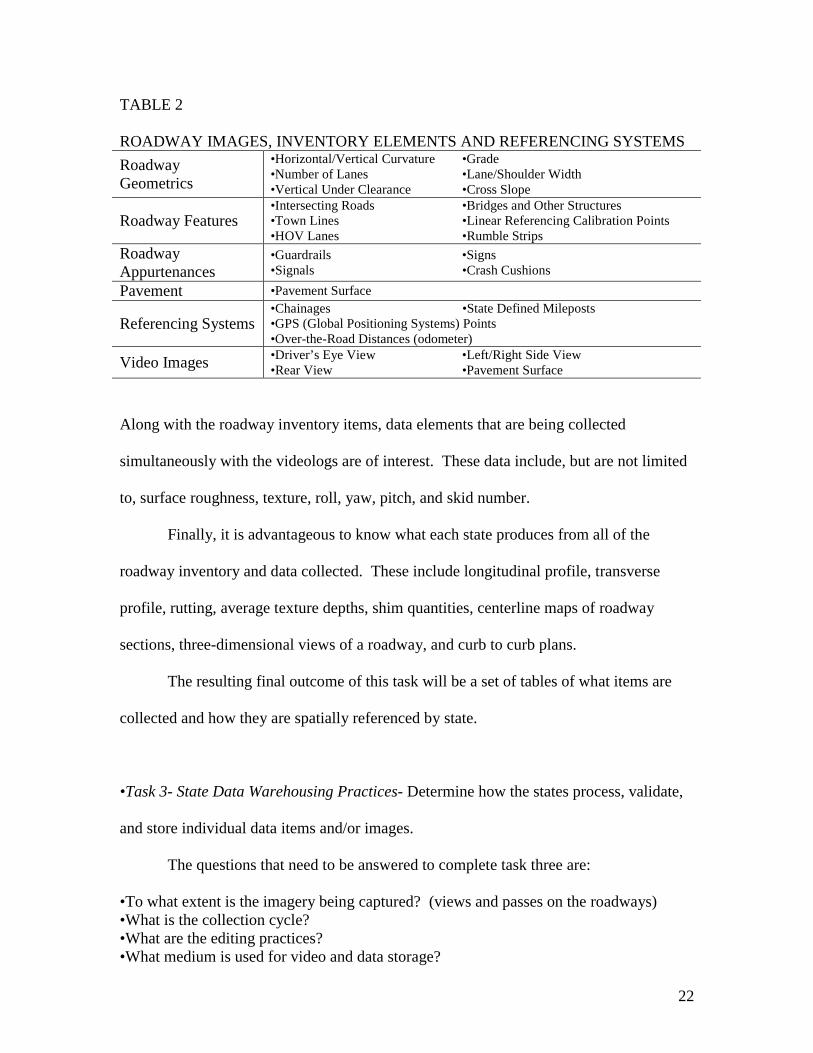
maintains that can be collected by use of ground-based imagery. Table 2 lists some of
the inventory elements and images that can be collected.
22
TABLE 2
ROADWAY IMAGES, INVENTORY ELEMENTS AND REFERENCING SYSTEMS
Roadway Geometrics
•Horizontal/Vertical Curvature •Grade •Number of Lanes •Lane/Shoulder Width •Vertical Under Clearance •Cross Slope
Roadway Features •Intersecting Roads •Bridges and Other Structures •Town Lines •Linear Referencing Calibration Points •HOV Lanes •Rumble Strips
Roadway Appurtenances
•Guardrails •Signs •Signals •Crash Cushions
Pavement •Pavement Surface
Referencing Systems •Chainages •State Defined Mileposts •GPS (Global Positioning Systems) Points •Over-the-Road Distances (odometer)
Video Images •Driver’s Eye View •Left/Right Side View •Rear View •Pavement Surface
Along with the roadway inventory items, data elements that are being collected
simultaneously with the videologs are of interest. These data include, but are not limited
to, surface roughness, texture, roll, yaw, pitch, and skid number.
Finally, it is advantageous to know what each state produces from all of the
roadway inventory and data collected. These include longitudinal profile, transverse
profile, rutting, average texture depths, shim quantities, centerline maps of roadway
sections, three-dimensional views of a roadway, and curb to curb plans.
The resulting final outcome of this task will be a set of tables of what items are
collected and how they are spatially referenced by state.
•Task 3- State Data Warehousing Practices- Determine how the states process, validate,
and store individual data items and/or images.
The questions that need to be answered to complete task three are:
•To what extent is the imagery being captured? (views and passes on the roadways) •What is the collection cycle? •What are the editing practices? •What medium is used for video and data storage?
23
The end product of this task will be a series of tables that answer the above questions by
state.
•Task 4: Data Distribution- Determine the method (stand-alone or network system) and
format (graphic or tabular-data; analog or digital images) employed to distribute
processed items to the end user.
The purpose of this task is to identify distribution practices for these data, both
internally and externally, of each state. These practices range from distributing the
images on videotape to users, to putting these images on a network accessible to multiple
users. The advantages and disadvantages of each distribution practice will be discussed.
Finally a table of distribution practices by state will be produced.
•Task 5: State Visits- Visit each state to augment, confirm, and detail tasks 1 through 4.
This task is intended to verify the information provided by the surveys and to
make the state contacts aware of the particular goals of this project. In addition, the visits
will provide a hands-on feel of the practices of each state. These visits will be conducted
with the appropriate data collection and GIS administers and anyone else identified by
the state that should be involved in the process.
•Task 6: Final Report- The information gathered in the first five tasks will then be
compiled into a final report that will provide a synthesis of practice as to the state of
ground-based image usage for roadway inventory and data collection in the six New
England states. This report will discuss issues pertaining to ground-based image usage

24
along with historical information, summaries of ground-based image usage in other states
outside of New England and future plans towards the advent of more advance activities.

25
CHAPTER 2
OVERVIEW OF NEW ENGLAND PRACTICES
All of the states in New England have a significant level of unity in the required
inventory and data elements that must be collected and maintained. There are, however,
distinct differences in the methods by which these elements are collected. This synthesis
provides an overview of what is being done in this region and is intended to provide each
state with the opportunity to learn about beneficial procedures from each other. Table 3
lists some general characteristics of each New England state for comparative purposes
(Weber 2001).
TABLE 3
GENERAL NEW ENGLAND CHARACTERISTICS
State Area (mi2) Approximate Population
Connecticut 5,544 3,400,000
Maine 35,387 1,270,000
Massachusetts 10,555 6,350,000
New Hampshire 8,969 1,240,000
Rhode Island 1,545 1,050,000
Vermont 9,615 610,000
Every New England state, with the exception of New Hampshire, conducts some
form of ground-based imaging for roadway inventory and data collection. The extent and
sophistication of this usage varies from nominal to extensive.

26
CONNECTICUT
Connecticut is a pioneer in ground-based imaging systems for roadway inventory
and data collection; many states look to it as a leader for implementing and managing
these systems.
Starting in 1980, Connecticut began to maintain a complete highway photolog.
This system consisted of a series of consecutive photographs of each state highway and
the surrounding environment. Along with the photographs, measurements of highway
geometrics and records of highway location, date, and time were kept. The entire 4,000-
mile state highway system was photologged at an interval of every 0.01 miles. This
corresponded to 800,000 frames of 35mm color film and 63 megabytes of data.
Responding to a Federal Highway Administration (FHWA) sponsored study to
develop pavement management systems (PMS), the Connecticut Department of
Transportation began using video laserdiscs in 1984. Prior to 1980, Connecticut had no
systematic method for pavement evaluation. Between 1980 and 1984, Connecticut
maintained an inventory of pavement data through intensive field evaluations. Pavement
was evaluated using a subjective but effective visual rating system, which later became
the WISECRACKS system. Laserdiscs were implemented to improve the efficiency,
accuracy, and safety of data collection for monitoring pavement condition. The entire
state highway system could be maintained on 670 100-ft reels of 35mm film, which were
then transferred to approximately 30 laserdiscs. The improved accessibility led to more
rapid evaluations and the pavement evaluation process was moved from the field to the
office, eliminating hazards to field collection personnel.
By the early 1990’s, Connecticut had a fully developed Photolog Laser
Videodisc-Based Pavement Rating System (PRS) in place. This system allowed the
photolog images to be evaluated by a trained user from an office. Some of the many

27
advantages of this system included the safe, controlled environment for evaluation,
unlimited re-rating, direct computer entry of distress data, and automated computer
analysis of the data.
Connecticut’s PRS relied on Photolog Laser Videodisc viewing stations (PLV).
These first viewing stations were costly and cumbersome by today’s standards. Many
different hardware and software items were required to drive the system. A typical
workstation included a PC, video monitor, graphics generator, graphics tablet, video
printer, and laser videodisc player. By 1993, Connecticut had 15 PLV stations.
The rapid improvement in computer technology in the 1990’s allowed these
viewing stations to become less and less complicated. In 1992, Connecticut began
converting its PLV stations to MINI-PLV’s. These new workstations condensed the
required hardware and resulted in the viewing station looking like a PC with an additional
laser videodisc player. The MINI-PLV moved all of the specialized hardware to
specialized internal components within a PC.
As viewing station technology advanced, so did the technology for acquiring and
distributing images. 35-mm film became analog videotape, which then went to digital
images that are stored directly onto hard drives. Laserdiscs evolved to CDs and then to
DVDs. Video imaging allowed for continuous image acquisition while CDs, and DVDs
allowed for higher volumes of storage.
The state of Connecticut soon realized that the videolog technology could be used
for other purposes. In 1988, ConnDOT started using videologs to collect bridge data,
which was expanded to the bridge management system that was mandated by ISTEA in
1991 when laser videodiscs were used to store bridge inspection photographs. Videologs
were soon used for many different functional areas including: safety analysis, project

28
development and design, highway-sign inventory, legal evidence, public hearings,
construction documentation, planning and inventory, and maintenance.
Currently Connecticut is at the forefront of videolog technology. The idea of a
PLV station has evolved to videologs being directly accessible through a PC. A software
package called DigitalHIWAY and a DVD drive are all that are needed to access the
videologs.
In addition to the distribution of DVDs, Connecticut has begun LAN (Local
Access Network) distribution. This LAN is a network of computers that allows for the
distribution of images and software files to licensed users across the state. The data are
stored and maintained on one central server with access granted to users. This totally
eliminates the need to distribute the images and additional data on a separate storage
device. All costs involved with processing and distributing could virtually be eliminated.
In the first year of using the LAN, Connecticut experienced a 300% increase in use of the
image and data. At the time of this report, Connecticut has 101 PCs running
DigitalHIWAY with that number continuing to rise monthly.
The data acquired in the videologging process have also been used to produce a
centerline layer of the state’s roadways. This information has been used to update
existing centerline files for use by GIS agencies. The system is also currently being used
to inventory ramp data for the GIS.
MAINE
Maine has a mature ground-based image and data collection system. The system
has been developed primarily to support the pavement management system since it was
initiated in 1989. Images of the driver’s eye view, left side, right side and pavement

29
surface are collected. Pavement surface images are used with other data to assign a
Pavement Condition Rating (PCR).
In Maine, as with many northern states, rutting is a problem due to the many
freeze-thaw cycles and the numerous loads the pavement has to endure. Rutting is the
distortion of the pavement from the original cross section. It is often associated with
grooves in the pavement corresponding to tire paths of vehicles. Freeze-thaw cycles
magnify the rutting problem with the distortion occurring in a chaotic manner. As rutting
becomes sever, roads have to be repaired which requires that the ruts are filled to return
the road to its original cross slope. Initially, crude volume estimates were performed to
determine how much filler, referred to as shim, was needed to correct the road profile.
Often these estimates were below the actual amount required, resulting in projects being
over budget.
Early in the use of its data collection vehicle, Maine recognized that using its
transverse profiling capabilities could assist in making more accurate shim calculations.
The profiling is accomplished using a 12-foot bar attached horizontally on the front of the
ARAN at 18 inches above the ground. Every 4 inches along the bar are ultrasonic
sensors that detect the distance of the pavement from the bar. A roll gyroscope is also
used to determine the true horizon. Both the ultrasonic sensors and the roll gyroscope are
programmed to take readings at every 50-foot station along the road. This system results
in a more accurate calculation of a road’s transverse profile.
Maine DOT developed a software program called Automated Shim Analysis
Program (ASAP), to calculate its shim quantities. This program compares the existing
transverse profile of a road as determined by the data collection, to its desired cross slope.
It then estimates the amount of filler needed to bring the road to the desired cross slope.
A users guide for ASAP is included as Appendix C.
30
The benefits of automating the shim calculations are substantial. Maine DOT
reports that in its first two seasons of this activity, the state saved a significant sum
(estimated at $350,000 in 1992). Another benefit is safety. Survey crews are no longer
needed to take cross-section elevations in the middle of the highway. The procedure is
faster as the collection van takes data while traveling down the highway at speeds
between 30 and 40 mph. These benefits in reduced labor and time and improved safety
have given Maine a rapid return on its investment.
Maine is also taking the initiative in incorporating the images and collected data
into the statewide GIS system. This will greatly increase the data’s accessibility and
exposure, allowing it to be utilized to its fullest potential. Currently under development
in Maine is a centerline roadway layer in the state’s GIS system that will allow a user to
point to a section of roadway, which will show the corresponding videolog image. The
user can then “move” through the images to simulate traveling down the highway. Along
with the images, roadway inventory data that are in the state’s GIS database can be
displayed.
MASSACHUSETTS
Ground-based imaging and data collection in Massachusetts is used primarily for
and is under the jurisdiction of pavement management. A collection vehicle collects
surface roughness and roadway geometric data to evaluate the condition of the roadway.
Along with these data, GPS and mileage points are collected for referencing and a
videolog of the driver’s eye view is kept. These videologs are then sent to the Bureau of
Transportation Planning and Development within the Massachusetts Highway
Department where they are used for linear referencing and are available to be viewed by
authorized users.
31
NEW HAMPSHIRE
New Hampshire uses several data collection activities as the source for its
roadway inventory data. Videolog images are not collected. In general, data collection is
the responsibility of the nine regional planning agencies (RPA) with some additional data
collection performed by consulting agencies. New Hampshire DOT provides a manual of
instructions for road inventory, which is included in Appendix D. The nine RPA’s then
collect the data to these standards and report the data back to the central DOT office. The
DOT acts as a warehouse for the data and supplies it to the state’s GIS. The state of New
Hampshire has no plans to implement a single data collection unit for the entire state and
sites the large initial capital investment as the reason.
RHODE ISLAND
Rhode Island is the only state in New England that uses a contractor to perform its
ground-based image and data collection. The state performed a cost analysis between
procuring its own ground-based imaging and data collection system and paying a
contractor to do the collection and decided that surveying the small number of roads in
the state was not worth the large capital investment and required maintenance of a state
system. By hiring a contractor, the state eliminated the equipment costs and the actual
collection process. The contractor delivers the images and data to state defined
specifications. The primary limitation of this approach is that the state must rely on an
outside party.
Rhode Island uses the images and data collected for pavement management and
some roadway inventories. The roadway images are stored on a network where
authorized users are allowed to view the images and the corresponding coordinates. This

32
is used to a limited extent for linearly referencing roadway inventory items on Rhode
Island’s GIS. The videolog images are also used, as needed, to inventory other roadway
items for specific projects.
VERMONT
At the time of this report, Vermont was undergoing an upgrade to its ground-
based image and data collection system. This provided a unique opportunity to observe
the issues that a state addresses when upgrading to a new technology.
Vermont maintains two separate image and data collection vehicles, one for
pavement management and another for roadway inventories and roadway geometric data
collection. The latter vehicle is the one that is being upgraded from videotape to digital
image files as the collection medium. The image files will then be stored at a central
server to provide access to authorized users. Improved technology on the new vehicle
will collect curve, grade, roll, pitch, GPS, and related data. The older van collected curve
and grade data but Vermont did not feel that these data were reliable enough to distribute.
The technology on the new Vermont system is state-of-the-art. This new
technology requires that users become comfortable in using and maintaining the system.
Some of the problems that Vermont is facing are a small staff for a high workload, server
space problems, and time to validate the accuracy of the new system. A year’s worth of
data is to be collected and their accuracy confirmed before plans for implementing the
system are complete.
Vermont uses and plans to use ground-based image and data collection for
pavement management (a separate system), roadway inventory, and roadway geometric
data collection. When the upgraded system comes fully online, the state’s GIS office
plans on using the images and data to maintain much of its transportation data.

33
CHAPTER 3
State of the Practice of Ground-Based Imagery and Data Collection In New England
The six New England states offer a diverse cross-section of ground-based imagery
and data collection systems. Each state has independently developed a system that they
feel best addresses the needs of their state. The ingenuity behind some of the practices is
impressive and new ideas continue to unfold. New technologies are also constantly
advancing the possibilities of more efficient procedures. A comparison of these systems
will allow ideas to be exchanged and assist in improving systems where the best ideas
survive, thereby maximizing their abilities and efficiency.
New Hampshire does not maintain a single roadway inventory and data collection
system as described in chapter two. For this reason they are not included in the
comparison tables in this chapter.
New England states experience a variety of climate and weather conditions that
cause some unique roadway problems for the region. Improved techniques to solve these
region-specific problems could be identified by understanding the practices across the
states in New England.
Roadway Inventories
Roadway inventories are used across all transportation and highway agencies for
planning, design, operations, and maintenance purposes. These inventories include
roadway geometrics, roadway features and appurtenances, and physical roadway data.
Many different practices exist to collect these data, ranging from use of satellite imagery
to manual collection. Many states combine different practices to get a complete list of
roadway inventories. This section focuses on roadway inventories being collected by
each state through a ground-based image and data collection system. If specific data
34
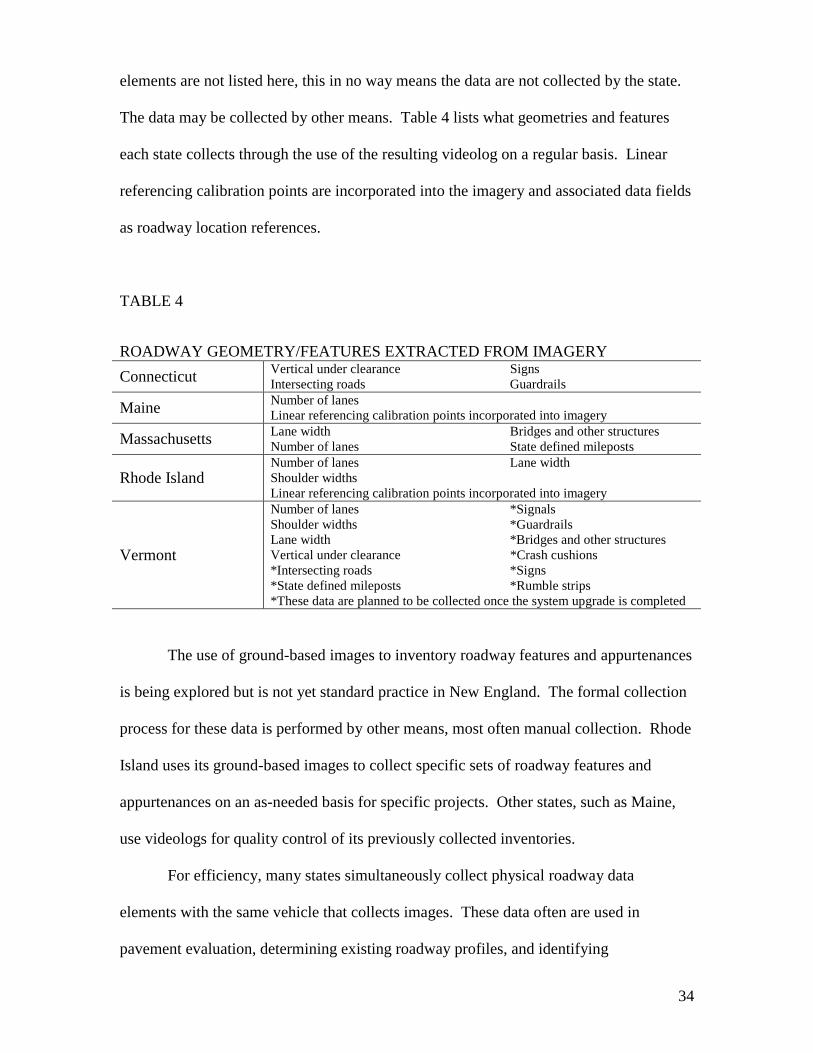
elements are not listed here, this in no way means the data are not collected by the state.
The data may be collected by other means. Table 4 lists what geometries and features
each state collects through the use of the resulting videolog on a regular basis. Linear
referencing calibration points are incorporated into the imagery and associated data fields
as roadway location references.
TABLE 4
The use of ground-based images to inventory roadway features and appurtenances
is being explored but is not yet standard practice in New England. The formal collection
process for these data is performed by other means, most often manual collection. Rhode
Island uses its ground-based images to collect specific sets of roadway features and
appurtenances on an as-needed basis for specific projects. Other states, such as Maine,
use videologs for quality control of its previously collected inventories.
For efficiency, many states simultaneously collect physical roadway data
elements with the same vehicle that collects images. These data often are used in
pavement evaluation, determining existing roadway profiles, and identifying
ROADWAY GEOMETRY/FEATURES EXTRACTED FROM IMAGERY
Connecticut Vertical under clearance Signs Intersecting roads Guardrails
Maine Number of lanes Linear referencing calibration points incorporated into imagery
Massachusetts Lane width Bridges and other structures Number of lanes State defined mileposts
Rhode Island Number of lanes Lane width Shoulder widths Linear referencing calibration points incorporated into imagery
Vermont
Number of lanes *Signals Shoulder widths *Guardrails Lane width *Bridges and other structures Vertical under clearance *Crash cushions *Intersecting roads *Signs *State defined mileposts *Rumble strips *These data are planned to be collected once the system upgrade is completed
35
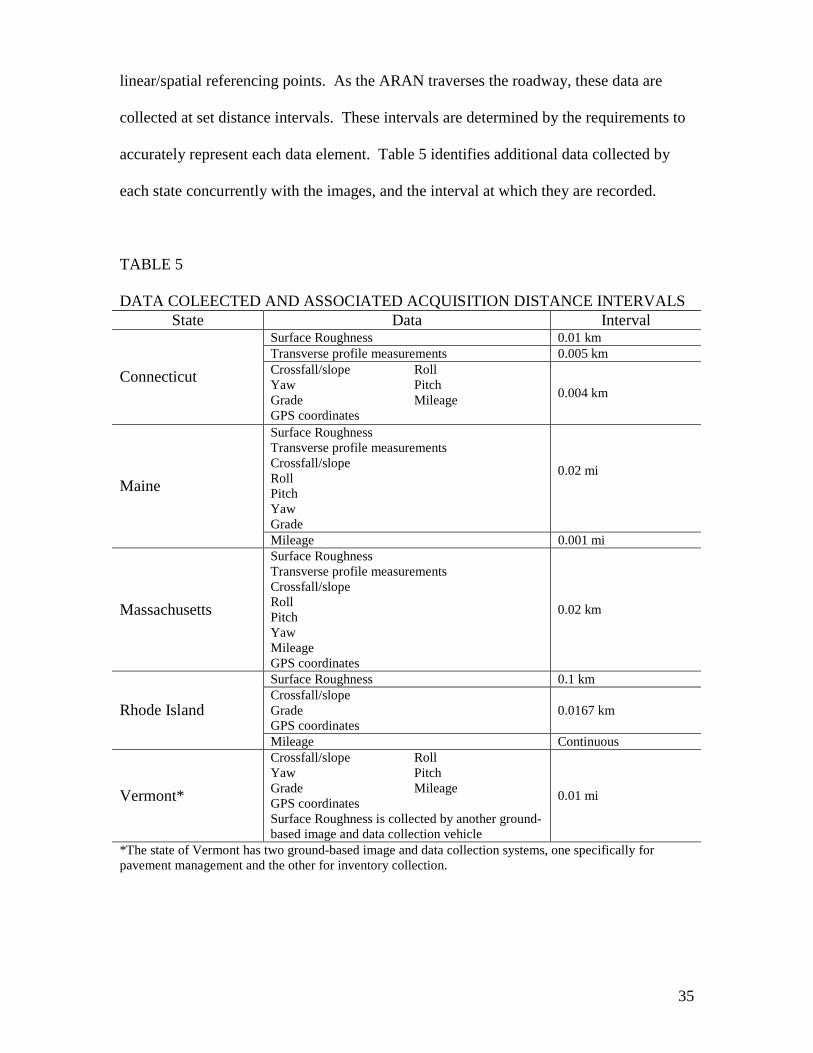
linear/spatial referencing points. As the ARAN traverses the roadway, these data are
collected at set distance intervals. These intervals are determined by the requirements to
accurately represent each data element. Table 5 identifies additional data collected by
each state concurrently with the images, and the interval at which they are recorded.
TABLE 5
DATA COLEECTED AND ASSOCIATED ACQUISITION DISTANCE INTERVALS State Data Interval
Surface Roughness 0.01 km Transverse profile measurements 0.005 km
Connecticut Crossfall/slope Roll Yaw Pitch Grade Mileage GPS coordinates
0.004 km
Surface Roughness Transverse profile measurements Crossfall/slope Roll Pitch Yaw Grade
0.02 mi Maine
Mileage 0.001 mi
Massachusetts
Surface Roughness Transverse profile measurements Crossfall/slope Roll Pitch Yaw Mileage GPS coordinates
0.02 km
Surface Roughness 0.1 km Crossfall/slope GradeGPS coordinates
0.0167 km Rhode Island
Mileage Continuous
Vermont*
Crossfall/slope Roll Yaw Pitch Grade Mileage GPS coordinates Surface Roughness is collected by another ground-based image and data collection vehicle
0.01 mi
*The state of Vermont has two ground-based image and data collection systems, one specifically for pavement management and the other for inventory collection.

36
These data can then be used to calculate specific roadway properties beyond the
raw roadway data including roadway curvatures, roadway profiles, centerline roadway
maps and more. Table 6 summarizes the additional information processed from the
captured data.
TABLE 6
INFORMATION PRODUCED FROM THE CAPTURED DATA
Con
nect
icut
Mai
ne
Mas
sach
uset
ts
Rho
de I
slan
d
Ver
mon
t
Horizontal curvature X X X Vertical curvature X X X Longitudinal profile X X Transverse profile X X X Rutting X X X X Shim quantities and milling X Centerline maps X
Image Acquisition
Each New England state has a different method for acquiring the videologs. The
degree of sophistication used in obtaining the images often prescribes their usefulness
during the data analysis stage.
Table 7 lists the number of centerline miles of roadway videologged by each state.
The state of Maine logs more than twice as many miles as any other New England state
while Rhode Island logs the least. The number of miles logged is important in
determining if the image acquisition process should be performed in-house or by a
contractor. If the state maintains a relatively small number of centerline miles, it may not
be economically efficient to procure its own ground-based image and data collection

37
system. The initial investment for the system and the required maintenance will
outweigh the economic benefit of internally maintaining the system as determined by
Rhode Island, which is the only state in New England that uses a contractor to obtain its
videologs.
TABLE 7
APPROXIMATE CENTERLINE MILES LOGGED Connecticut 4000 Maine 9000 Massachusetts 2900 Rhode Island 1000 Vermont 4000
Table 8 lists the mediums employed for storing images.
TABLE 8
MEDIUM EMPLOYED FOR IMAGE STORAGE
Con
nect
icut
Mai
ne
Mas
sach
uset
ts
Rho
de I
slan
d
Ver
mon
t
Analog Videotape X X Digital Videotape X X CD, DVD and/or Hard Drive X X X
Digital images are the current media for state-of-the-art of ground-based image and data
acquisition and storage systems. They allow for ease of distribution and a level of image
analysis that was not obtainable through analog videotapes. Analog videotapes can be
digitized and distributed as digital files at increased cost and reduced image quality.
Digital videotape improves the image quality but not the accessibility issues.

38
In their earliest forms, ground-based image and data acquisition systems generally
only recorded roadway images of the pavement surface and a driver’s eye view. As the
systems advanced, the benefit of recording additional views for roadway inventory
collection became apparent. Right and left side views improve visibility of inventory
elements that may not have been apparent in only a driver’s eye view. These additional
views greatly assist in associating the inventory elements with their surroundings. Table
9 is a list of roadway views used by each state.
TABLE 9
ROADWAY VIEWS RECORDED
Con
nect
icut
Mai
ne
Mas
sach
uset
ts
Rho
de I
slan
d
Ver
mon
t
Driver’s eye X X X X X Right X X X Left X Pavement surface X X X
Some states acquire these images by recording images in both directions of travel
along the roadway while some only record in one direction. Recording in both directions
or making additional passes on a road improves inventory data collection but increases
expense. Collection cycles of the states also vary. Some states collect data on their roads
annually. Larger states or states with a larger number of roads may videolog their roads
with a longer collection cycle. The number of collection vans, length of the image
collection season, and amount of roadway dictates the length of the collection cycle.
Table 10 is a list of the extent of collection and collection cycles of roadway images for
each state.

39
TABLE 10
EXTENT OF WHICH IMAGERY IS CAPTURED
Con
nect
icut
Mai
ne
Mas
sach
uset
ts
Rho
de I
slan
d
Ver
mon
t
One direction on all roads X Both directions on all roads X X X Both directions on divided roads One direction on undivided roads
X
Once a year X Once every 2 years X X Once every 3 years X Once every 4 years X
In collecting the images, the distance interval in image acquisition is important.
This distance interval is often different from that employed for data collection due to
different operating systems and collection needs. Videotape offers the appearance of
continuous images. Typical systems that rely on digital image files have larger distances
between acquiring the images. An interval that is too large will result in loosing some
roadway inventory elements; an interval that is to small will result in unnecessary money
spent on storage space for the additional image files. Table 11 is a summary of the
distance intervals between image acquisitions by state.
TABLE 11
DISTANCE INTERVAL BETWEEN IMAGE ACQUISITION Connecticut Continuous and .01 km (~33 ft)* Maine Continuous Massachusetts Continuous Rhode Island Every .06 meters (~2.4 inches) Vermont Every .01 miles * Both videotape and digital image files maintained

40
Processing, Storage, and Distribution
After the images and data have been obtained, they are often filtered to yield more
helpful information or decrease the size of the files for post processing and storage.
Table 12 lists the filtering intervals between images, by view, for each state and whether
this filtering is done in-house or by a contractor.
TABLE 12
IMAGE FILTERING
ConnecticutFront, Right side view stored every 10 m Pavement surface editing varies Done In-house
Maine No filtering performed
MassachusettsFront view stored every 20 m Done in-house
Rhode Island Front, Pavement surface stored every 16 m Done by a contractor
Vermont No filtering performed
The filtered images are stored for later use and distribution. The method of
storing images is important for image quality, storage space, and ease of distribution.
Maintaining images digitally is rapidly becoming the most efficient means by which to
store images. Before the images can be stored as digital image files, they are compressed
to reduce the file size. Image resolution also directly effects file size. The higher the
resolution the more detailed the image, but the more storage space needed. Table 13 lists
the compression strategies, image resolution, and file size for those states that maintain
images as digital files.

41
TABLE 13
DIGITAL IMAGE STORAGE CHARCTERISTICS
Con
nect
icut
Mai
ne
Ver
mon
t
Compressed as JPEG files X X X Resolution of 640x480 pixels X X Resolution of 1300x1300 X Average file size is 50K X Average file size is 180K X Once every 3 years Average file size is 60K for driver’s view Average file size is 75K for side view
XX
*Massachusetts does not maintain digital files **A contractor maintains Rhode Island’s compression information
Often, a state will wish to distribute these images to other users within the state
government. In the past, this required making copies of the images on the specified
medium and sending them to the user. Currently, the state-of-the-practice is storing
images on hard drives and distributing the images over a network. This new process has
raised some interesting questions about security and liability such as unauthorized users
acquiring access to the data. By making the images available over a network, the need
for storing the images on portable storage mediums has been eliminated.
Along with distributing images internally, some states make images, and the
associated data, available to external parties. Interested parties range from lawyers to
companies producing in-vehicle navigation systems. The state of Connecticut distributes
the images externally for a fee of $5 for individual photographic quality images and
$13.17 for DVDs containing part of the state’s roadway network to cover cost of
reproduction. Most states are prohibited from selling images or data for a profit. Table
14 lists the distribution practices for the images and associated data for each state.
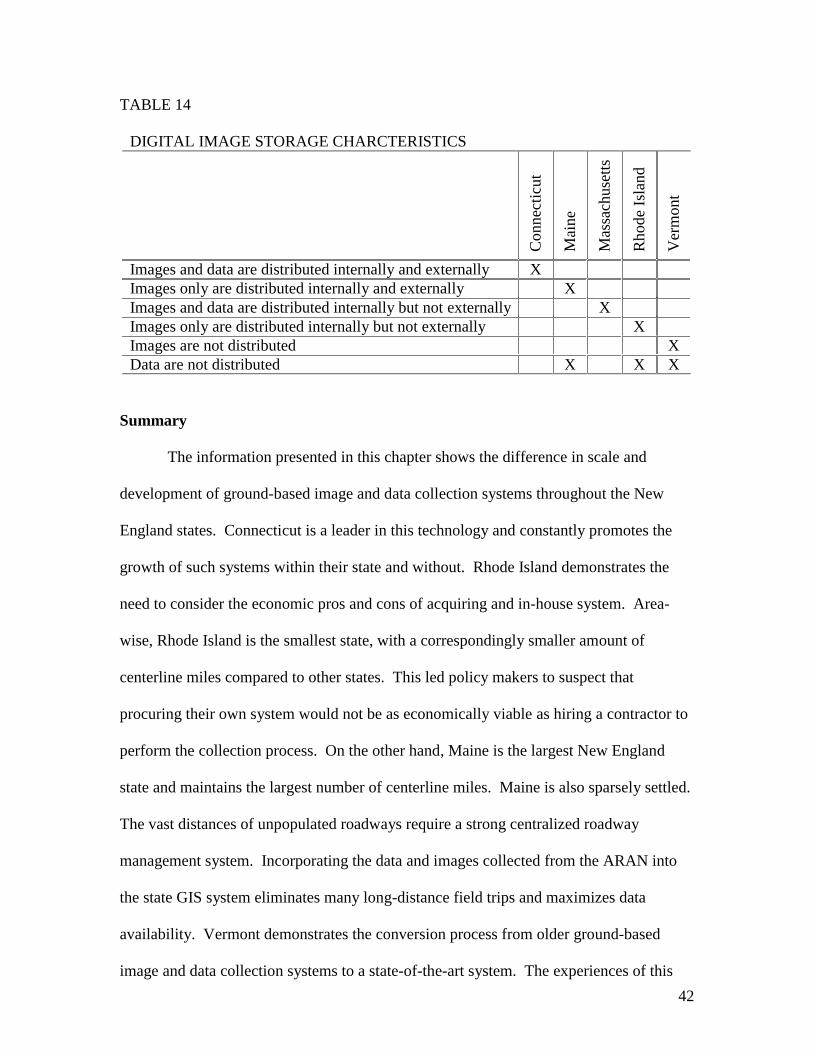
42
TABLE 14
DIGITAL IMAGE STORAGE CHARCTERISTICS
Con
nect
icut
Mai
ne
Mas
sach
uset
ts
Rho
de I
slan
d
Ver
mon
t
Images and data are distributed internally and externally X Images only are distributed internally and externally X Images and data are distributed internally but not externally X Images only are distributed internally but not externally X Images are not distributed X Data are not distributed X X X
Summary
The information presented in this chapter shows the difference in scale and
development of ground-based image and data collection systems throughout the New
England states. Connecticut is a leader in this technology and constantly promotes the
growth of such systems within their state and without. Rhode Island demonstrates the
need to consider the economic pros and cons of acquiring and in-house system. Area-
wise, Rhode Island is the smallest state, with a correspondingly smaller amount of
centerline miles compared to other states. This led policy makers to suspect that
procuring their own system would not be as economically viable as hiring a contractor to
perform the collection process. On the other hand, Maine is the largest New England
state and maintains the largest number of centerline miles. Maine is also sparsely settled.
The vast distances of unpopulated roadways require a strong centralized roadway
management system. Incorporating the data and images collected from the ARAN into
the state GIS system eliminates many long-distance field trips and maximizes data
availability. Vermont demonstrates the conversion process from older ground-based
image and data collection systems to a state-of-the-art system. The experiences of this

43
state could be valuable in identifying potential problems for other states that plan to go
through this conversion in the future. Massachusetts effectively uses an older system to
acquire videologs for pavement management and has a complete library of images.
However, the state is limited by resources to make full use of their system.

44
CHAPTER 4
Using GIS
Geographic Information Systems (GIS) have rapidly become an important tool in
transportation to store, manage, analyze, and display pertinent characteristics of
information at a geographic location. These characteristics can be almost anything from
crime rate to environmental classification to traffic level.
GIS provides a unique opportunity for transportation officials to effectively
manage infrastructure and roadway inventories. Data associated with these systems are,
by their nature, spatially referenced. GIS systems allow transportation officials to point
to an item on a map and get any stored information such as condition, height, or size.
The ability to display a videolog image containing the inventory item and its
surroundings within the GIS system is also possible.
When collecting ground-based images, a spatial reference is also collected. This
can be latitude and longitude, state plane coordinates, state defined mileposts, chainage,
or another system. These references are necessary for integrating information within a
GIS.
Each of the six New England states has a GIS system, with some states having
multiple systems. In states like Massachusetts and Maine, the state’s transportation
agency is responsible for providing the transportation data to a centralized agency that
manages and distributes statewide GIS-based information.
Transportation data is often gathered by many different sources, often regional
planning agencies responsible for collecting all of the data within their region. This data
collection relies on time consuming manual collection with multiple trips required to
collect the necessary information. Use of an ARAN vehicle and associated image

45
collection to gather much of the necessary transportation data in one pass provides a
mostly automated process. Some states have realized this potential and have begun using
ground-based image and data collection for this purpose. Other states still rely on older
methods. A comparison of GIS practices as they relate to ground-based imagery of New
England states is presented.
Several GIS software packages are used by state transportation agencies.
Evaluating the pros and cons of each system is beyond the scope of this project.
However, knowing the systems in use by each state may provide useful information to
others. Table 15 lists the Geographic Information Systems used by each state agency in
New England.
TABLE 15
GIS SYSTEMS
Con
nect
icut
Mai
ne (
Off
ice
of G
IS)
Mai
ne (
DO
T)
Mas
sach
uset
ts (
Mas
s G
IS)
Mas
sach
uset
ts (
MA
SS H
ighw
ay)
New
Ham
pshi
re
Rho
de I
slan
d
Ver
mon
t
ArcInfo/ArcView X X X X X X X Integraph X GDS X Computer Aided Drafting/Design (CAD) X X
Each state uses several spatial location referencing systems to locate objects in the
system as indicated in Table 16.

46
TABLE 16
FORMS OF SPATIAL LOCATION REFERENCING
Con
nect
icut
Mai
ne
(Off
ice
of G
IS)
Mai
ne (
DO
T)
Mas
sach
uset
ts(M
ass
GIS
)
Mas
sach
uset
ts(M
ASS
Hig
hway
)
New
Ham
pshi
re
Rho
de I
slan
d
Ver
mon
t
Latitude and longitude X X X State plane coordinates X X X X X X X Mileposts X X X X X X UTM, link-node X
Geographic Information Systems typically operate on several databases, which
are usually warehoused in three different ways: centralized, distributed, and local. For a
centralized warehouse, data are maintained in a single location that is accessed by remote
users. For a distributed warehouse, data are maintained at several locations throughout
the state that are accessed by remote users. For local warehouses, the data are maintained
on local systems with access only to local users. Maintaining data in a centralized
warehouse allows the data providers more and easier control over data maintenance and
quality. Table 17 lists the warehousing techniques by state.
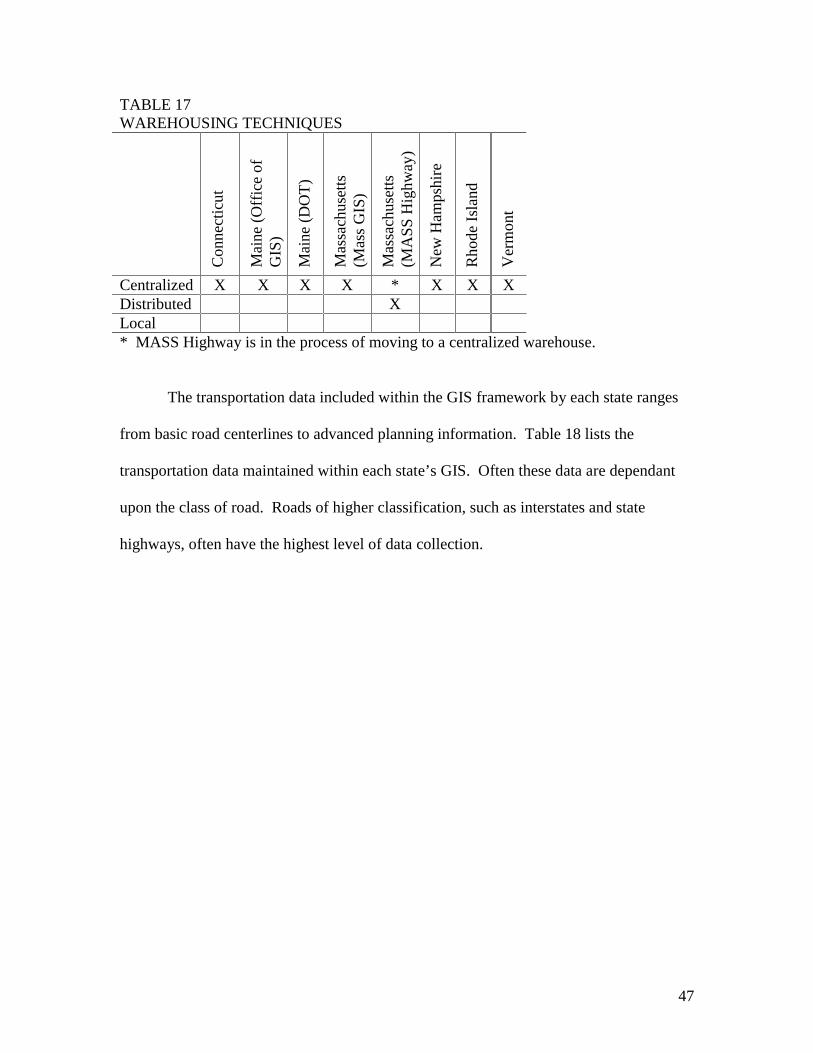
47
TABLE 17 WAREHOUSING TECHNIQUES
Con
nect
icut
Mai
ne (
Off
ice
of
GIS
)
Mai
ne (
DO
T)
Mas
sach
uset
ts(M
ass
GIS
)
Mas
sach
uset
ts(M
ASS
Hig
hway
)
New
Ham
pshi
re
Rho
de I
slan
d
Ver
mon
t
Centralized X X X X * X X X Distributed X Local * MASS Highway is in the process of moving to a centralized warehouse.
The transportation data included within the GIS framework by each state ranges
from basic road centerlines to advanced planning information. Table 18 lists the
transportation data maintained within each state’s GIS. Often these data are dependant
upon the class of road. Roads of higher classification, such as interstates and state
highways, often have the highest level of data collection.

48
TABLE 18
TRANSPORTATION DATA WITHIN THE GIS
Con
nect
icut
Mai
ne (
Off
ice
of
GIS
)
Mai
ne (
DO
T)
Mas
sach
uset
ts(M
ass
GIS
)
Mas
sach
uset
ts(M
ASS
Hig
hway
)
New
Ham
pshi
re
Rho
de I
slan
d
Ver
mon
t
Route number X X X X X X X Speed limit X X X X Number of lanes X X X X X X Lane width X X X X X X Shoulder widths X X X X X X Median type X X X X X Median width X X X X X Curbs present X X X X X Sidewalk width X Vertical under clearance X X X Intersecting roads X X X X X X Bridges X X X X X X Town lines X X X X X X X X Linear referencing calibration points X X X State defined mileposts X X X X HOV lanes X Rumble strips X X Gaurdrails X X Signs X X Signals X X Crash cushions X Surface roughness X X X X X Grade X X X Crossfall or cross slope X Mileage X X X X X X Road surface type X X X X X Transverse profile measurements GPS coordinates X X X X X X Yaw X X Roll X Pitch X Skid number Toll Road X X X

49
Table 19 lists the distance intervals between data points and the update cycle.
TABLE 19
DISTANCE INTERVAL BETWEEN DATA POINTS AND DATA UPDATE CHARACTERISTICS
Con
nect
icut
Mai
ne (
Off
ice
of G
IS)
Mai
ne (
DO
T)
Mas
sach
uset
ts (
Mas
s G
IS)
Mas
sach
uset
ts (
MA
SS H
ighw
ay)
New
Ham
pshi
re
Rho
de I
slan
d
Ver
mon
t
Continuous data X X X X X Variable data intervals X .01 mi data interval X Continuously updated X Yearly updates X Updated every 2 years X Updates vary X X X X No response X
Many different sources are used to obtain transportation data. Satellite and aerial
photography, along with manual field collection are often the primary sources. Data
collected by the ARAN vehicle, specifically the videologs, have become integrated into
some state systems. Table 20 lists the means by which roadway data are acquired for
each state.

50
TABLE 20
DATA ORIGIN Connecticut Pen based computers used in field data collection
Maine (Office of GIS)
GPS DOQQ’sSPOT imagery Roads originally digitized using 1:24,000 USGS topo maps
Maine (DOT)
GPS Engineering files Roadway inventory Videologs
Massachusetts(MassGIS)
No response
Massachusetts(MASS Highway)
Data acquired in-house by individual DPW’s
New Hampshire Data acquired in-house and by contractors
Rhode Island Videologs Aerial photography
Vermont No response
One key issue is whether data associated with ground-based imagery and data
collection is specifically being used by GIS agencies in the New England states. Table
21 describes the specific videolog usage within GIS agencies in New England and plans
for using videolog imaging in the future.

51
TABLE 21
VIDEOLOG USAGE
ConnecticutVideolog is used for specific projects Plans to use images in future GIS activities
Maine (Office of GIS)
Videolog not used
Maine (DOT)
Videolog is GIS linked and is used for inventory quality check, Plans to use images in future GIS activities
Massachusetts(MassGIS)
Videolog not used
Massachusetts(MASS Highway)
Videolog is used for linear referencing Plans to use images in future GIS activities
New Hampshire Videolog is not used No plans to use images in future GIS activities
Rhode Island Videolog is used as a data collection source Plans to use images in future GIS activities
VermontVideolog is currently not used Plans to use images in future GIS activities
The state GIS agency often does not perform the data collection internally but
compiles and maintains databases from outside agencies. For this reason, it is valuable to
know what agencies are specifically collecting data. Of the six New England states, only
Maine and Rhode Island rely on outside contractors for any data gathering. In Maine, a
contractor is used for roadway digitizing following standards set by the state. Rhode
Island uses contractors for the entire videologging process. These companies are TMT
and Lamdatech International, respectively.
All GIS agencies need to digitize roadways in their state for use within the
system. This process can be completed using several different hardware and software
packages, all of which have slightly different processes. Table 22 lists the processes by
which the roads are digitized in each state.

52
TABLE 22
MEANS OF ROADWAY DIGITATION Connecticut GPS receiver and Intergraph Microstation Maine (Office of GIS) Contracted out to Maine office of GIS standards
Maine (DOT) ArcInfo is used to digitize the roads which is originally performed by various contractors
Massachusetts (MassGIS) Roads are originally from USGS 100,000 scale DLGs
Massachusetts (MASS Highway) ArcInfo is used to digitize the roads
New Hampshire Spatial location collected using Trimble GPS equipment,ArcView/ArcGIS/GDS are used to digitize the roads
Rhode Island ArcInfo is used to digitize the roads Vermont ArcInfo is used to digitize the roads
Finally, data available on these state systems are potentially valuable to many
outside users. Some states make this data fully available to outside users while others
choose to make it available to internal users only. This distribution may be done by
giving outside users access to the GIS, or providing data sets on CD or diskette upon
request. Table 23 lists the external distribution practices of each state.
TABLE 23
EXTERNAL DISTRIBUTION
Con
nect
icut
Mai
ne (
Off
ice
of
GIS
)
Mai
ne (
DO
T)
Mas
sach
uset
ts(M
ass
GIS
)
Mas
sach
uset
ts(M
ASS
Hig
hway
)
New
Ham
pshi
re
Rho
de I
slan
d
Ver
mon
t
Data are externally distributed X X X X X X X Data are not externally distributed X
53
Summary
All six New England states have GIS agencies. Each of these agencies maintains
some transportation data. The purpose of this section is to demonstrate the potential of
using data collected from ground-based image and data collection within the GIS. Often
roadway inventories are collected from aerial photography and some form of manual
field collection. Of the six New England states, only Rhode Island uses their ground-
based imaging system to provide data for the state’s GIS. Maine uses their system to
perform quality checks of the existing roadway inventories that are collected through
other means. They are also developing a system by which the videologs are viewable
through the GIS. Connecticut and, in the near future, Vermont maintain a state-of-the-art
ground-based image and data collection system. These states have recognized the
relative ease with which they could develop these systems to provide the majority of the
required transportation data to the state’s GIS and are working to develop such a system.
Massachusetts uses the videologs to linearly reference some of the roadway inventories
provided on the GIS. Without an upgrade of the ground-based image and data collection
system, Massachusetts lacks the technology to develop a strong videolog-GIS linked
program. New Hampshire, having no videolog system, maintains its transportation data
through manual collection done by the state’s regional planning agencies.
A strong videolog-GIS linked program has the potential to act as a single
collection source for much, if not all, of a state’s GIS transportation data needs. This
could be used to reduce repetitive, time consuming and costly data collection processes.
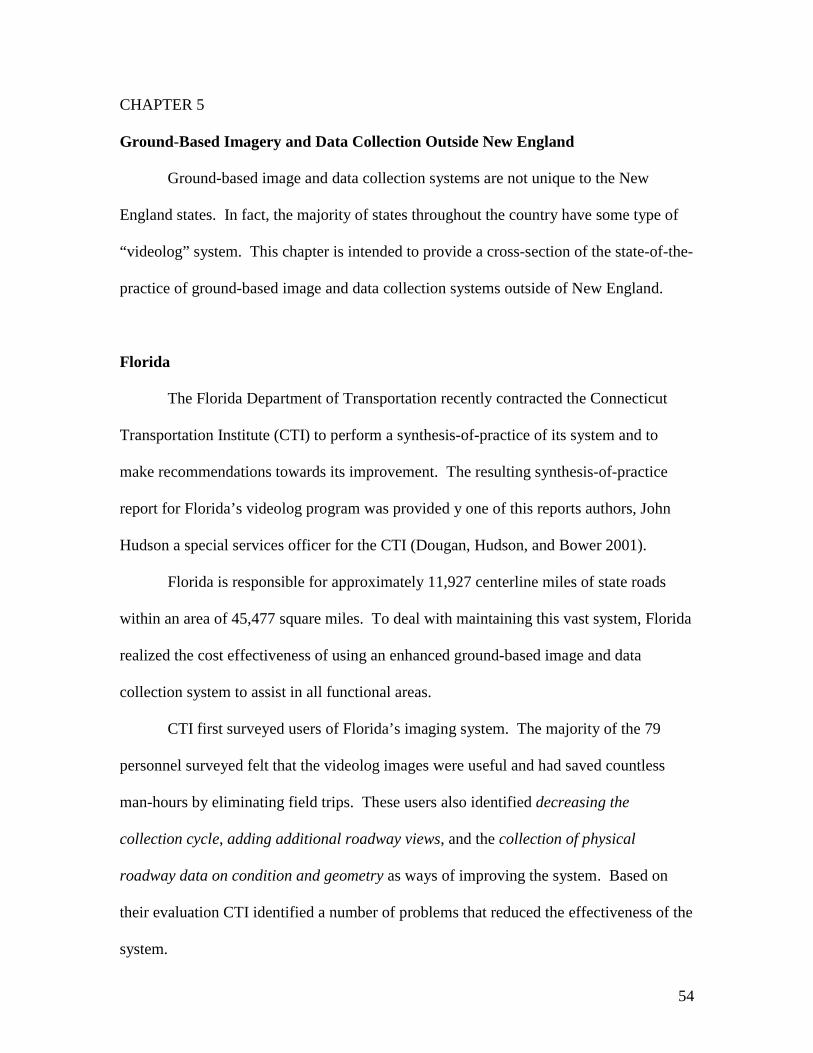
54
CHAPTER 5
Ground-Based Imagery and Data Collection Outside New England
Ground-based image and data collection systems are not unique to the New
England states. In fact, the majority of states throughout the country have some type of
“videolog” system. This chapter is intended to provide a cross-section of the state-of-the-
practice of ground-based image and data collection systems outside of New England.
Florida
The Florida Department of Transportation recently contracted the Connecticut
Transportation Institute (CTI) to perform a synthesis-of-practice of its system and to
make recommendations towards its improvement. The resulting synthesis-of-practice
report for Florida’s videolog program was provided y one of this reports authors, John
Hudson a special services officer for the CTI (Dougan, Hudson, and Bower 2001).
Florida is responsible for approximately 11,927 centerline miles of state roads
within an area of 45,477 square miles. To deal with maintaining this vast system, Florida
realized the cost effectiveness of using an enhanced ground-based image and data
collection system to assist in all functional areas.
CTI first surveyed users of Florida’s imaging system. The majority of the 79
personnel surveyed felt that the videolog images were useful and had saved countless
man-hours by eliminating field trips. These users also identified decreasing the
collection cycle, adding additional roadway views, and the collection of physical
roadway data on condition and geometry as ways of improving the system. Based on
their evaluation CTI identified a number of problems that reduced the effectiveness of the
system.

55
The current system in Florida divides data collection between several different
operational units. A contractor for the Transportation Statistics Office provides videolog
images; Pavement Management collects rider-comfort data (IRI) and the results of other
pavement analysis; the State Materials Office maintains pavement distress data; and the
Transportation Statistics Office collects roadway inventory data through annual surveys.
A single comprehensive image and data acquisition system could collect all of the data
maintained by these units in one pass by an ARAN vehicle. The CTI performed a cost
analysis for the state of Florida using the experiences of the Connecticut DOT and
estimated that a ground-based image and data collection system would save the state of
Florida $8,757,100 annually. When compared to contracting an outside agency to
perform the collection process, at a cost to the state estimated to be $2,394,000, results a
benefit-cost ratio of 3.7. Doing the collection in-house was estimated to cost the state
$1,261,200 for a benefit-cost ratio of 6.9. The advantages of using a contractor include
elimination of (1) equipment costs and (2) the need to obtain and keep trained personnel
in this state-of-the-art field. Having the units in-house allows for more flexibility in
schedule changes and in project level usage.
An important recommendation was that the management of this system should
fall under the control of a single government agency which would be responsible for all
contracts, data and image processing, technical support, software development, upgrades,
training of staff and promoting the use within Florida DOT.
The CTI also recommended many specific improvements to the nature of the
system. One was to incorporate the videolog images and associated data into a GIS
where the information can be retrieved by selecting a location on a map. This is intended
to improve accessibility over the current system where users must input specific

56
mileposts. Many users thought this was cumbersome and were unfamiliar with the
milepost system.
Another recommendation was to improve the operational characteristics of the
distribution network. Users identified the current network as having a slow access rate.
It was also recommended that the state develop image-processing software to perform
geometric calculations on the images, which would eliminate additional field trips. To
obtain additional useful data, it was recommended that the data collection vans be
equipped with additional cameras to obtain right-of-way, left, and pavement views. It
was also suggested to make additional passes on multi-lane roads, reducing the image
interval from 0.01 miles to 0.005 miles and shortening the collection cycle. Decreasing
the interval would capture data that was currently being lost between frames while
shortening the collection cycle would improve the timeliness of the data.
Arkansas
The state of Arkansas has maintained images and data for the majority of its state
and national roadways since 1993. The state’s current system collects images for the
driver’s eye, right, and pavement views for 16,500 centerline miles. Along with the
images, the state collects a full range of physical roadway data and uses the system to
assist in pavement management. The images are digitized and compressed as JPEG files
for distribution to internal Arkansas DOT users over an intranet. The state has recently
started collecting GPS data and is using it to move towards integrating the images and
other data into a GIS. Arkansas is also beginning to develop image-processing software
to enhance their data collection activities.

57
Iowa
The state of Iowa has produced videologs for the past twenty years. Currently,
the state maintains about 20,000 miles of roadway and annually updates half of the
videologs in each direction. Images are acquired digitally and distributed internally over
an intranet, as well as on CD’s. The Iowa system is designed for collecting roadway
inventory elements and obtains supplemental images of the right and left side views. The
state of Iowa is satisfied with the condition of its roadway inventory database and is
considering increasing the collection cycle for the sake of cost effectiveness from every
two years to every four years.
Ohio
Ohio maintains about 19,290 miles of roadway. Images are maintained in both
directions and are collected on a three-year collection cycle. The images are initially
stored on analog laser discs and then distributed over an intranet to internal users. The
images are occasionally distributed to outside users on DVDs for a fee. The primary
driving force behind Iowa’s videolog program was the need for assistance with litigation.
The state finds the videologs invaluable in court for proving culpability. Some physical
roadway data are collected during the videolog process and the van is occasionally used
for specific projects. Occasionally, the system is used for specific roadway inventory
collection, but the state is satisfied with the current field collection system. Using
videologs for litigation is an issue that many states are concerned about since images
could be used against them. By developing their videolog system with litigation purposes
in mind the state of Ohio shows another application where videologs are economically
efficient.
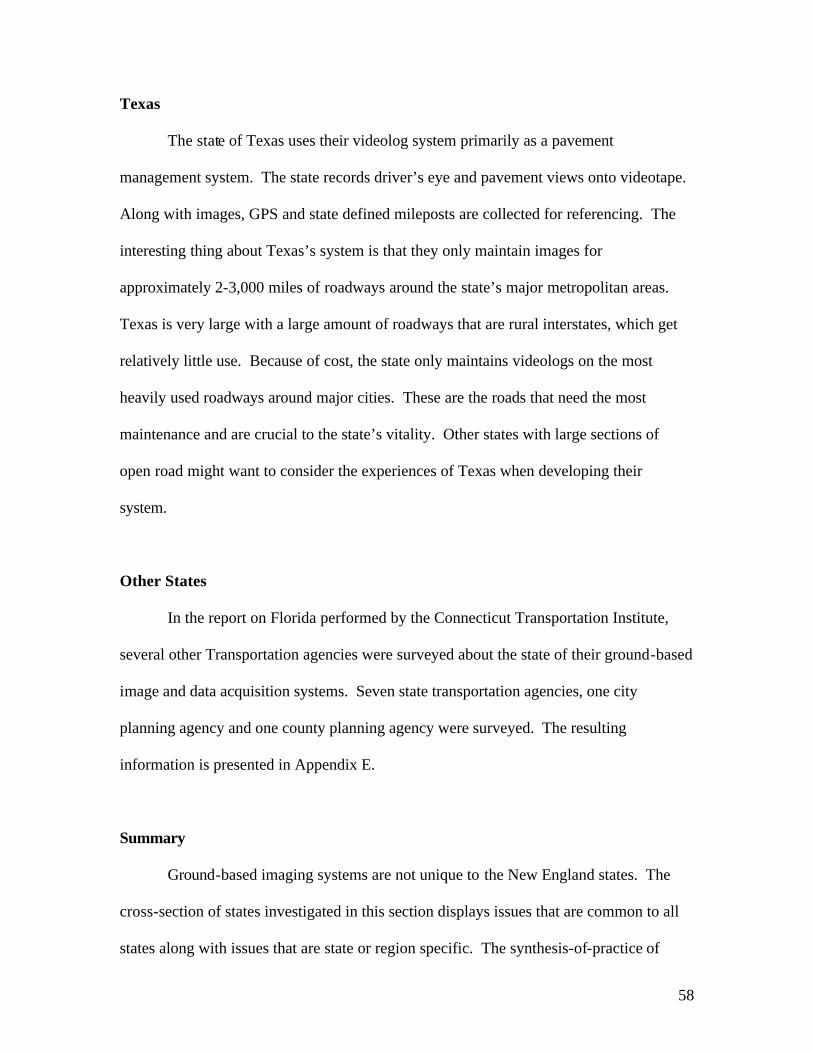
58
Texas
The state of Texas uses their videolog system primarily as a pavement
management system. The state records driver’s eye and pavement views onto videotape.
Along with images, GPS and state defined mileposts are collected for referencing. The
interesting thing about Texas’s system is that they only maintain images for
approximately 2-3,000 miles of roadways around the state’s major metropolitan areas.
Texas is very large with a large amount of roadways that are rural interstates, which get
relatively little use. Because of cost, the state only maintains videologs on the most
heavily used roadways around major cities. These are the roads that need the most
maintenance and are crucial to the state’s vitality. Other states with large sections of
open road might want to consider the experiences of Texas when developing their
system.
Other States
In the report on Florida performed by the Connecticut Transportation Institute,
several other Transportation agencies were surveyed about the state of their ground-based
image and data acquisition systems. Seven state transportation agencies, one city
planning agency and one county planning agency were surveyed. The resulting
information is presented in Appendix E.
Summary
Ground-based imaging systems are not unique to the New England states. The
cross-section of states investigated in this section displays issues that are common to all
states along with issues that are state or region specific. The synthesis-of-practice of

59
Florida performed by the CTI demonstrates the need to develop a single, centralized,
well-managed data collection system. Videolog systems have the highest potential of
delivering this type of system at the lowest cost to the state. Texas presents a region
specific issue with videolog usage. Much of the roadways in a large state such as Texas
are rural. For economic efficiency Texas only videologs those roadways that are greatly
effected by urban traffic. Ohio, with a system developed to assist in litigation, has shown
that videologs can save a state significant money by easily and effectively proving
culpability. This section and the results of the CTI surveys in Appendix E demonstrate
that many states are moving towards newer technology and have recognized the benefits
with maintaining a state-of-the-art system.
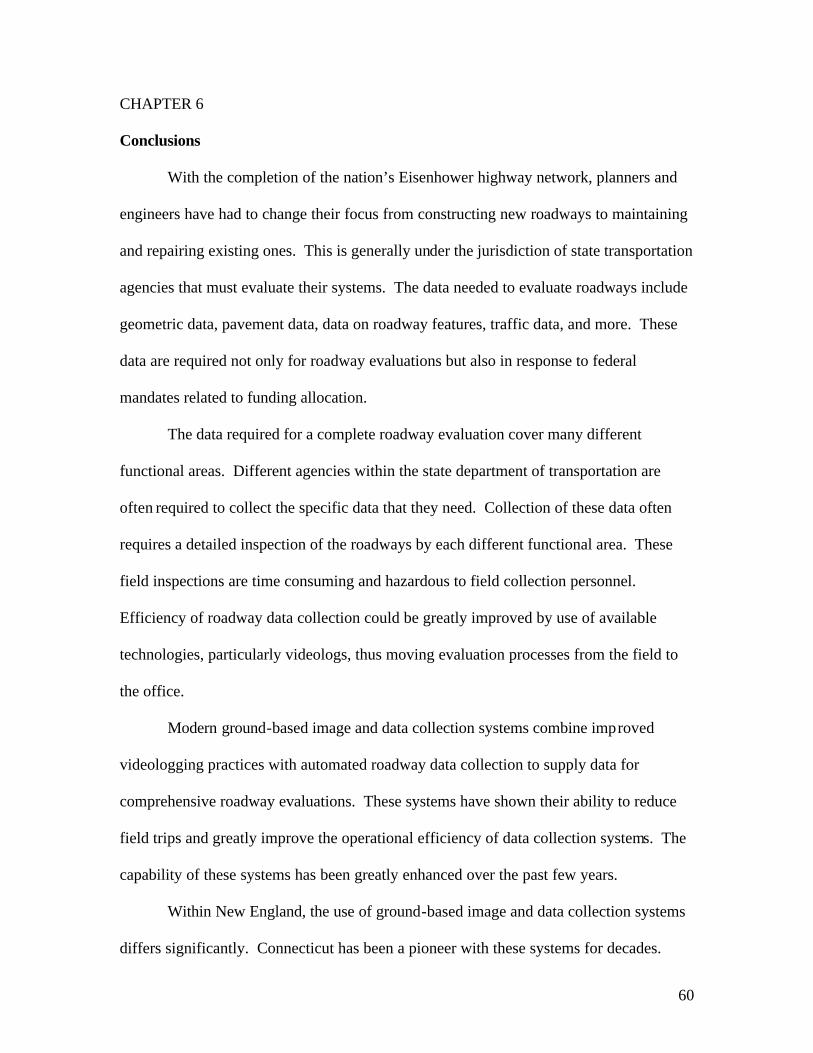
60
CHAPTER 6
Conclusions
With the completion of the nation’s Eisenhower highway network, planners and
engineers have had to change their focus from constructing new roadways to maintaining
and repairing existing ones. This is generally under the jurisdiction of state transportation
agencies that must evaluate their systems. The data needed to evaluate roadways include
geometric data, pavement data, data on roadway features, traffic data, and more. These
data are required not only for roadway evaluations but also in response to federal
mandates related to funding allocation.
The data required for a complete roadway evaluation cover many different
functional areas. Different agencies within the state department of transportation are
often required to collect the specific data that they need. Collection of these data often
requires a detailed inspection of the roadways by each different functional area. These
field inspections are time consuming and hazardous to field collection personnel.
Efficiency of roadway data collection could be greatly improved by use of available
technologies, particularly videologs, thus moving evaluation processes from the field to
the office.
Modern ground-based image and data collection systems combine improved
videologging practices with automated roadway data collection to supply data for
comprehensive roadway evaluations. These systems have shown their ability to reduce
field trips and greatly improve the operational efficiency of data collection systems. The
capability of these systems has been greatly enhanced over the past few years.
Within New England, the use of ground-based image and data collection systems
differs significantly. Connecticut has been a pioneer with these systems for decades.

61
They have promoted the use of these systems and publicly documented their
development. Maine has also initiated some innovative techniques with their shim
quantity analysis and incorporation of videologs and associated data into an enterprise
GIS. Vermont and Rhode Island have also begun to use the abilities of the modern
systems. Massachusetts has a system in place that would benefit from an upgrade and
increased managerial support. New Hampshire has no system in place and relies upon
the regional planning agencies for data collection.
The New England states provide a good cross-section of issues concerning the
development and implementation of ground-based image and data collection systems.
New Hampshire feels that procuring a system is not economically viable due to the large
capital investment needed for obtaining system hardware and training personnel.
Connecticut, to make its system the most efficient, complements its system with a wide
range of training programs and advocates the use of the system throughout the state.
Every state interested in obtaining a system should perform a benefit-cost analysis
to determine the advantages versus the cost. Typically, small dominantly rural states will
have the smallest benefit/cost ratios and may feel it is to their advantage to keep their
current data collection systems in place. States that choose to do this should also take
into account the impact that this decision may have in the future. The federal government
is also considering enhancing the Highway Performance Monitoring System and may
encourage use of a single automated data collection system.
Massachusetts demonstrates the need to promote the abilities of ground-based
image and data collection systems throughout upper level management. In this state, the
system is under utilized because many users are simply unaware of its potential.
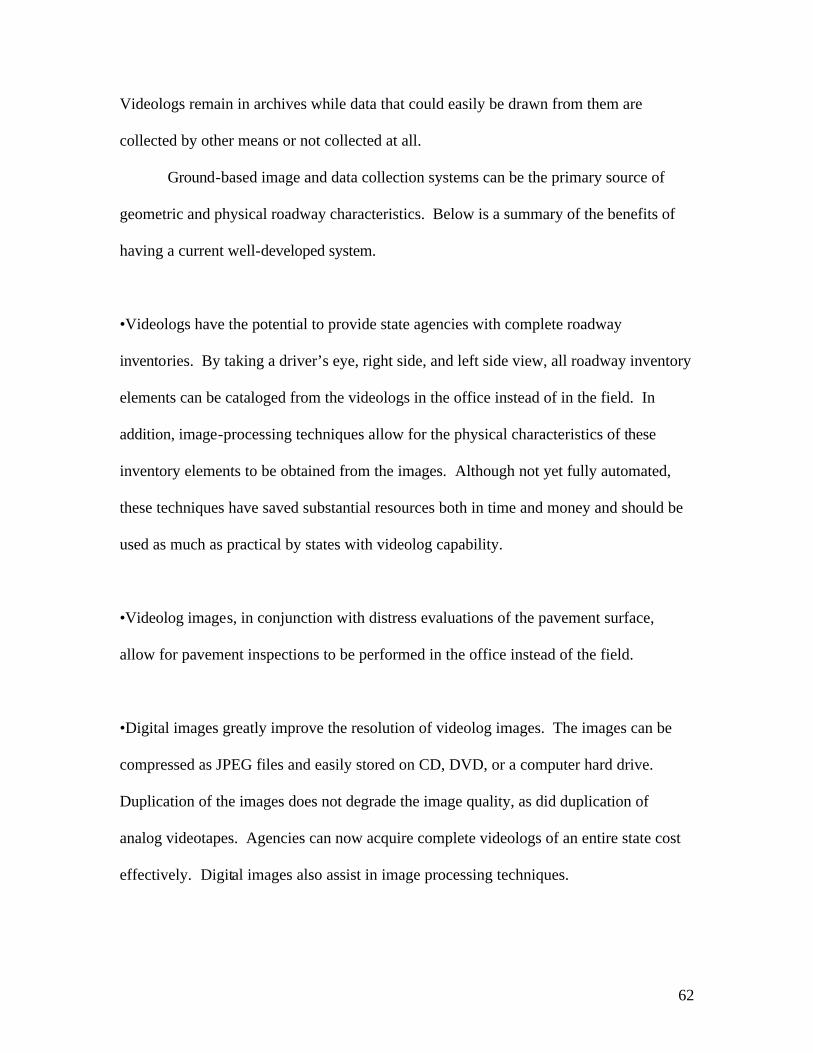
62
Videologs remain in archives while data that could easily be drawn from them are
collected by other means or not collected at all.
Ground-based image and data collection systems can be the primary source of
geometric and physical roadway characteristics. Below is a summary of the benefits of
having a current well-developed system.
•Videologs have the potential to provide state agencies with complete roadway
inventories. By taking a driver’s eye, right side, and left side view, all roadway inventory
elements can be cataloged from the videologs in the office instead of in the field. In
addition, image-processing techniques allow for the physical characteristics of these
inventory elements to be obtained from the images. Although not yet fully automated,
these techniques have saved substantial resources both in time and money and should be
used as much as practical by states with videolog capability.
•Videolog images, in conjunction with distress evaluations of the pavement surface,
allow for pavement inspections to be performed in the office instead of the field.
•Digital images greatly improve the resolution of videolog images. The images can be
compressed as JPEG files and easily stored on CD, DVD, or a computer hard drive.
Duplication of the images does not degrade the image quality, as did duplication of
analog videotapes. Agencies can now acquire complete videologs of an entire state cost
effectively. Digital images also assist in image processing techniques.

63
•Videologs have proven to be extremely useful for determining culpability in court cases
concerning roadway characteristics. Ohio describes this use as invaluable for the savings
it provides in legal matters.
•Modern systems have the ability to automate the collection of nearly all physical
roadway data including the physical characteristics of the roadway such as curvature,
grade, transverse profile, cross slope, and pavement data such as IRI values and texture.
These data are stored as a digital file on CD, DVD, or hard drive and easily distributed.
•Many software programs have been developed to process these data and obtain
horizontal and vertical curvature, roadway profiles, rutting, and shim quantities. These
processed data can then be used to produce centerline maps and curb-to-curb plans.
•Linear and spatial referencing systems, such as state defined mileposts and GPS
coordinates, allow each inventory element and image to be “tagged” with its geographic
location. This allows for accurate placement of the inventory element and associated data
into a GIS. These data can then be used in spatial analyses available through the GIS.
•The ability to store the videolog images and associated data on hard drives provides for
the capability of network level distribution. In these systems, the data are stored on a
central server and any authorized user can access the images and data. This virtually
eliminates the production and distribution costs. Many states are moving toward this type
of internal (and external) distribution, despite concerns over data security.

64
•Many states have a central GIS agency that maintains and distributes data across many
different categories, one of which is roadways and their characteristics. The images and
data collected can be easily incorporated into these systems. Within this expanded
environment, roadway data can be used in both transportation and non-transportation
related projects. A real advantage to the inclusion of imagery is the ability to quantify the
impact of roadways on their surroundings in a way that is easily understood by all users.
This is revolutionary to the planner and the implications go well beyond the
transportation field.
Maximum effectiveness of a ground-based image and data collection system
could be realized in a single, well-managed, well-promoted data collection system that
provides nearly all of the data collection needs of the state at a relatively low cost. The
system can be very user friendly and operate seamlessly between data collection,
processing, and manipulation so that a relatively unskilled user could efficiently operate
the system. A key to implementing this is education of users about the images, their use
and analysis potential. Several companies specialize in developing these systems
specifically for individual states. These companies will also perform the data collection.
Appendix F lists suppliers and contact information.

65
REFERENCES
1. Anderson, Steve; “Computer Video: The Basics”; accessed at Utah State University: <http://www.usu.edu/~sanderso/multinet/vidpix.html>; June 2001.
2. Dougan, Charles E.; Hudson, John H.; Bower, David G.; 2001; “Florida Department of Transportation Videolog Program”; University of Connecticut School of Engineering; Storrs, CT.
3. Ease, Said; Chan, Yupo; 2000; “Urban Planning and Development Applications of GIS”; American Society of Civil Engineers, Reston, VI.
4. Federal Highway Administration: Highway Performance Monitoring System; accessed at: <http://www.fhwa.dot.gov/ohim/hpmspage.htm>; June 2001.
5. Finn, Fred; 1998; “Pavement Management Systems — Past, Present, and Future”;accessed at Federal Highway Administration: Public Roads, Vol 62, No 1 <http://www.tfhrc.gov/pubrds/julaug98/pavement.htm>; June 2001.
6. Hancock, Kathleen L; 2000“A Proposal to Conduct a Study Entitled Ground-Based Imaging and Data Acquisition for Roadway Inventories in New England: A Synthesis of Practice”, The University of Massachusetts, Amherst, Civil and Environmental Engineering Department, The Transportation Center, Amherst, MA.
7. Hudson, John H.; Seitz, Robert L.; 1996; “Evaluation of Videowindows Photolog Laser Videodisc Viewing System”; Transportation Research Record; Vol 1536; National Academy Press, Washington D.C.; pp136-139.
8. Hummer, Joseph E.; Schefler, Craig R.; Khattak, Aemal J.; Karimi, Hassan A.; 1999; “Choosing an Inventory Data Collection System”; Transportation Research Record; Vol 1690; National Academy Press, Washington D.C.; pp126-134.
9. Kalikiri, Vinod K.; Garrick, Norman W.; Achenie, Luke E.; 1994; “Image-Processing Methods for Automated Distress Evaluation”; TransportationResearch Record; Vol 1435; National Academy Press, Washington D.C.; pp45-51.
10. Maine DOT; 1992; “Maine DOT Calculates Bituminous Overlay Quantities-ASAP”, TR News; Issue 159; National Academy Press, Washington D.C.; pp32-33.

66
11. Orth, Paul A.; Singh, Chan; 1994; “Acquisition and Implementation of the SDDOT Videologging System”; Report No. SD90-17-X; South Dakota Department of Transportation, Pierre, SD.
12. Phares, Brent M; Washer, Glenn; Moore, Mark; 1999; “Introducing FHWA’s NDE Validation Center”; accessed at Federal Highway Administration: Public Roads, Vol 62, No 4 <http://www.tfhrc.gov/pubrds/janfeb99/intro.htm>; June 2001.
13. Ritter, Joyce; 1994; “The History of Highway Statistics”; accessed at Federal Highway Administration <http://www.fhwa.dot.gov/ohim/1994/text/history.htm>;June 2001.
14. Sayers, Michael W; Karamihas, Steven M; 1997; “The little Book of Profiling: Basic Information about Measuring and Interpreting Road Profiles”.
15. Sime, James M.; 1984; “Pavement Management in Connecticut Pase II –Development, Part2- Visual Rating of Pavement Distress from Photolog Inventory, Interim Report”; Report Number 887-3-84-8; Connecticut Department of Transportation, Wethersfield CT.
16. Weber, Ray; “States and Capitals”; accessed at: <http://www.50states.com/>;December 2001.

67
ACKNOWLEDGMENTS
•New England Transportation Consortium; Project Sponsor
•John H. Hudson; Connecticut Transportation Institute Special Services Officer
•Connecticut Department of Transportation
•Arkansas State Highway and Transportation Department
•Iowa Department of Transportation
•Maine Department of Transportation
•Maine Office of GIS
•Mass GIS
•Massachusetts Highway Department
•New Hampshire Department of Transportation
•Ohio Department of Transportation
•Rhode Island Department of Transportation
•Texas Department of Transportation
•Vermont Agency of Transportation

APPENDIX A
State Transportation Agency Survey

Photolog Images and Data Acquired on State Roadways
Many state transportation agencies acquire roadway images and other applicable data items by use of ground-based imaging and data collection technology traditionally referred to as photolog or videolog.
This questionnaire has been sent to all New England States and is intended to survey the use of ground-based imaging and data acquisition and retrieval in each state’s transportation agency.
After the surveys have been completed and returned, a summary will be made synthesizing the extent to which this technology is used. Finally, the information gathered will be shared during state visits and in the form of a final report.
Part I of this survey covers imaging. Part II covers data collected from ground-based imaging and any derived information.
SURVEY INFORMATION:
Name of individual completing survey:__________________________________________________
Name of department, agency:__________________________________________________________
Location: City or town:___________________________________________________________
Street address:__________________________________________________________
Telephone: (____) - ________ - ___________
Fax: (____) - ________ - ___________
E-mail: _____________________________
Comments:___________________________________________________________
Please return surveys to: Jason DeGray Transportation Center University of Massachusetts at Amherst 214 Marston Hall Amherst, MA 01003
For questions, please call: Kathleen Hancock (413) 545-0228 [email protected]

I. Images
A. Acquisition:
1. Where Approximate Centerline Mileage
• Interstate highways: ____________
• U.S. Federal roads: ____________
• State-maintained highways: ____________
• Local roads: ____________
• Other facilities: (describe) ____________________ ____________
____________________ ____________
Total: ____________
2. By whom: Approximate % of Total Centerline Miles
• In-house: Name of Unit__________________________ ____________
• Contractor: Name of Contractor____________________ ____________
3. Medium employed for image acquisition: Approximate % of total Centerline Miles
• Film: ____________
• Videotape: Analog ________ ____________
Digital ________
• CD, DVD or Hard Drive ____________
• Other: (describe) _____________________ ____________
4. Areas of the highway environment are captured: (Check all that apply.)
____ Driver’s eye view ahead ____ Right side view
____ Left side view ____ Rear view along road
____ Other: (describe)___________________________________________________________________
5. Indicate the extent to which imagery are being captured.
a. Directional (Check only one.)
____ One direction on all roads ____ Both directions on all roads
____ One direction only on undivided two-lane roads ____ Both directions on undivided two-lane roads
____ Both directions on divided roads ____ Multiple passes on divided roads of three or more
lanes
____ Other: (describe)_____________________________________________________________________
b. Collection cycle: Images are acquired: (Check only one.)
____ once a year ____ once every two years
____ alternating in one direction one year and in the other direction the next year
____ Other: (describe)____________________________________________________________________
c. Distance interval for image acquisition

____ Continuous ____ Every 0.01 miles ____ Other
B. Image Editing / Processing:
1. Editing interval: what is the distance interval between each video/photo frame selected, (e.g., 10 meters; 0.01 mile)? Enter NE if no editing is performed or NA if not applicable. Front view ________________
Left side view _____________
Right side view ____________
Rear view along road _______
Pavement surface __________
Other (describe)_________________________________________________________________
2. Editing done by: ____In-house ____Contractor ____Both
C. Storage:
1. If images are stored digitally, please provide the following information:
a. Compression strategy (i.e., how do you compress your files, e.g., JPEG, Bit Map, TIF, MPEG, etc)?
________________________________________________________
b. Image resolution in pixels (e.g., 640 X 480 pixels)? _________________________
c. Average file size of stored image? _____________________________________________
2. Medium used to store images: (Check all that apply.)
Videotape CD DVD Hard Drive Other
Front View ___ ___ ___ ___ ___
Right side view ___ ___ ___ ___ ___
Left side view ___ ___ ___ ___ ___
Rear view along road ___ ___ ___ ___ ___
Pavement surface ___ ___ ___ ___ ___
Other:__________ ___ ___ ___ ___ ___
D. Internal Distribution of images: ____Yes ____No
If yes, please provide a detailed explanation of how your state currently distributes images to internal users (within the department). This explanation should include the hardware and software components involved as well as the distribution of the viewing stations with respect to management and operational units within your department. (An organizational chart of your department including the number of viewing stations or, perhaps, the viewing capability superimposed next to each unit could be attached to this survey to serve this purpose.)
___________________________________________________________________________________________________
___________________________________________________________________________________________________
___________________________________________________________________________________________________
___________________________________________________________________________________________________
E. External Distribution: _____Yes ______No
Please provide a detailed explanation of how your state currently distributes images to non-state or private sector users.
___________________________________________________________________________________________________
___________________________________________________________________________________________________

II. DATA
A. Data Acquisition:
1. If any of the following physical data items are being collected simultaneously with the images, enter “S” if by the same vehicle collecting the images or enter “O” if by other vehicles made on separate passes.
____ Surface roughness (Intern’l Roughness Index (IRI) or other index) ____ Grade
____ Crossfall or cross slope ____ Cumulative mileage or chainage
____ Texture ____ Transverse profile measurements
____ Roll (deflection about longitudinal axis of vehicle) ____ GPS coordinates (x,y,z) ____ Yaw (heading – rotation about vertical axis of vehicle)
____ Pitch (deflection about transverse axis of vehicle) ____ Skid number
____ Other: (describe) _______________________________________________________________________
2. At what intervals are the data output to files (e.g., 0.001 km; 0.01 mile, etc.)?
______ Surface roughness (Int’l Roughness Index, IRI, or other index) ______ Grade
______ Crossfall or cross slope ______ Cumulative mileage or chainage
______ Texture ______ Transverse profile measurements
______ Roll (deflection about longitudinal axis of vehicle) ______ GPS coordinates (x,y,z) ______ Yaw (heading – rotation about vertical axis of vehicle)
______ Pitch (deflection about transverse axis of vehicle) ______ Skid number
______ Other: (describe) _______________________________________________________________________
3. Indicate roadway geometry that is extracted from imagery. (check all that apply)
____ Number of lanes ____ Lane width
____ Shoulder widths ____ Vertical under clearance
4. Indicate roadway features or appurtenances that are extracted from imagery. (check all that apply)
____ Intersecting roads ____ Bridges and other structures
____ State-defined mileposts ____ HOV lanes
____ Rumble strips ____ Guardrails
____ Signs ____ Signals
____ Crash cushions
5. Indicate references that are incorporated into data files resulting from imagery or onto the imagery itself.
____ Town lines
____ Linear referencing calibration points

B. Processing:
1. Is any of the following information calculated from captured data? If so, are the calculations performed in house or by using a commercially available computer program? (Check all that apply.)
In House Comm. Avail. Program Name Available____ Horizontal curvature ____ ____ ___________________Yes___No___
____ Vertical curvature ____ ____ ___________________Yes___No___
____ Longitudinal profile ____ ____ ___________________Yes___No___
____ Transverse profile ____ ____ ___________________Yes___No___
____ Rutting ____ ____ ___________________Yes___No___
____ Average texture depths ____ ____ ___________________Yes___No___
____ Shim quantities ____ ____ ___________________Yes___No___
2. Are any of the above data used to produce the following? (Check all that apply.)
____ Centerline maps of roadway sections
____ Three dimensional views of a roadway
____ Curb to curb plans.
C. Storage:
Indicate the medium on which data are stored (i.e., diskettes, CDs, DVD, hard drives).
Diskette Videotape CD DVD Hard Drive Other
____ Surface roughness ____ ____ ____ ____ ____ ____
____ Grade ____ ____ ____ ____ ____ ____
____ Crossfall or cross slope ____ ____ ____ ____ ____ ____
____ Cum. mileage/chainage ____ ____ ____ ____ ____ ____
____ Texture ____ ____ ____ ____ ____ ____
____ Transverse profile measurements ____ ____ ____ ____ ____ ____
____ GPS coordinates (x,y,z) ____ ____ ____ ____ ____ ____
____ Vehicle attitude ____ ____ ____ ____ ____ ____
____ Skid number ____ ____ ____ ____ ____ ____
____ Horizontal curvature ____ ____ ____ ____ ____ ____
____ Vertical curvature ____ ____ ____ ____ ____ ____
____ Longitudinal profile ____ ____ ____ ____ ____ ____
____ Transverse profile ____ ____ ____ ____ ____ ____
____ Rutting ____ ____ ____ ____ ____ ____
____ Average texture depths ____ ____ ____ ____ ____ ____
____ Shim quantities ____ ____ ____ ____ ____ ____

D. Distribution:
Do you make any of this information available outside of your department? If yes, please provide the appropriate contact information for any such person/department/agency.
Name of department, agency: __________________________________________________
Name of contact individual: __________________________________________________
Location:
City or town: ____________________________________________________________________
Street address: ____________________________________________________________________
Telephone: ( ____ ) - ________ - ___________
Fax: ( ____ ) - ________ - ___________
E-mail: _____________________________
Additional information: _________________________________________________________________________
______________________________________________________________________________________________
E. External distribution:
Do you make any of this information publicly available? If yes please indicate the means by which it is available.
Publicly Available CD Web By Contact
Yes ____ No ____ if yes ____ ____ ____
If this information is made available to the public by requesting the information directly “by contact”, please provide the appropriate contact information were request should be sent. Name of department, agency: __________________________________________________
Name of contact individual: __________________________________________________
Location:
City or town: ______________________________________________________________________
Street address: ______________________________________________________________________
Telephone: ( ____ ) - ________ - ___________
Fax: ( ____ ) - ________ - ___________
E-mail: _____________________________
Additional information: ___________________________________________________________________________
________________________________________________________________________________________________

APPENDIX B
GIS Agency Survey

Video / Photolog and GIS
Many state transportation agencies acquire roadway images and other applicable data items using ground-based imaging and data collection technology traditionally referred to as photolog or videolog.These data are potentially valuable for use in GIS applications.
This questionnaire has been sent to information system departments across the six New England states. The intent is to gather information about what data you collect and manage and if/how you use video/photologs.
After the surveys have been completed and returned, a summary will be developed about the extent to which GIS is used in conjunction with ground-based imaging technology. Finally, the information gathered will be shared during state visits and in the form of a final report.
SURVEY INFORMATION:
Name of individual completing survey:__________________________________________________
Name of department,
agency:__________________________________________________________
Location: City or town:___________________________________________________________
Street address:__________________________________________________________
Telephone: (____) - ________ - ___________
Fax: (____) - ________ - ___________
E-mail: _____________________________
Additional information:___________________________________________________________
______________________________________________________________________________
Please return surveys to: Jason DeGray Transportation Center University of Massachusetts at Amherst 214 Marston Hall Amherst, MA 01003
For questions, please call: Kathleen Hancock (413) 545-0228 [email protected]

I. Geographic Information Systems
What Geographic Information System (GIS) do your agency use? (check all that apply)
___None
___CADD (Computer Aided Drafting/Design) only
___ArcInfo / ArcView
___Integraph
___Caliper
___Other (describe)________________________
What forms of spatial location referencing systems does your agency use? (check all that apply)
___Latitude and longitude
___State plane coordinates
___Mileposts
___Chainage
___Other (describe)_________________________________________
What form of data warehousing does your agency use? (check all that apply)
___Centralized warehouse: (data are located in a single location with remote access to users.)
___Distributed warehouse: (data are located in distributed locations with remote access to users.)
___Local: (data are located on local systems with local access only.)
___Other (describe)________________________________________

II. Roadway Information
A. Data Provided:
1 Does your agency collect or manage any of the following data and are they spatially referenced (does it explicitly have location attached to it)? (Please check all that apply.)
Interstates Other Federal Roads State Roads Local Roads Other
Route number
Speed limit
Number of lanes
Lane width
Shoulder widths
Median type
Median width
Curbs present
Sidewalk width
Vertical under clearance
Intersecting roads
Bridges
Town lines
Linear referencing calibration points
State-defined mileposts
HOV lanes
Rumble strips
Guardrails
Signs
Signals
Crash cushions
Surface roughness (IRI or other index)
Grade
Crossfall or cross slope
Cumulative mileage / chainage
Road surface type
Transverse profile measurements
GPS coordinates (x,y,z)
Yaw (heading – rotation about vertical axis of vehicle)
Roll (deflection about longitudinal axis of vehicle)
Pitch (deflection about transverse axis of vehicle)
Skid number
Toll road
Other (specify)_________________

3. If applicable, what is the distance interval between data points?
____ Continuous ____ Every .01 miles
____ Other
4. How often are the data updated?
_________________________________________________________________________
6. When was the last time the data were updated?
_________________________________________________________________________
II. Data Source
F. Means
6. By what means is the roadway data acquired, where do you get your data? ______________________________________________________________________
______________________________________________________________________
7. If videolog imaging is used for any of the above please describe how.
______________________________________________________________________
______________________________________________________________________
______________________________________________________________________
______________________________________________________________________
8. Does your agency plan to use videolog imaging in the future in association with GIS activities?
____ Yes
____ No
____ Unknown

III. Data Background
A. Origin
1. If data were gathered by an outside agency please describe by who, and provide the appropriate contact information. ___________________________________________________________________________
___________________________________________________________________________
___________________________________________________________________________
___________________________________________________________________________
___________________________________________________________________________
B. Manipulation
1. What GIS software and hardware was used to digitize the roads?
___________________________________________________________________________
___________________________________________________________________________
C. Distribution
Do you make any of this information available outside of your department? If yes please provide the appropriate contact
information for any such person/department/agency.
Name of department, agency: __________________________________________________
Name of contact individual: __________________________________________________
Location:
City or town: __________________________________________________
Street address: __________________________________________________
__________________________________________________
Telephone: ( ____ ) - ________ - ___________
Fax: ( ____ ) - ________ - ___________
E-mail: _____________________________
Additional information: _______________________________________________________
____________________________________________________________________________
____________________________________________________________________________
____________________________________________________________________________
____________________________________________________________________________
____________________________________________________________________________

APPENDIX C
Maine Automated Shim Analysis Program User’s Guide
AUTOMATED SHIM ANALYSIS PROGRAM for Windows Version 00.12.06
Customized Software Developed and Written By
Keith A. Fougere, P. E.
Maine’s ARAN operation and software supported through:
Maine Department of Transportation Bureau of Planning, Research & Community Services
Pavement Management Section 16 Statehouse Station Augusta, Me. 04333
(207) 624 - 3304
Base translation and raw processing programs supplied by the Roadware Corporation.

TABLE OF CONTENTS
INTRODUCTION ................................................ 1
USER GUIDE ....................................................... 2 Printing the field sheets................................. 2 Opening the asap program............................. 3 Reloading a previous project........................ 3 Entering desired slopes and depths............... 4
INSTALLATION INSTRUCTIONS ................... 5 Mapping a drive............................................ 5 Copying the asap program to your computer 6 Updating the asap program........................... 7
NOTES ................................................................. 8

INTRODUCTION
The new ASAP has been tested and is believed to provide results similar to the original version, however, as with any new software, you should question the results until you feel comfortable with them. Any bugs found or enhancements desired should be forwarded to the Pavement Management section. There will be two folders on DOTAUG1\$Com-Cons\ named ‘Asap’ and ‘AsapProjects’. The ‘Asap’ folder contains the latest version of the asap program. The ‘AsapProjects’ folder contains the latest version of this manual and all of the shim runs in the state that have been requested and completed. There is also a readme file in the asap folder showing the latest information about the program. The instructions to access DOTAUG1\$Com-Cons\asap are given in the installation section of this manual. The first section of this manual is the User Guide, assuming the Shim program has already been installed on your computer. If it has not been installed, follow the instructions beginning on page 5 of this manual.

USER GUIDE
Printing the Field Sheets Before using the Shim program, you will need to print the field sheet to get the file numbers, file direction (upchain or downchain) and rutbar width. From Windows Explorer scroll down to the drive that connects to DOTAUG1\$Com-cons and double click. Then double click ‘asapprojects’. Double click the project you are looking for and then right click on the excel file and select ‘print’. .

Opening the ASAP program From the desktop double click the ASAP program icon and select the path to the ARAN shim data files. These files can be accessed from a disk in Drive a: or in the DOTAUG1\ $Com-Cons\’asapprojects’ folder. Click on the project needed so that the 1M0 files show in the left window. Click the ‘copy 1M0 files’ button and then the ‘process 1M0’ button. The program will not run if these steps are not followed. The .1mo files must be copied using the ‘copy 1mo’ button. Placing them in the C:\program files\asap\1mo directory without using the command button will not work at present. Once you have copied the 1m0 files, you will be working only on your PC’s hard drive. If a project needs to be moved to another computer, files with the ‘.shm’ extension in the C:\program files\asap folder will need to be copied to the same folder on the new computer. Next click the ‘list raw files’ button and highlight the file for the upchain run. These files are shown on the field sheet you just printed. Click the ‘select upchain ‘ button and repeat for the downchain. Select the proper width (shown on field sheet) and then process the run. Once the project has been loaded you will be presented with a cross section of the first station. In the upper left corner, there are drop down menu’s, which are hopefully self-explanatory. Be sure to set slopes to existing from the ‘Slopes Menu’
Following are a few notes relating to these menus.
File Menu - Load slopes and depths- If loading a previous job, use this to reload info. - Save slopes and depths - SAVE OFTEN View Menu - Zoom in and out - will change the vertical scale Show and Hide - will toggle info on the cross section off and on. Move Menu - Shows the F keys that can be used to move from station to station.
Slopes - ‘Set slopes on a range of stations’ will allow the same slopes to be applied to a group of stations. Be sure to enter a slope in each box or it will kick you out of the program
Reloading a project If the project has already been processed and is the last one accessed, you can click the ‘Plot Current Job’ button to return to the job you are working on. If the job has been processed but is not the last one you worked on, then click on the ‘List Raw Files’ button and load the correct upchain and downchain files. Once the first station is shown you will have to ‘Load slopes and depths’ from the File menu to get previously saved information to load.

Entering Desired Slopes and Depths Before entering any info, go to the ‘Slopes’ menu and select ‘Set all slopes to existing’. This will ensure the job is beginning with the proper transverse profile. Double click in the white text boxes to enter the information required for that station. After entering click on the ‘Update’ button to view the changes. The white text boxes and update button change design parameters for the current cross section only. (Except for the lane width, which is reset for the entire project). The menu items change design parameters for the entire project. If you should need to analyze a narrower section of roadway, you can change the lane width in the box below the Update button. This will affect the entire project and allowances should be made for missing quantities if necessary. REMEMBER TO ‘SAVE SLOPES AND DEPTHS’ OFTEN

INSTALLATION INSTRUCTIONS
Mapping a drive from ‘Windows Explorer’ to DOTAUG1/$Com-cons.From Windows explorer click on the ‘Tools Menu’ and then click on ‘Map Network
Drive’. Use the drive letter automatically selected or choose a letter not in use from the drop down box by clicking on the down arrow and clicking on the desired letter. Check off the box that says ‘Reconnect at Logon’. Next look at the list of ‘shared directories’ and double click on‘DOTAUG1’, then double click on the ‘$Com-Cons folder. You have now mapped a drive that can be accessed from Windows Explorer by scrolling down to the $Com-Cons drive. This is where the ‘ASAP’ and ‘ASAPprojects’ files will be kept.

Copying the ASAP program to the ‘C:\Program files’ folder Open Windows Explorer and scroll down to the left section of the window to the $Com-Cons folder and double click. Next find the ASAP folder and right click and then left click on ‘copy’. Now scroll up to the ‘Program Files’ folder and right click and then left click on ‘paste’. You should now have the ASAP folder under the ‘program files’ folder. To check, double click on the ‘program files’ folder. If the ASAP folder is not listed, repeat the previous steps. The ASAP program has to be in the ‘program files’ folder in order to run properly. Open c:\program files\asap and click and drag the asap.exe file onto the desktop To run the shim program just double click the ASAP icon on the desktop. If you experience problems starting or running the program, check the readme file in the asap folder, you may need to copy files from C:\program files\asap\support to the C:\winnt\system32 folder.

Updating the Program To update to the latest version, copy DOTAUG1\$Com-cons\asap\asap.exe to C:\program files\asap. NOTE that there is an asap folder and an asap file. Do not copy the whole folder as you may lose any saved work from the 1mo and raw files. You should get a message asking you to replace the existing file. Click yes. The latest User Manual is located in the ‘asapprojects’ folder.

NOTES
1. We have found that some existing slopes are not coming in correctly. Please go to the slopes menu and select the ‘set slopes to existing on all stations before beginning your project.
2. REMEMBER TO ‘SAVE SLOPES AND DEPTHS’ OFTEN.
3. Check to see if you have the latest versions of the asap program and the user manual.
4. Questions can be directed to Bob Watson (624-3304) or Don Young (624-3294)
5. If you experience problems starting the program, make sure the desktop Icon shortcut is pointing to C:\program files\asap. You can check this by right clicking on the icon and select ‘properties’ and the shortcut tab. The target window should read"C:\Program Files\Asap\asap.exe" and the ‘Start in’ window should read “C:\program files\asap”


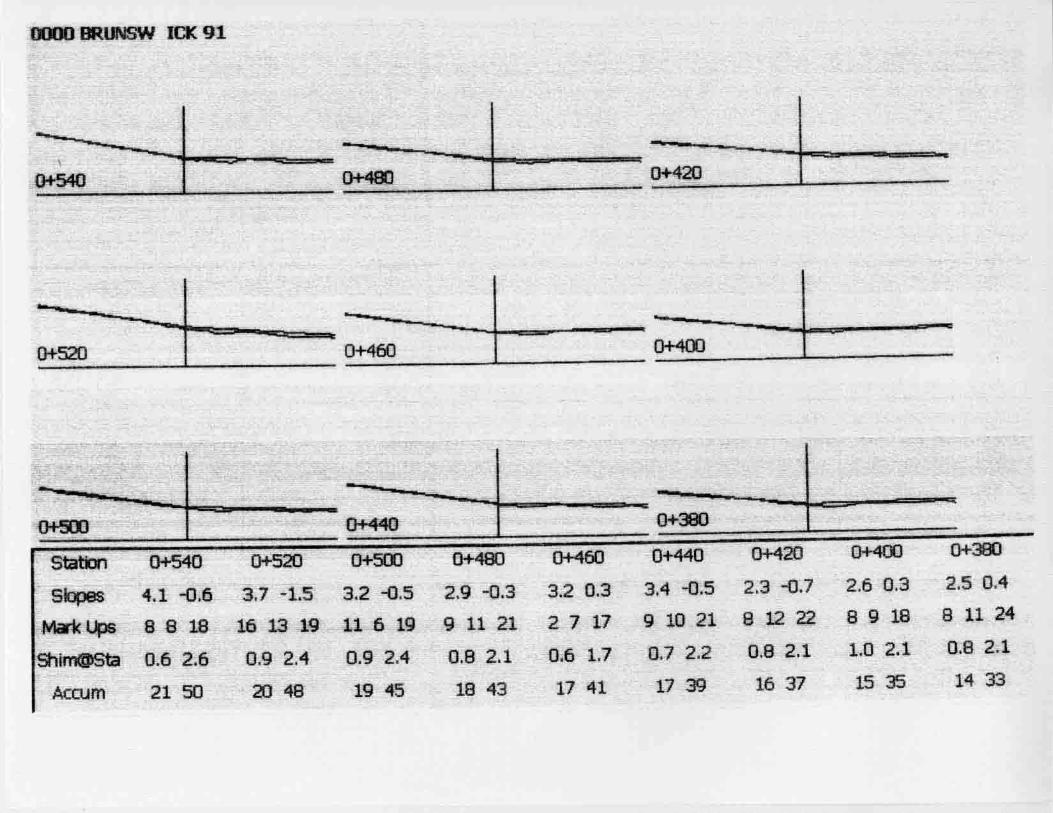


APPENDIX D
New Hampshire Manual of Instructions For Road Inventory


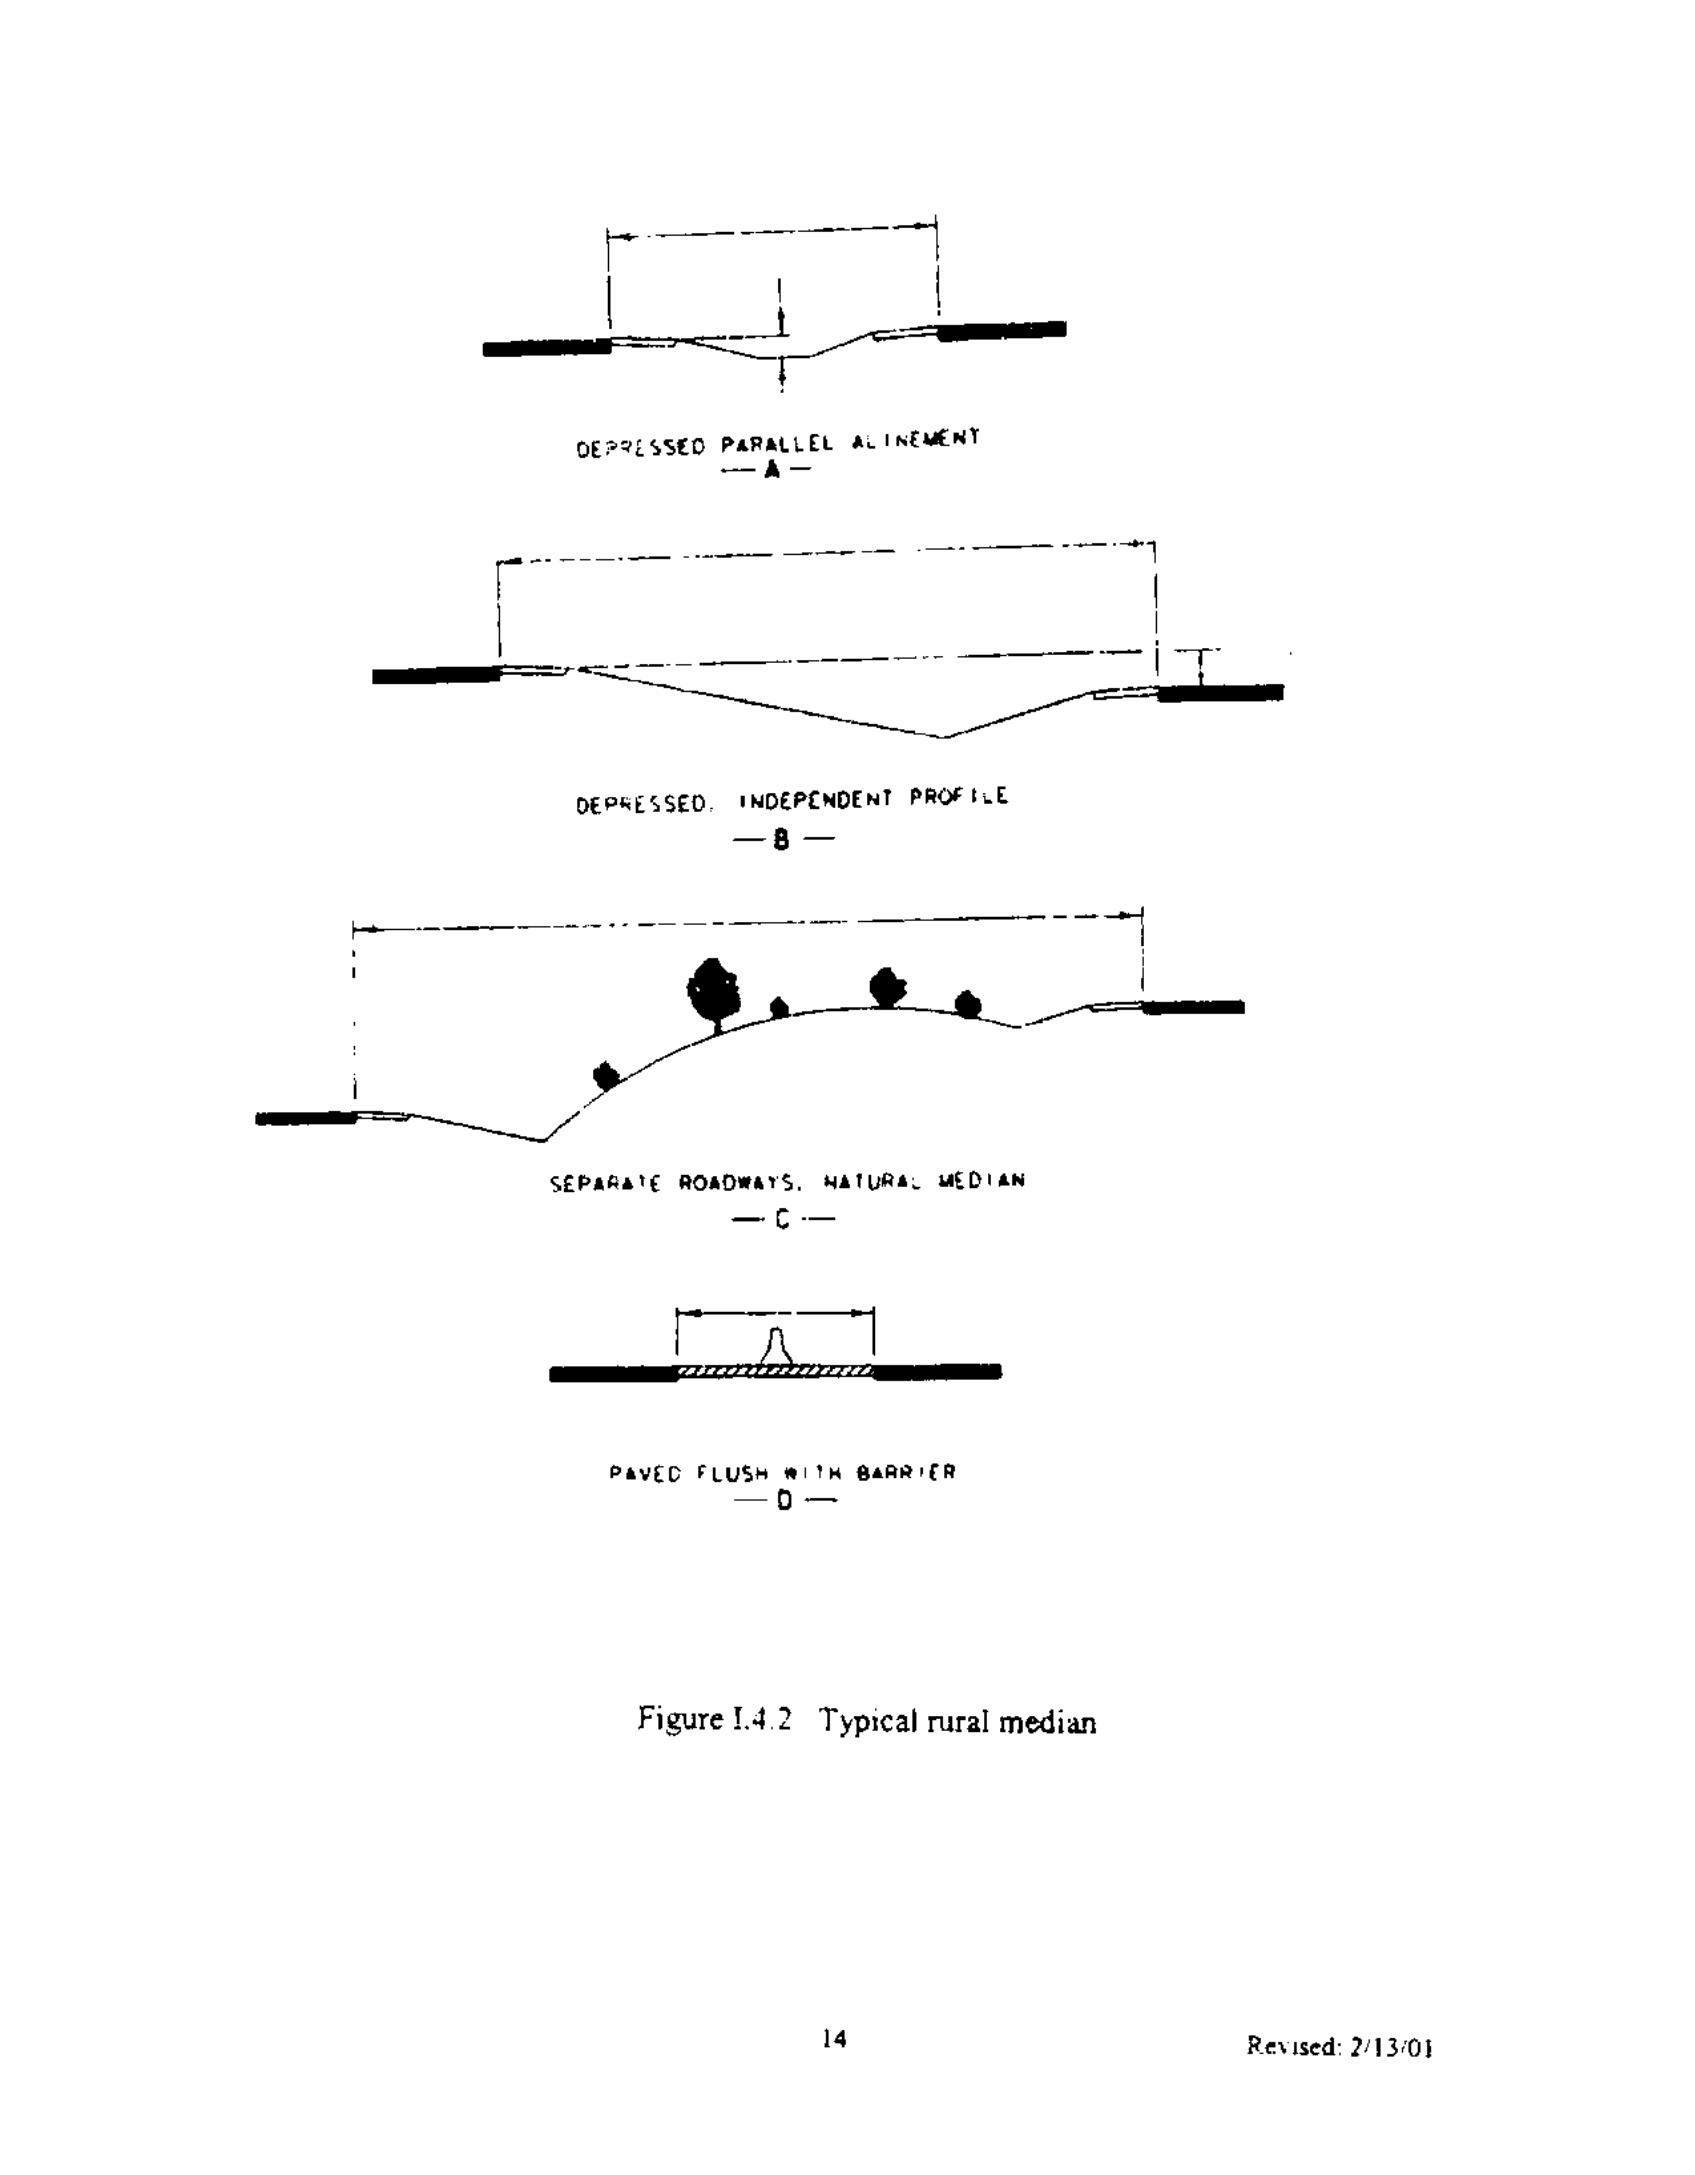
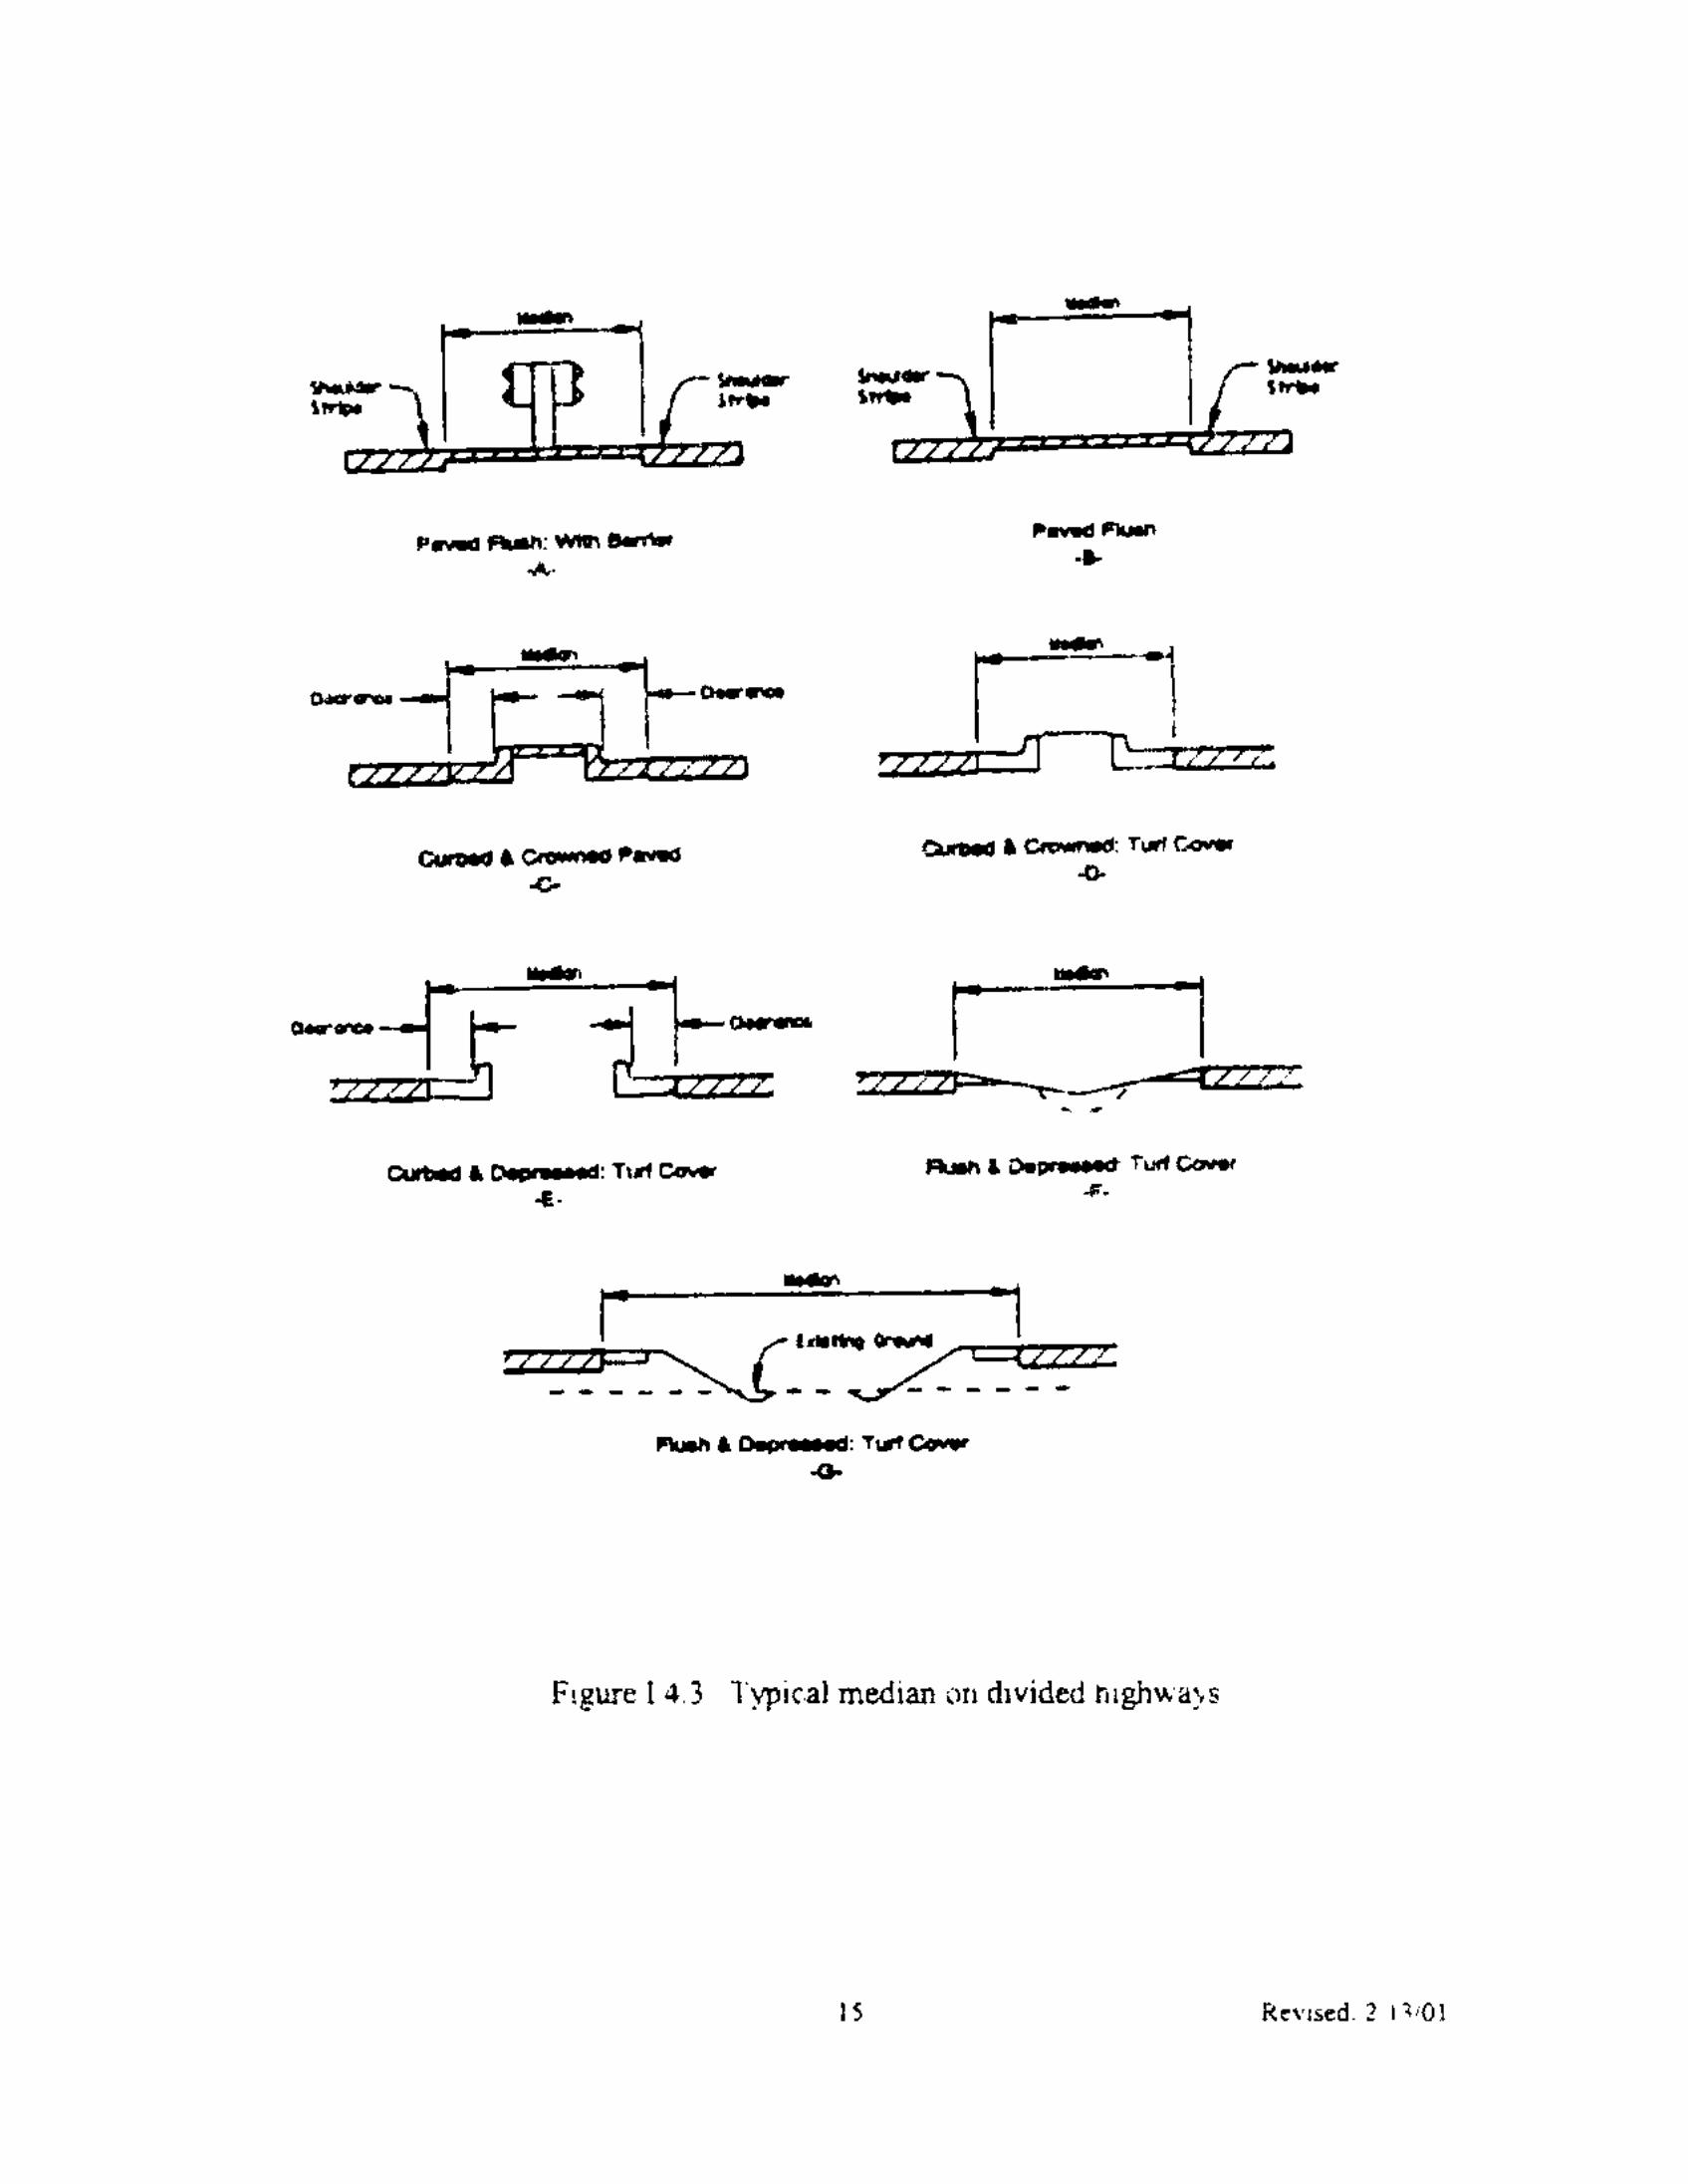

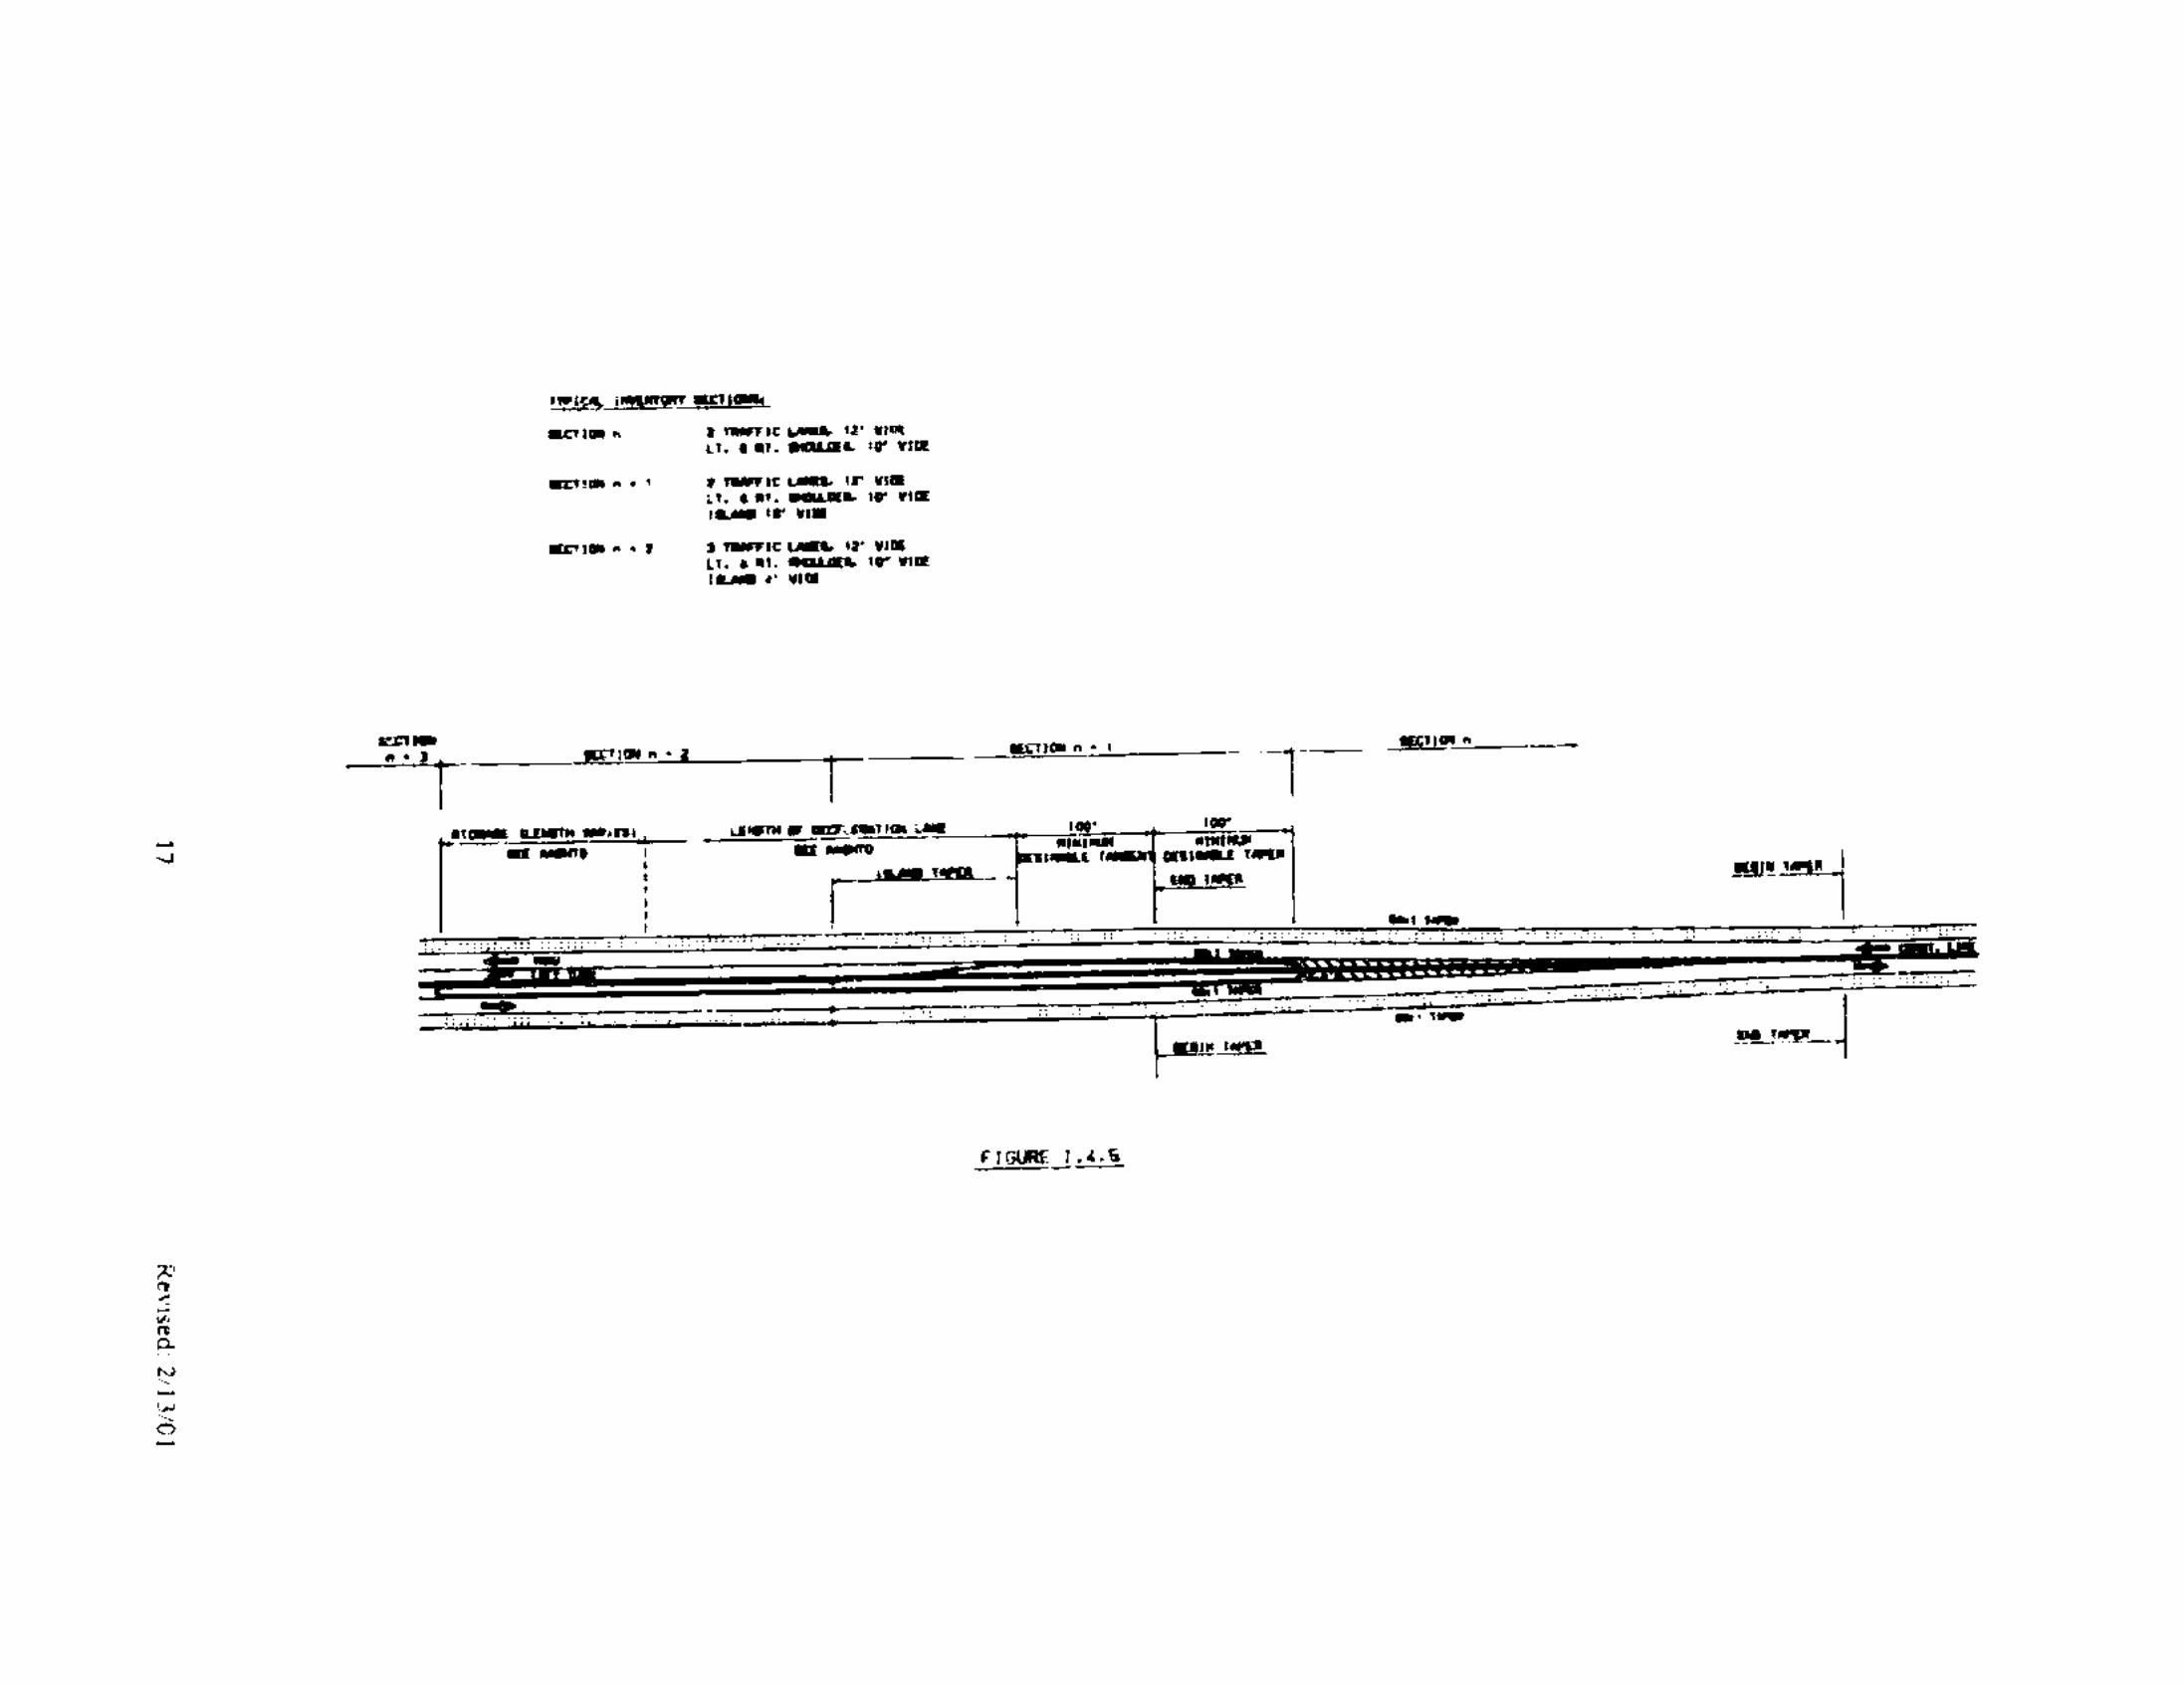

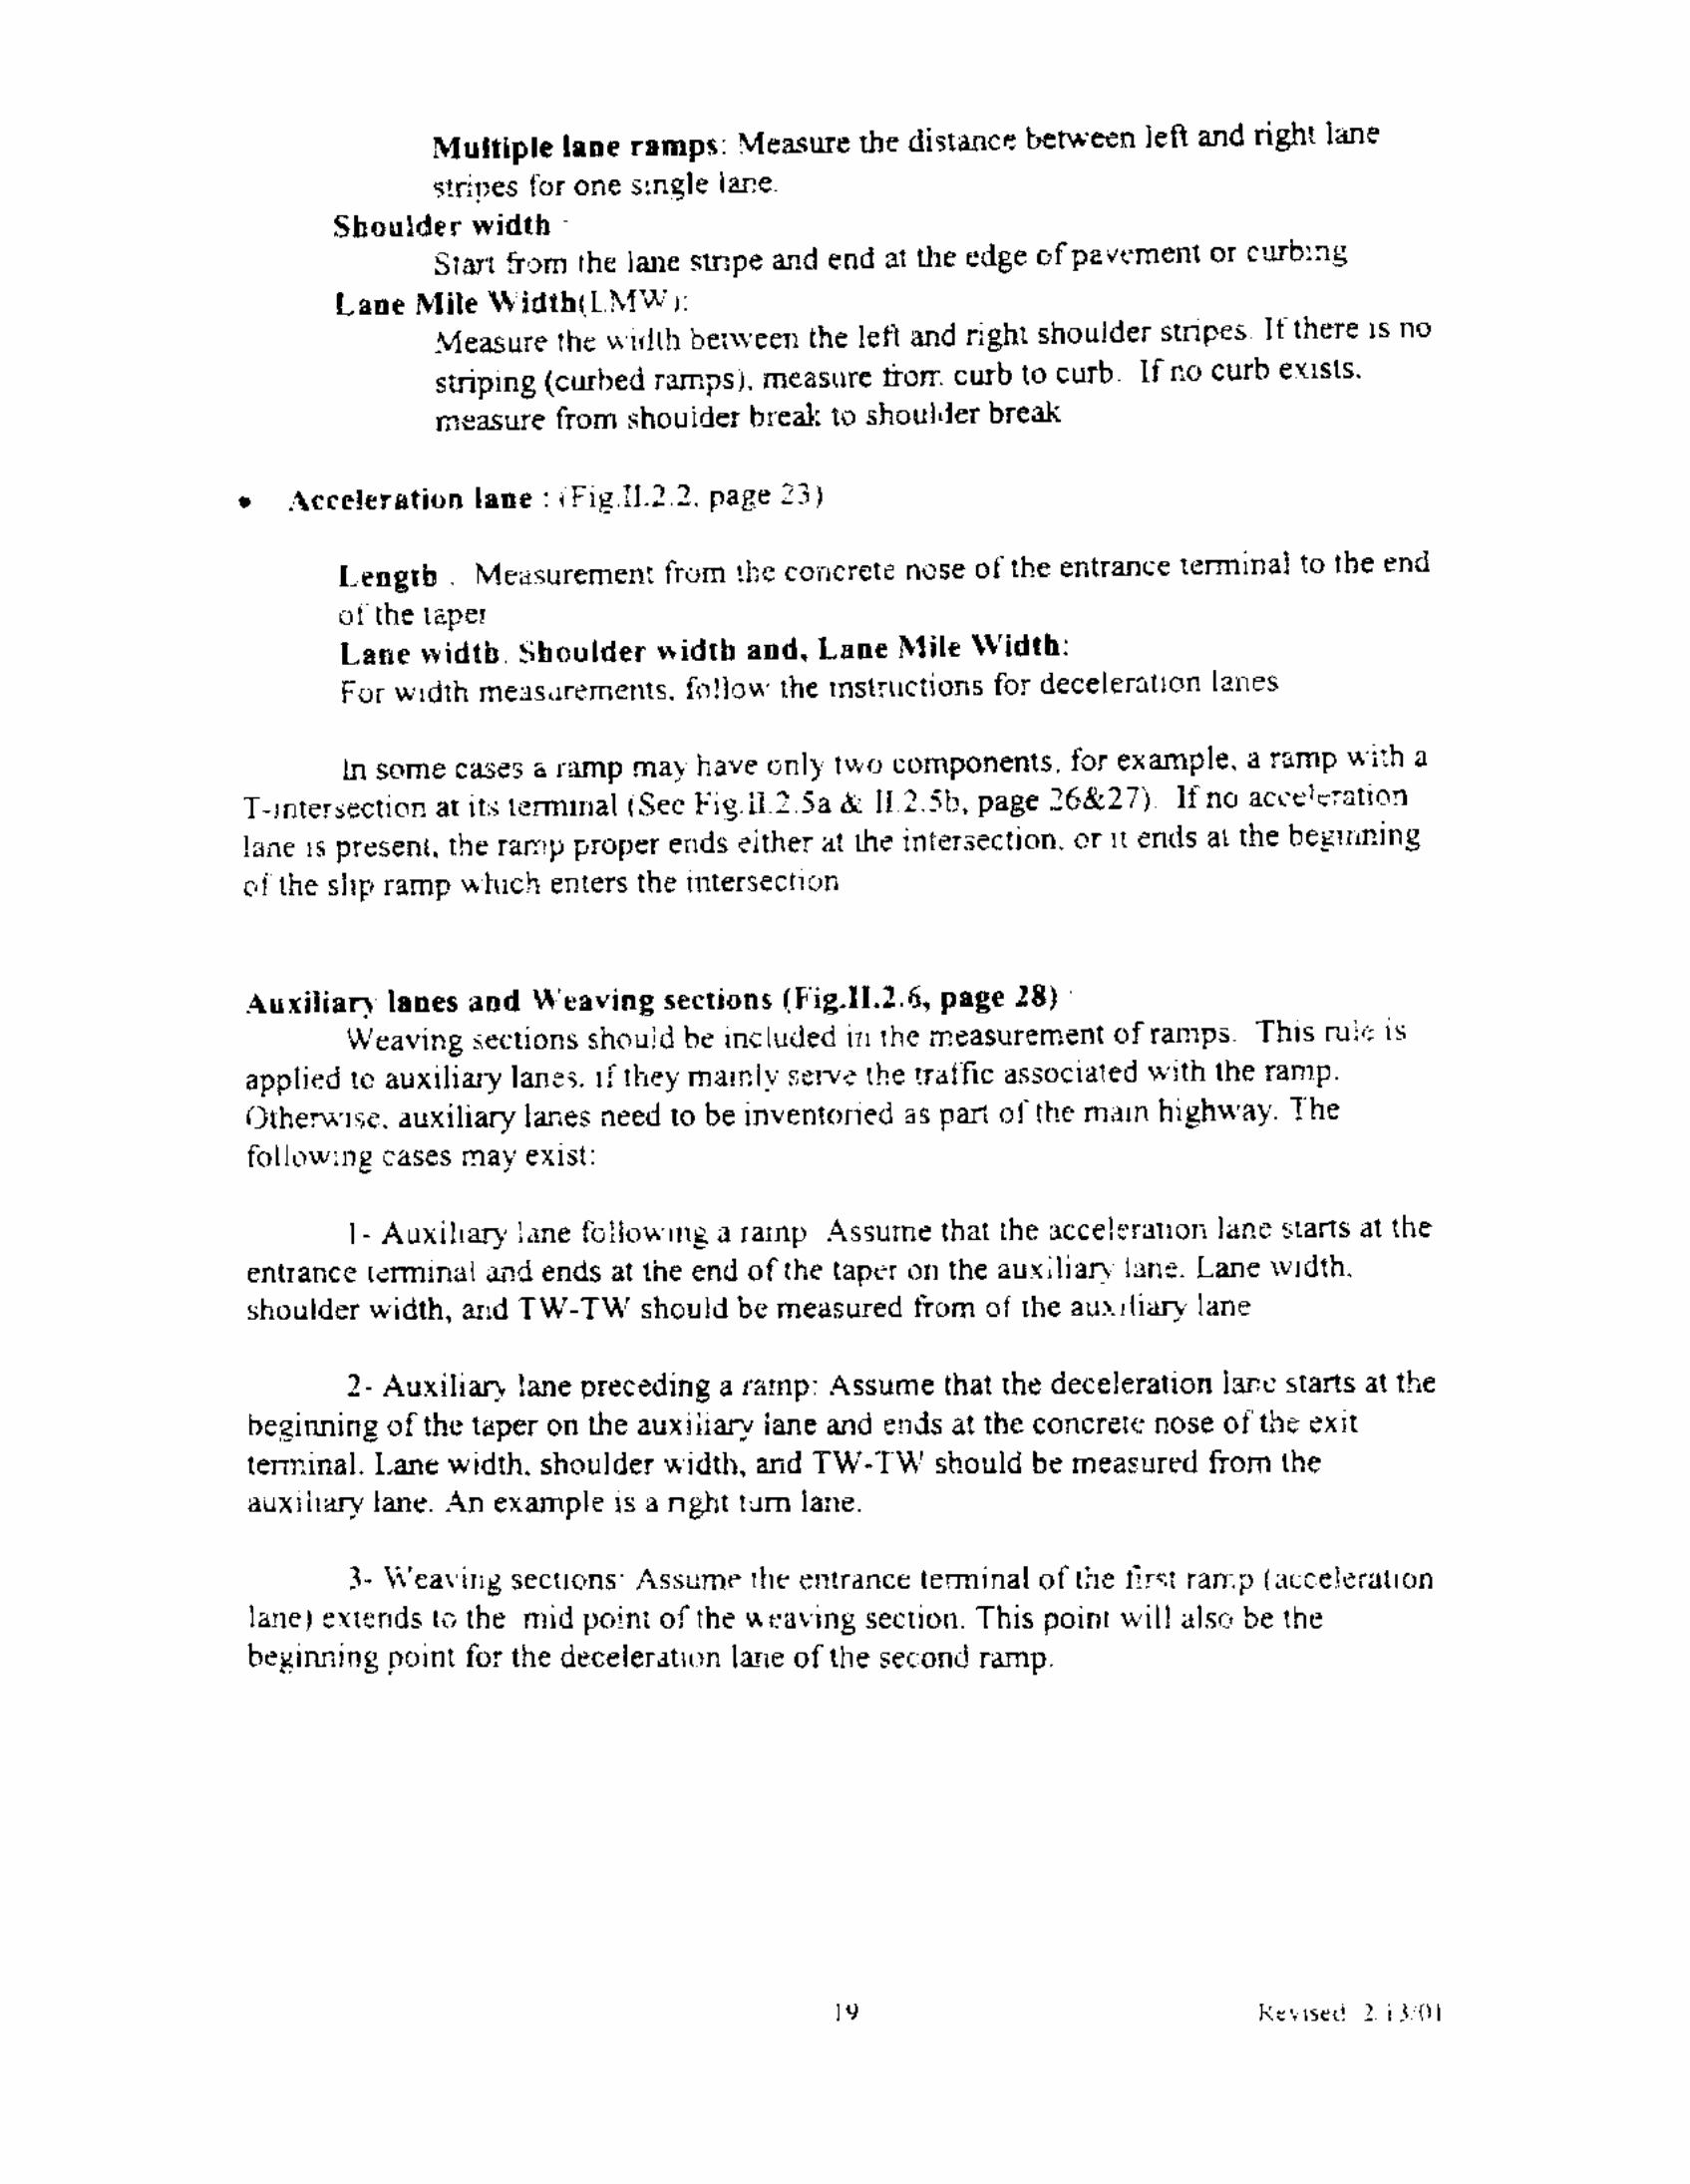

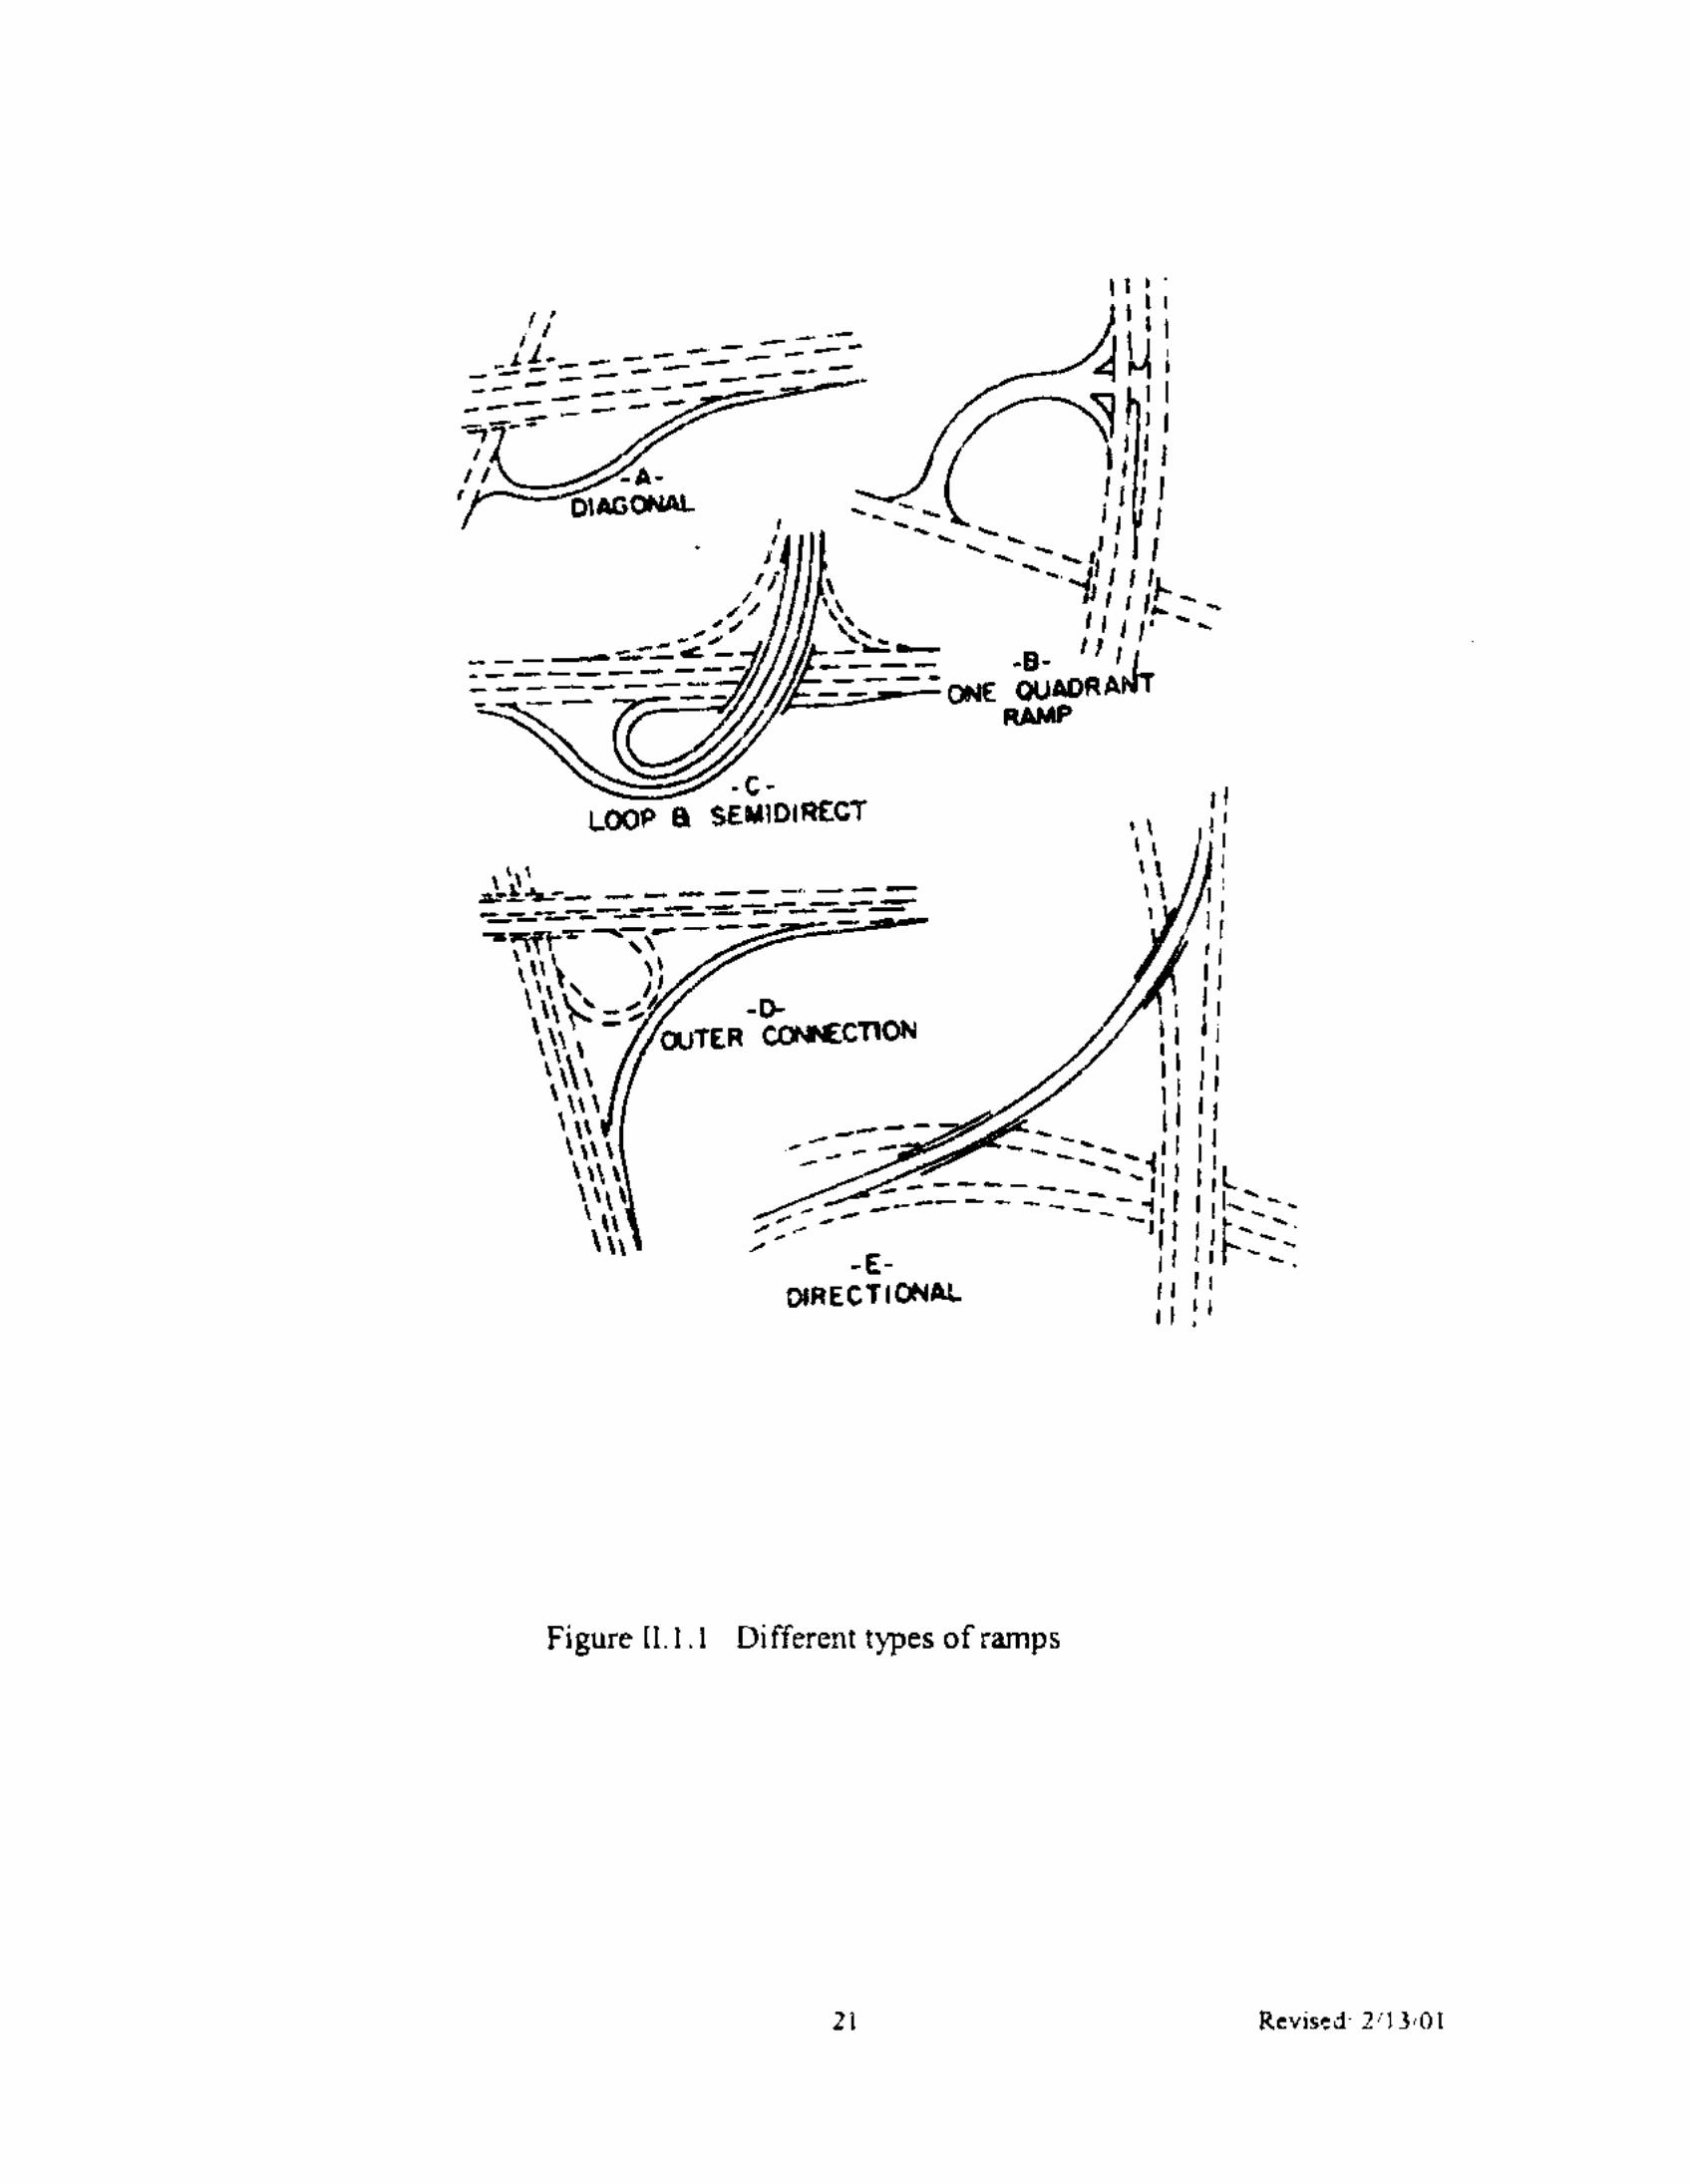


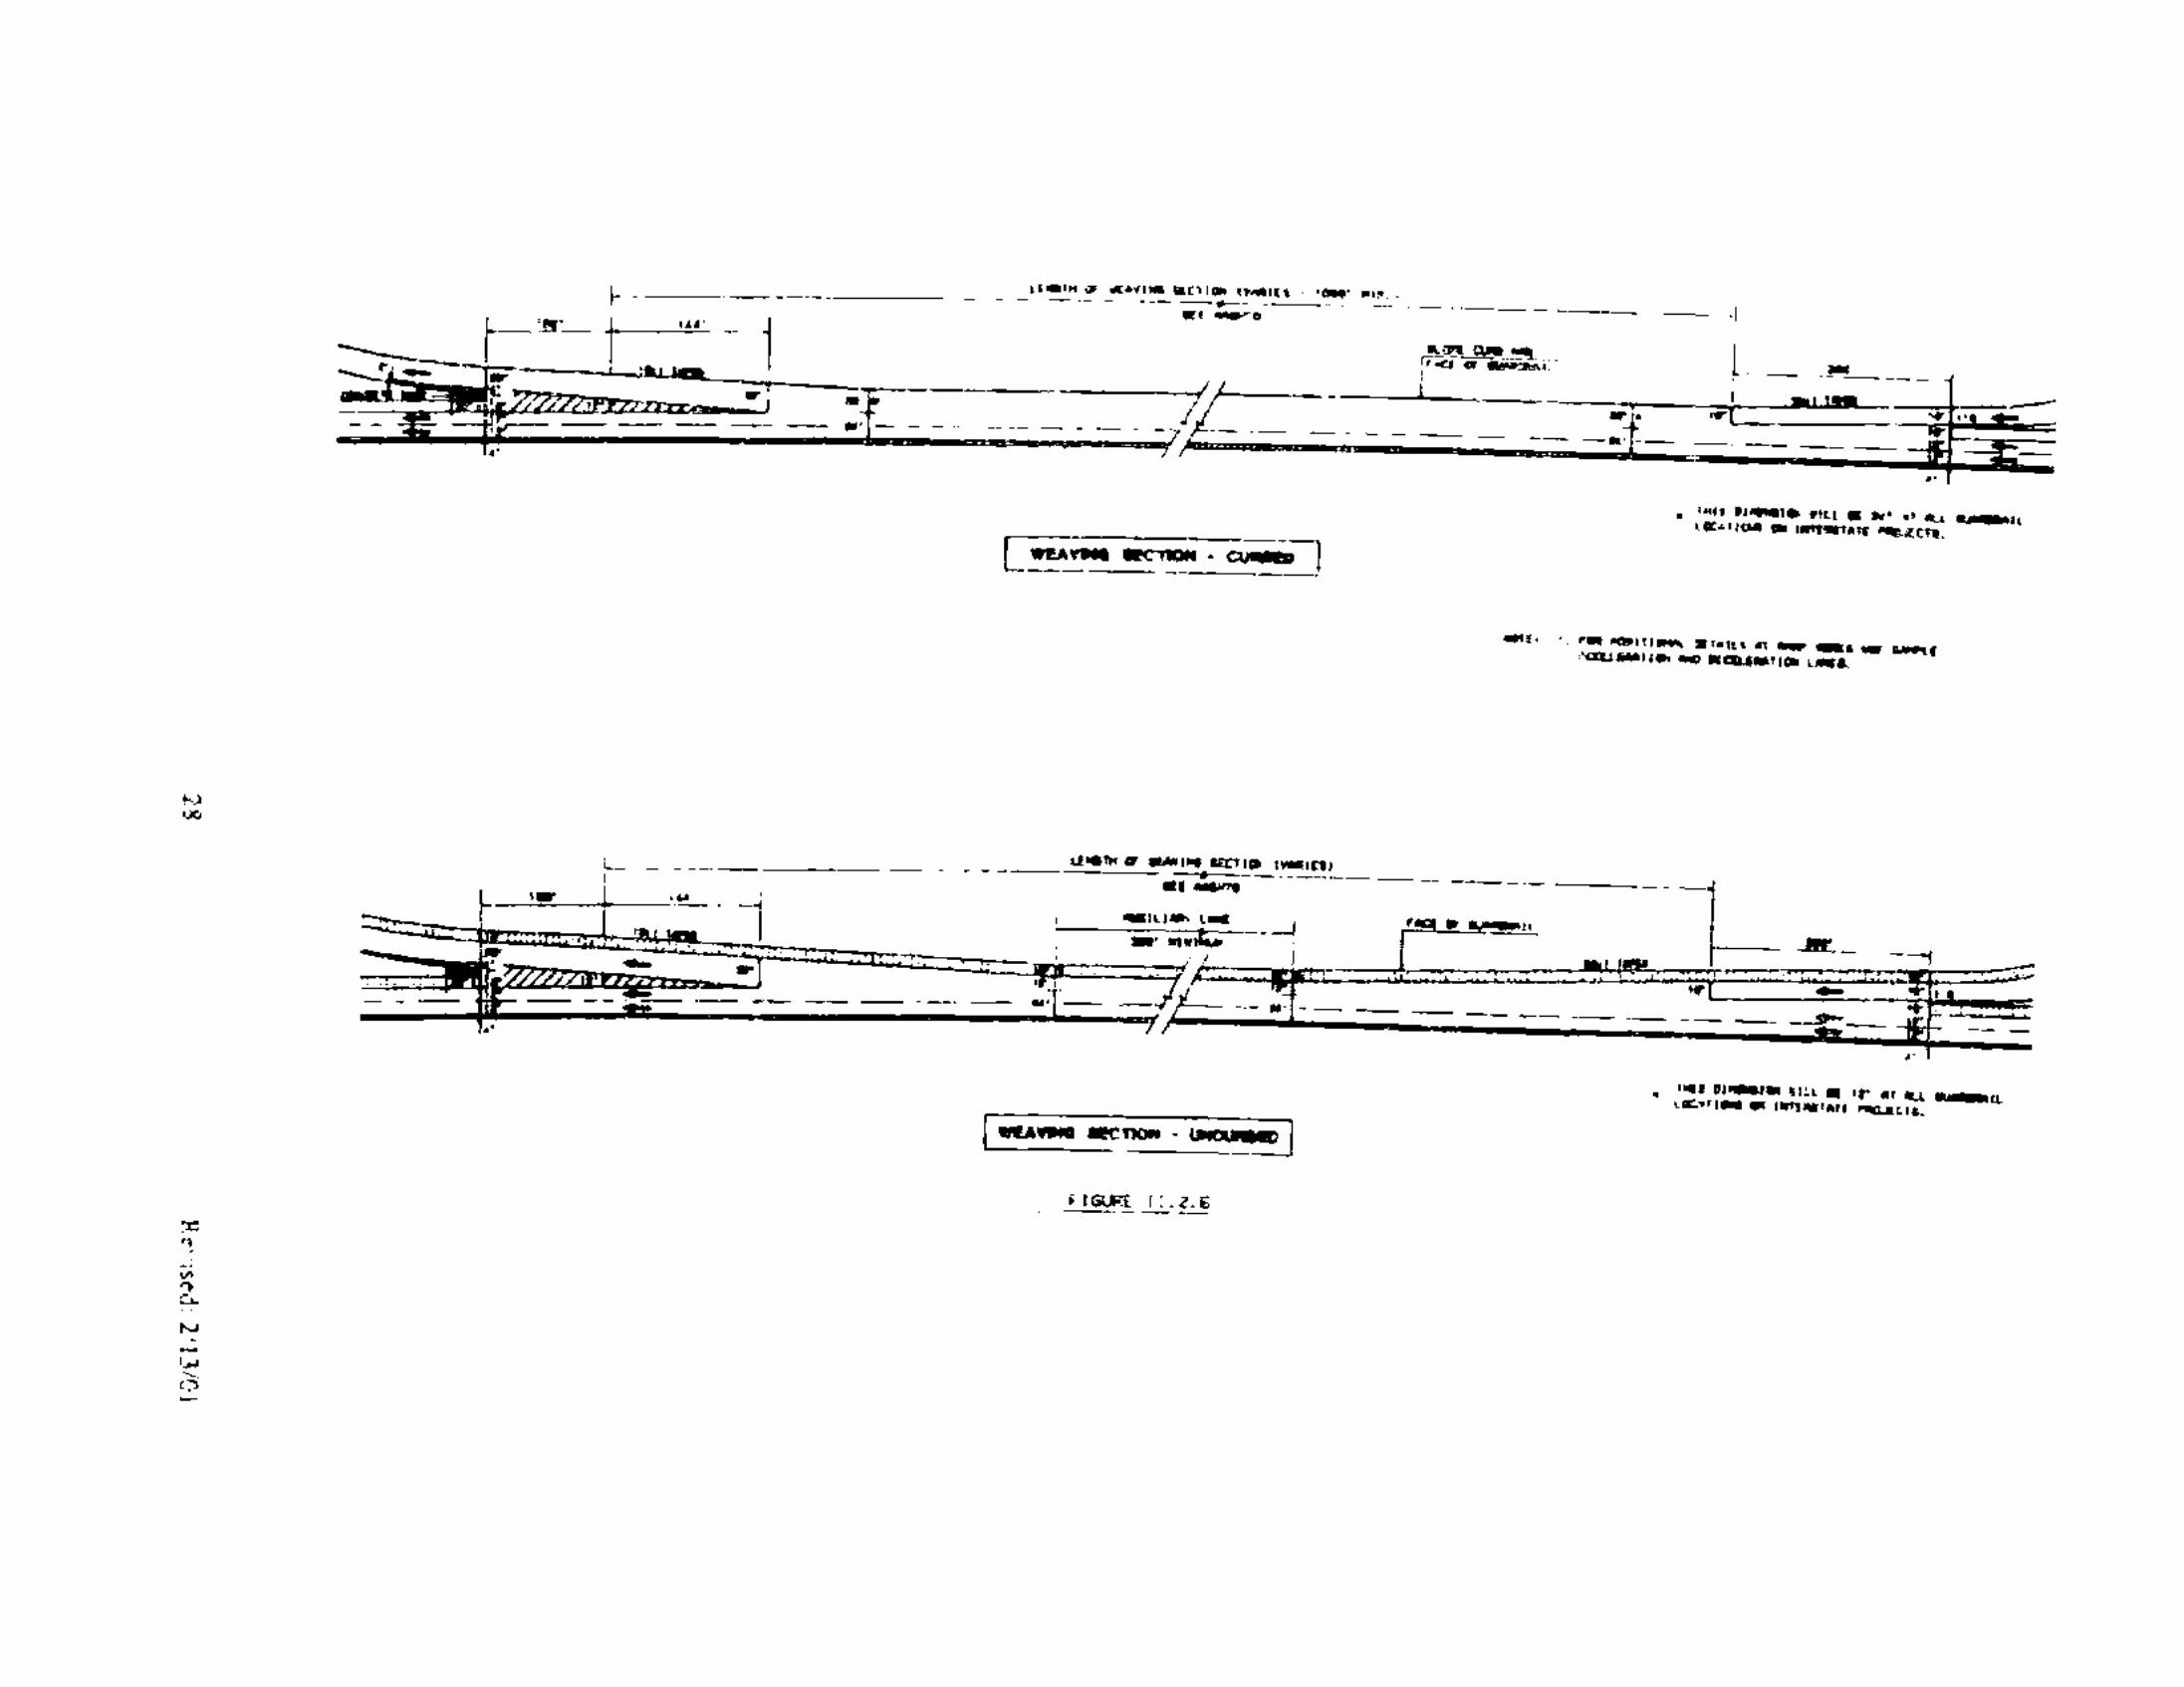


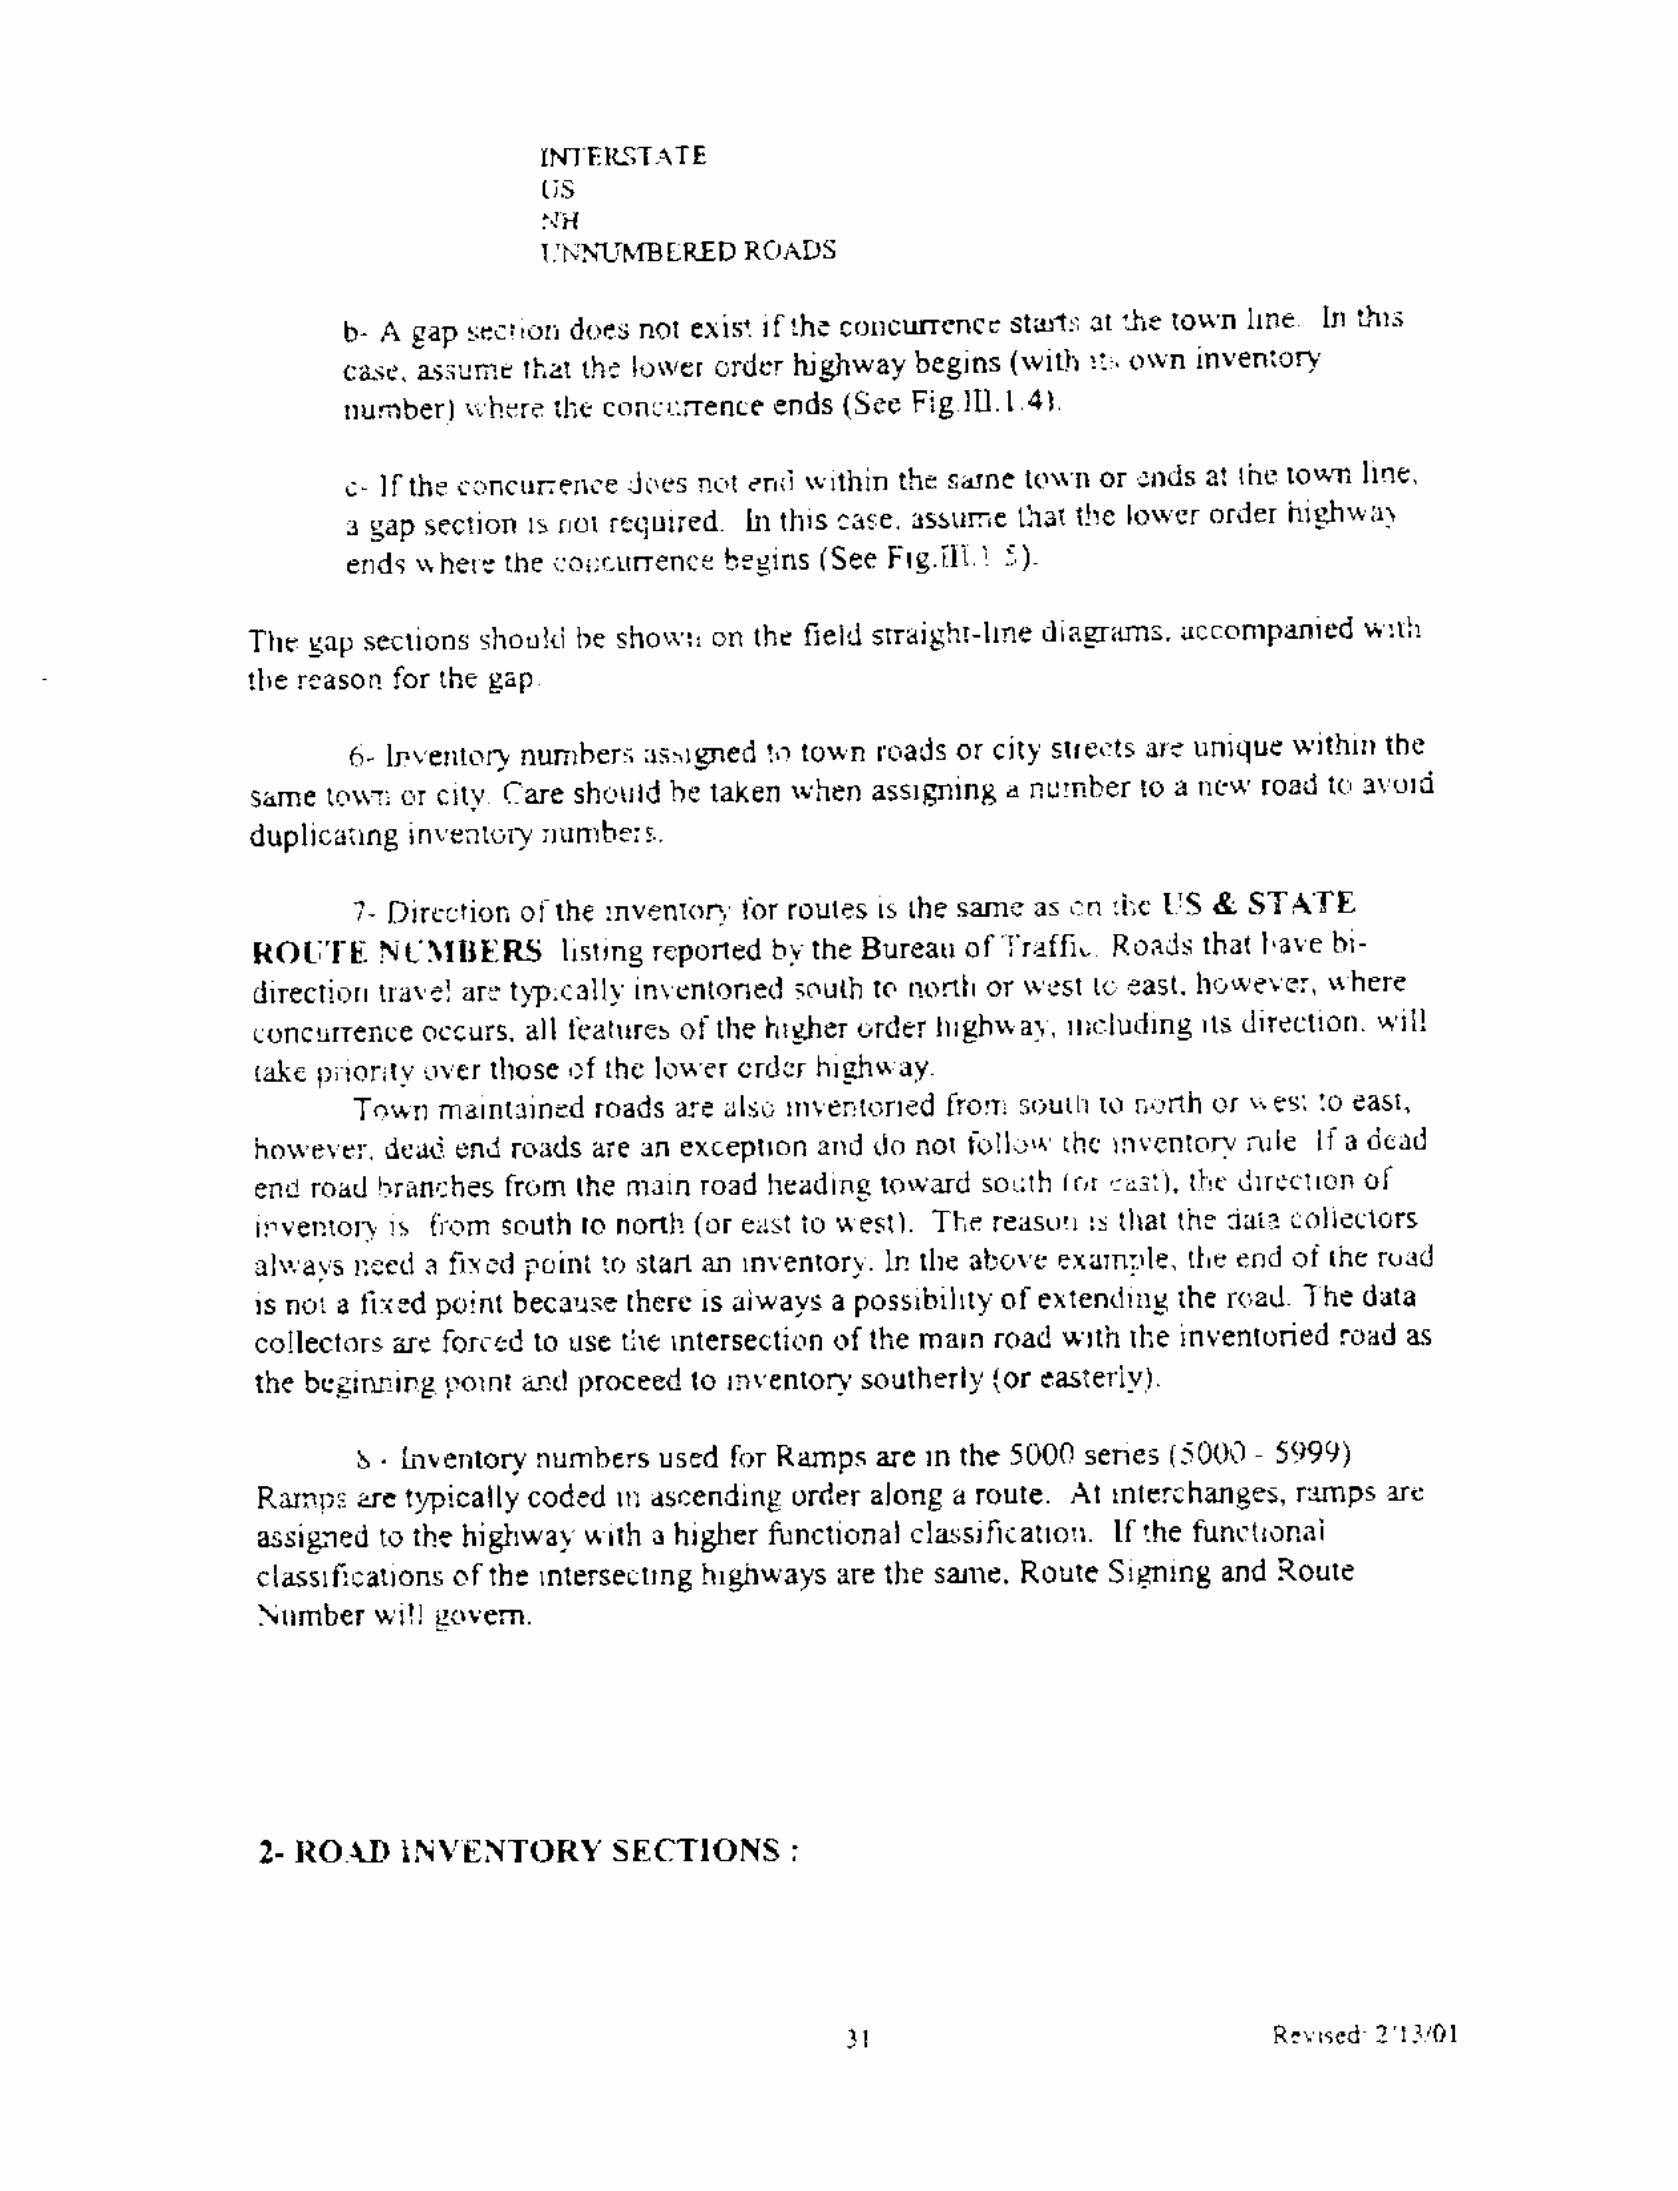


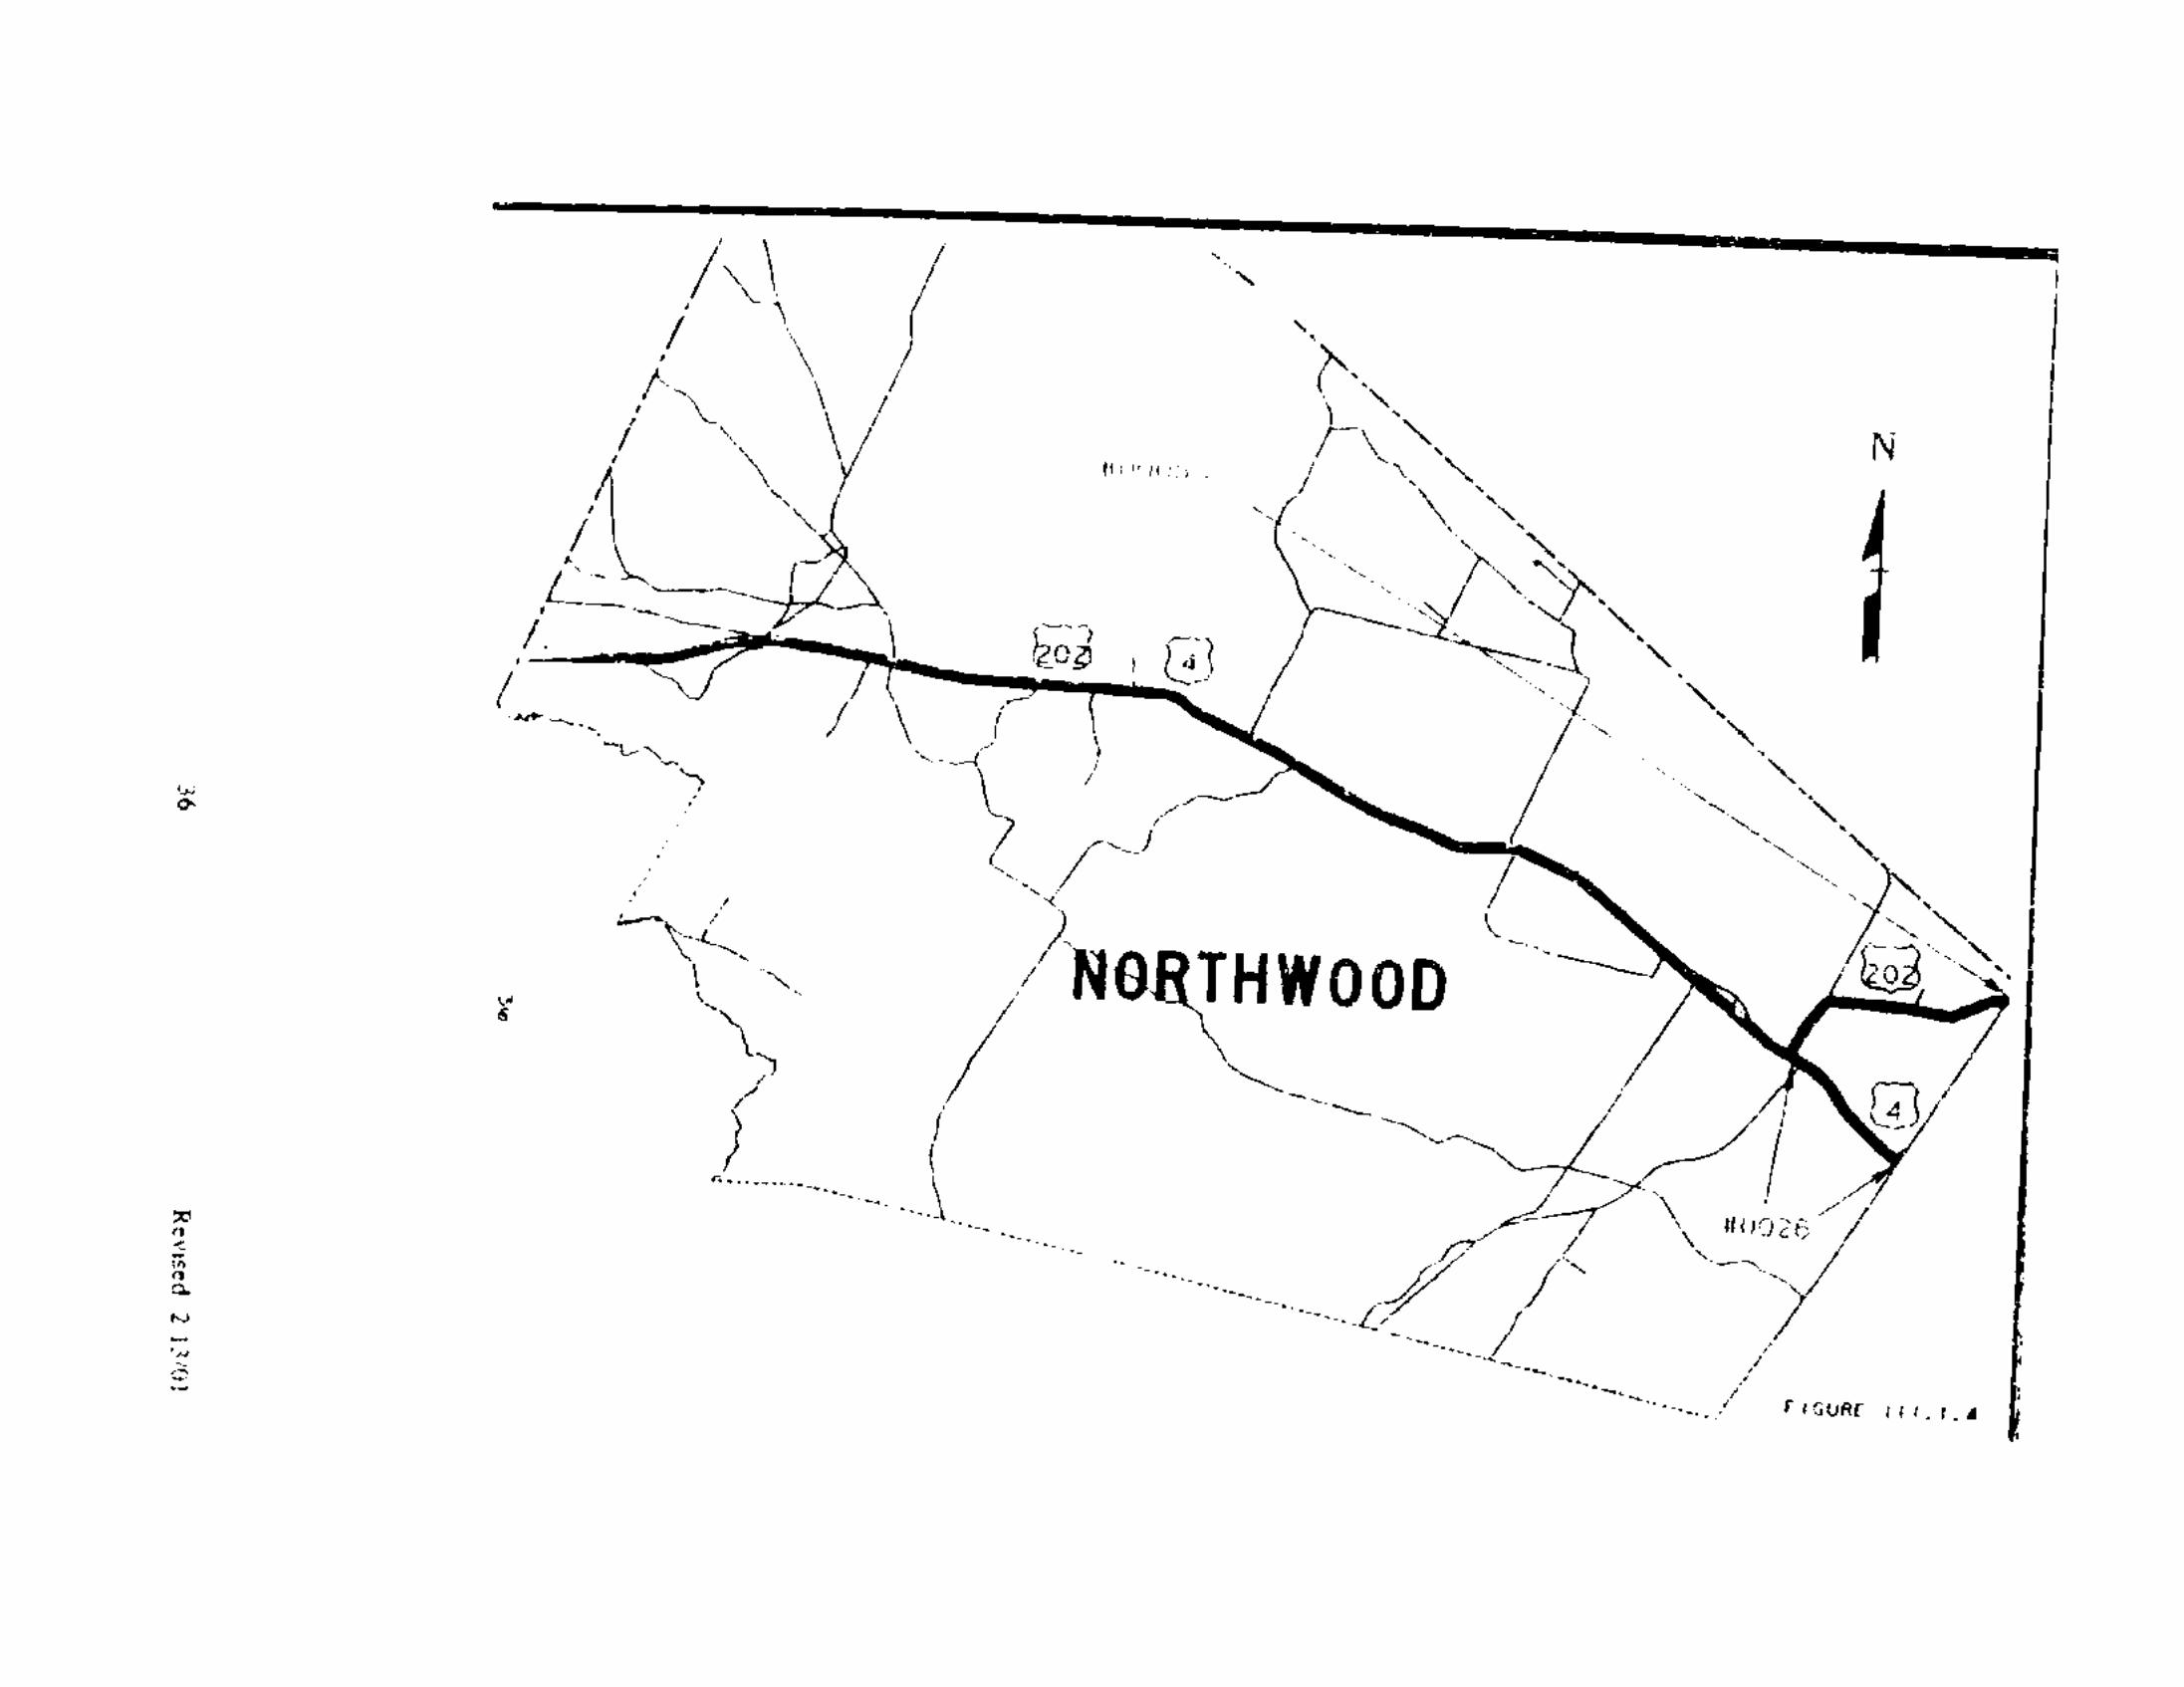


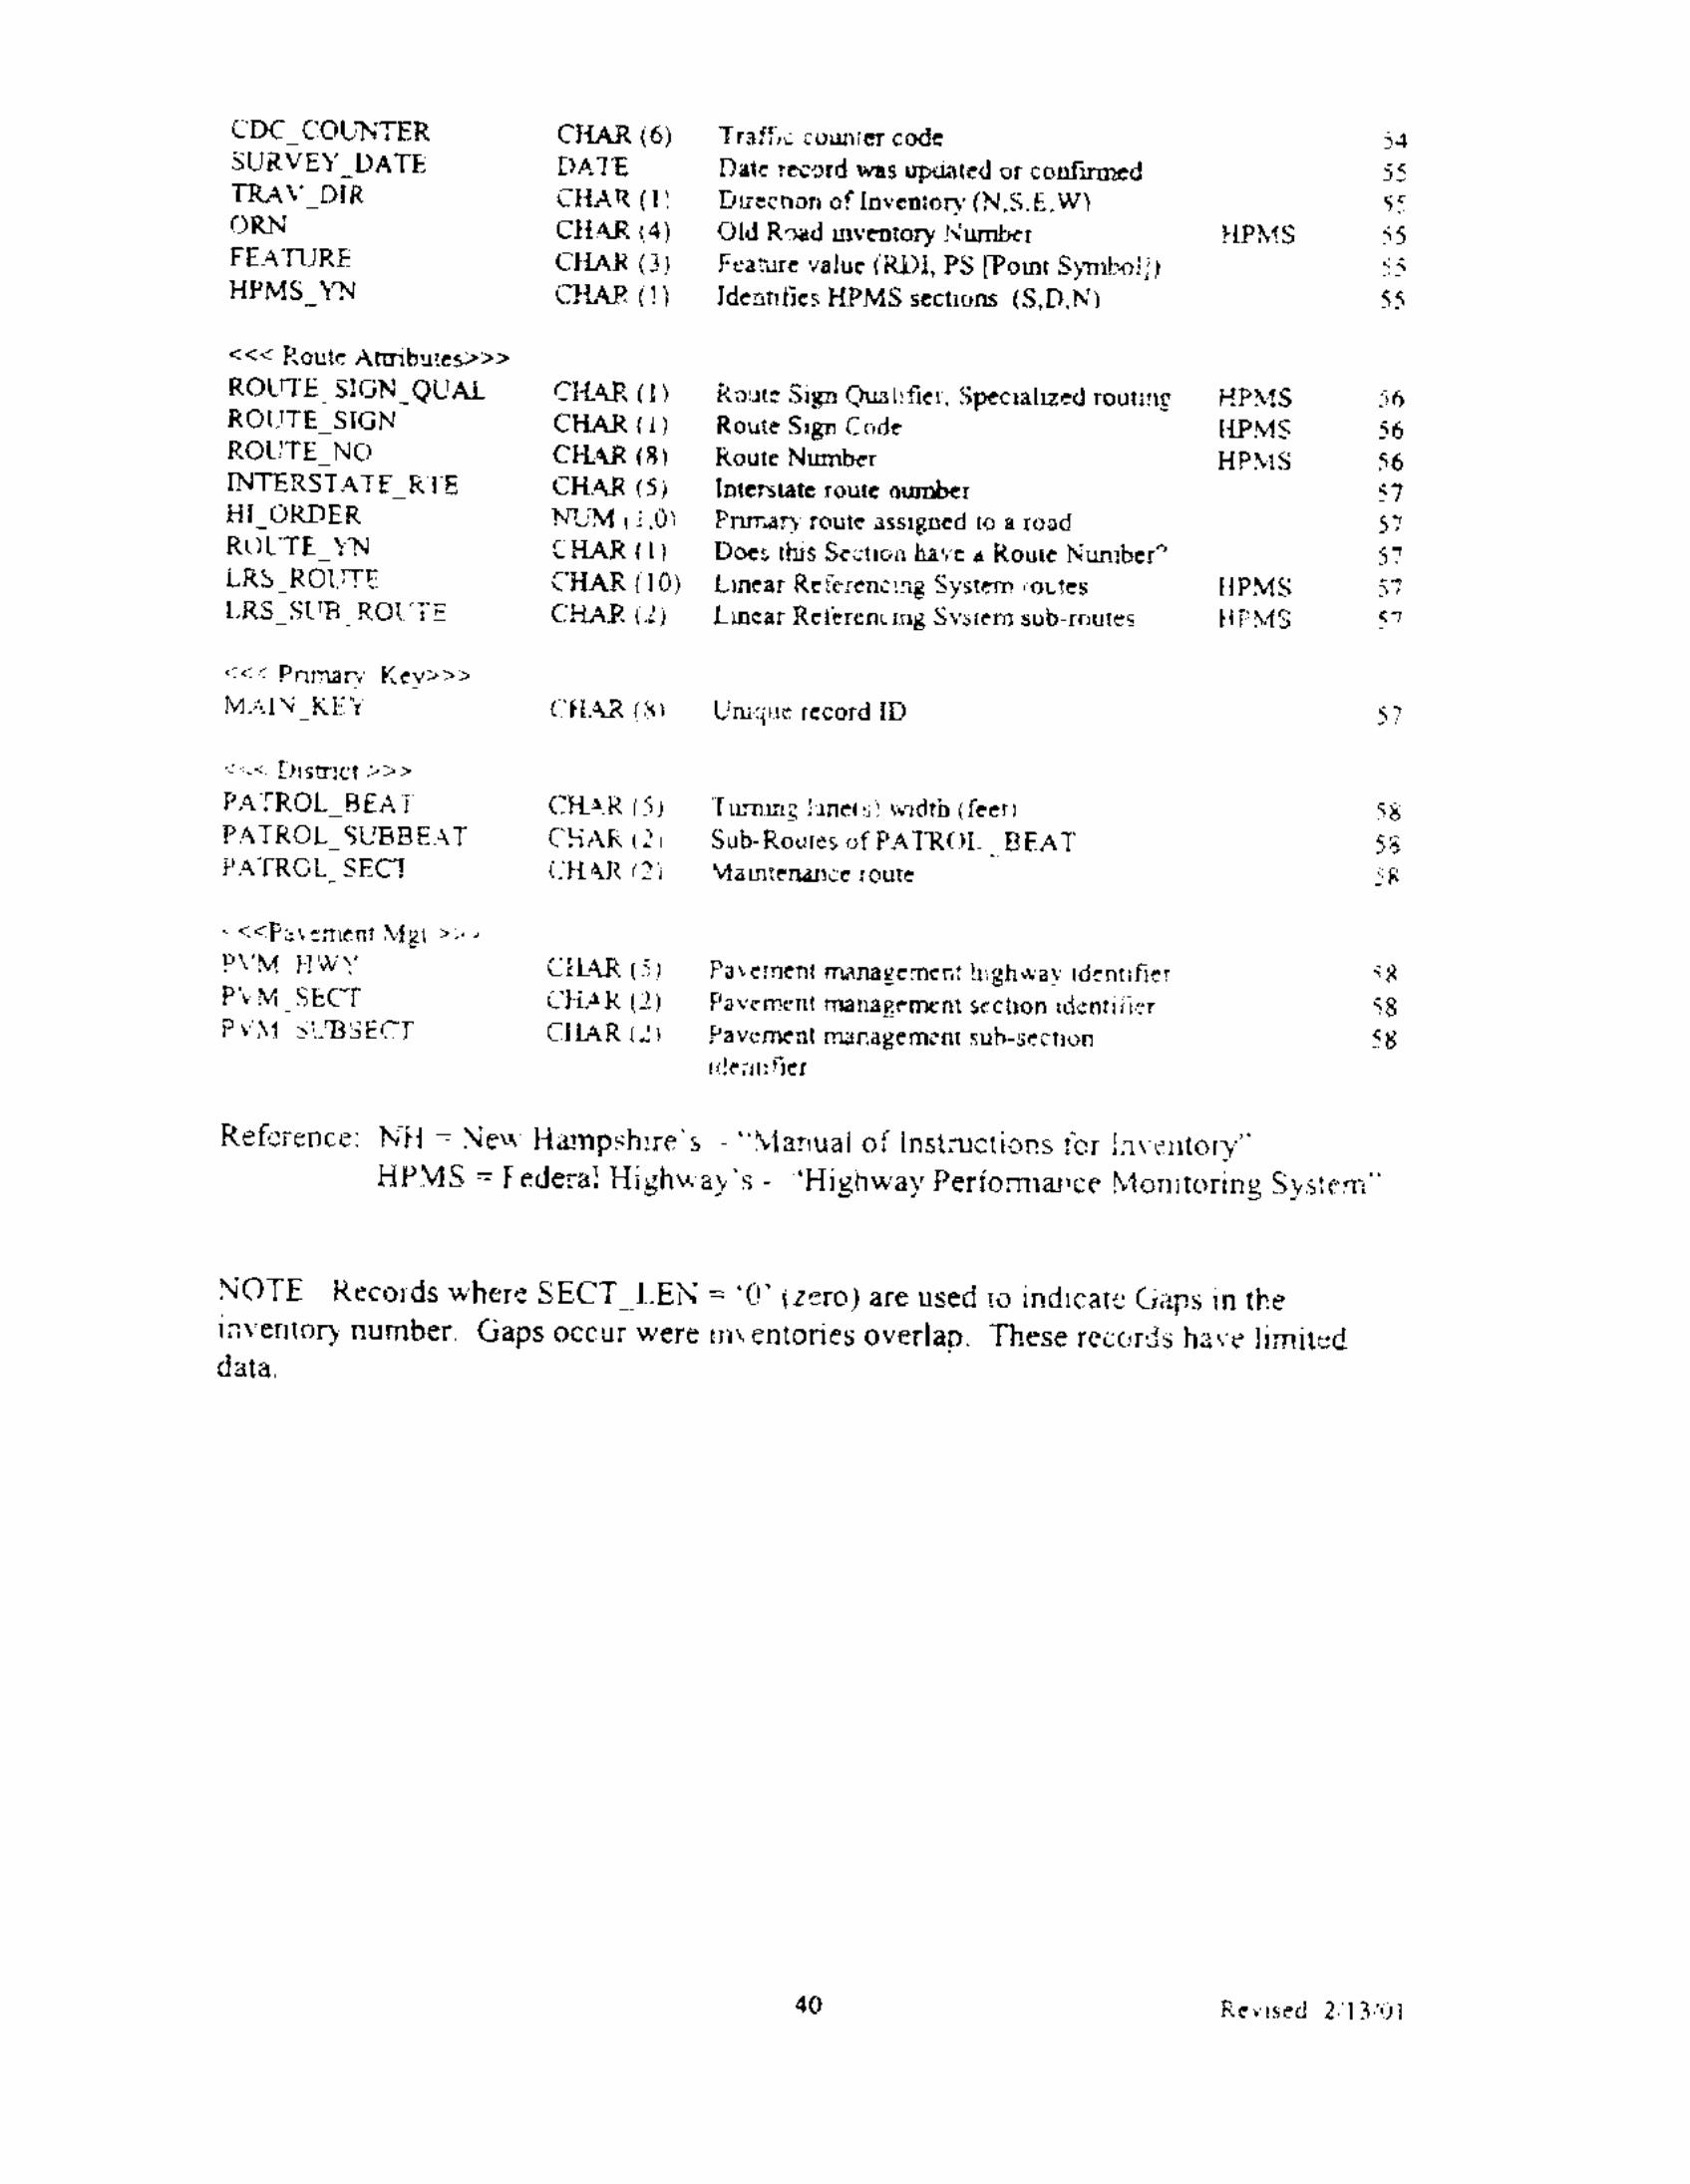

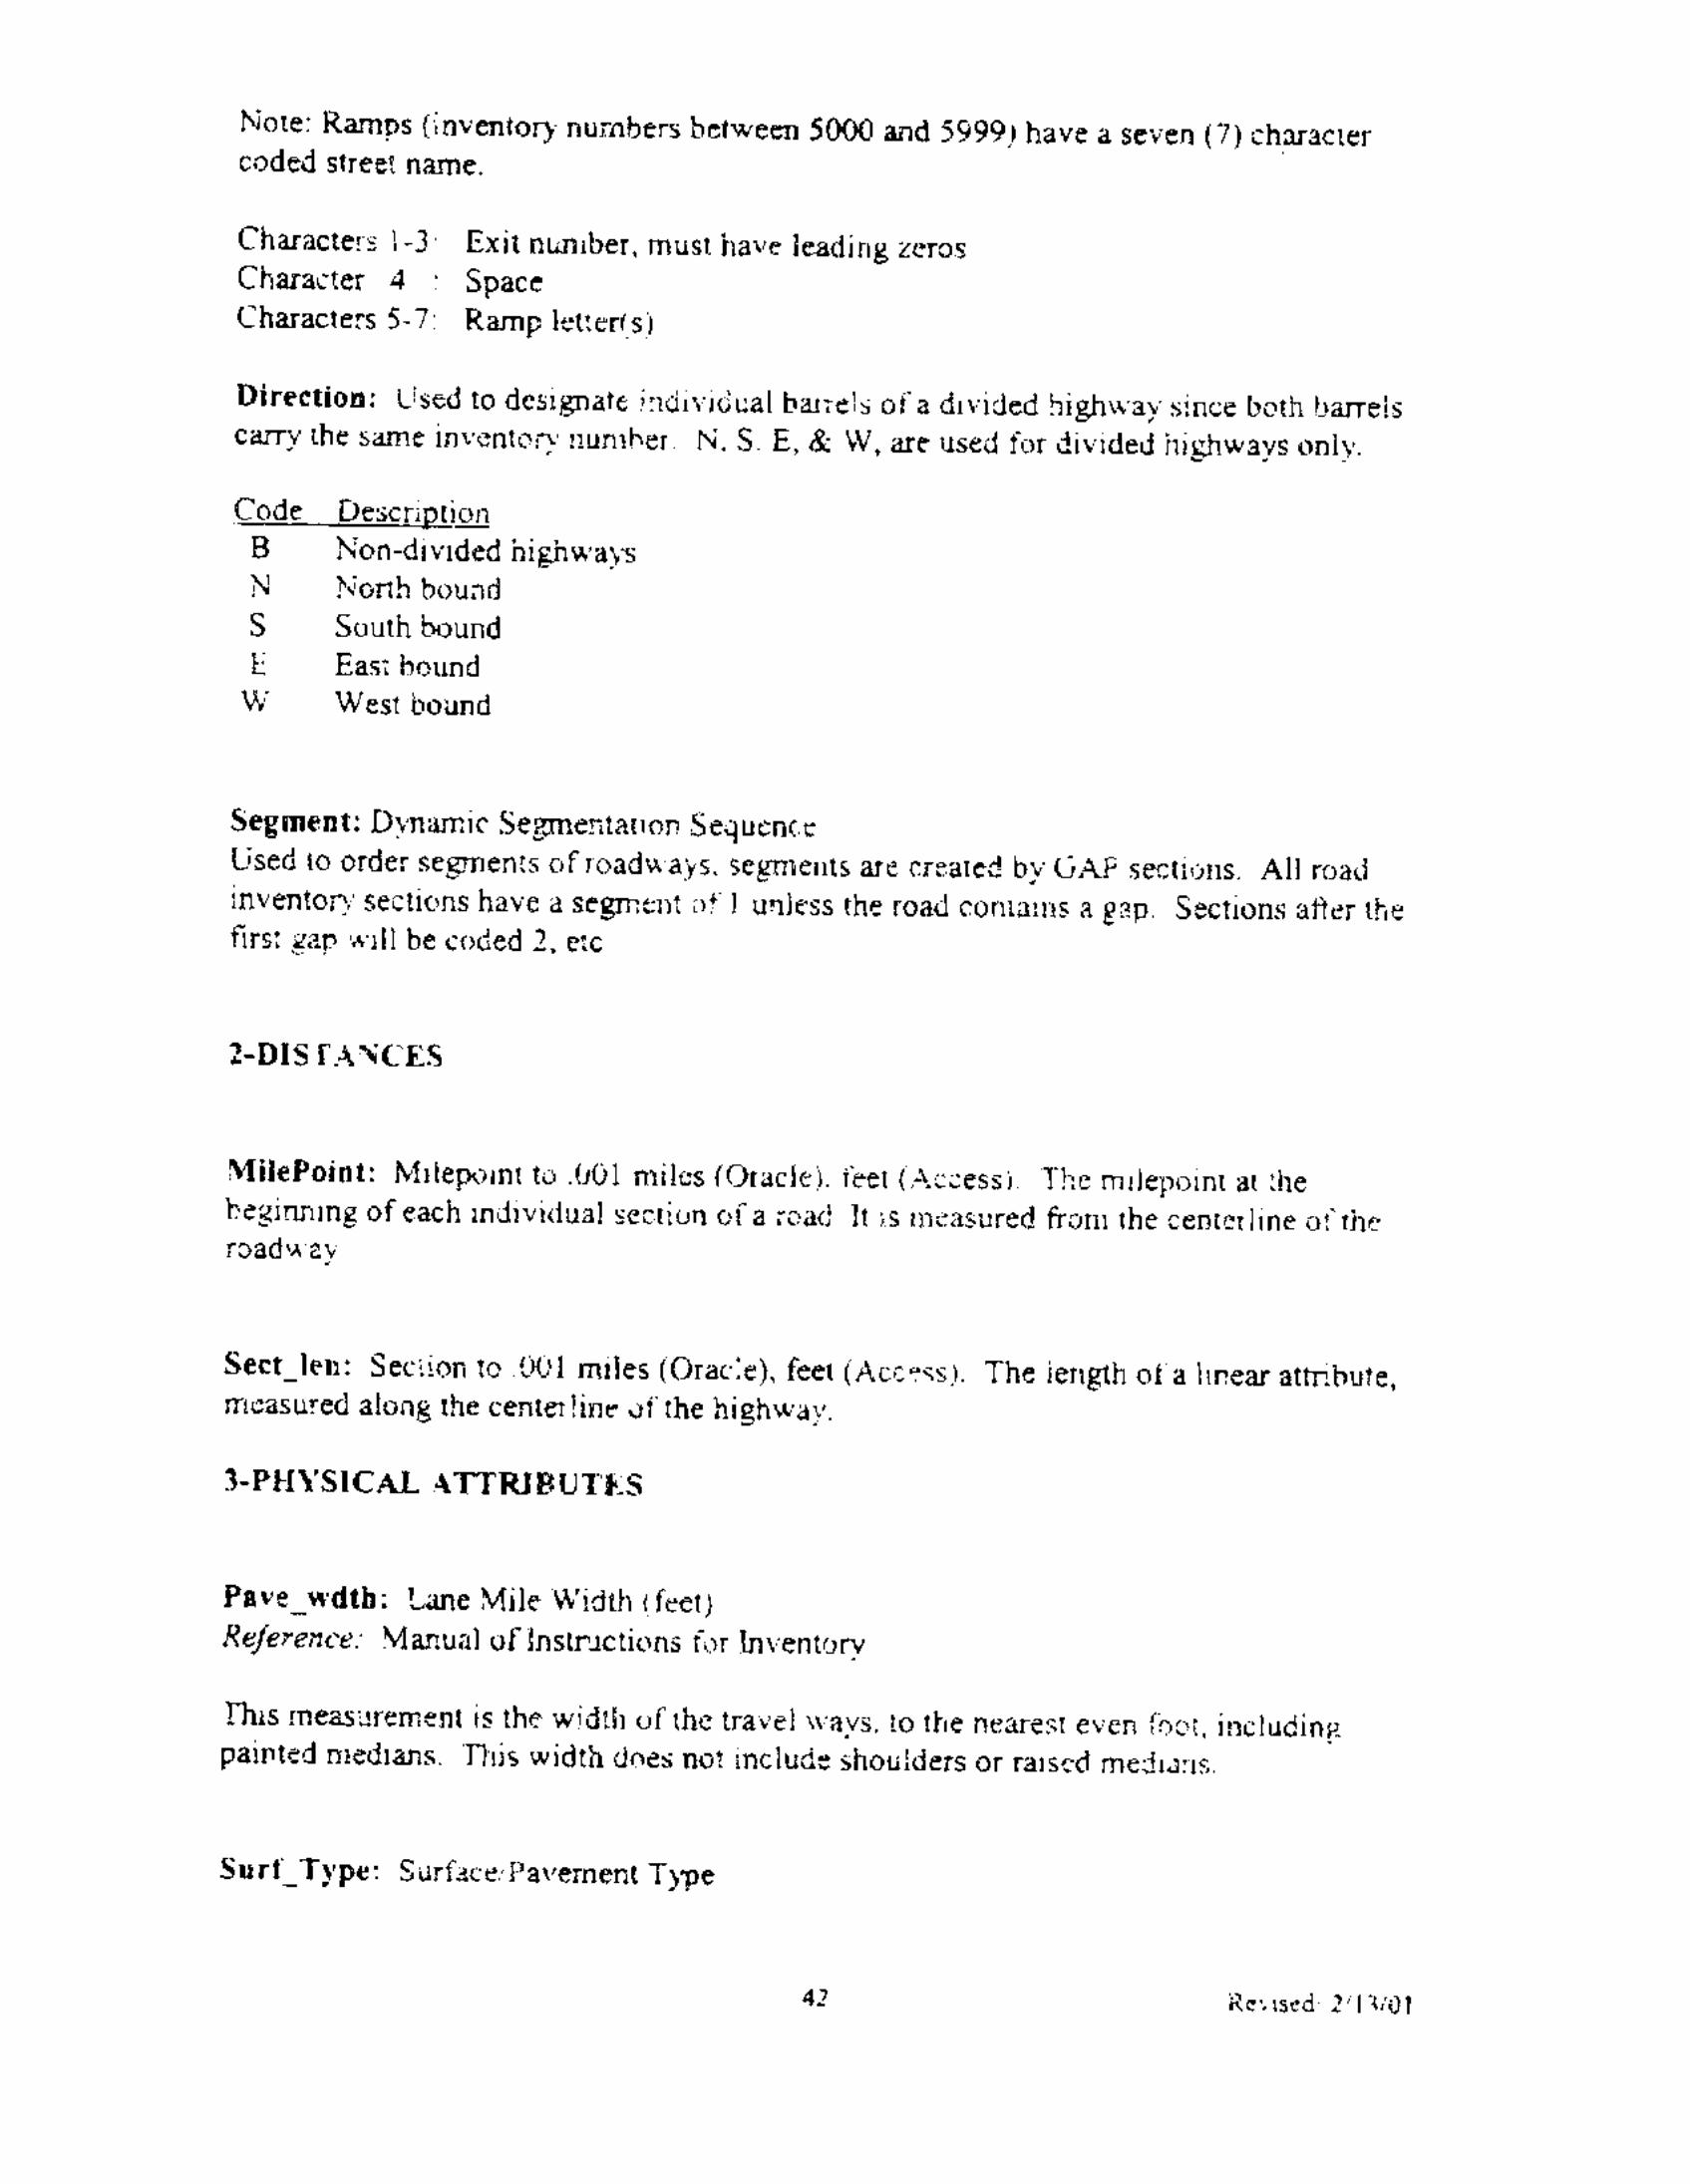


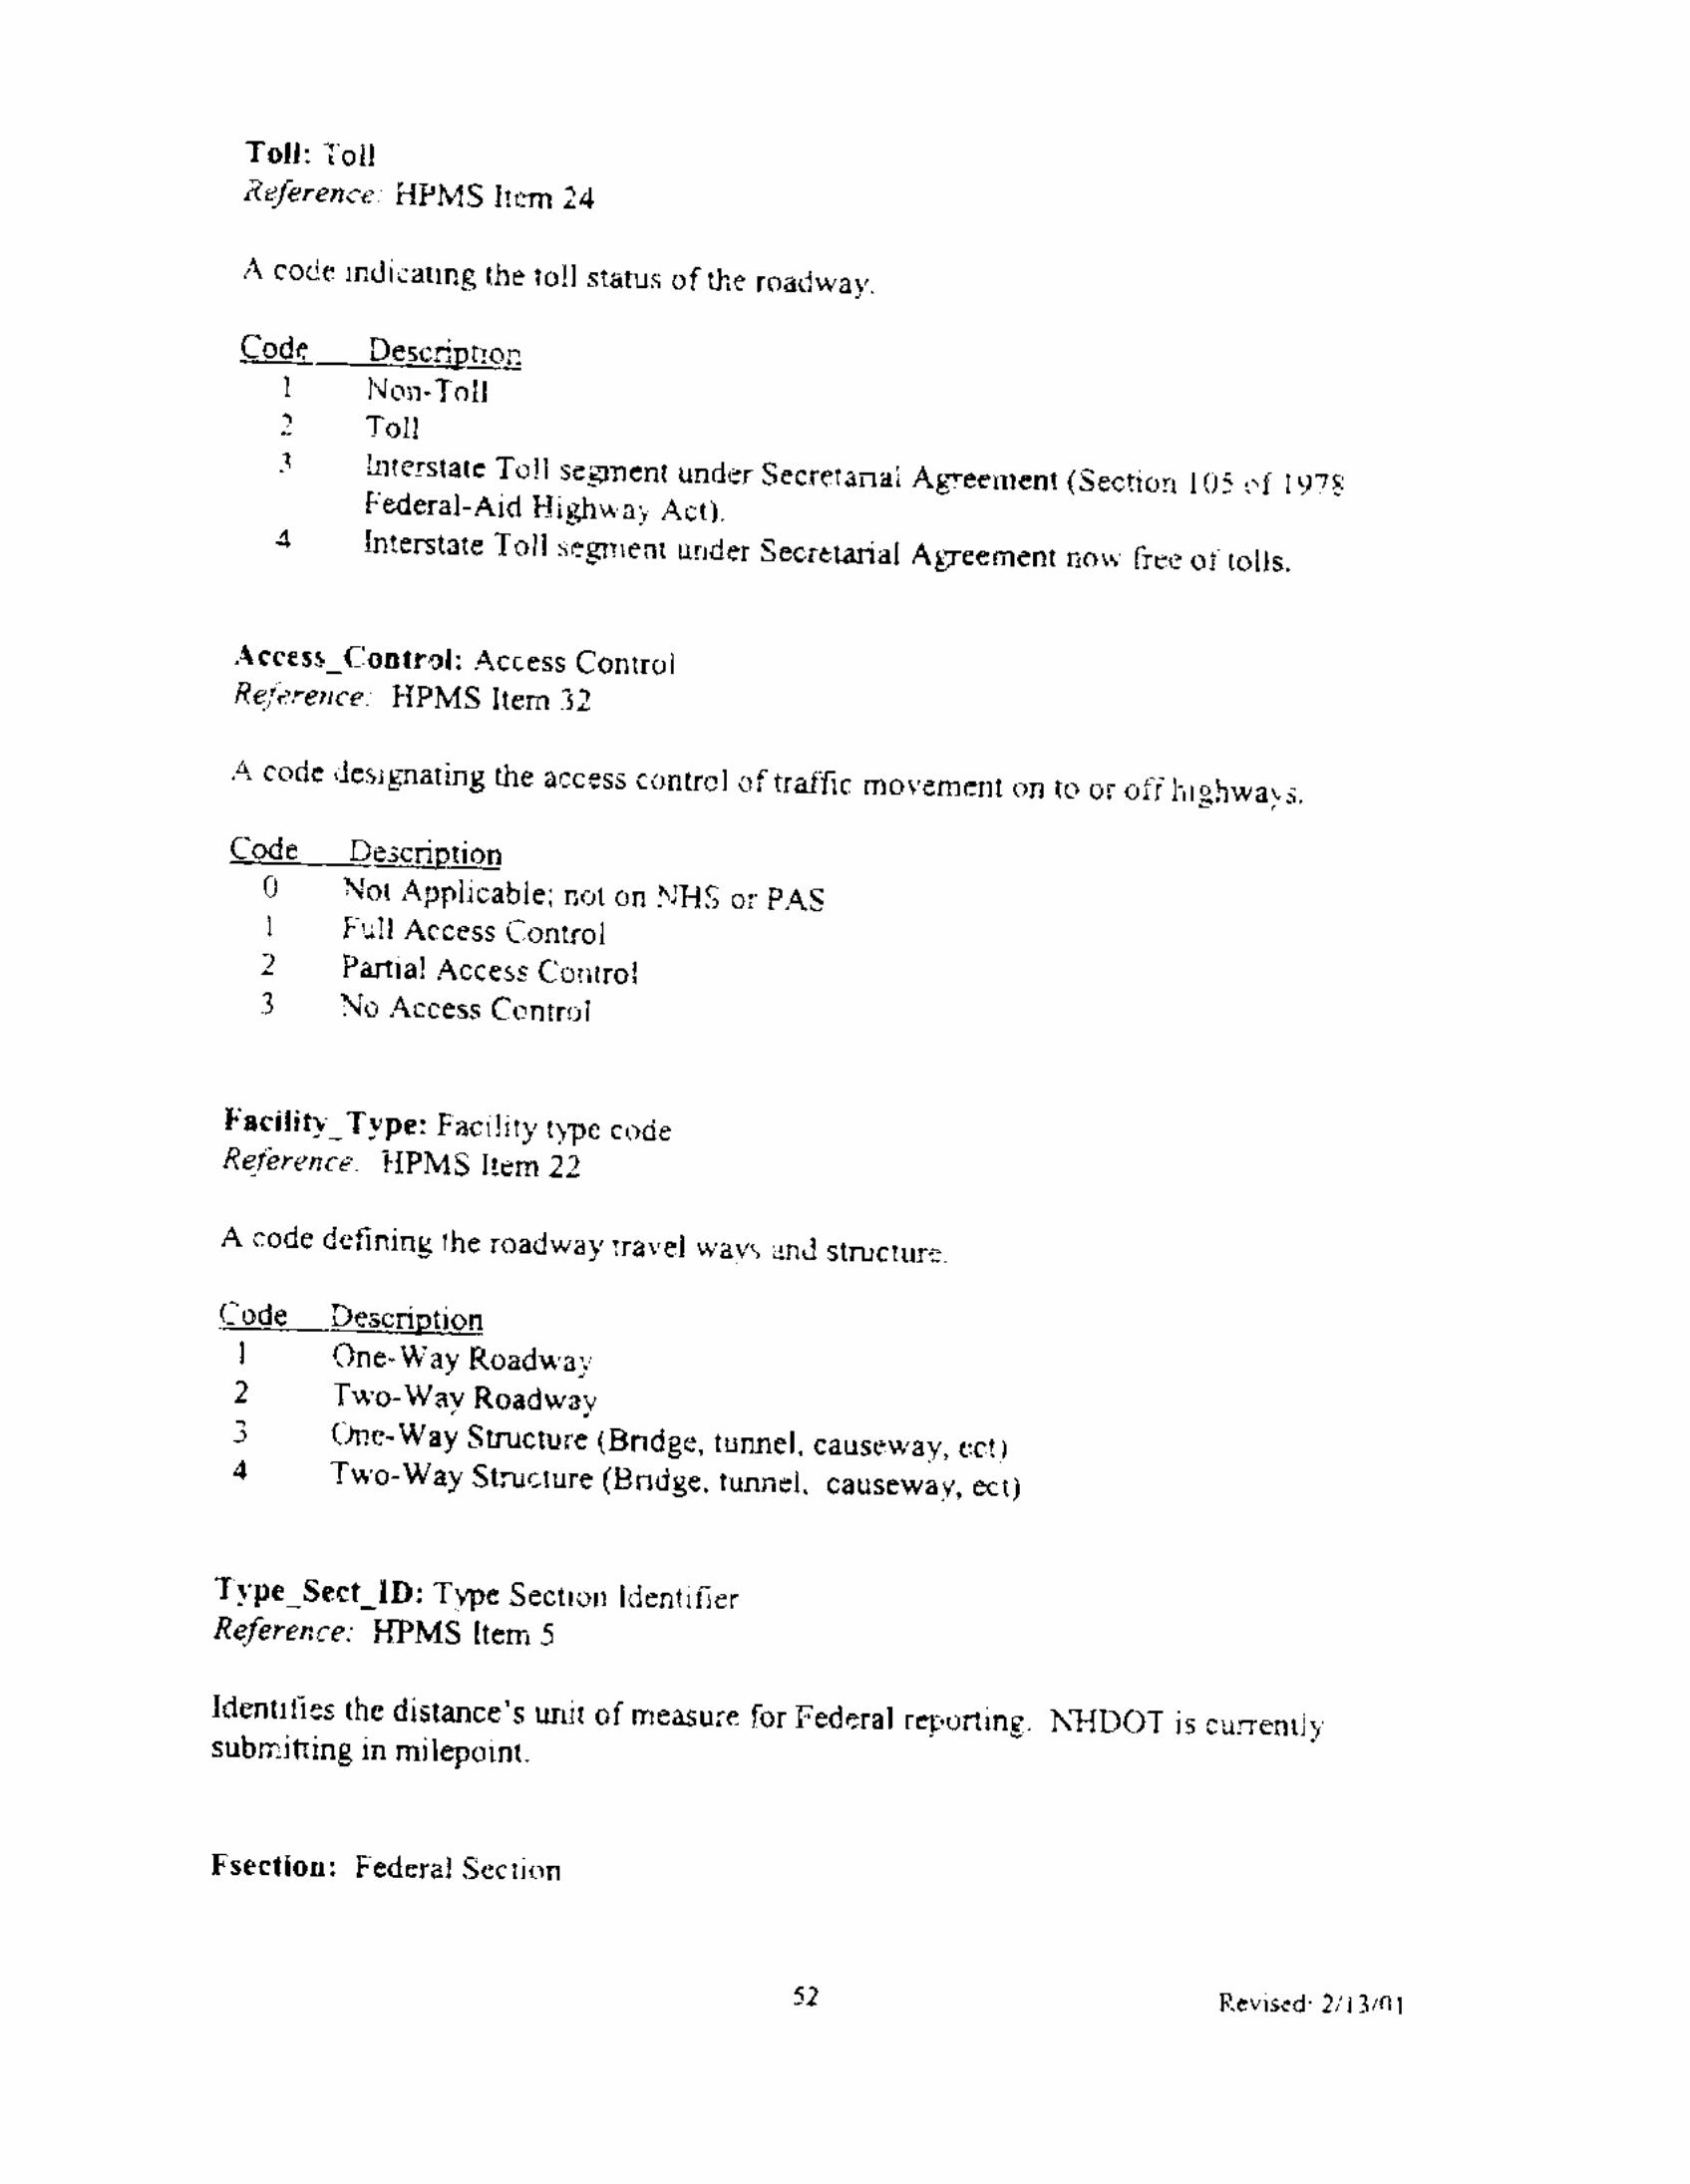


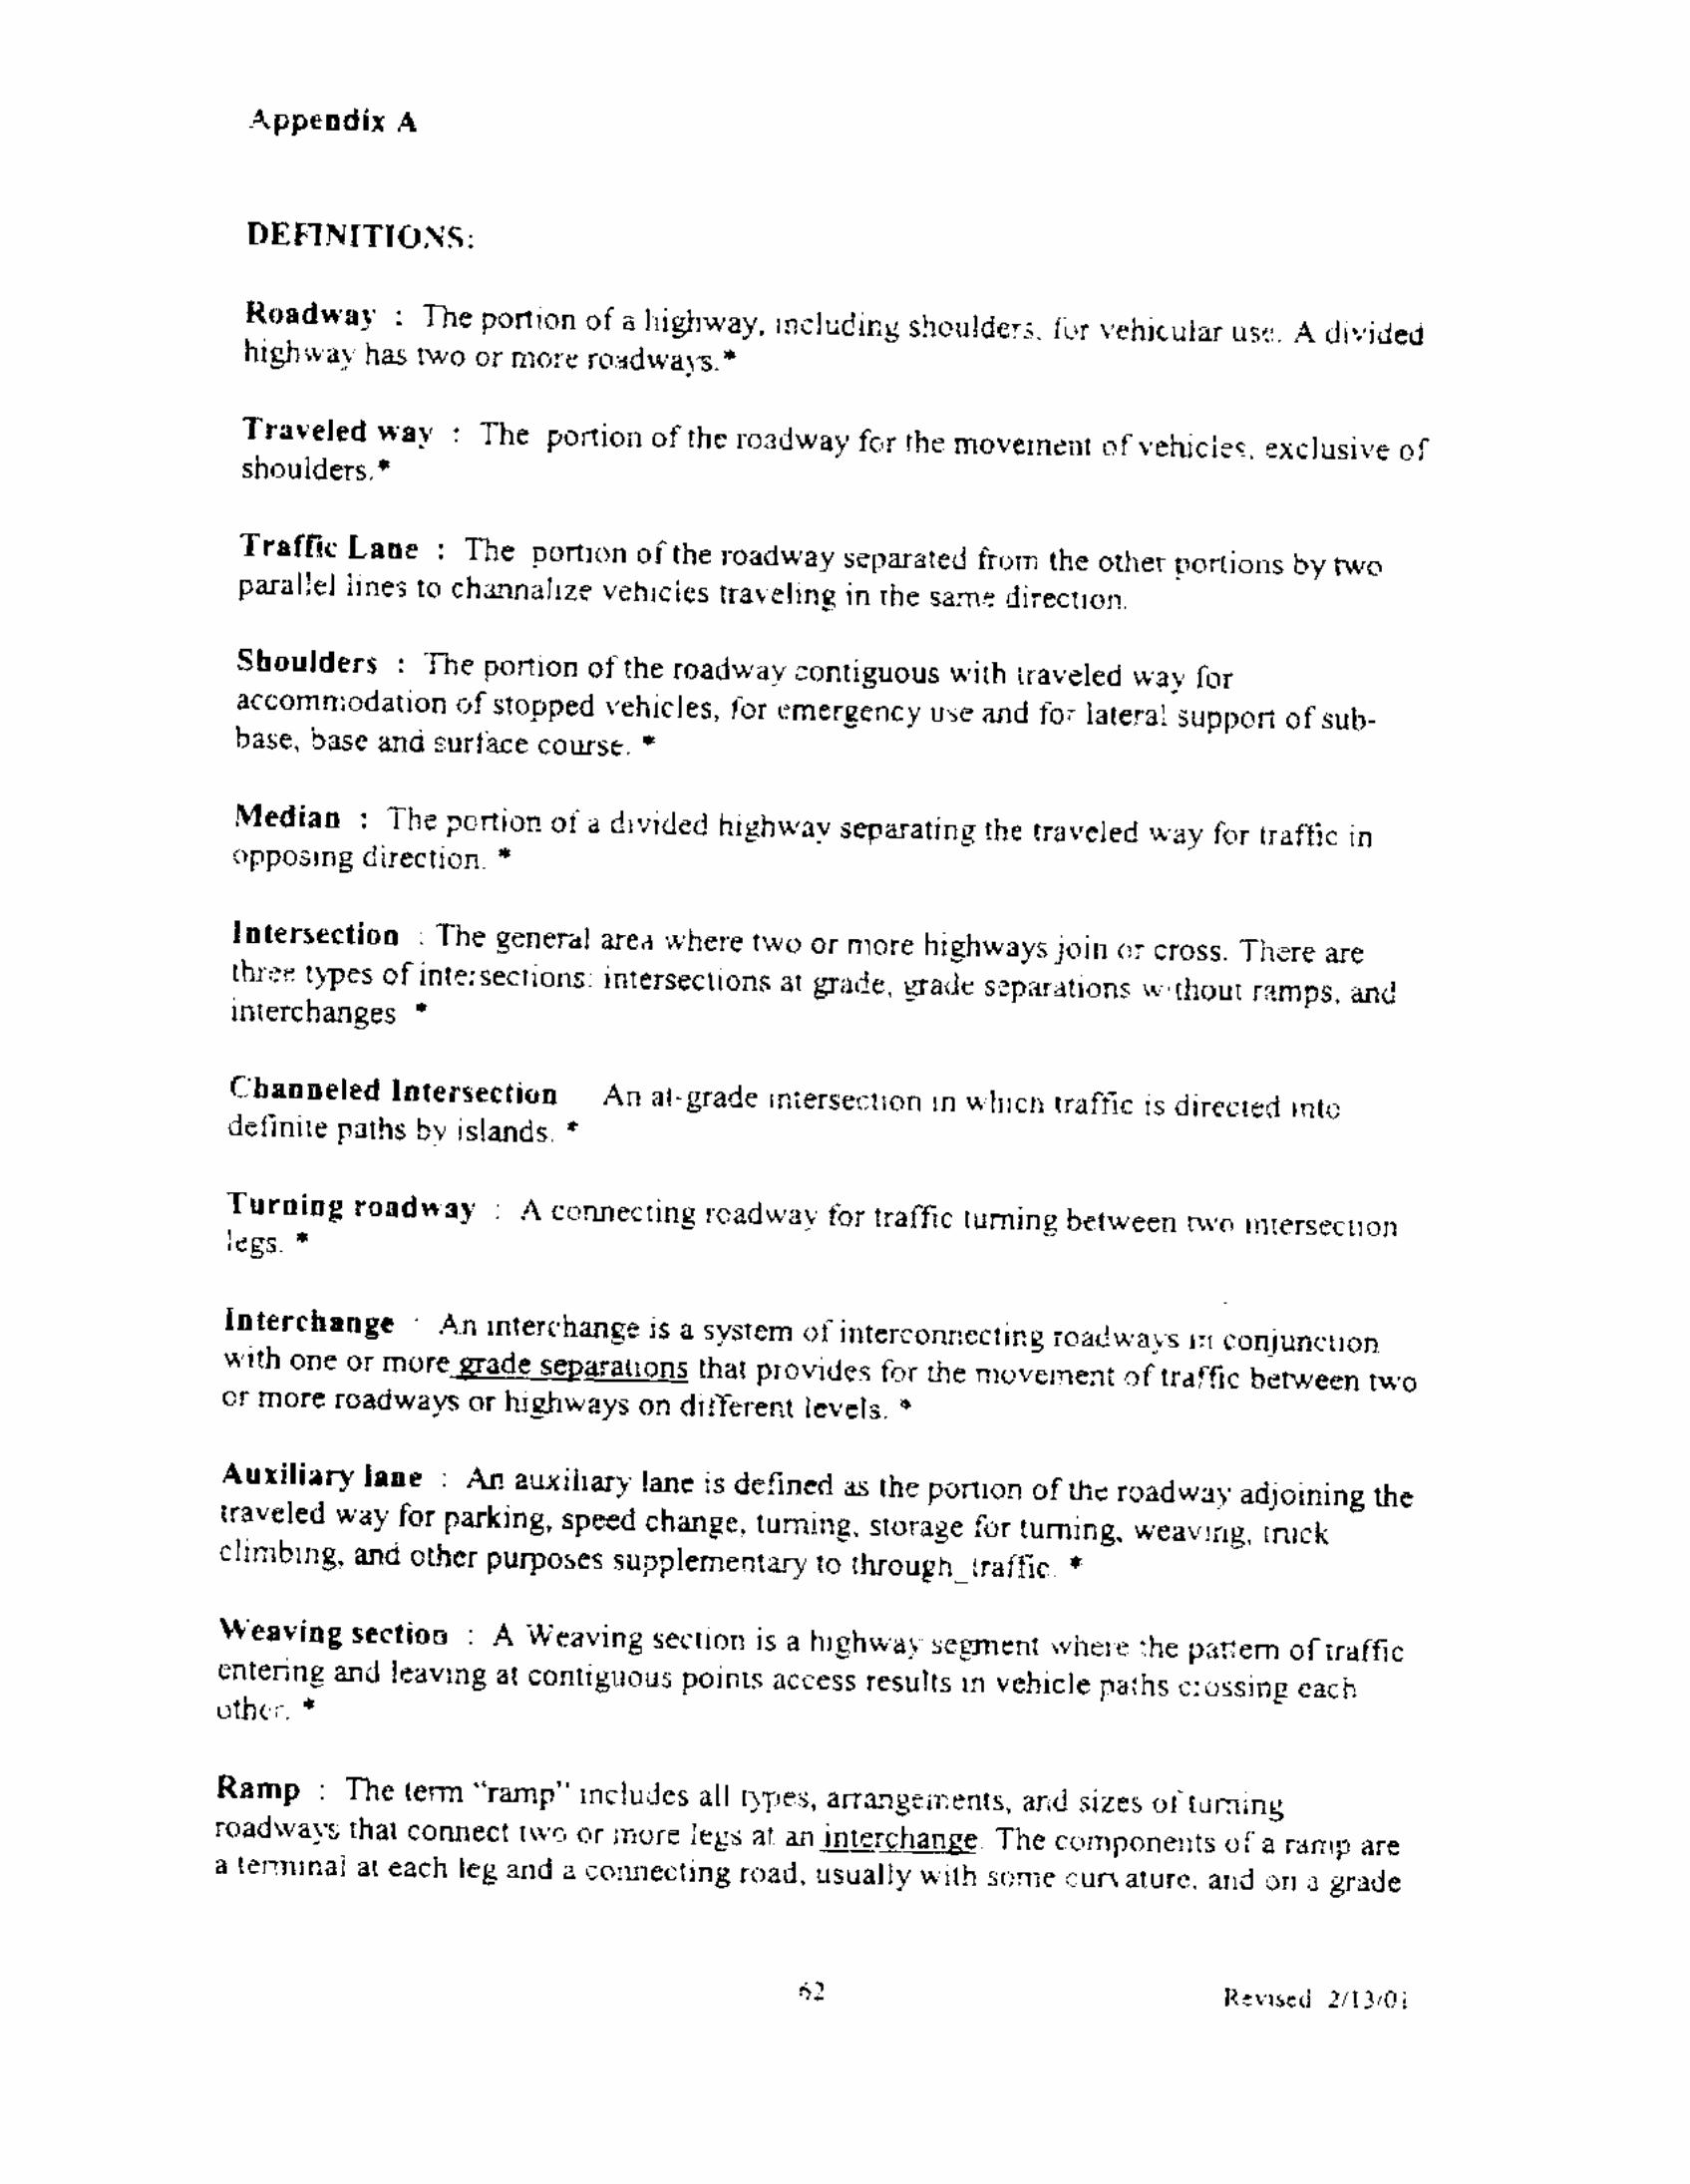


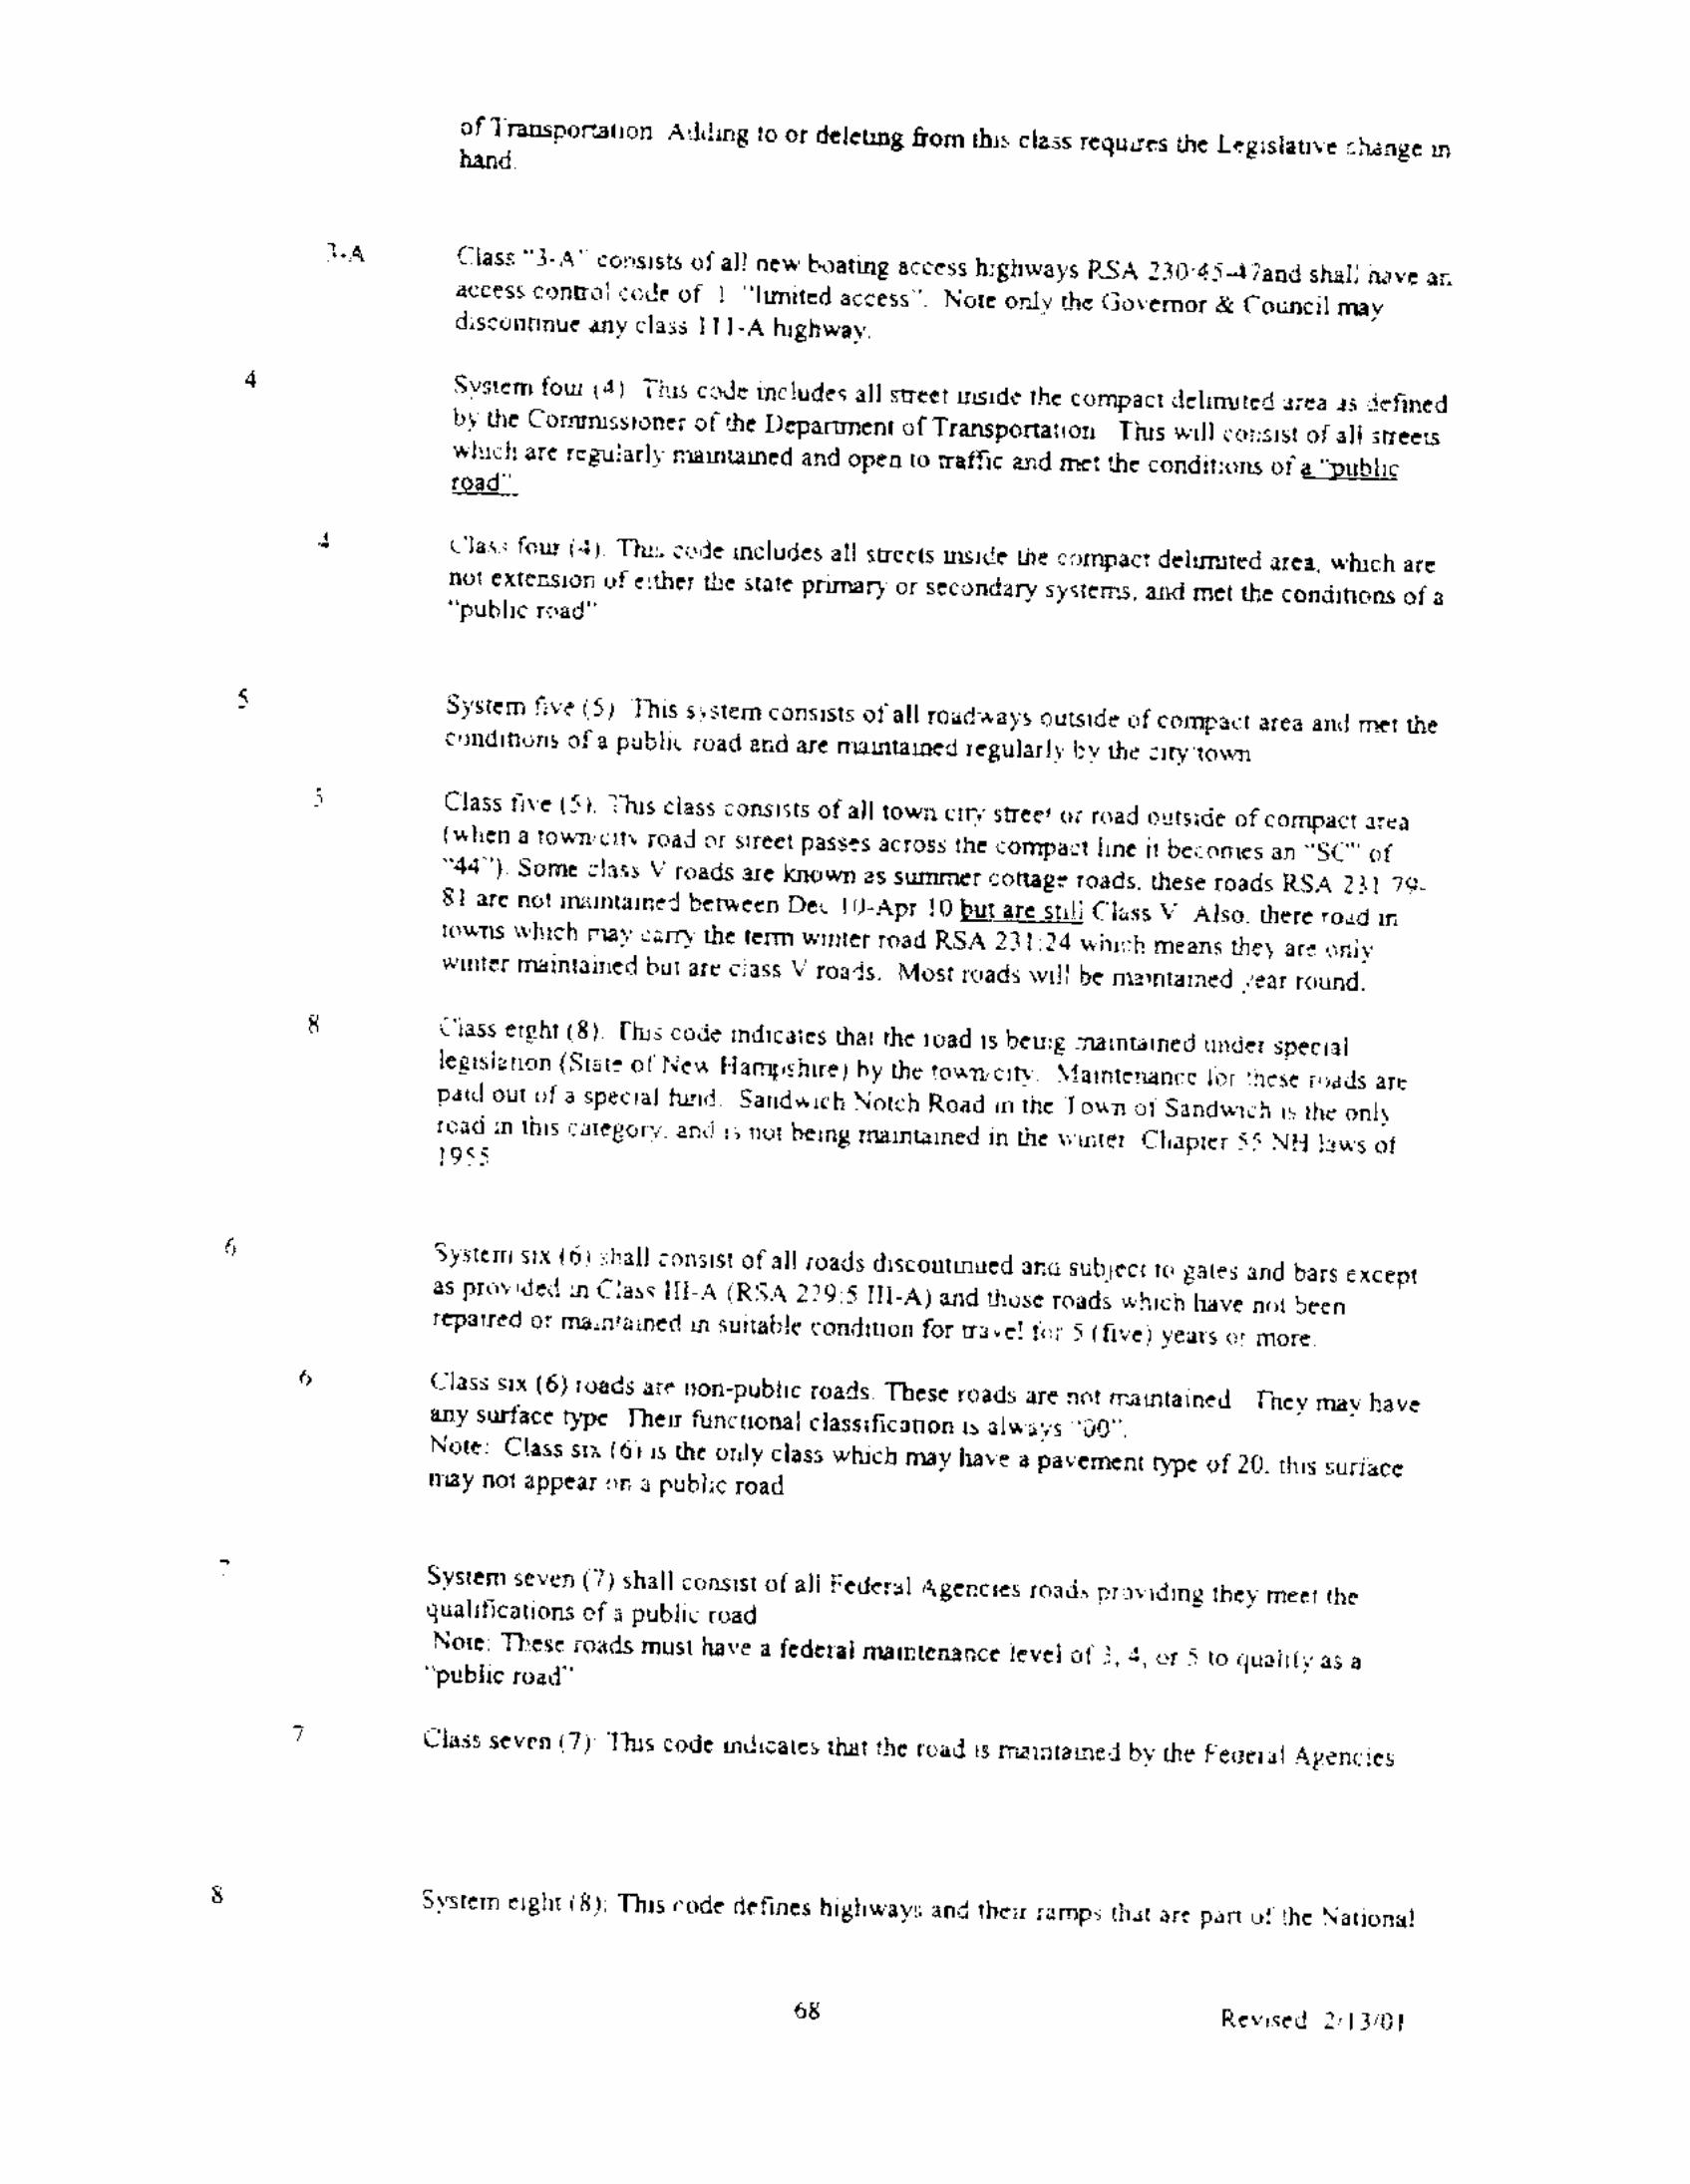


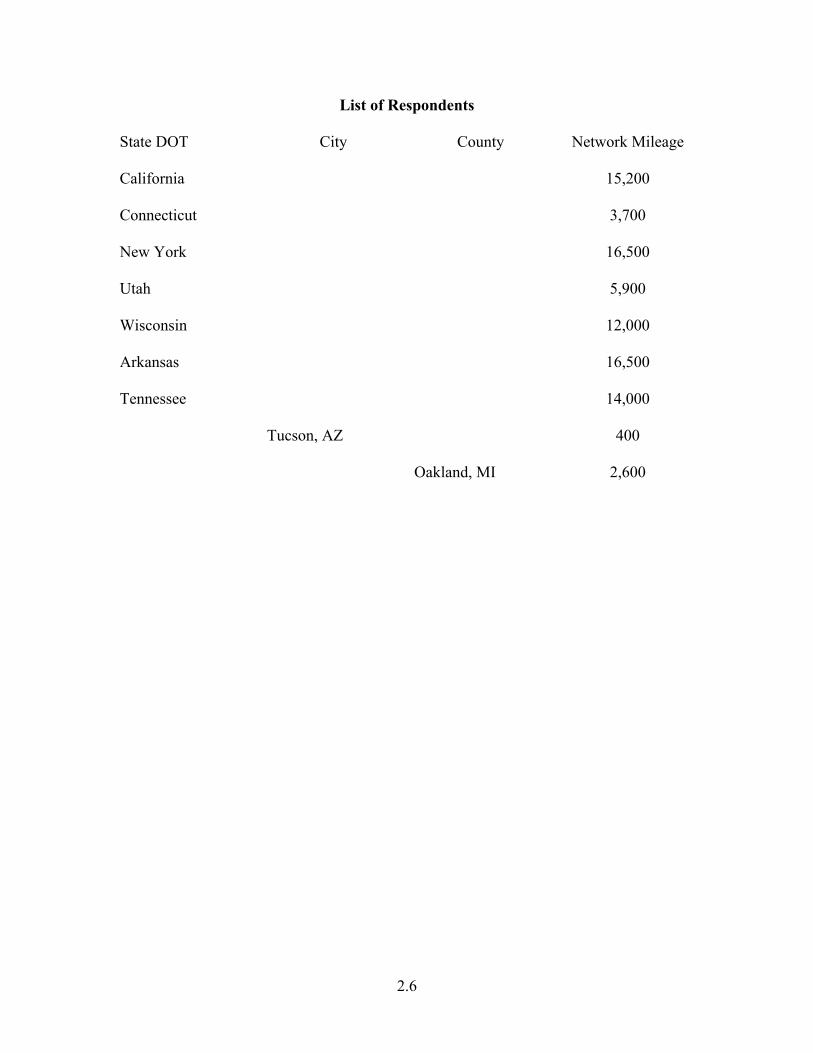
List of Respondents
State DOT City County Network Mileage California
15,200
Connecticut
3,700
New York
16,500
Utah
5,900
Wisconsin
12,000
Arkansas
16,500
Tennessee
14,000
Tucson, AZ
400
Oakland, MI
2,600
2.6

Table 2
Summary of Data Collection and Distribution Methods Employed by Other Transportation Agencies
12 Questionnaires Sent Out 10 to DOTs 1 to a city 1 to a county 9 Questionnaires Returned 7 DOTs, City & County Question Summarized Response FDOT Who Obtains Images Agency
By Contract 7 2
←
Medium to Obtain Images Film Analog tape Digital Tape CD-ROM or DVD Not Reported
2 2 1 2 2
← ←
Area Recorded Driver’s Eye View Right Side View Pavement View
9 3/9 1/9
←
Extent of Imaging Bi-Directional (All Roads) I-Ramps 1 way-2 lane undivided
8/9 1/9 1/9
←
Collection Frequency Once/year Once/2 years Other (3-10 yr.)
2* 3** 5
←
Distance Interval Continuous video 0.01/mile Other
2 6 1
← ←
Editing Agency By Contract Both
7 1 1
←
Edit Interval 0.005/mi 0.01/mi None
1 4 4
←
11

Table 2 (Continued)
Storage Medium Tape CD-ROM DVD Hard Disk Laser Disk Film
2 2 1 6 1 1
← ← ←
Digital Storage Parameters MPEG Compression JPEG Resolution 640 x 480 to 1300 x 1030 pixels File Size 50-110 kb Not Reported
1 6 6/9 6/9 2
← ← ←
Distribution System Network (Server) Film Laser Disk CD-ROM Tape
7/9 1/9 1/9
← ← ←
* Arkansas Interstate Only ** Arkansas all non-Interstate
12

Table 3
Additional Data Obtained During Videolog Field Activities
Data Item
Number of Agencies
Interval
Roughness
3
1@10m [email protected] [email protected]
Grade 5 [email protected] 1@4m [email protected] [email protected] 1 unreported
Cross Slope 3 [email protected] 1@5m [email protected]
Distance (Chainage)
6 [email protected] [email protected] 1@4,5&10mi [email protected]
Texture
None
Transverse Profile 3 [email protected] 1@4m [email protected]
GPS* 5 [email protected] 1@10m [email protected]
Heading 4 [email protected] 1@4m [email protected] [email protected]
Distress 1 [email protected]
Skid Number None *One State to add GPS
13

Table 4
Processing, Storage and Distribution of Data Acquired by Other Transportation Agencies
Data Item
Post
Processing
Storage CD-
ROM
Hard Disk
Digital Video Disk
Horizontal Curve 5 1 4 1
Vertical Curve 5 1 5 1 Longitudinal Profile 1 1 2 1 Transverse Profile 2 1 2 1
Rut 4 2 4 1 Texture - - - -
Shim Quantity - - - - Real Time
Roughness 2 4 1 Grade 2 6 1
Cross-Slope 2 3 1 Distance 3 4 1 Texture NONE
Trans. Profile 2 3 1 GPS 3 6 1
Vehicle Altitude 2 4 1 Skid Number NONE
14


Contacts
Transportation Agency
Connecticut Bradley J. Overturf Department of Transportation Bureau of Engineering and Highway Operations 280 West St. Rocky Hill, CT 06067 Tel. 860-258-0319 Fax 860-258-0399 [email protected] Maine Keith Fougere Maine Department of Transportation Pavement Management 16 SHS Augusta, ME Tel. 207-287-5661 Fax 207-287-3292 [email protected] Massachusetts Mike Ecmecian Massachusetts Highway Department Pavement Management 936 Elm St. Concord, MA Tel. 978-0282-6115 Fax 978-369-5740 Rhode Island Joseph A. Bucci, P.E. Rhode Island Department of Transportation Traffic and Safety Management 2 Capitol Hill Providence, RI 02903 Tel. 401-222-2694 x4211 Fax 401-222-2207 [email protected]

Vermont Mary C.S. Godin Vermont Agency of Transportation National Life Drive Montpelier, VT Tel. 802-828-2681 Fax 802-828-2334 [email protected]
GIS Connecticut James R. Spencer State of Connecticut Department of Transportation Graphic Information Systems 2800 Berlin Turnpike Newington, CT Tel. 860-594-2014 Fax 860-594-2056 [email protected] (Previous GIS contact now retired, was Frank J. Busch.) Maine (Office of GIS) Dan Walters Maine Office of GIS 26 Edison Drive 145 SHS Augusta, ME Tel. 207-624-9435 Fax 207-287-3897 [email protected] Maine (DOT) Nancy Armentrout Maine Department of Transportation 16 Statehouse Station Augusta, ME 04333-0016 Tel. 207-287-8723

Massachusetts (MassGIS) Neil MacGaffey MassGIS Executive Office of Environmental Affairs 251 Causeway St., Suite 900 Boston, MA Tel. 617-626-1057 Fax 617-626-1249 Neil,[email protected] Massachusetts (MassHighway) Douglas Carnahan Massachusetts Highway Department Bureau of Transportation Planning and Development 10 Park Plaza, Room 4150 Boston, MA 02116 Tel. 617-973-8239 Fax 617-973-8035 [email protected] New Hampshire Dennis R. Fowler New Hampshire Department of Transportation, Bureau of Transportation Planning PO Box 483, Hazen Drive Concord, NH Tel. 603-271-8457 Fax 603-271-8093 [email protected] Rhode Island Stephen A. Kut Rhode Island Department of Transportation Providence, RI 02903 Tel. 401-222-6935 Fax 401-222-4403 [email protected]

Vermont Mary C.S. Godin Vermont Agency of Transportation National Life Drive Montpelier, VT Tel. 802-828-2681 Fax 802-828-2334 [email protected]
System Providers
Roadware PO Box 520 147 East River Road Paris, Ontario N3L 3T6 Canada Tel. 1-800-828-ARAN (2726) Tel. Outside North America 1-519-442-2264 Fax 1-519-442-3680 Email General Information [email protected] Customer Support [email protected] http://222.roadware.com/ Roadware has regional offices in Pennsylvania and Florida in North America. Contact for the name of an agent in regions outside of North America. Mandli Communications, Inc. 490 North Burr Oak Avenue Oregon, WI 53575 Tel. 608-835-7891 Fax 608-835-7891 http://www.mandli.com/