Embed Size (px)
Citation preview

Table of Contents
GROSS MARGIN ANALYSIS OF VARIOUS CROPS
CULTIVATED IN THE MARA RIVER BASIN 2004
Incomplete Draft Report
By
Joseph Onjala
This study was commissioned by the World Wide Fund for Nature – East African Regional Office in Nairobi, Kenya

WWF-EARPO Mara River Basin
2
Acknowledgements This study was commissioned by the World Wide Fund for Nature – East African Regional Office in Nairobi, Kenya. I am grateful to Mr. Mohamed Awer, Ms. Doris Ombara – the Project Manager, and Mr. Koros who coordinated preparation for the work and supervised data collection from the field. All the research assistants worked tirelessly to reach remote parts of the Mara River Basin. Without all of their inputs this exercise would not have been a success.

Cost Benefit Analysis of Various Crops grown in the Mara River Basin
3
1.0 BACKGROUND OF THE STUDY
1.1 Introduction
The overall goal of the Mara River Catchment Basin Initiative is the achievement of
sustainable natural resources management in the Mara River Catchment Basin. The
Mara River is an international river of profound biodiversity interest. The river
originates in the forests of the Eastern Mau Escarpment in Kenya and flows along the
boundaries between Narok, Bomet and Transmara districts into Masai Mara National
Reserve (MMNR) before crossing the border into Serengeti National Park in Tanzania
and draining into Lake Victoria. Before debauching from Kenya, Mara River receives
water from two important seasonal tributaries, the Talek and Sand River. Both rivers
originate from the Loita Hills and drain the Sannia and Loita Plains, a major dry
season livestock grazing area and a vitally critical dispersal area for wildlife ungulates
in the Mara-Serengeti ecosystem.
The supplementary goals of the present initiative are: Conservation of Mara River
Catchment unique biodiversity; Ensuring the maintenance of natural functions by
balancing the supply and demand of biodiversity products; and Developing alternative
livelihoods of the communities
The objectives of the Initiative are to assess the status, threats and sources of stress of
Mara River Catchment Basin and Develop a strategy for developing sustainable use
and management of biodiversity of the Mara River Catchment.
The Mara River Basin is a host to diverse human cultures as well as many natural
resources. If not utilized in an integrated and sustainable manner, the future of the
basin may be in jeopardy. Diverse land uses, various cultures, commercial as well as
subsistence enterprises, communally managed as well as private control of land and
land – based natural resources occur on both sides of the Tanzania-Kenya border.
Increased human activities, rapid growth of population and settlements, high livestock
population and deforestation have become great threats to the entire ecosystem
vitality.

WWF-EARPO Mara River Basin
4
2.0 Study on Cost Benefit Analysis of Various Crops grown in the Mara River
Basin
The Mara River Basin Project would like to facilitate the newly formed Mara River
Water User’s Association to strengthen its regulatory role on control of water use and
abstraction from the Mara River. The association should from this information assist
in control and guidance on the types of crops recommended to be grown within the
Mara River Basin in respect of the available water in the Mara River.
A number of crops are currently being grown and cotton is proposed as a major one to
be grown in the basin future. These include: wheat, irrigated maize, irrigated French
beans, cotton and livestock production. For each of these crop enterprises, gross
margins needs to be established under both rain-fed and irrigated conditions. Maize
for example is currently grown under rain-fed and irrigated conditions. Crop
requirement for each enterprise also needs to be established.
Data Collection
Interviews of small scale farmers and pastoralists was undertaken to collect
information using structured questionnaires. The information collected covered
detailed crop budget for wheat, maize (irrigated and rain-fed), French beans,
Tomatoes, Cabbages, Onions and livestock production. About 200 farmers were
interviewed during the survey while important information was collected from annual
records of Ministry of Agriculture and Livestock in Narok and Bomet Districts. The
study took a period of three.
This study of the Gross Margins for various crops in the Mara River Basin was also
based on the available studies by other consultants.

Cost Benefit Analysis of Various Crops grown in the Mara River Basin
5
3.0 Gross Margin Analysis of Various Crops Only 28% of available arable land are under agricultural production. Two distinct
types of agriculture are experienced; smallholder mixed farming and large-scale
commercial farming. Most of the smallholders mixed farms are about 2.0 to 5.0 ha.
and the main food crops are maize, wheat, beans, and vegetables. Mixed farming is
basically for subsistence. The large commercial farms are found in Mau, Ololunga
and Osupuko divisions and they grow barley, pyrethrum, maize, sunflower and wheat.
West of Mara River in Trans Mara, the land use types are livestock-sorghum and
sunflower-maize zones. Land under maize, wheat and barley production has increased
since 1984. The current agriculture trends are:
• Expansion of farming areas;
• Parcelisation of land into small divisions;
• Increased casual laborers from other district, causing population increase; and
• Fencing of such parcels.
Wheat farming in the plains will increase incidences of wildlife-human conflicts.
Population densities are highest in high potential areas, especially where sedentary
agriculture is practiced.
Irrigation agriculture along river floodplains and in otherwise dry season grazing
areas has increased. More than 300 ha in Naroosura are under irrigation as well as
planned farms in Seyabei, Mosiro, Lemek, Ngori and parts of Mulot location are
suitable for wheat and maize. Kanunka irrigation scheme in Osupuko targets 100,000
ha under horticulture in Kajiado district. The total potential for irrigation in the
Catchment has been estimated as 32,000 ha. for upland crop.
There are 7 smallholder irrigation schemes covering an area of 165 ha and 4
individual and 8 private farms in the district. The current water demand for irrigation
on the Mara River is 0.019 m3/sec and 0.059 m3/sec per month. This is expected to
increase as additional marginal areas are brought under cultivation.

WWF-EARPO Mara River Basin
6
3.1 Cabbages Production Table 3.1: Current Gross Margins for Cabbages Production
Kg/Acre 2004 Modal Average
Land Preparation Ploughing 3000 3500 Harrowing 1500 1400
Seeds 800 800 DAP 1700 930
Chemicals 400 800 Labour Requirements
Planting 600 700 Spraying 750 700 Weeding 1500 1100
Harvesting 1200 1000 Irrigation
Fuel 0 0 Labour 600 600 Water
Packaging - - Transport
To storage - - Market 500 300 Inputs - -
Working Capital 20% interest
2510 2566
Total Variable
Costs 15060 15396
Yield in Trays 20000 19805 Price Kshs per
kilogram 10 8.25
Gross Output 200000 163390
Gross margin 202510 147994
The average farm size is 0.80 acres per farmer. On average each farmer earns Kshs. 147994 per acre.
The most common margin is Kshs 202510 per acre.

Cost Benefit Analysis of Various Crops grown in the Mara River Basin
7
Figure 3.1: Mara River Basin: The Distribution of Farm sizes for Cultivation of Cabbages, 2005.
0
1
2
3
4
1 2 3 4 5 6 7 8 9 10 11 12Farmers
Farm
Siz
e (A
cres
)

WWF-EARPO Mara River Basin
8
Figure 3.2: Mara River Basin: Price of Cabagges
0 2 4 6 8 10 12
1
3
5
7
9
11
Various Farms
Price (Kenya shillings)
Figure 3.3: Mara River Basin: Yields of Cabbages, 2005
01000020000300004000050000600007000080000
1 2 3 4 5 6 7 8 9 10 11 12Farms
Yie
lds
or Y
ield
s pe
r Acr
e (K
ilogr
ams)
Yield Yield/Acre

Cost Benefit Analysis of Various Crops grown in the Mara River Basin
9
3.2 Onions Production Table 3.2: Current and Simulated Gross Margins for Onions Production
Kg/Acre 2004 Modal Average
Land Preparation Ploughing 2500 3005 Harrowing 1500 1300
Seeds 900 900 Fertilisers
DAP 900 1000
Chemicals 500 300 Labour Requirements
Planting 3000 1800 Weeding 3000 2800 Spraying 200 200
Harvesting 2000 2100 Working Capital 20% interest
2900 2681
Total Variable
Costs 17400 16086
Yield in kilograms 800 745 Price Kshs per bag 20 15.50
Gross Output 16000 11547.5
Gross margin -1400 -4538.5
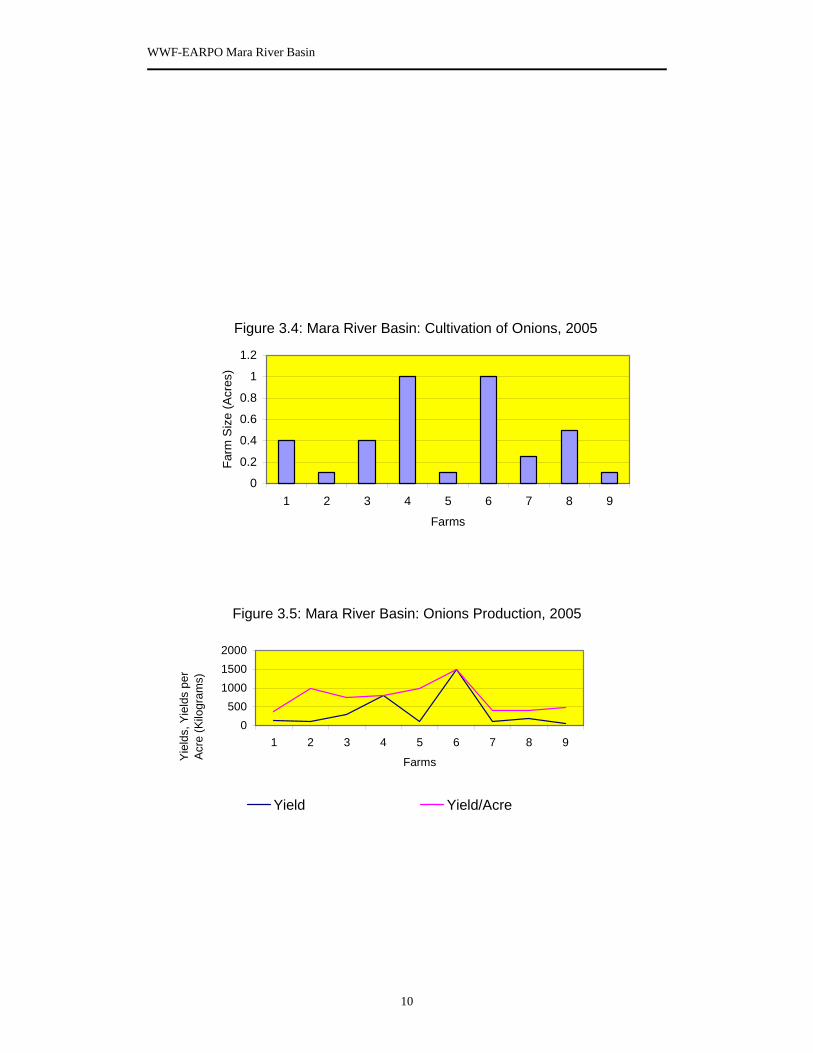
The average farm size is 0.43 acres per farmer. When the opportunity cost of capital is included in the gross margin estimates,
onion production is unprofitable. On average the losses incurred in onions production are much higher, unless
higher prices are obtained in the market.
WWF-EARPO Mara River Basin
10
Figure 3.4: Mara River Basin: Cultivation of Onions, 2005
0
0.2
0.4
0.6
0.8
1
1.2
1 2 3 4 5 6 7 8 9
Farms
Farm
Siz
e (A
cres
)
Figure 3.5: Mara River Basin: Onions Production, 2005
0500
100015002000
1 2 3 4 5 6 7 8 9
FarmsYiel
ds, Y
ield
s pe
r Ac
re (K
ilogr
ams)
Yield Yield/Acre

Cost Benefit Analysis of Various Crops grown in the Mara River Basin
11
3.3 Tomatoes Production Table 3.3: Current Gross Margins for Tomatoes Production
Trays/Acre 2004 Modal Average
Land Preparation Ploughing 3000 2500 Harrowing 1200 160
Seeds 500 300 DAP 1500 800
Chemicals 800 2000 Labour Requirements
Planting 1200 1170 Spraying 1200 1600 Weeding 1500 700
Harvesting 2000 1300 Irrigation
Fuel 3000 1600 Labour 1800 600 Water
Packaging 800 800 Transport
To storage 100 100 Market 2500 2500 Inputs 100 100
Working Capital 20% interest
4240 3246
Total Variable
Costs 25440 19476
Yield in Trays 170 118 Price Kshs per
Tray 600 587
Gross Output 102000 69266
Gross margin 76560 49790
The average farm size is 0.43 acres per farmer. Tomatoes appear to be a very profitable crop for the farmer with gross margin
averaging Kshs. 49790 per acre.
The typical farmer has a gross margin of Kshs. 76560 per acre.

WWF-EARPO Mara River Basin
12
Figure 3.6: Mara River Basin: Cultivation of Tomatoes, 2005
0
0.5
1
1.5
2
2.5
1 2 3 4 5 6 7 8 9 10 11 12 13 14 15 16 17
Farms
Farm
Siz
e (A
crea
ge)
Figure 3.7: Mara River Basin: Tomatoes Production, 2005
0
50
100
150
200
250
300
1 2 3 4 5 6 7 8 9 10 11 12 13 14 15 16 17
Farms
Yie
ld a
nd Y
ield
s pe
r Acr
e (T
rays
)
Yield Yield/Acre

Cost Benefit Analysis of Various Crops grown in the Mara River Basin
13
3.4 Maize Production Table 3.4: Current Gross Margins for Maize Production
(90kg) Bags/Acre 2004
Modal Average Land Preparation
Ploughing 3000 2500 Harrowing 900 300
Seeds 1250 1200 DAP 1700 1000
Chemicals 100 100 Labour Requirements
Planting 1200 800 Weeding 2000 2000
Harvesting 1000 800 Shelling 900 600 Drying 500 500
Transport Input 300 300 Store 900 400
Market 500 600 Working Capital 20% interest
2850 2220
Total Variable Costs
17100 11100
Yield in bags (90kg)
20 14
Price Kshs per bag
1400 1300
Gross Output 28000 18200 Gross margin 10900 4880
The average size of maize farms is 3.70 acres per farmer. The average gross margin for maize is a mere kshs 4880 per acre.
For most of the farmers the gross margin is Kshs 10900 per acre.

WWF-EARPO Mara River Basin
14
Figure 3.8: Mara River Basin: The Distrubtion of Maize Acreage
0
5
10
15
20
25
1 5 9 13 17 21 25 29 33 37 41 45 49 53 57 61 65 69 73 77 81
Farms
Farm
Siz
e (A
cres
)
Figure 3.9: Mara River Basin: Maize Yields, 2005
0
50
100
150
200
250
300
350
400
450
1 5 9 13 17 21 25 29 33 37 41 45 49 53 57 61 65 69 73 77 81Farms
Yie
lds
and
Yie
ld p
er A
cre
(90
Kilo
gram
s ba
gs)
Yield Yield/Acre

Cost Benefit Analysis of Various Crops grown in the Mara River Basin
15
3.5 Wheat Production Table 3.5: Current Gross Margins for Wheat Production
2004 Modal Average
Land Preparation Ploughing 2500 2300 Harrowing 2000 1600
Seeds 2100 1800 Fertilizers
DAP 1700 700 MAP 1700 800
Agro-Chemicals Tilt 1500 400
Folcur 700 100 2,4,D 350 50
Foliar Feed 200 50
Labour Requirements
Planting 1300 1200 Spraying 400 500
Harvesting 1200 1250 Drying 300 50
Transport Inputs 900 900 Store 1000 400
Market 1000 400 Working Capital
20% interest 3770 2500
Total Variable
Costs 17380 15000
Yield in bags (90kg)
20 16
Price Kshs per bag
2000 1900
Gross Output 40000 30400
Gross margin 17380 15400
The average farm size is 9000 and 20 for large scale and small scale farmers respectively.

WWF-EARPO Mara River Basin
16
The average gross margin for wheat production in the Mara basin is Kshs 15400 per acre.
Most farmers have a margin of Kshs 17380 per acre.
Figure 3.10: The Distribution of Wheat Farms in the Mara River Basin (Acres) 2005
9030100200300607020
9200
9000
1323535
10
10
40
2
2
40
10
5
119
Figure 3.11: Patterns of Wheat Yields per Acre in the Mara River Basin, 2005
0
5
10
15
20
25
1 2 3 4 5 6 7 8 9 10 11 12 13 14 15 16 17 18 19 20 21 22 23
Farms
Yie
lds p
er A
cre
(90
kg b
ags)

Cost Benefit Analysis of Various Crops grown in the Mara River Basin
17
3.6 Livestock Dairy Activities Livestock farming is an important economic activity amongst the Masai. The main
livestock reared is the zebu cattle, small East African goats and red Maasai hair sheep.
Dairy farming is limited to high potential areas where the mean annual rainfall is
1000mm. In 1992, it was estimated that there were 853,000 cattle and 1,676,000
goats/sheep in the district (JICA, 1992). Narok District has a potential capacity of
387,726 stock units, which during normal years is exceeded three times. Estimates put
the number of livestock units to be 511,000 in 1990 and 613,000 in 2000. These
estimates were affected by the 1999/2000 drought in which an estimated 40% of the
livestock ought to have died due to drought. Most cattle that survived were drawn to
the highlands and some sent south into Tanzania. The livestock water demand in Mara
River catchment has been estimated as 159.11 m3/year in 1990, 190.31m3/year in
2000 and rising to 227.68m3/year in 2010 (JICA, 1992, p. T84). Over-stocking causes
acute wildlife-human conflicts and soil degradation (Krhoda, undated).
Table 3.6: Livestock production and land
carrying capacity Division Area km2 Land carrying
capacity Osupuko 5,469 7.8 Ololunga 3,966 8.75 Ilmotiok 952 52.56 Central 538 8.5 Olokurto 1,365 45.4 Mau 2,838 24.7 Source: Narok District Development Plan,. Ministry of Planning, Nairobi A certain amount of cultivation is carried out in Group Ranches especially along the
water courses and swamps. Individual ranches average about 900 ha. In addition there
are individual small scale mixed farm holdings.
Table 3.6 shows land carrying capacities of divisions in Narok. Land carrying capacities in Lolgorian and Kirindoni is 58 and 123 respectively. More than two-thirds of the catchment is rangeland. There are nearly 200 registered group ranches in Narok district. The Group Ranches vary in size from 1,500 to 16,000 ha. and they are not properly managed.
WWF-EARPO Mara River Basin
18
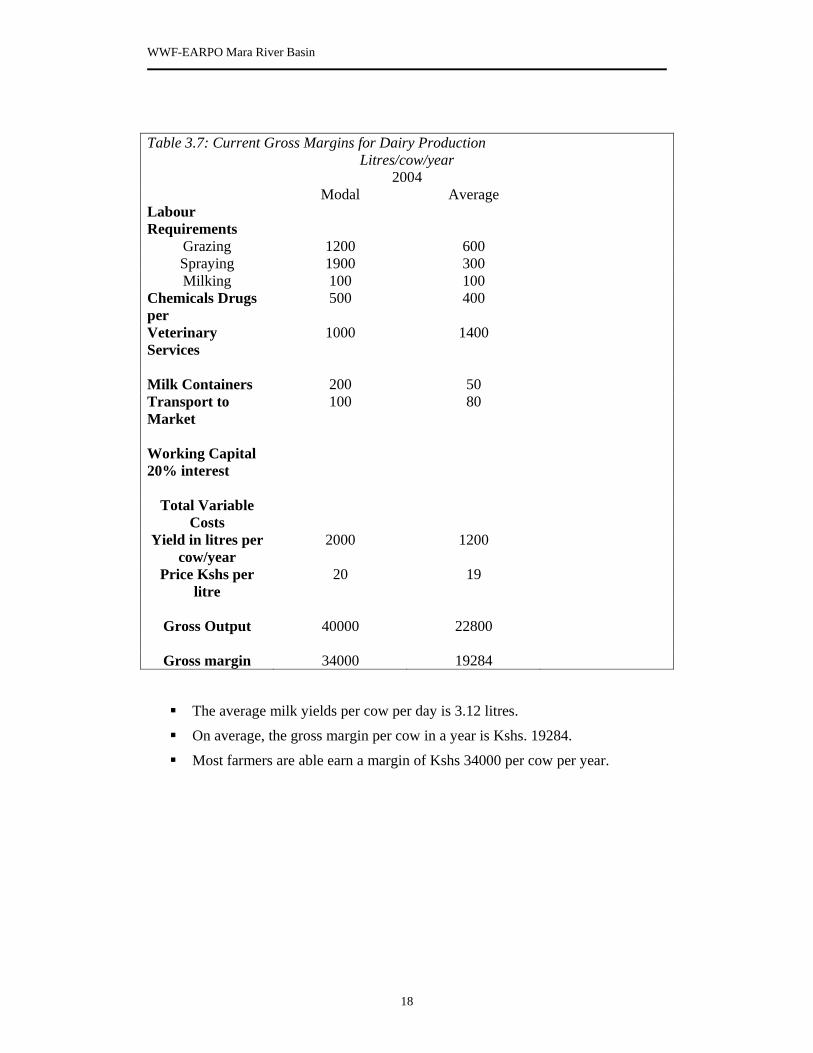
Table 3.7: Current Gross Margins for Dairy Production
Litres/cow/year 2004 Modal Average
Labour Requirements
Grazing 1200 600 Spraying 1900 300 Milking 100 100
Chemicals Drugs per
500 400
Veterinary Services
1000 1400
Milk Containers 200 50 Transport to Market
100 80
Working Capital 20% interest
Total Variable
Costs
Yield in litres per cow/year
2000 1200
Price Kshs per litre
20 19
Gross Output 40000 22800
Gross margin 34000 19284
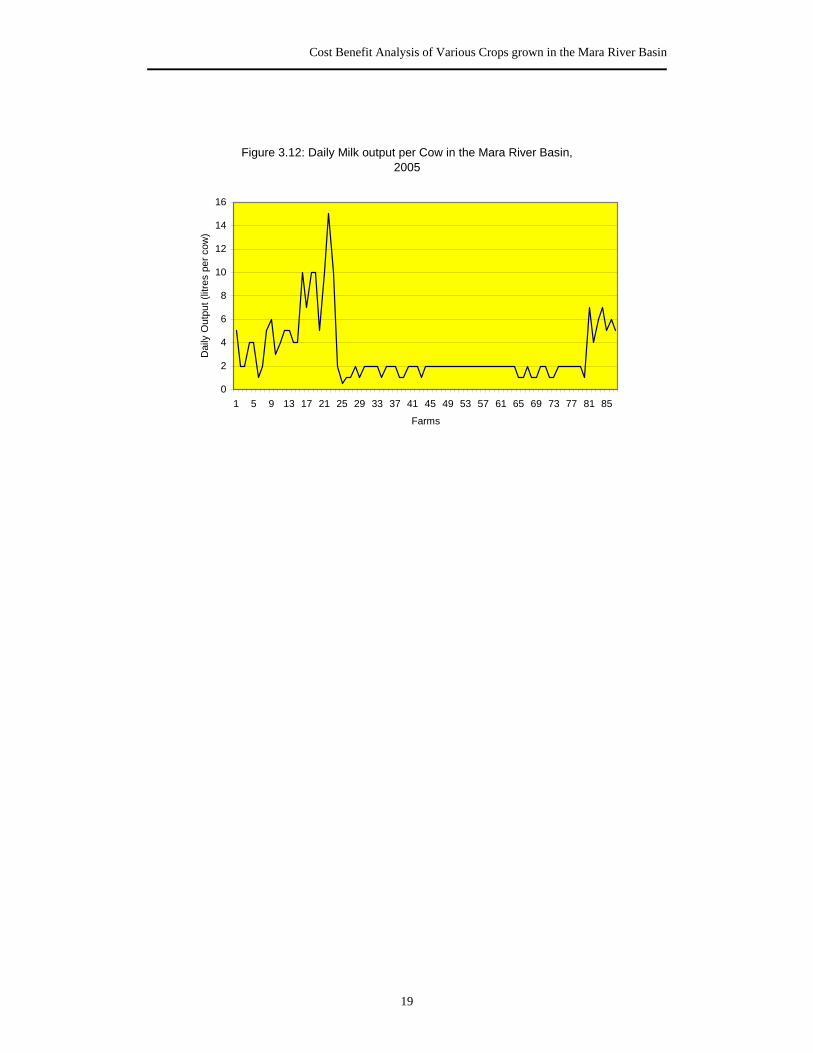
The average milk yields per cow per day is 3.12 litres.
On average, the gross margin per cow in a year is Kshs. 19284.
Most farmers are able earn a margin of Kshs 34000 per cow per year.
Cost Benefit Analysis of Various Crops grown in the Mara River Basin
19
Figure 3.12: Daily Milk output per Cow in the Mara River Basin, 2005
0
2
4
6
8
10
12
14
16
1 5 9 13 17 21 25 29 33 37 41 45 49 53 57 61 65 69 73 77 81 85
Farms
Dai
ly O
utpu
t (lit
res
per c
ow)

WWF-EARPO Mara River Basin
20
4.0 Implications of Gross Margins on Water Resources Management in the Mara River Basin.
In a recent study of the hydrology of the Mara River Basin Catchment (Krhoda), a
description is undertaken of the river basin and river channel characteristics
elucidating water quality characteristics with the aim of making recommendations for
project development. The study established relationships between the various land use
activities and the hydrology of the River Mara. Our analysis of the crops
recommended to the Mara River Water User’s Association takes the findings of this
study into account.
4.1 Profitability of Various Crops
Table 4.1 Ranking Profitability of Various Activities
Activity Modal Gross Margin
Average Gross Margin
Rank
Cabbages per acre 202510 147994 1
Onions per acre -1400 -4539 6
Tomatoes per acre 76560 49790 2
Maize per acre 10900 4880 6
Wheat per acre 17380 15400 4
Dairy Production
per cow/year
34000 19284 3
On the basis of the above findings, it would appear that currently:
• Production of cabbages is the most viable activity, followed by Tomatoes, and
Dairy production.
• Onions production is not profitable and could be discouraged since farmers are
loosing money by engaging the activity.
• As graphical illustrations show (figure 3.11), wheat production has varying
profitability with larger farms tending to perform better.

Cost Benefit Analysis of Various Crops grown in the Mara River Basin
21
4.2 The Water Resource Base
4.2.1 Drainage network
The drainage network is a reflection of type and arrangements of the bedrock units in
the basin. Mara River is composed of five tributaries of which Rivers Nyangores and
Amala are its main tributaries. These tributaries originate in the upper part of the
basin at an altitude of about 3,000m. above mean sea level. In this upper part of the
basin the stream network are parallel pinnate, linear with numerous first order
streams, reflecting long parallel ridges. The streams trend in a northeast to southwest
direction following the general slope of lava flow and reflect the youthful nature of
the landscape. Parallel pinnate river networks are found mainly on recently formed
volcanic areas. The short tributaries drain the flanks of the ridges while the long
segments drain the troughs between (Krhoda, undated).
Further south, Engare Engito River originating from the Ilmotyoo-Koit Ap Soyet
ridges on the east joins the Amala River along fairly settled portion of the Mara
Catchment Basin. The ridges here are at 1348m. above mean sea level and divides
River Ewaso Ngiro South from Mara River Basin. The Mara River basin is widest at
the plains and narrowest at Mara Camp. River Talek, probably the original Mara
drainage system on an old geological formation, runs in an east-west direction and
joins the Mara within the Mara Game Reserve. Several tributaries of Talek River
drain the extension of Loita Hills. Sand River, the last of the major tributaries, joins
the Mara at the Kenya-Tanzania border (Krhoda, undated)..
Table 4.2: Characteristics of the
Tributaries of Mara River
River tributary Long profile(km)
Stream gradient
Nyangores 97 0.0136 Amala 94 0.014 Talek 38 0.012 Engare Engobit 27 0.014 Sand River
Unlike Nyangores and Amala, River Talek and Sand River have dendritic drainage patterns; they demonstrate a drainage network on flat-lying eroded massive crystalline rock of uniform resistance, which has been deeply weathered. The rivers meander in their wide valleys.

WWF-EARPO Mara River Basin
22
Table 1 shows the average stream gradients of the major tributaries of the Mara River
Basin. Their gradient range from 0.012 and 0.14, reflecting the potential velocity
during the average flows. The lower part of Mara River, Talek and Sand rivers flow
over mature and eroded landscapes. Unlike most rivers draining into Lake Victoria,
the Mara River and its tributaries do not have any falls or rapids along their courses.
Strahler’s method of stream ordering provides quantitative method for analyzing
drainage network. The outermost streams constitute stream order ones. Where a
stream order one joins another of the same order stream order two is designated.
Whenever stream order number two joins another of the same stream order, a stream
order three is designated. Table 4.2 shows the stream order and the number of streams
for each tributary of the Mara River (Krhoda, undated)..
Table 4.3: Stream orders for various tributaries of Mara River Basin
Stream Order
Number of streams
Nyangores Amala Talek Engare Engobit
Sand River
1 106 102 176 15 140 2 40 55 71 7 41 3 20 11 41 1 10 4 1 18 6 1 5 1 1 6 1
Streams of order one, through headward erosion, cut extend the long profile of the
river into the watershed. These are mainly rivulets that collect water rapidly from the
drainage divide and route the discharge downstream. As streams of order one join
another the volume of water in the channel increases and the channel width increases
also.
The ratio of stream order one to stream order two are 1:2. For Rivers Nyangores and
Amala the ratio of the highest stream order to the next highest, respectively, are 1:20
and 1:18 as compared to Rivers Talek and Engare Engobit’s 1:6 and 1:7. Rivers Talek

Cost Benefit Analysis of Various Crops grown in the Mara River Basin
23
and Engare Engobit and Sand River flow over mature landscapes as compared to
Rivers Amala and Nyangores.
Table4.4: Water balance for Mara River Basin
mm (p.a) Percent Rainfall 1800 -500 100 Actual evapotranspiration 1400-1800 78-100 Change in groundwater storage
negligible negligible
Change in soil moisture storage
negligible negligible
Surface runoff 36.97 3.64
4.3 Water use
There are 10 water supply schemes, extracting water from rivers, operated by the
Water Department, 17 boreholes, 9 dams and ponds (1992), which serve the
population and livestock. Table 14 shows types of management of water supply in
Narok district.

WWF-EARPO Mara River Basin
24
Table 4.5: Water supply by managing
authority in Narok District
Community 18 NGOS 1 Local Authority 1 Donors 1 TOTAL 29
Source: JICA, 1992, p.DT.7
The average projected domestic and industrial water demand for Narok district range
from 107l/c/d to 109l/c/d (JICA, 1992, p. DT.22-DT.24). From these calculations, the
water demand by the year 2010 will be 31,929m3 per year while the water available
will be 21,750m3/day from surface and 10,179 m3/day from groundwater sources
(JICA, 1992, DT.37).
Table 4.6: Estimated of Water Demand (M3/day)
Year Population Rural Urban Stock Industrial Total 1990 407,099 10,715 2,530 32,127 228 45,600 2000 644,338 19,472 8,559 44,700 422 73,153 2010 840,605 31,929 16,903 54,809 606 104,247 Source: JICA, 1992, (p. D.2.30, D.2.72 and D.2.144). Settlements have occurred along wildlife corridor and dispersal areas. The great
migratory patters of the wildebeest, buffaloes, elephants, lion, etc. have been
disrupted by settlements. After the long rains the animals migrate towards the north
into group ranches and southwards into Serengeti National Park in Tanzania. The
animals return to the reserve during the dry season.
Narok town suffers from water deficit at present
and the volume of deficit is expected to increase
in future. Upper Narok Dam supplies Narok
town with the water for meeting the deficit.

Cost Benefit Analysis of Various Crops grown in the Mara River Basin
25
5.0 References Binge, F.W. 1962.Geology of the Kericho area, Ministry of Natural resources,
Geological Survey of Kenya, Report No. 50, Government Printer Nairobi. Darlrymple, T. 1960. Flood-frequency analyses: Manual of Hydrology, Part 3, Flood
flow techniques, USGS Water Supply Paper 1543-a. Egerton University. Policy Analysis Matrix. Proceedings of the Conference on
Towards 2000: Improving Agricultural Performance. JICA 1992.The study of the National Water Master Plan, Sectoral report (D),
Domestic and industrial water supply, JICA, January 1992. JICA 1992.The study of the National Water Master Plan, Sectoral report (A), Socio-
economy, JICA, January 1992. JICA 1992.The study of the National Water Master Plan, Data Book (DB.3),
Groundwater data, JICA, 1992. JICA 1992.The study of the National Water Master Plan, Sectoral Report (E),
Agriculture and irrigation, JICA, July 1992. JICA 1992.The study of the National Water Master Plan, Main Report Vol. 1, Water
Resources development and use plan towards 2010, JICA, January 1992. Krhoda, G.O. The impact of deforestation on the hydrology of watersheds, Kenya
Forest Master Plan, Consultancy report for KIFCON, 188. Krhoda, G.O. 1988. The impact of resource utilization on the hydrology of the Mau
Hills Forest in Kenya, Mountain Research and Development, vol. 8, nos. 2/3, pp.193-200.
Krhoda, G.O. Mara River Catchment Basin Initiative. Preliminary Phase: Project
Development and Stakeholders Analysis – The Hydrology of Mara River. Ohayo-Mitoko, G.A. 1996.Occupational pesticide exposure among Kenyan
agricultural workers: An epidemiological and public health perspective, The Netherlands.
Partow, H. 1995. Pesticide use and management in Kenya. Williams, L.A.J. 1964. Geology of the Mara River-Sianna Area, Ministry of Natural
resources, geological Survey of Kenya, report no. 66, Government Printer, Nairobi


![[Business Report] - Evans Winanda Wirgaevansww.staff.gunadarma.ac.id/Downloads/files/63408/...Pricing and gross margin targets – Define your pricing structure, gross margin levels,](https://img.pdfslide.us/doc/110x75/6094e5eb954f1728c65018f7/business-report-evans-winanda-pricing-and-gross-margin-targets-a-define.jpg)