Embed Size (px)
Citation preview
National Center for Immunization & Respiratory Diseases
U.S. Influenza Surveillance and Vaccine Effectiveness Update
Lisa Grohskopf, MD, MPH FDA Vaccines and Related Biologic Products Advisory Committee Meeting March 9, 2017

U.S. INFLUENZA SURVEILLANCE
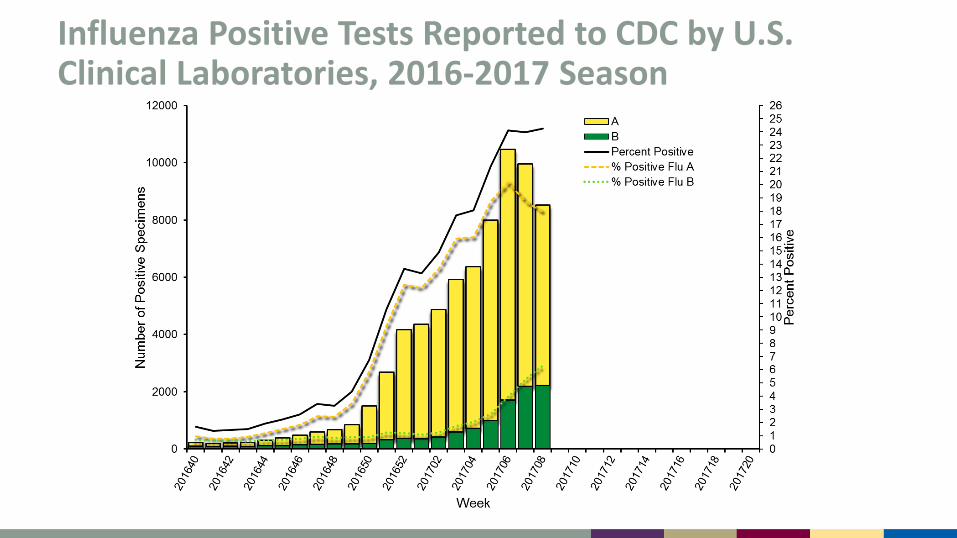
Influenza Positive Tests Reported to CDC by U.S. Clinical Laboratories, 2016-2017 Season
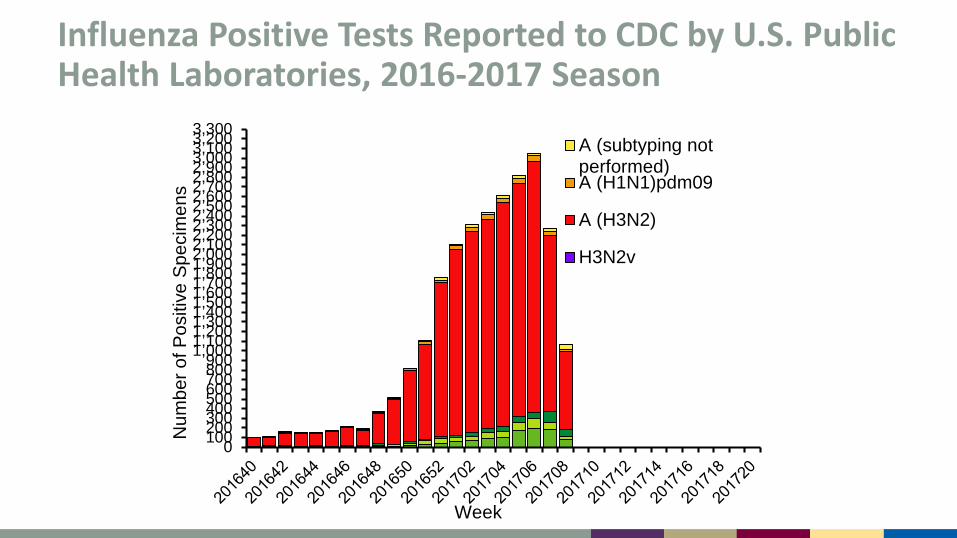
Influenza Positive Tests Reported to CDC by U.S. Public Health Laboratories, 2016-2017 Season
01002003004005006007008009001,0001,1001,2001,3001,4001,5001,6001,7001,8001,9002,0002,1002,2002,3002,4002,5002,6002,7002,8002,9003,0003,1003,2003,300
Num
ber o
f Pos
itive
Spe
cim
ens
Week
A (subtyping notperformed)A (H1N1)pdm09
A (H3N2)
H3N2v
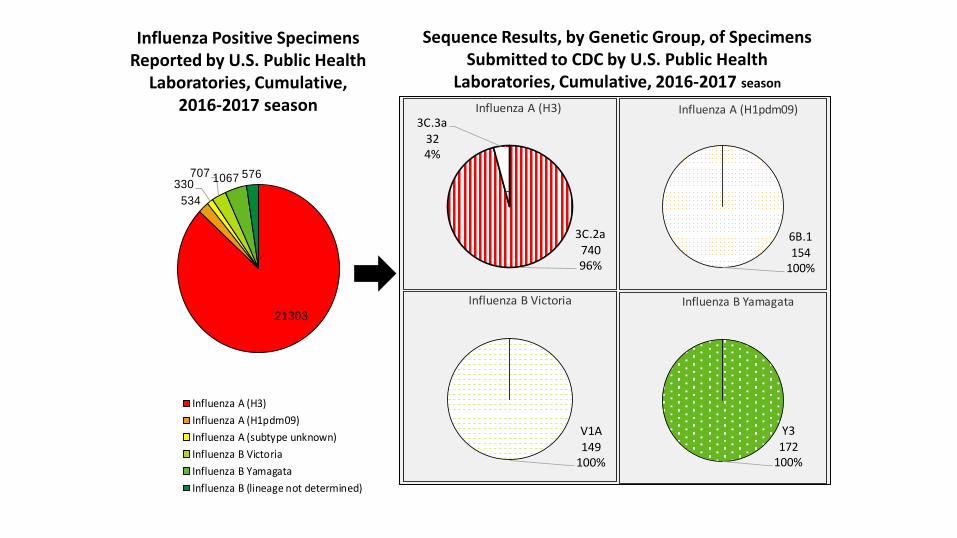
Sequence Results, by Genetic Group, of Specimens Submitted to CDC by U.S. Public Health
Laboratories, Cumulative, 2016-2017 season
Influenza Positive Specimens Reported by U.S. Public Health
Laboratories, Cumulative, 2016-2017 season
3C.2a74096%
3C.3a324%
Influenza A (H3)
6B.1154
100%
Influenza A (H1pdm09)
Y3172
100%
Influenza B Yamagata
V1A149
100%
Influenza B Victoria21303
534330
707 1067 576
Influenza A (H3)Influenza A (H1pdm09)Influenza A (subtype unknown)Influenza B VictoriaInfluenza B YamagataInfluenza B (lineage not determined)
Antigenic Characterization of U.S. Influenza Viruses Collected October 1, 2016 to Present A (H1N1)pdm09: all 112 viruses antigenically characterized using ferret
post-infection antisera are A/California/07/2009-like, the H1N1 component of the 2016-17 vaccine
A(H3N2): 387 of 399 (97%) were antigenically characterized as A/Hong Kong/4801/2014-like, the H3N2 component of the 2016-17 vaccine
B/Victoria linage: 123 of 134 (92%) were antigenically characterized as B/Brisbane/60/2008-like, which is included in both quadrivalent and trivalent influenza vaccines for the 2016-17 season
B/Yamagata lineage: All 121 were antigenically characterized as B/Phuket/3073/2013-like, an influenza B virus included in the quadrivalent influenza vaccines for the 2016-17 season
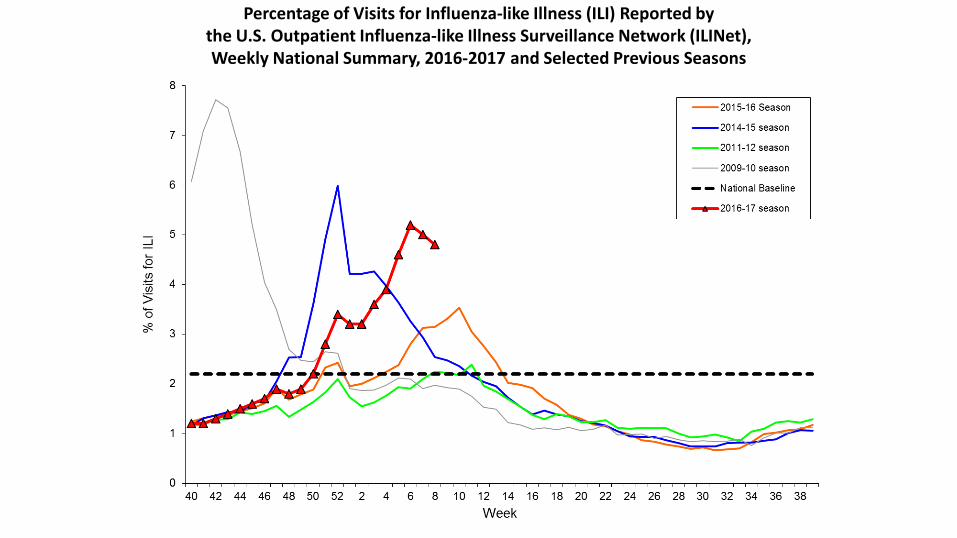
Percentage of Visits for Influenza-like Illness (ILI) Reported by the U.S. Outpatient Influenza-like Illness Surveillance Network (ILINet), Weekly National Summary, 2016-2017 and Selected Previous Seasons

Epidemic Threshold
Seasonal Baseline
Pneumonia and Influenza Mortality from the National Center for Health Statistics Mortality Surveillance System
Data through the week ending February 11, 2017, as of March 2, 2017
2012
2013
2014
2015
2016
2017
Deaths Reported Current Week Deaths Reported Previous Week
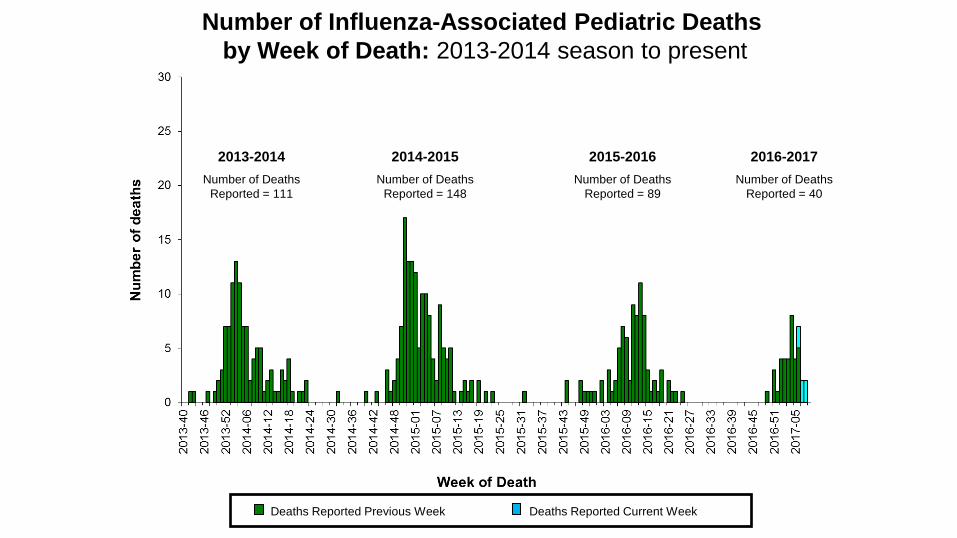
Number of Influenza-Associated Pediatric Deaths by Week of Death: 2013-2014 season to present
2013-2014 Number of Deaths
Reported = 111
2014-2015 Number of Deaths
Reported = 148
2015-2016 Number of Deaths
Reported = 89
2016-2017 Number of Deaths
Reported = 40
Summary of the U.S. Season Influenza A(H3N2) viruses have predominated during the 2016-17 season
– Influenza B activity has increased in recent weeks So far, influenza activity has been moderate, and may have peaked
nationally The circulating stains are similar to those contained in the 2016-17 vaccine
U.S. VACCINE EFFECTIVENESS--INTERIM ESTIMATES
From the U.S. Influenza Vaccine Effectiveness (U.S. Flu VE) Network Presented to the Advisory Committee on Immunization Practices (ACIP), February 22, 2017
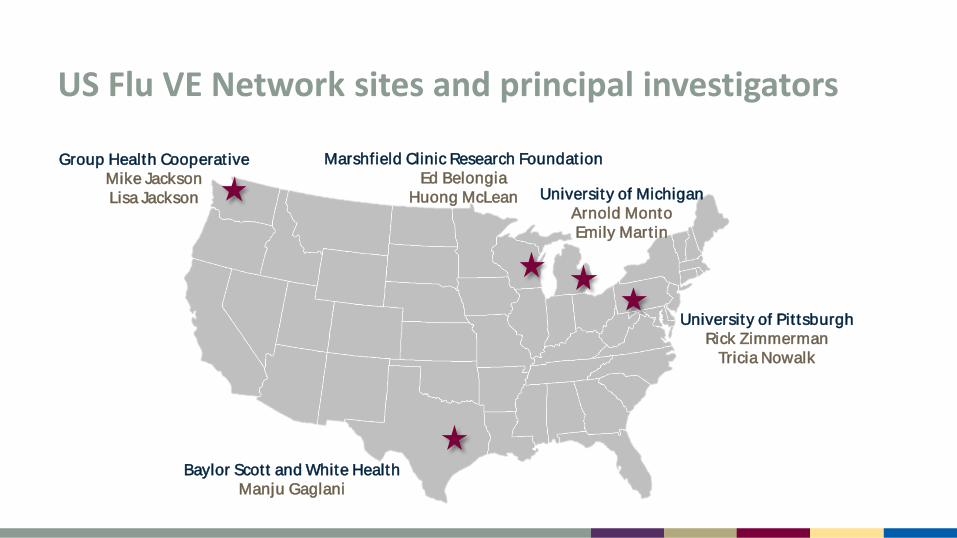
US Flu VE Network sites and principal investigators
Group Health Cooperat ive Mike Jackson Lisa Jackson
Baylor Scott and White Health Manju Gaglani
Marshfield Clinic Research Foundation Ed Belongia
Huong McLean University of Michigan Arnold Monto Emily Mart in
University of Pit tsburgh Rick Zimmerman
Tricia Nowalk
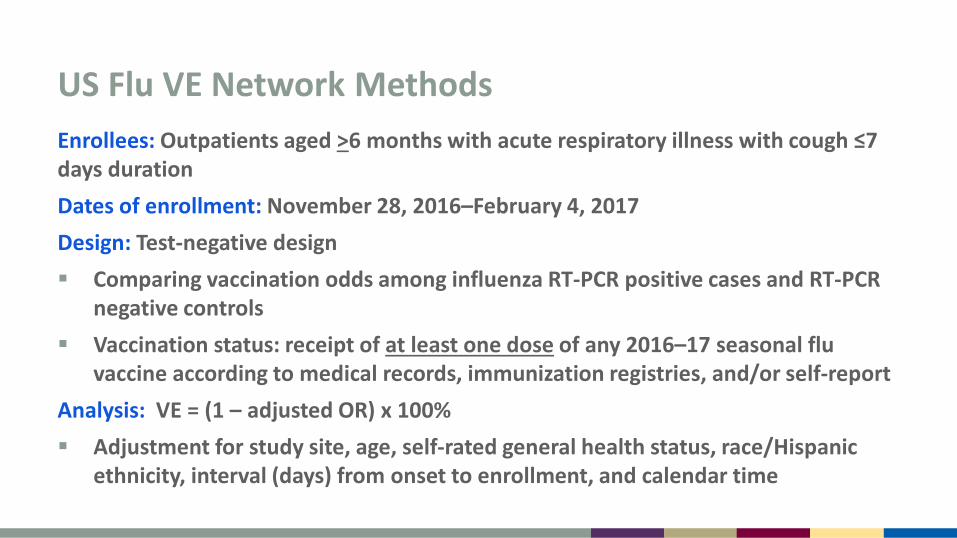
US Flu VE Network Methods Enrollees: Outpatients aged >6 months with acute respiratory illness with cough ≤7 days duration Dates of enrollment: November 28, 2016–February 4, 2017 Design: Test-negative design Comparing vaccination odds among influenza RT-PCR positive cases and RT-PCR
negative controls Vaccination status: receipt of at least one dose of any 2016–17 seasonal flu
vaccine according to medical records, immunization registries, and/or self-report Analysis: VE = (1 – adjusted OR) x 100% Adjustment for study site, age, self-rated general health status, race/Hispanic
ethnicity, interval (days) from onset to enrollment, and calendar time
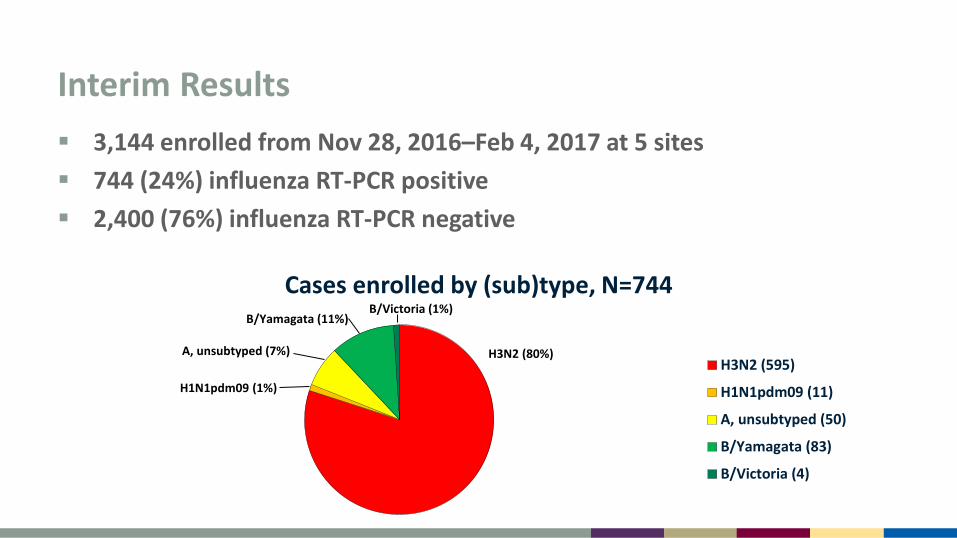
Interim Results 3,144 enrolled from Nov 28, 2016–Feb 4, 2017 at 5 sites 744 (24%) influenza RT-PCR positive 2,400 (76%) influenza RT-PCR negative
Cases enrolled by (sub)type, N=744
H3N2 (595)
H1N1pdm09 (11)
A, unsubtyped (50)
B/Yamagata (83)
B/Victoria (4)
H3N2 (80%)
B/Victoria (1%) B/Yamagata (11%)
A, unsubtyped (7%)
H1N1pdm09 (1%)
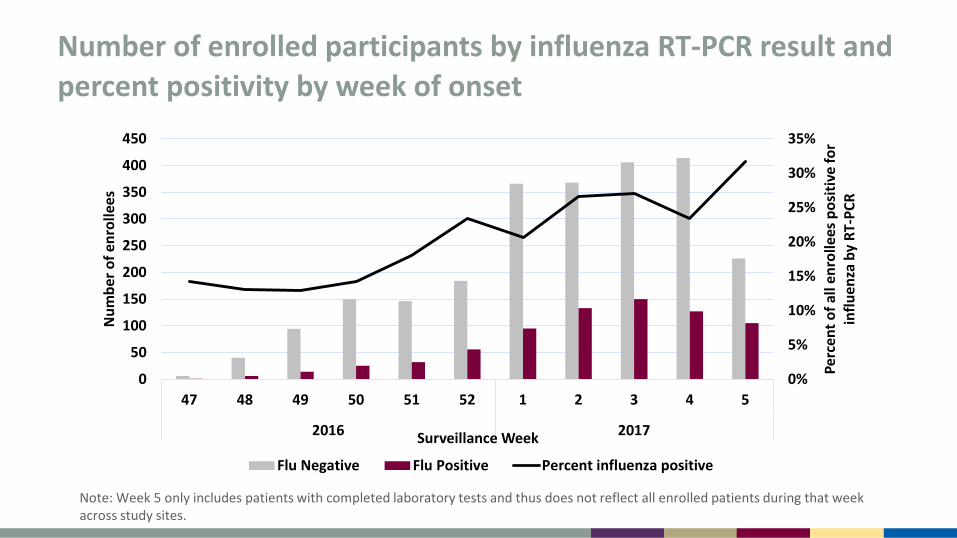
Number of enrolled participants by influenza RT-PCR result and percent positivity by week of onset
Note: Week 5 only includes patients with completed laboratory tests and thus does not reflect all enrolled patients during that week across study sites.
0%
5%
10%
15%
20%
25%
30%
35%
0
50
100
150
200
250
300
350
400
450
47 48 49 50 51 52 1 2 3 4 5
2016 2017
Perc
ent o
f all
enro
llees
pos
itive
for
influ
enza
by
RT-P
CR
Num
ber o
f enr
olle
es
Surveillance Week
Flu Negative Flu Positive Percent influenza positive
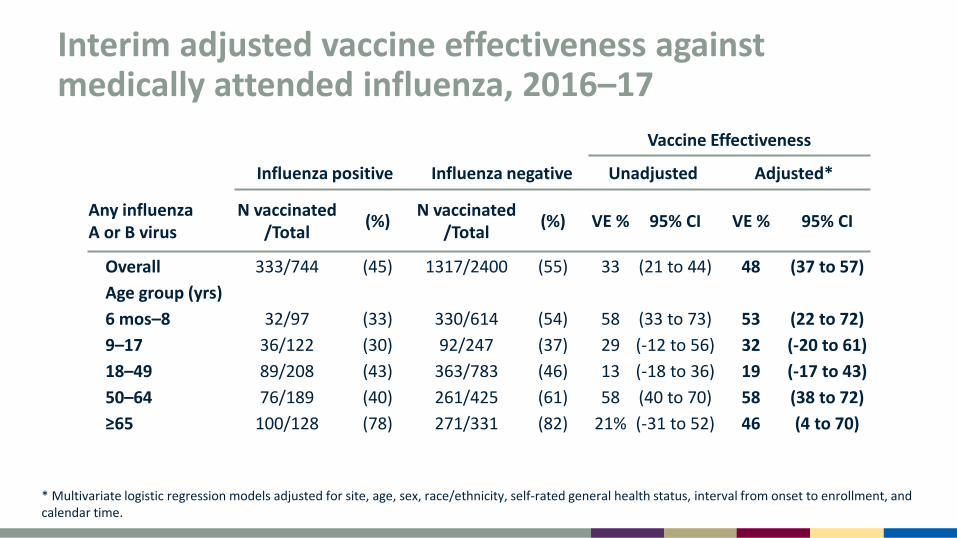
Interim adjusted vaccine effectiveness against medically attended influenza, 2016–17
Vaccine Effectiveness
Influenza positive Influenza negative Unadjusted Adjusted*
Any influenza A or B virus
N vaccinated /Total (%) N vaccinated
/Total (%) VE % 95% CI VE % 95% CI
Overall 333/744 (45) 1317/2400 (55) 33 (21 to 44) 48 (37 to 57) Age group (yrs) 6 mos–8 32/97 (33) 330/614 (54) 58 (33 to 73) 53 (22 to 72) 9–17 36/122 (30) 92/247 (37) 29 (-12 to 56) 32 (-20 to 61) 18–49 89/208 (43) 363/783 (46) 13 (-18 to 36) 19 (-17 to 43) 50–64 76/189 (40) 261/425 (61) 58 (40 to 70) 58 (38 to 72) ≥65 100/128 (78) 271/331 (82) 21% (-31 to 52) 46 (4 to 70)
* Multivariate logistic regression models adjusted for site, age, sex, race/ethnicity, self-rated general health status, interval from onset to enrollment, and calendar time.
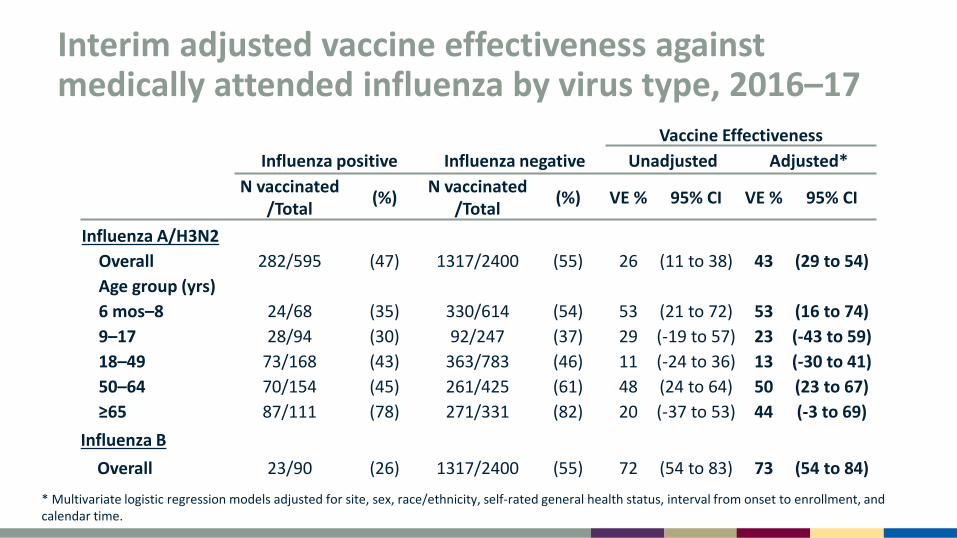
Interim adjusted vaccine effectiveness against medically attended influenza by virus type, 2016–17
Vaccine Effectiveness Influenza positive Influenza negative Unadjusted Adjusted*
N vaccinated /Total (%) N vaccinated
/Total (%) VE % 95% CI VE % 95% CI
Influenza A/H3N2 Overall 282/595 (47) 1317/2400 (55) 26 (11 to 38) 43 (29 to 54) Age group (yrs) 6 mos–8 24/68 (35) 330/614 (54) 53 (21 to 72) 53 (16 to 74) 9–17 28/94 (30) 92/247 (37) 29 (-19 to 57) 23 (-43 to 59) 18–49 73/168 (43) 363/783 (46) 11 (-24 to 36) 13 (-30 to 41) 50–64 70/154 (45) 261/425 (61) 48 (24 to 64) 50 (23 to 67) ≥65 87/111 (78) 271/331 (82) 20 (-37 to 53) 44 (-3 to 69)
Influenza B Overall 23/90 (26) 1317/2400 (55) 72 (54 to 83) 73 (54 to 84)
* Multivariate logistic regression models adjusted for site, sex, race/ethnicity, self-rated general health status, interval from onset to enrollment, and calendar time.

Summary Interim results for 2016–17 season (through February 4, 2017) indicate
vaccine effectiveness of 48% against medically attended influenza – Interim estimate similar to previous seasons when vaccine was well
matched to circulating influenza viruses Significant protection against circulating influenza A(H3N2) and B viruses
(predominantly B/Yamagata) – VE not estimated against H1N1pdm09 or B/Victoria due to small
number of cases Enrollment continues – end-of-season VE estimates may differ from
interim estimates
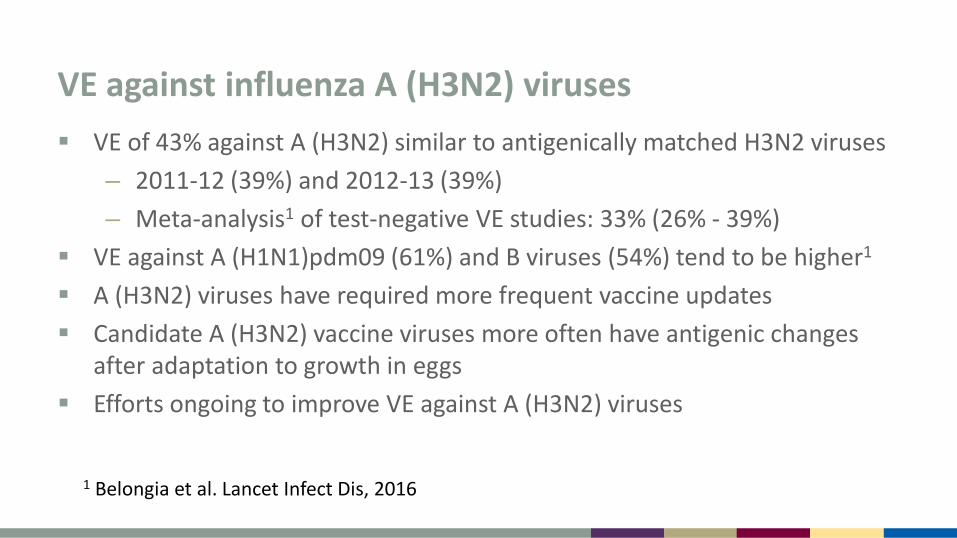
VE against influenza A (H3N2) viruses VE of 43% against A (H3N2) similar to antigenically matched H3N2 viruses
– 2011-12 (39%) and 2012-13 (39%) – Meta-analysis1 of test-negative VE studies: 33% (26% - 39%)
VE against A (H1N1)pdm09 (61%) and B viruses (54%) tend to be higher1 A (H3N2) viruses have required more frequent vaccine updates Candidate A (H3N2) vaccine viruses more often have antigenic changes
after adaptation to growth in eggs Efforts ongoing to improve VE against A (H3N2) viruses
1 Belongia et al. Lancet Infect Dis, 2016
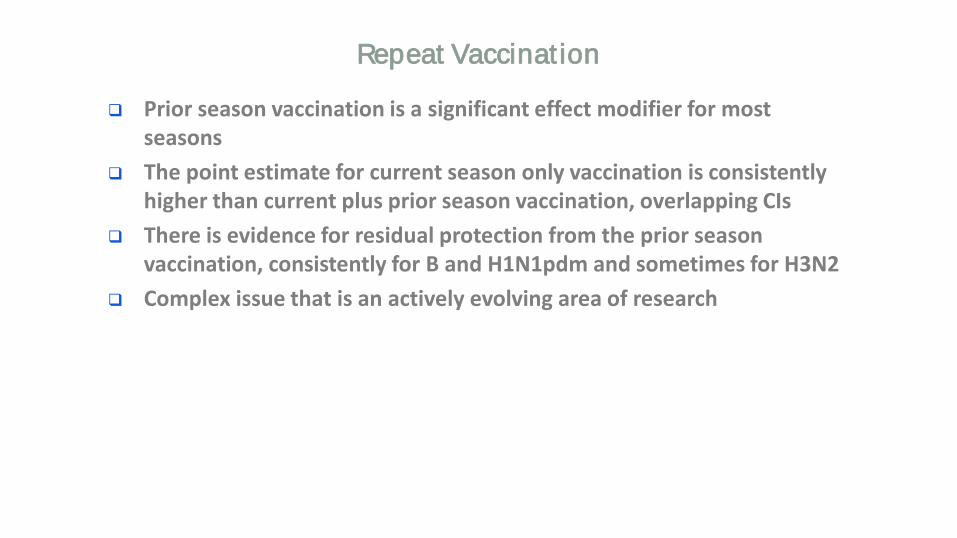
Repeat Vaccinat ion
Prior season vaccination is a significant effect modifier for most seasons
The point estimate for current season only vaccination is consistently higher than current plus prior season vaccination, overlapping CIs
There is evidence for residual protection from the prior season vaccination, consistently for B and H1N1pdm and sometimes for H3N2
Complex issue that is an actively evolving area of research
US Flu VE Network University of Michigan and Henry Ford Health System: Arnold S. Monto, Emily Martin, Joshua G. Petrie, Lois E. Lamerato, Ryan E.
Malosh, E.J. McSpadden, Hannah Segaloff, Caroline K. Cheng, Rachel Truscon, Emileigh Johnson, Anne Kaniclides, Heather R. Lipkovich, Nishat Islam, Michelle Groesbeck, Andrea Lee, Joey Lundgren, Erika Chick, Lindsey Benisatto, Tosca Le, Dexter Hobdy, Kristyn Brundidge, Christina Rincon, Stephanie Haralson, Jennifer Hessen, Ahn Trinh
Marshfield Clinic Research Foundation: Edward A. Belongia, Huong Q. McLean, Jennifer K. Meece, Jennifer P. King, Elizabeth Armagost, Deanna Cole, Terry Foss, Dyan Friemoth, Katherine Graebel-Khandakani, Linda Heeren, Tami Johnson, Tara Johnson, Nicole Kaiser, Diane Kohnhorst, Sarah Kopitzke, Ariel Marcoe, Karen McGreevey, Madalyn Minervini, Vicki Moon, Suellyn Murray, Rebecca Pilsner, DeeAnn Polacek, Emily Redmond, Miriah Rotar, Carla Rottscheit, Jacklyn Salzwedel, Samantha Smith, Sandra Strey, Jane Wesely, Lynn Ivacic, Sherri Guzinski, Jennifer Anderson, Klevi Hoxha, Tamara Kronenwetter Koepel, Nan Pan, Annie Steinmetz, Gregg Greenwald
University of Pittsburgh Schools of the Health Sciences and UPMC: Richard K. Zimmerman, Mary Patricia Nowalk, Todd M. Bear, Heather Eng, Samantha Ford, Krissy K. Moehling, Jonathan M. Raviotta, Sean Saul, Terrie Sax, Michael Susick, G.K. Balasubramani, Rina Chabra, Edward Garofolo, Philip Iozzi, Barbara Kevish, Donald B. Middleton, Christopher Olbrich, Evelyn C. Reis, Leonard Urbanski, John V. Williams, Monika Johnson
Baylor Scott and White Health, Texas A&M University Health Science Center College of Medicine: Manjusha Gaglani, Kempapura Murthy, Anne Robertson, Ashley Kossie, Michael Smith, Vanessa Hoelscher, Lydia Clipper, Kevin Dunlap, Crystal Hodges, Teresa Ponder, Ineshia Jackson, Deborah Furze, Mary Kylberg, Martha Zayed, Melissa Zdroik, Kimberley Walker, Marcus Volz, Arundhati Rao, Robert Fader, Yolanda Munoz-Maldonado, Lea Mallett, Hania Wehbe-Janek, Madhava Beeram, Michael Reis, Jennifer Thomas, Jaime Walkowiak, Jeremy Ray, Renee Day, Deborah Price, Jennifer Fox
Group Health Research Institute: Michael L. Jackson, Lisa A. Jackson, Erika Kiniry, Stacie Wellwood, C. Hallie Phillips, Suzie Park, Lawrence Madziwa, Matt Nguyen
CDC: Alicia M. Fry, Swathi N. Thaker, Sarah Spencer, LaShondra Berman, Angie Foust, Wendy Sessions, Joseph Bresee, Erin Burns, Jerome Tokars, Jackie Katz, Daniel Jernigan

Acknowledgements
Lynnette Brammer Brendan Flannery Jessie Chung Alicia Fry Lenee Blanton Alicia Budd Jill Ferdinands Natalie Kramer Krista Kniss Desiree Mustaquim Noreen Alabi

For more information, contact CDC 1-800-CDC-INFO (232-4636) TTY: 1-888-232-6348 www.cdc.gov The findings and conclusions in this report are those of the authors and do not necessarily represent the official position of the Centers for Disease Control and Prevention.